
Individual, Family, and Socioeconomic Contributors to Dental Caries in Children from Low- and Middle-Income Countries

 , , ,
, , ,  and
and
Abstract
:1. Introduction
2. Methodology
2.1. Study Variables
2.2. Search Strategy
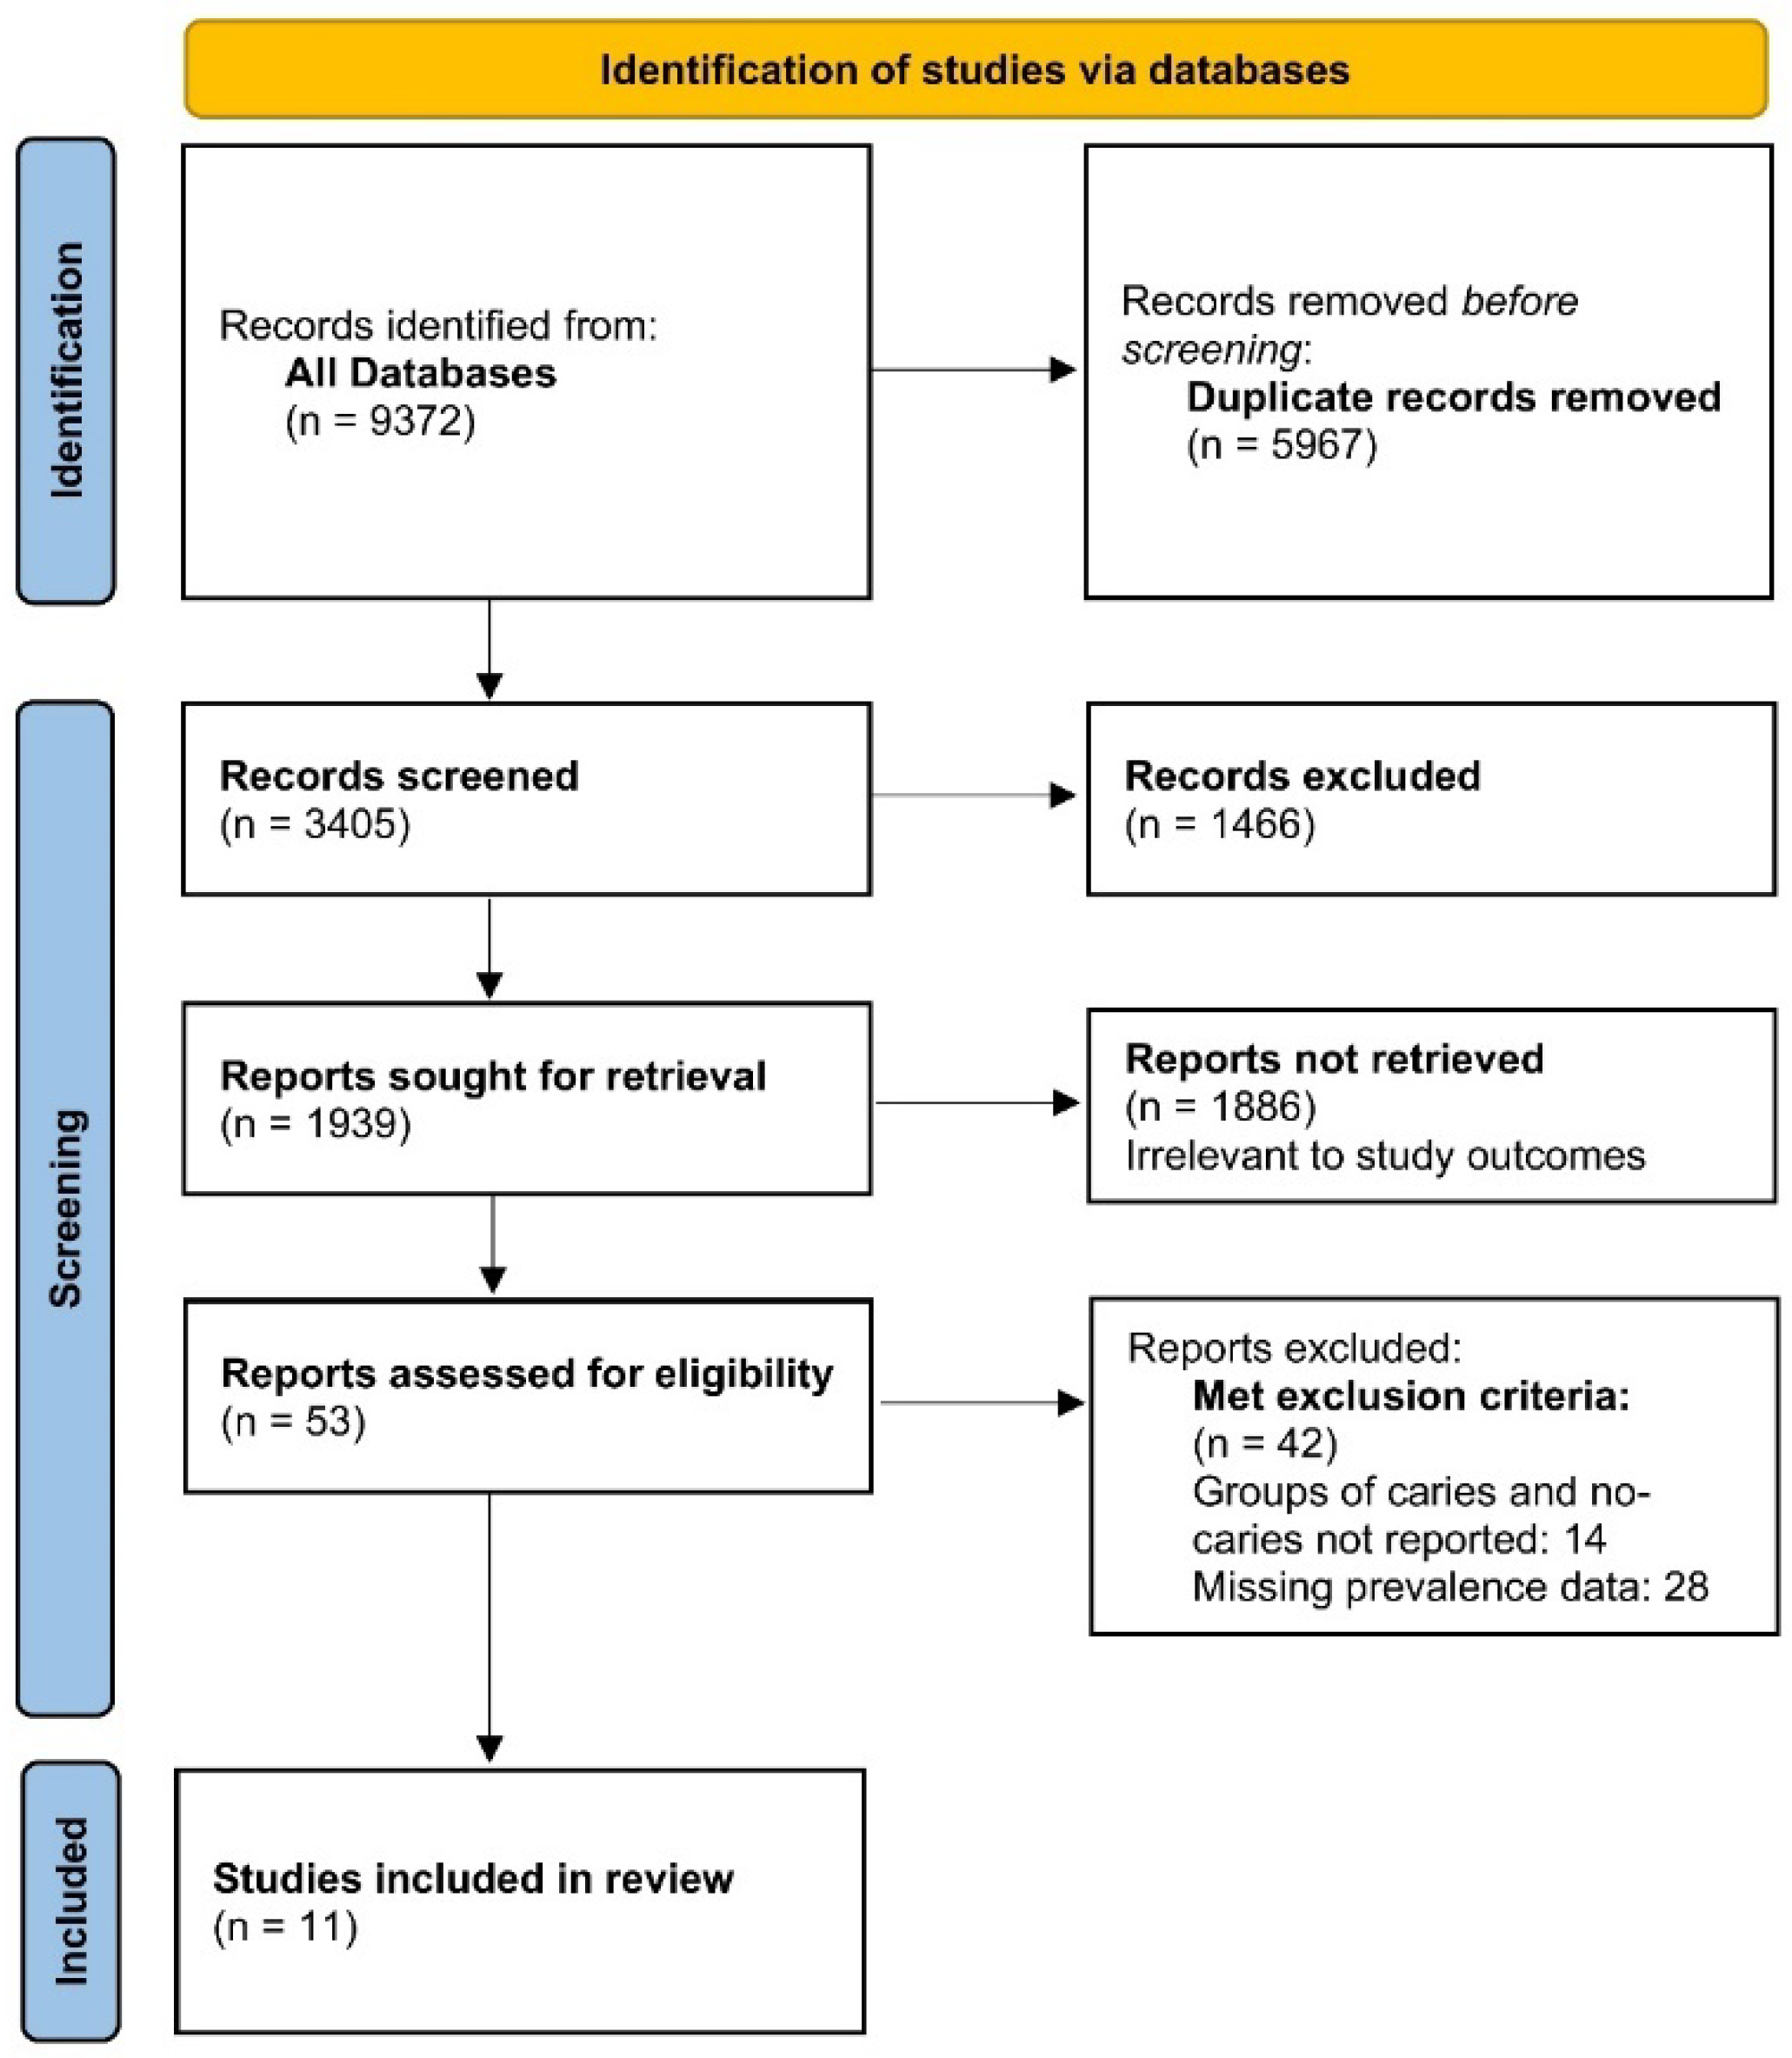
2.3. Study Selection
2.4. Data Extraction
2.5. Data Analysis
2.6. Risk of Bias Assessment
3. Results
3.1. Study Characteristics
3.2. Child-Level Characteristics
3.2.1. Gender
3.2.2. Breastfed/Bottle-Fed Patterns
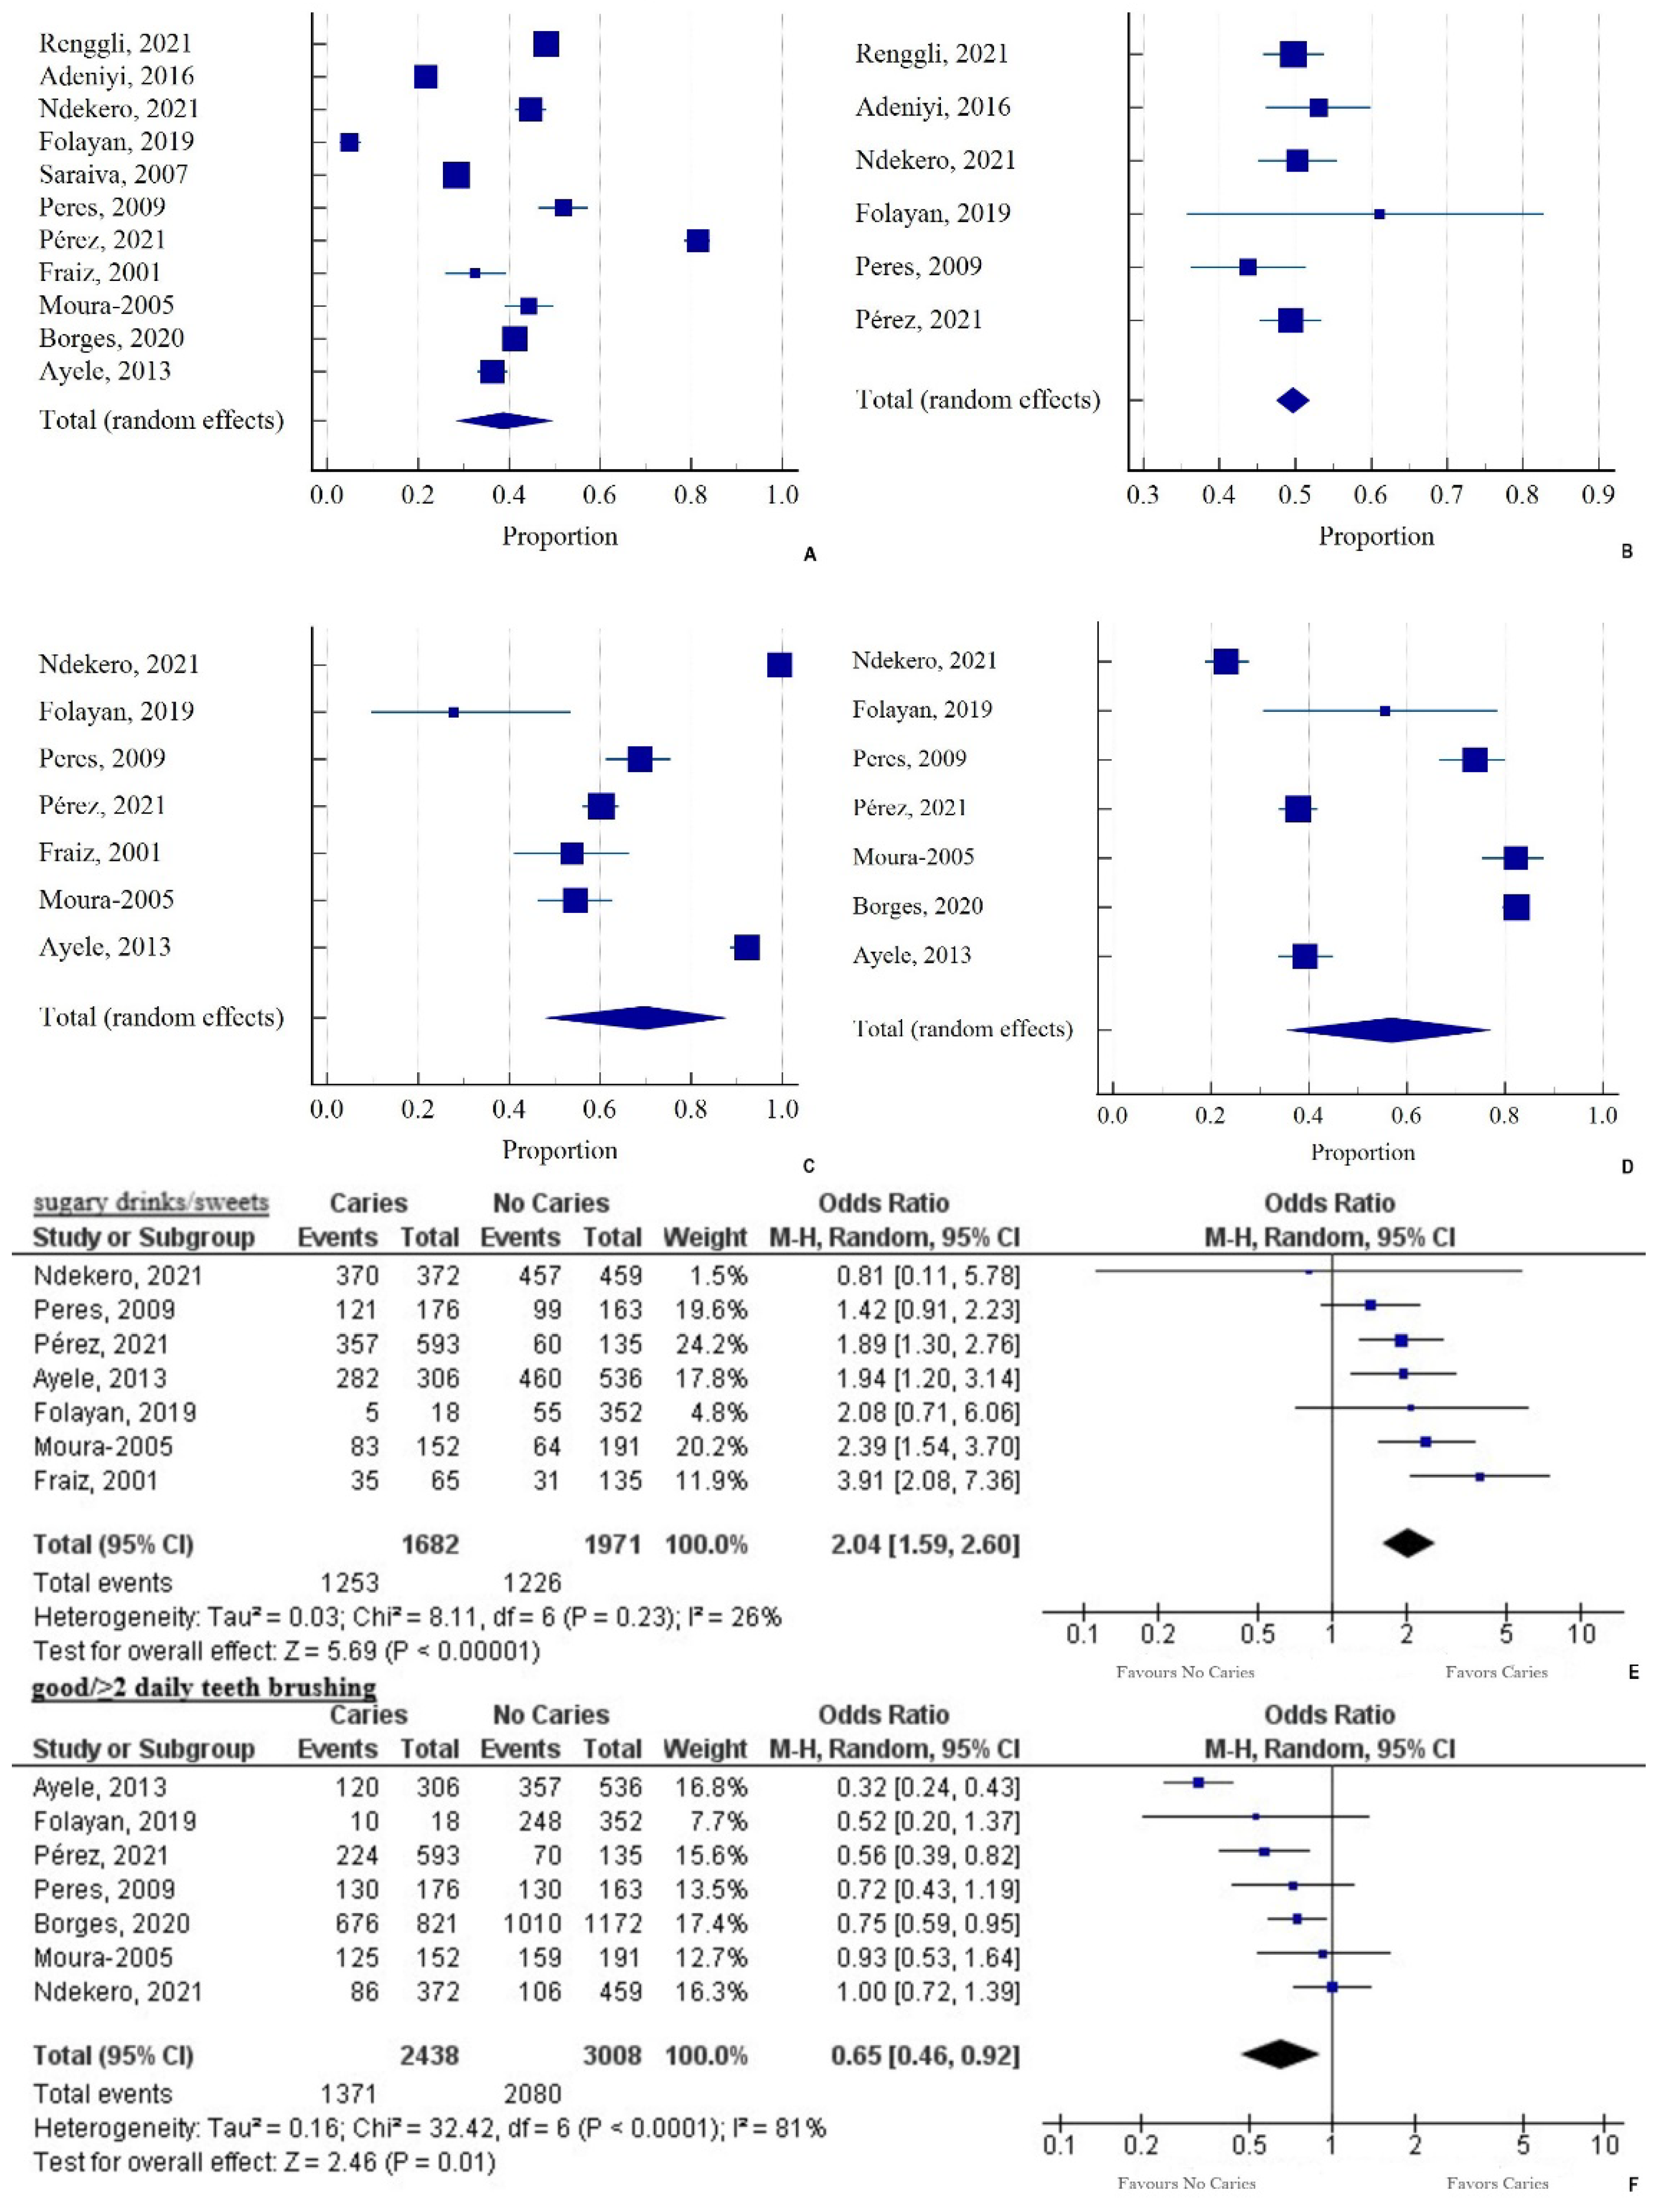
3.2.3. Nutritional Patterns
3.2.4. Oral Hygiene Patterns
3.3. Family-Level Characteristics
3.3.1. Maternal Age
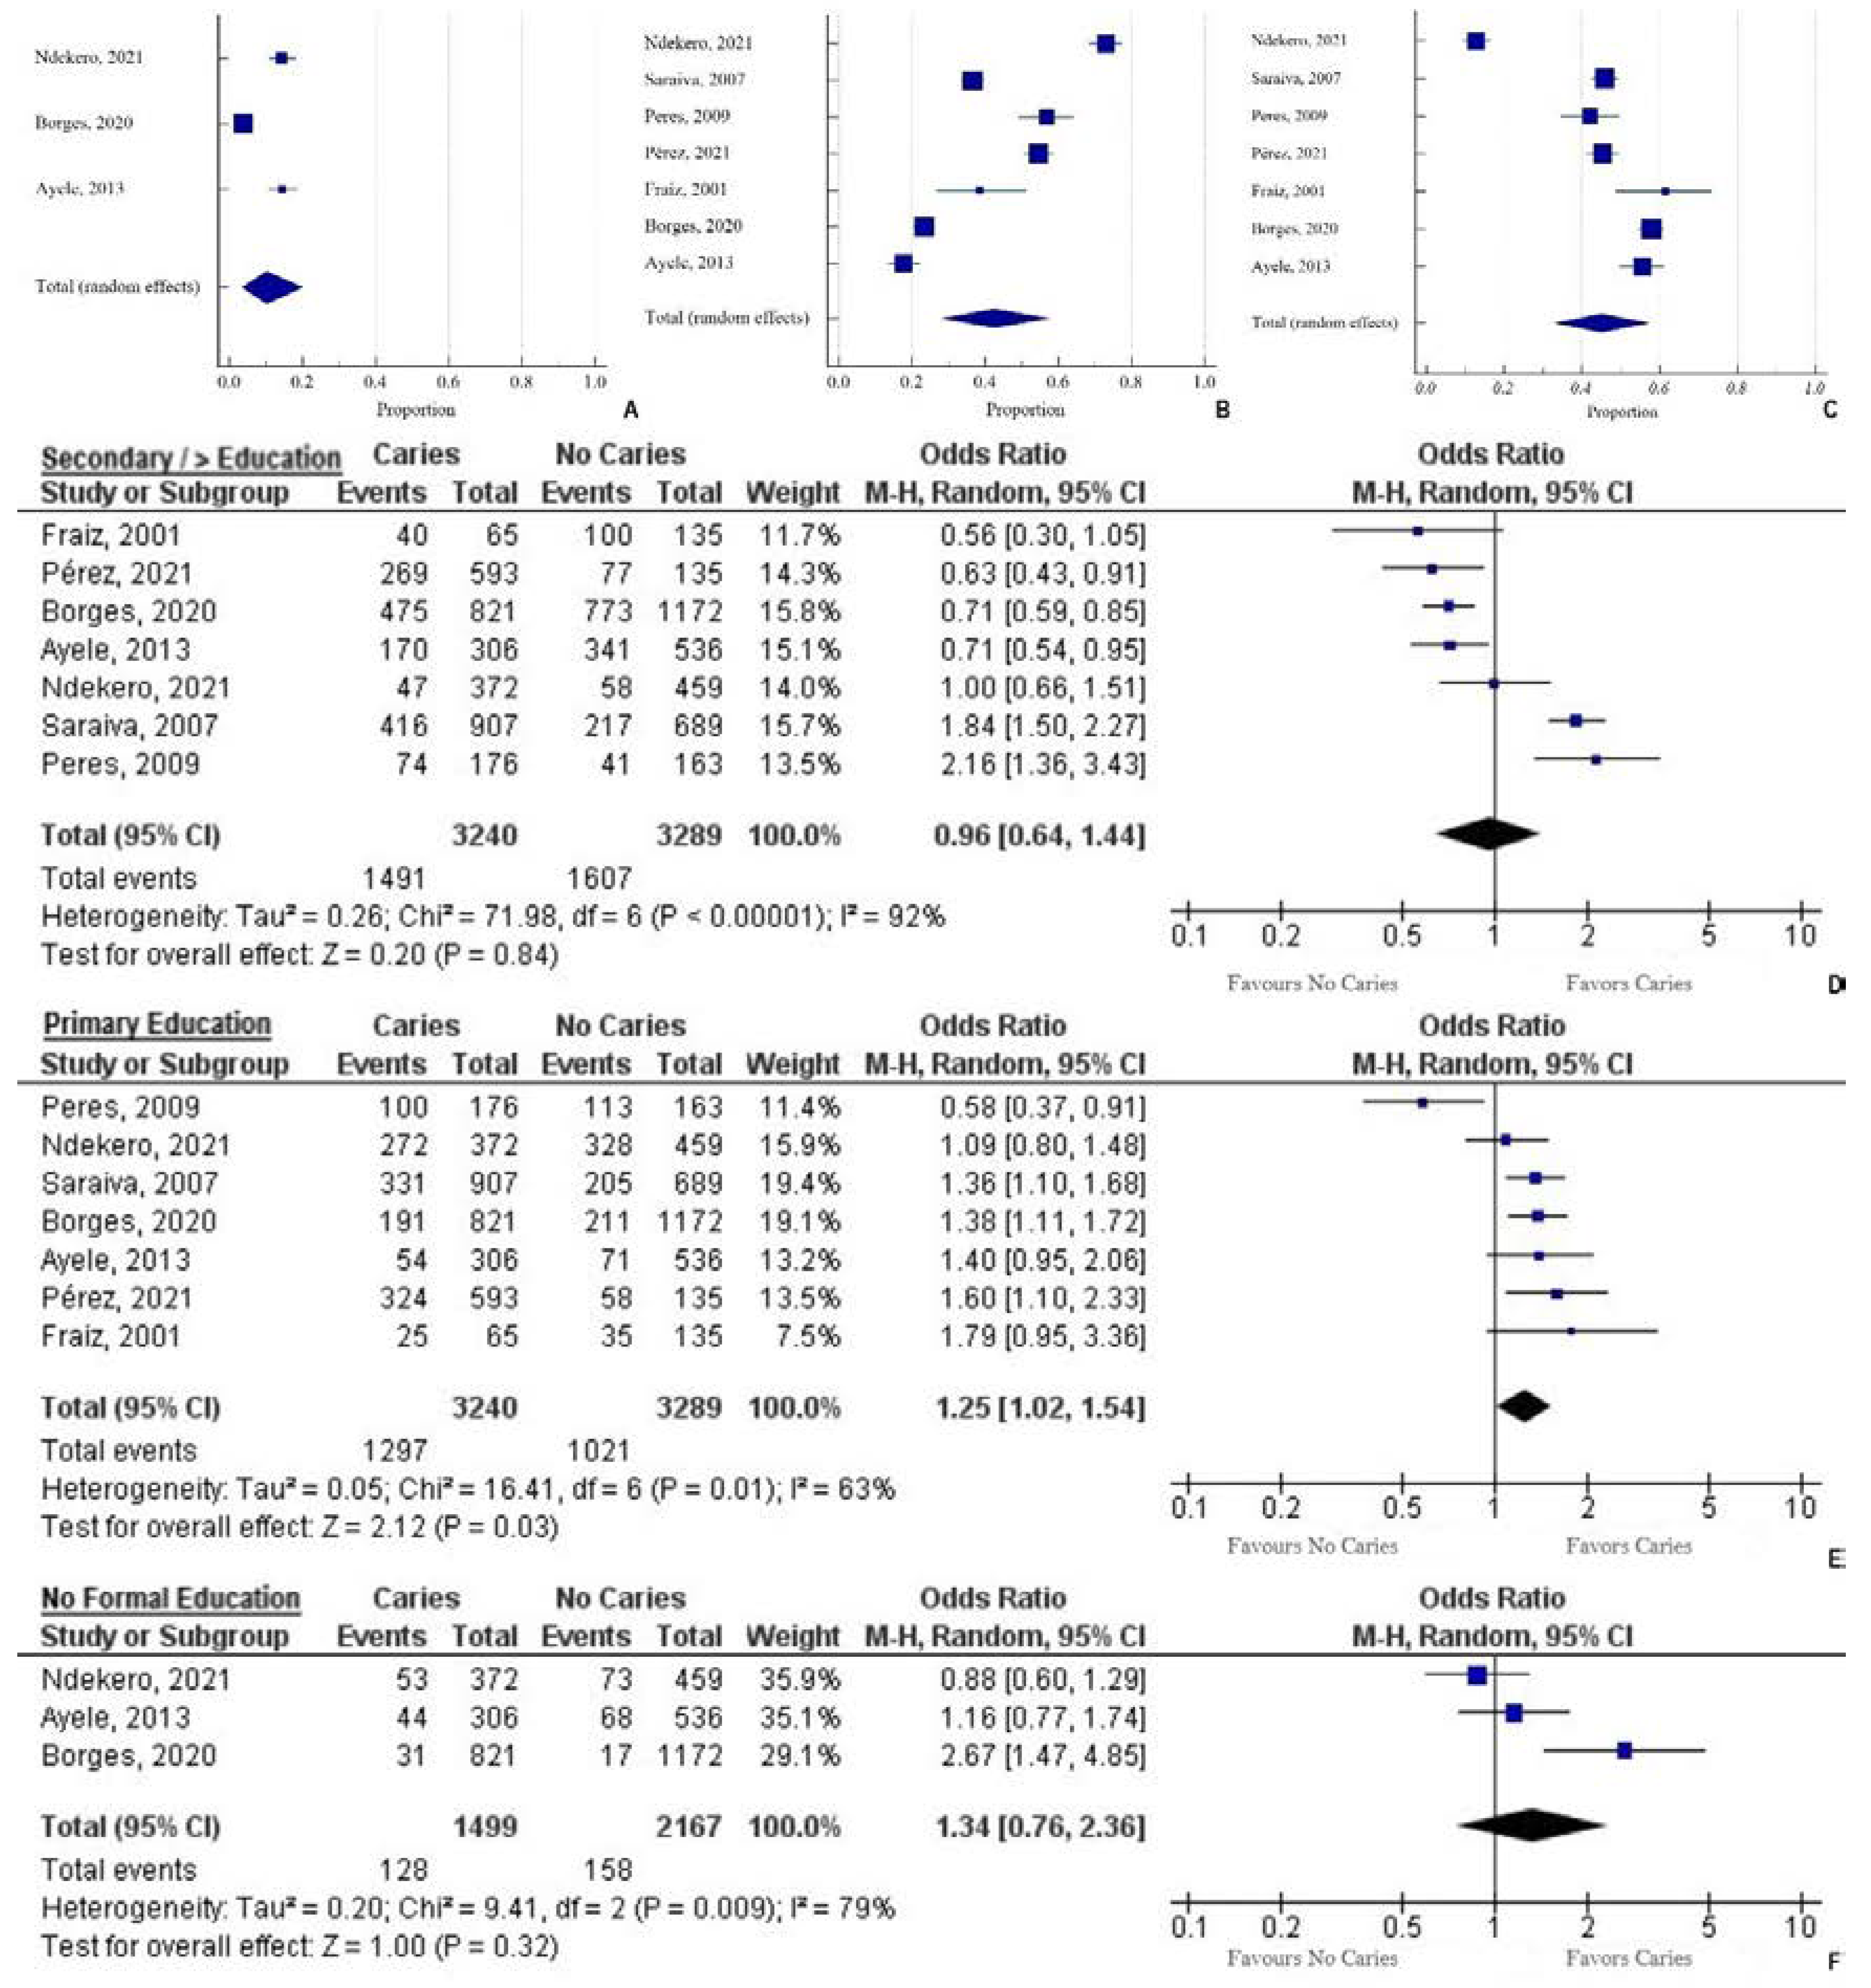
3.3.2. Maternal Education
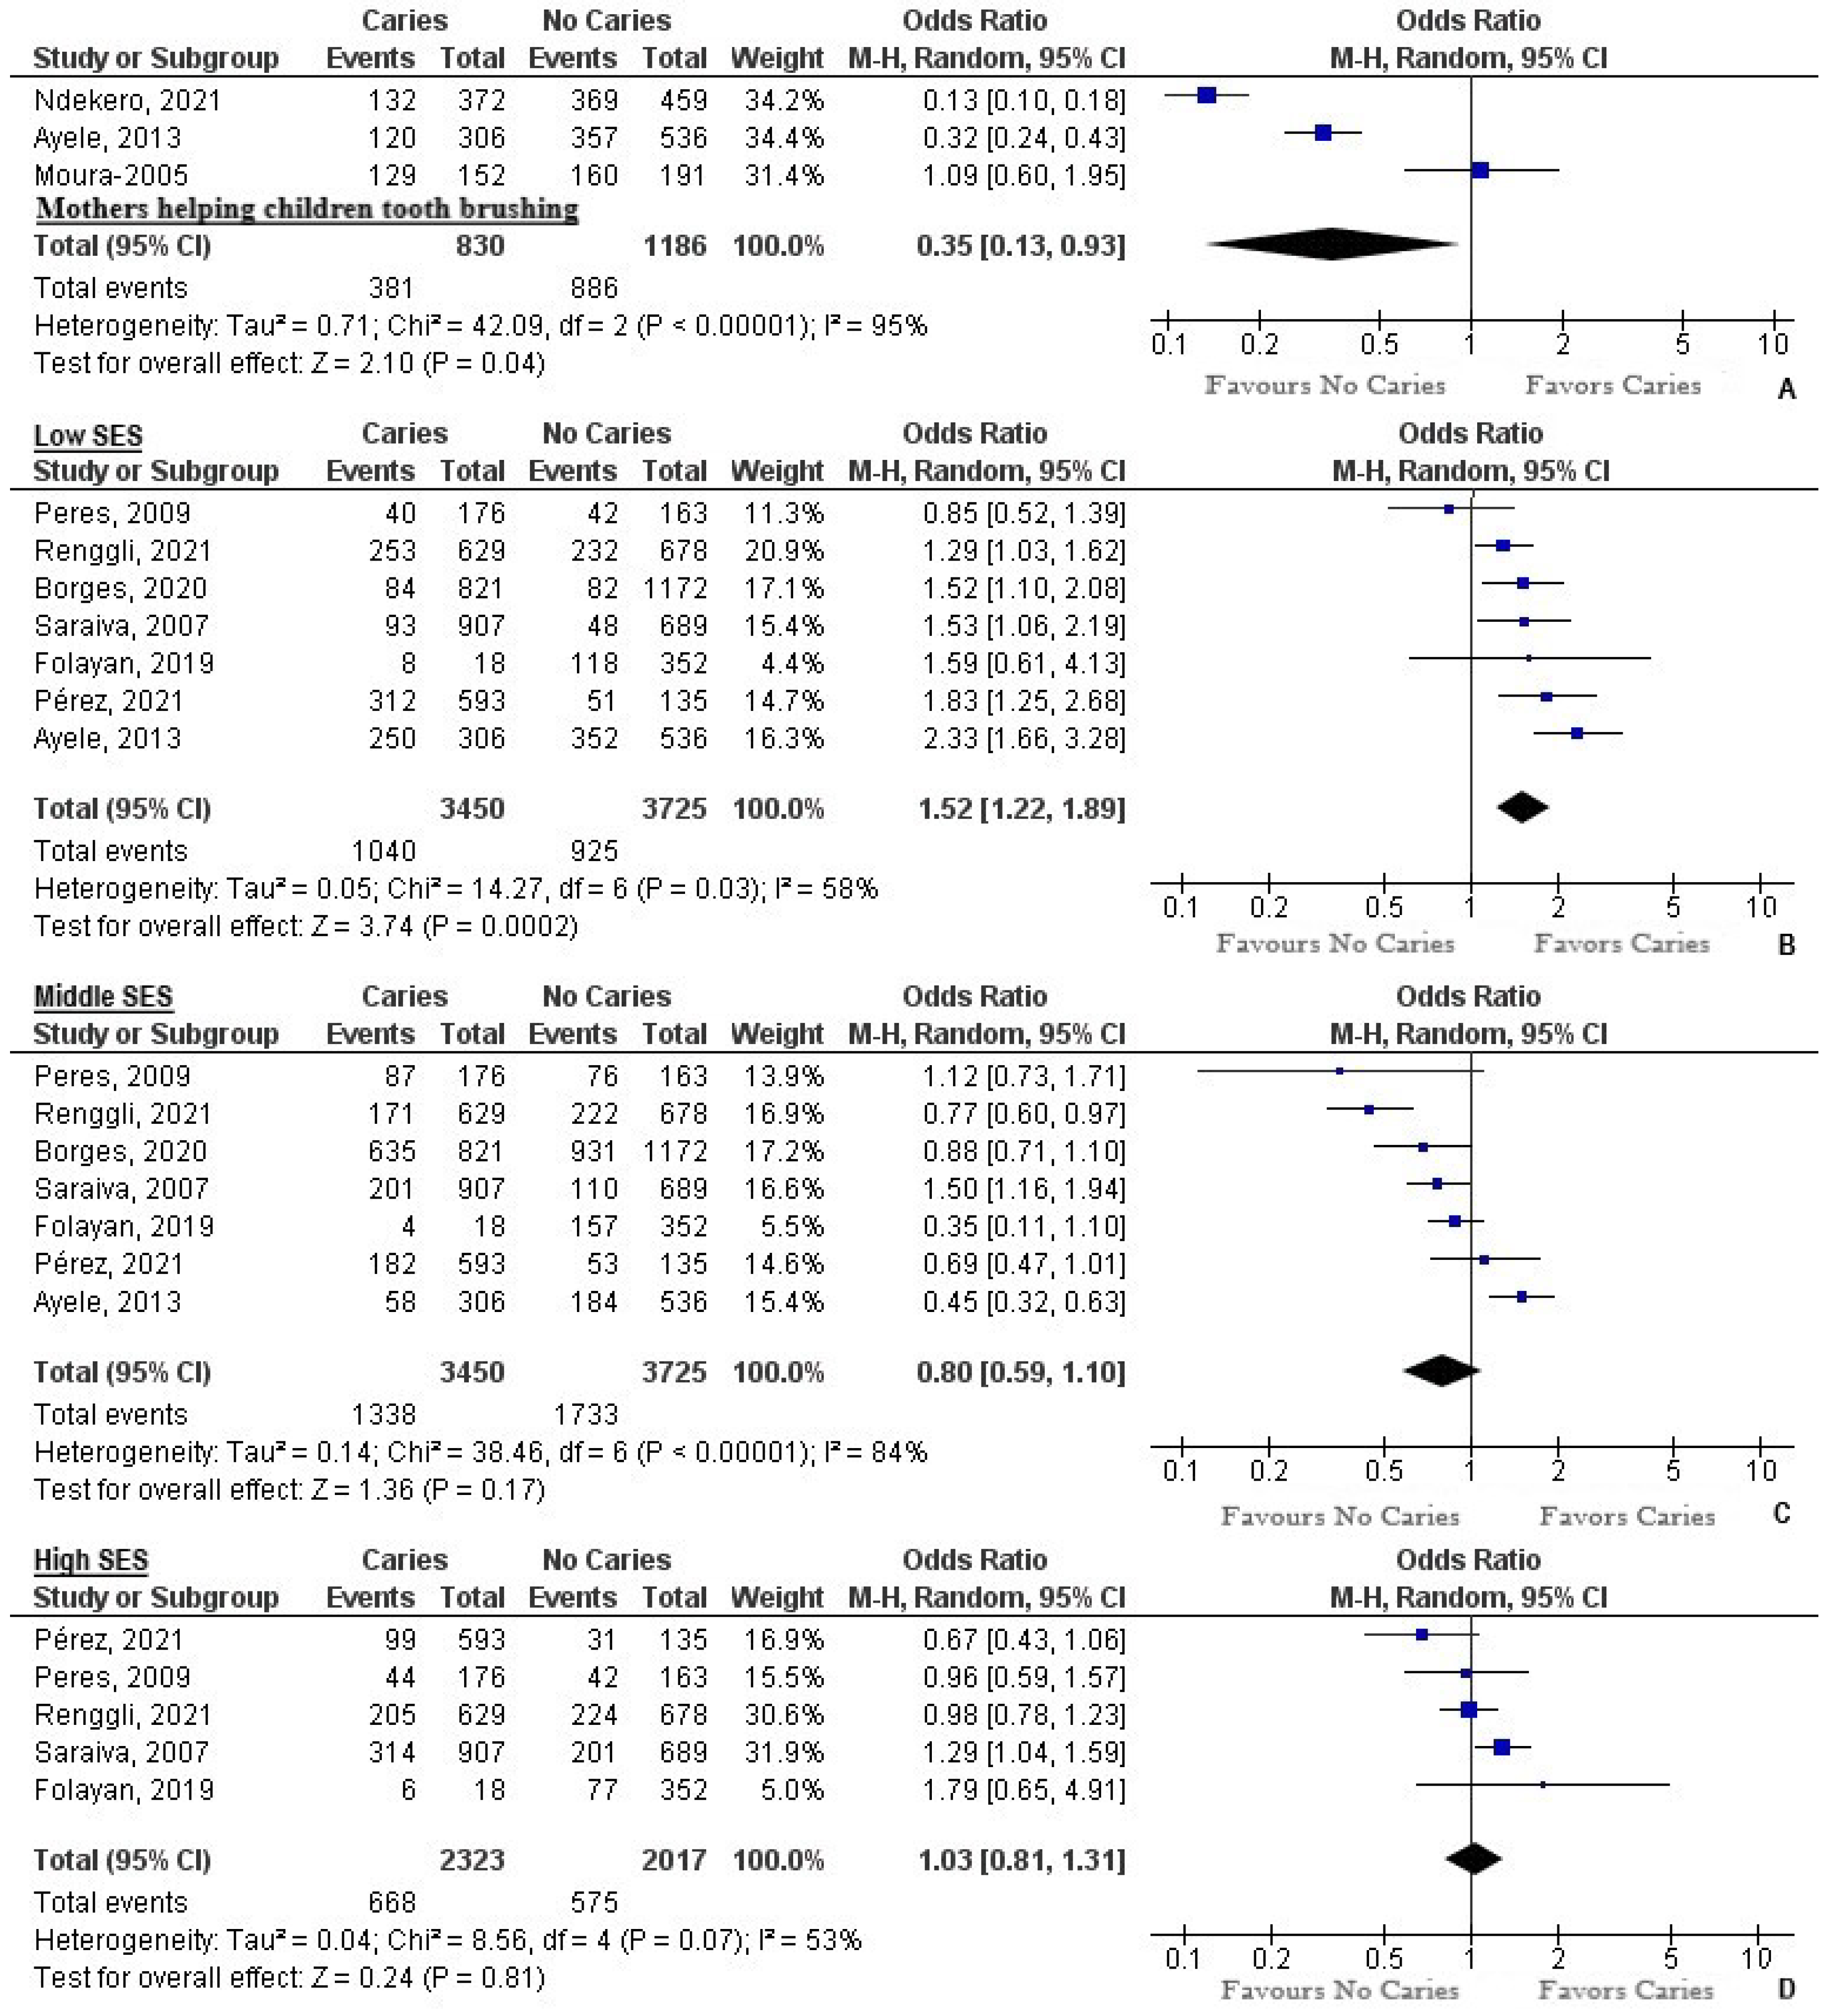
3.3.3. Help with Tooth Brushing
3.3.4. Use of Fluoride Toothpaste
3.4. Socioeconomic Level Characteristics
3.4.1. Number of People in the Household
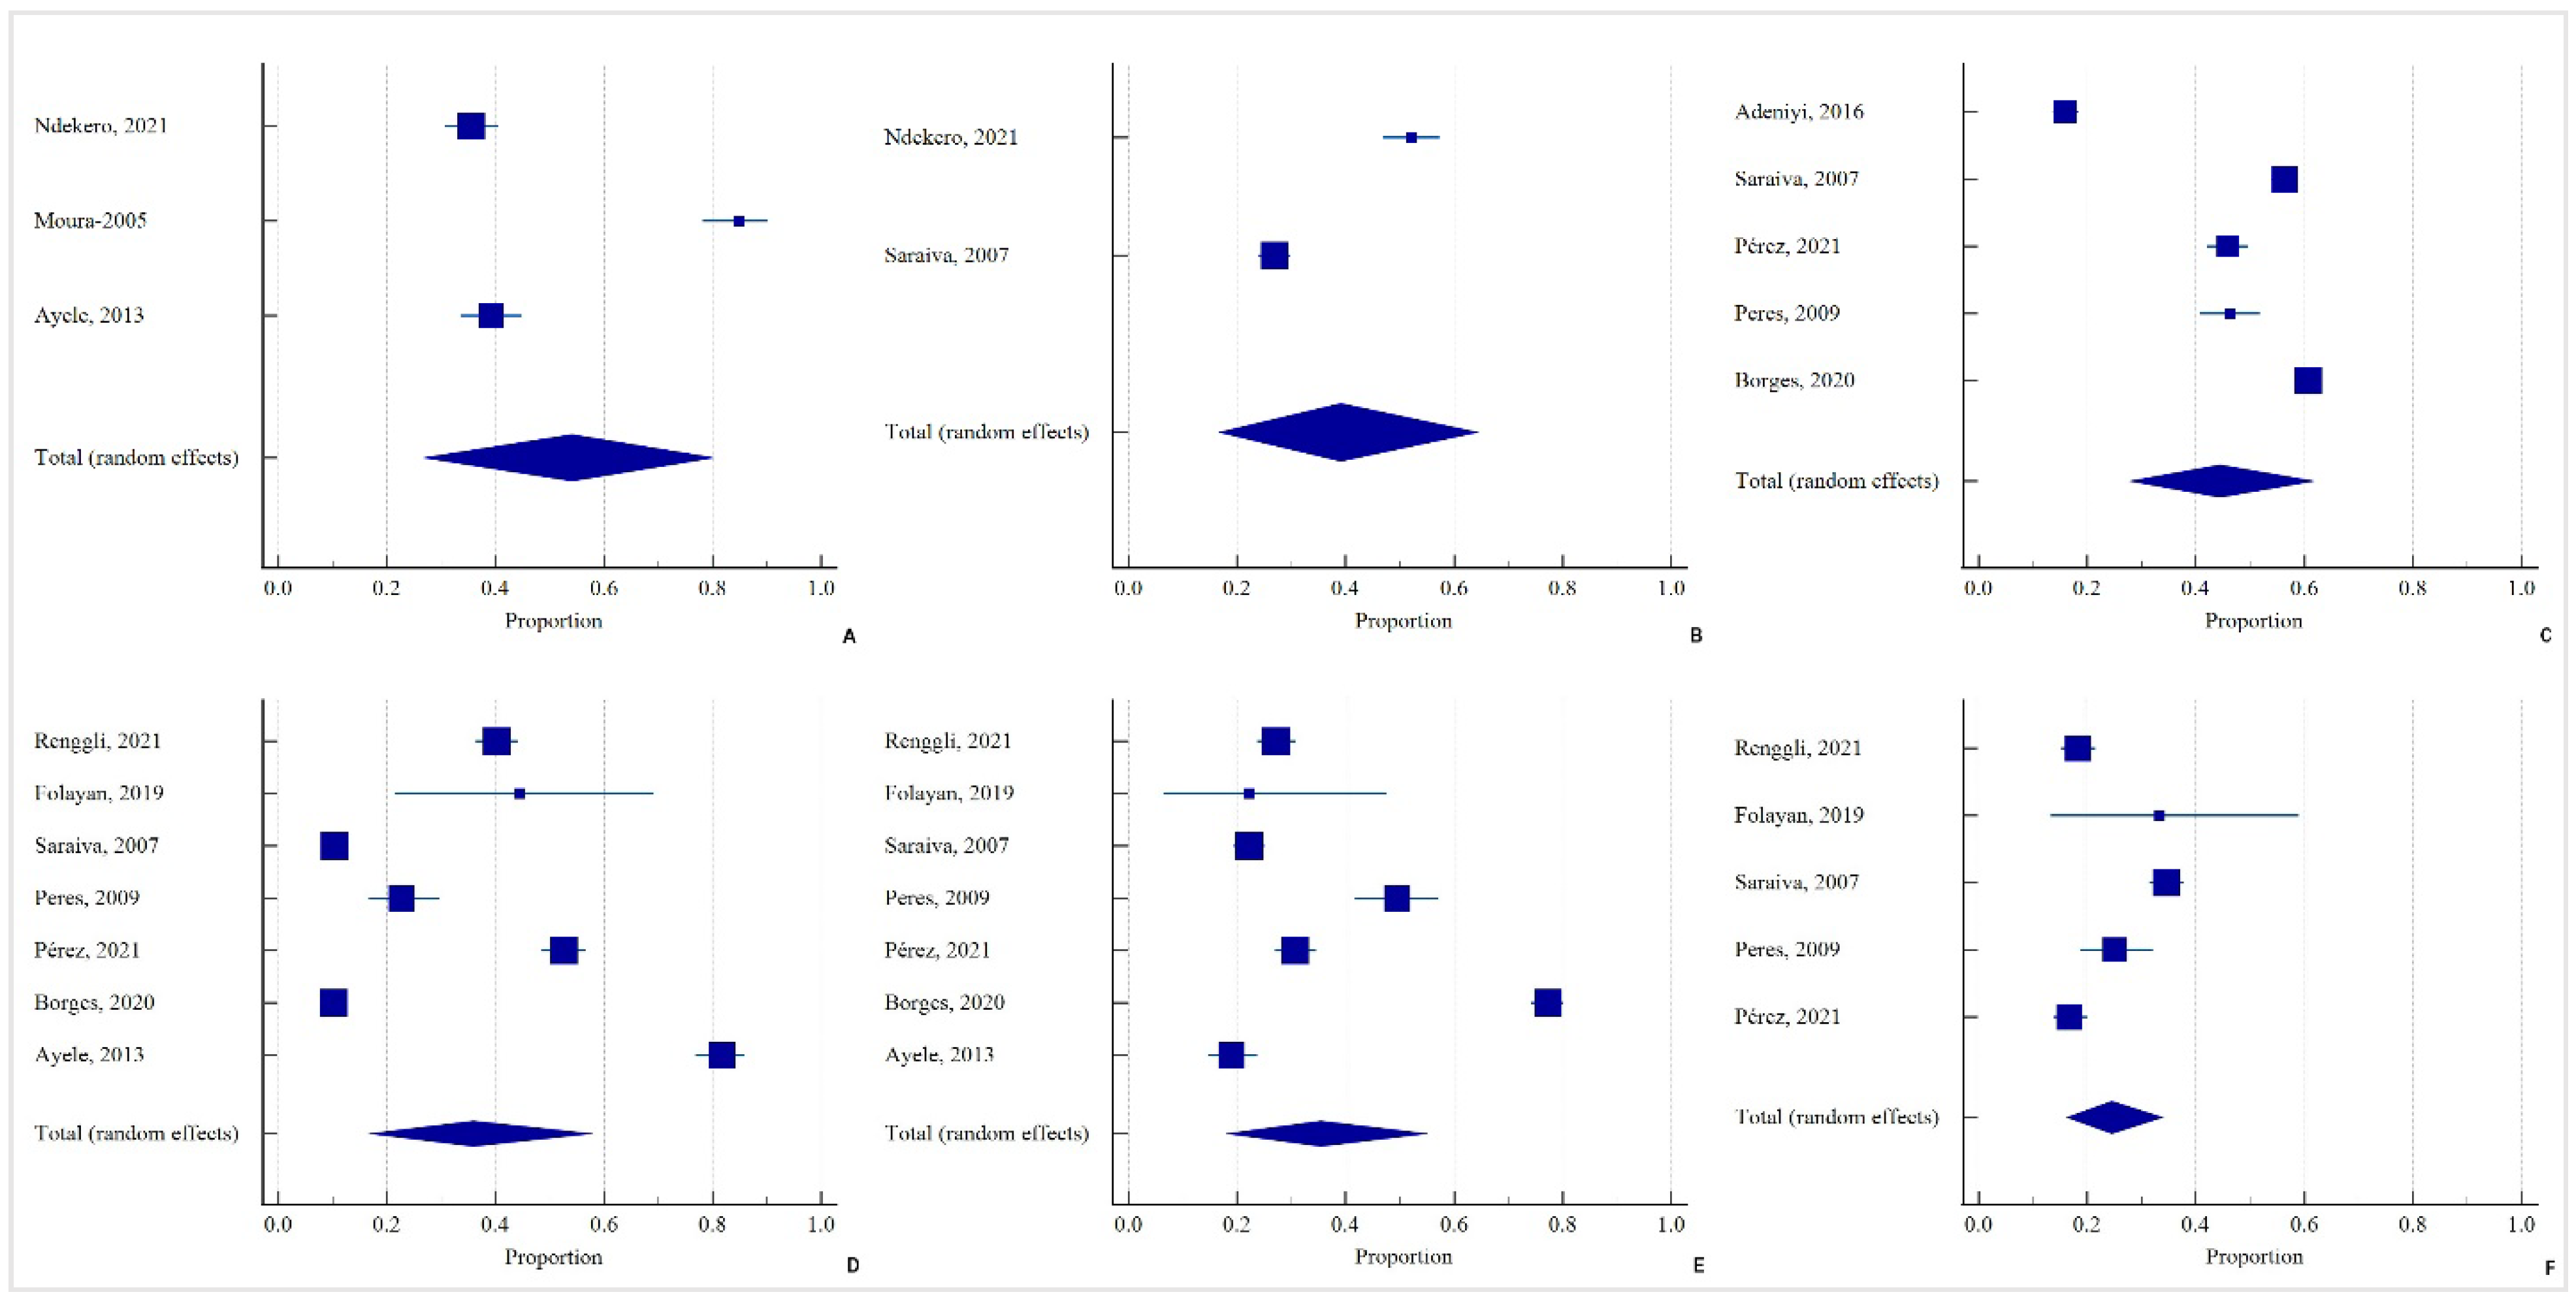
3.4.2. Socioeconomic Status
3.4.3. Setting
3.4.4. Access to Dental Services
4. Discussion
Limitations and Recommendations
5. Conclusions
Supplementary Materials
Author Contributions
Funding
Institutional Review Board Statement
Informed Consent Statement
Data Availability Statement
Conflicts of Interest
References
- Kassebaum, N.J.; Smith, A.G.C.; Bernabé, E.; Fleming, T.D.; Reynolds, A.E.; Vos, T.; Murray, C.J.L.; Marcenes, W.; GBD Oral Health Collaborators. Global, Regional, and National Prevalence, Incidence, and Disability-Adjusted Life Years for Oral Conditions for 195 Countries, 1990–2015: A Systematic Analysis for the Global Burden of Diseases, Injuries, and Risk Factors. J. Dent. Res. 2017, 96, 380–387. [Google Scholar] [CrossRef] [PubMed]
- El Tantawi, M.; Folayan, M.O.; Mehaina, M.; Vukovic, A.; Castillo, J.L.; Gaffar, B.O.; Arheiam, A.; Al-Batayneh, O.B.; Kemoli, A.M.; Schroth, R.J. Prevalence and Data Availability of Early Childhood Caries in 193 United Nations Countries, 2007–2017. Am. J. Public Health 2018, 108, 1066–1072. [Google Scholar] [CrossRef] [PubMed]
- Çolak, H.; Dülgergil, Ç.T.; Dalli, M.; Hamidi, M.M. Early Childhood Caries Update: A Review of Causes, Diagnoses, and Treatments. J. Nat. Sci. Biol. Med. 2013, 4, 29. [Google Scholar] [PubMed] [Green Version]
- Lagerweij, M.D.; Van Loveren, C. Declining Caries Trends: Are We Satisfied? Curr. Oral Health Rep. 2015, 2, 212–217. [Google Scholar] [CrossRef] [PubMed] [Green Version]
- Mathu-Muju, K.R.; Friedman, J.W.; Nash, D.A. Oral Health Care for Children in Countries Using Dental Therapists in Public, School-Based Programs, Contrasted with That of the United States, Using Dentists in a Private Practice Model. Am. J. Public Health 2013, 103, e7–e13. [Google Scholar] [CrossRef] [PubMed]
- Ramos-Gomez, F.; Kinsler, J.; Askaryar, H. Understanding Oral Health Disparities in Children as a Global Public Health Issue: How Dental Health Professionals Can Make a Difference. J. Public Health Policy 2020, 41, 114–124. [Google Scholar] [CrossRef]
- Ludovichetti, F.S.; Signoriello, A.G.; Zuccon, A.; Padovani, S.; Mazzoleni, S. The Role of Information in Dental Traumatology in Patients during Developmental Age: A Cognitive Investigation. Eur. J. Dent. 2021. [Google Scholar] [CrossRef]
- Alsuraim, B.S.; Han, D.-H. Effect of Globalization on Global Dental Caries Trend. Medicine 2020, 99, 35. [Google Scholar] [CrossRef]
- Peres, M.A.; Macpherson, L.M.D.; Weyant, R.J.; Daly, B.; Venturelli, R.; Mathur, M.R.; Listl, S.; Celeste, R.K.; Guarnizo-Herreño, C.C.; Kearns, C. Oral Diseases: A Global Public Health Challenge. Lancet 2019, 394, 249–260. [Google Scholar] [CrossRef]
- Palmer, C.A.; Kent Jr, R.; Loo, C.Y.; Hughes, C.V.; Stutius, E.; Pradhan, N.; Dahlan, M.; Kanasi, E.; Arevalo Vasquez, S.S.; Tanner, A.C.R. Diet and Caries-Associated Bacteria in Severe Early Childhood Caries. J. Dent. Res. 2010, 89, 1224–1229. [Google Scholar] [CrossRef]
- Hujoel, P.P.; Hujoel, M.L.A.; Kotsakis, G.A. Personal Oral Hygiene and Dental Caries: A Systematic Review of Randomised Controlled Trials. Gerodontology 2018, 35, 282–289. [Google Scholar] [CrossRef] [PubMed] [Green Version]
- Koberova, R.; Radochova, V.; Zemankova, J.; Ryskova, L.; Broukal, Z.; Merglova, V. Evaluation of the Risk Factors of Dental Caries in Children with Very Low Birth Weight and Normal Birth Weight. BMC Oral Health 2021, 21, 11. [Google Scholar] [CrossRef] [PubMed]
- Shaffer, J.R.; Wang, X.; McNeil, D.W.; Weyant, R.J.; Crout, R.; Marazita, M.L. Genetic Susceptibility to Dental Caries Differs between the Sexes: A Family-Based Study. Caries Res. 2015, 49, 133–140. [Google Scholar] [CrossRef] [PubMed] [Green Version]
- Ju, X.; Jamieson, L.M.; Mejia, G.C. Estimating the Effects of Maternal Education on Child Dental Caries Using Marginal Structural Models: The Longitudinal Study of Indigenous Australian Children. Community Dent. Oral Epidemiol. 2016, 44, 602–610. [Google Scholar] [CrossRef]
- Gao, J.; Ruan, J.; Zhao, L.; Zhou, H.; Huang, R.; Tian, J. Oral Health Status and Oral Health Knowledge, Attitudes and Behavior among Rural Children in Shaanxi, Western China: A Cross-Sectional Survey. BMC Oral Health 2014, 14, 1–7. [Google Scholar] [CrossRef] [Green Version]
- Saied-Moallemi, Z.; Virtanen, J.I.; Ghofranipour, F.; Murtomaa, H. Influence of Mothers’ Oral Health Knowledge and Attitudes on Their Children’s Dental Health. Eur. Arch. Paediatr. Dent. 2008, 9, 79–83. [Google Scholar] [CrossRef]
- Ismail, A.I.; Sohn, W.; Tellez, M.; Willem, J.M.; Betz, J.; Lepkowski, J. Risk Indicators for Dental Caries Using the International Caries Detection and Assessment System (ICDAS). Community Dent. Oral Epidemiol. 2008, 36, 55–68. [Google Scholar] [CrossRef]
- Addo-Yobo, C.; Williams, S.A.; Curzon, M.E.J. Dental Caries Experience in Ghana among 12-Year-Old Urban and Rural Schoolchildren. Caries Res. 1991, 25, 311–314. [Google Scholar] [CrossRef]
- Iheozor-Ejiofor, Z.; Worthington, H.V.; Walsh, T.; O’Malley, L.; Clarkson, J.E.; Macey, R.; Alam, R.; Tugwell, P.; Welch, V.; Glenny, A. Water Fluoridation for the Prevention of Dental Caries. Cochrane Database Syst. Rev. 2015. [Google Scholar] [CrossRef]
- Folayan, M.O.; Tantawi, M.E.; Virtanen, J.I.; Feldens, C.A.; Rashwan, M.; Kemoli, A.M.; Villena, R.; Al-Batayneh, O.B.; Amalia, R.; Gaffar, B. An Ecological Study on the Association between Universal Health Service Coverage Index, Health Expenditures, and Early Childhood Caries. BMC Oral Health 2021, 21, 1–7. [Google Scholar]
- Igić, M.; Apostolović, M.; Kostadinović, L.; Tričković-Janjić, O.; Šurdilović, D. The Importance of Health Education in Prevention of Oral Health in Children. Med. Pregl. 2008, 61, 65–70. [Google Scholar] [CrossRef] [PubMed] [Green Version]
- Lee, Y. Diagnosis and Prevention Strategies for Dental Caries. J. Lifestyle Med. 2013, 3, 107. [Google Scholar] [PubMed]
- Congiu, G.; Campus, G.; Lugliè, P.F. Early Childhood Caries (ECC) Prevalence and Background Factors: A Review. Oral Health Prev Dent 2014, 12, 71–76. [Google Scholar] [PubMed]
- Stephen, A.; Krishnan, R.; Ramesh, M.; Kumar, V.S. Prevalence of Early Childhood Caries and Its Risk Factors in 18–72 Month Old Children in Salem, Tamil Nadu. J. Int. Soc. Prev. Community Dent. 2015, 5, 95. [Google Scholar]
- Tanner, L.; Craig, D.; Holmes, R.; Catinella, L.; Moynihan, P. Does Dental Caries Increase Risk of Undernutrition in Children? JDR Clin. Transl. Res. 2021, 7, 23800844211003530. [Google Scholar] [CrossRef]
- Ali, A. Current Status of Malnutrition and Stunting in Pakistani Children: What Needs to Be Done? J. Am. Coll. Nutr. 2021, 40, 180–192. [Google Scholar] [CrossRef]
- Akhtar, S. Malnutrition in South Asia—A Critical Reappraisal. Crit. Rev. Food Sci. Nutr. 2016, 56, 2320–2330. [Google Scholar] [CrossRef]
- So, M.; Ellenikiotis, Y.A.; Husby, H.M.; Paz, C.L.; Seymour, B.; Sokal-Gutierrez, K. Early Childhood Dental Caries, Mouth Pain, and Malnutrition in the Ecuadorian Amazon Region. Int. J. Environ. Res. Public Health 2017, 14, 550. [Google Scholar] [CrossRef] [Green Version]
- Cheng, L.; Zhang, L.; Yue, L.; Ling, J.; Fan, M.; Yang, D.; Huang, Z.; Niu, Y.; Liu, J.; Zhao, J. Expert Consensus on Dental Caries Management. Int. J. Oral Sci. 2022, 14, 17. [Google Scholar] [CrossRef]
- Ludovichetti, F.S.; Stellini, E.; Signoriello, A.G.; Di Fiore, A.; Gracco, A.; Mazzoleni, S. Zirconia vs Stainless Steel Pediatric Crowns: A Literature Review. Minerva Stomatol. 2020, 70, 112–118. [Google Scholar] [CrossRef]
- Nadanovsky, P.; Sheiham, A. Relative Contribution of Dental Services to the Changes in Caries Levels of 12-year-old Children in 18 Industrialized Countries in the 1970s and Early 1980s. Community Dent. Oral Epidemiol. 1995, 23, 331–339. [Google Scholar] [CrossRef] [PubMed]
- Kirthiga, M.; Murugan, M.; Saikia, A.; Kirubakaran, R. Risk Factors for Early Childhood Caries: A Systematic Review and Meta-Analysis of Case Control and Cohort Studies. Pediatr. Dent. 2019, 41, 95–112. [Google Scholar] [PubMed]
- Page, M.J.; McKenzie, J.E.; Bossuyt, P.M.; Boutron, I.; Hoffmann, T.C.; Mulrow, C.D.; Shamseer, L.; Tetzlaff, J.M.; Akl, E.A.; Brennan, S.E.; et al. The PRISMA 2020 Statement: An Updated Guideline for Reporting Systematic Reviews. BMJ 2021, 372. [Google Scholar] [CrossRef]
- Anaise, J.Z. Measurement of Dental Caries Experience-modification of the DMFT Index. Community Dent. Oral Epidemiol. 1984, 12, 43–46. [Google Scholar] [CrossRef]
- World Bank Country and Lending Groups—World Bank Data Help Desk. Available online: https://datahelpdesk.worldbank.org/knowledgebase/articles/906519-world-bank-country-and-lending-groups (accessed on 7 April 2022).
- Petticrew, M.; Roberts, H. Systematic Reviews in the Social Sciences: A Practical Guide; John Wiley & Sons: Hoboken, NJ, USA, 2008; ISBN 1405150149. [Google Scholar]
- McKenzie, J.E.; Brennan, S.E. Synthesizing and Presenting Findings Using Other Methods. Cochrane Handb. Syst. Rev. Interv. 2019, 23, 321–347. [Google Scholar]
- Peres, M.A.; Latorre, M.D.R.D.D.O.; Sheiham, A.; Peres, K.G.; Barros, F.C.; Hernandez, P.G.; Maas, A.M.N.; Romano, A.R.; Victora, C.G. Social and Biological Early Life Influences on Severity of Dental Caries in Children Aged 6 Years. Community Dent. Oral Epidemiol. 2005, 33, 53–63. [Google Scholar] [CrossRef]
- Saraiva, M.C.D.; Bettiol, H.; Barbieri, M.A.; Silva, A.A. Are Intrauterine Growth Restriction and Preterm Birth Associated with Dental Caries? Community Dent. Oral Epidemiol. 2007, 35, 364–376. [Google Scholar] [CrossRef]
- Moura, L.D.F.A.D.D.; Moura, M.S.D.; Toledo, O.A.D. Dental Caries in Children That Participated in a Dental Program Providing Mother and Child Care. J. Appl. Oral Sci. 2006, 14, 53–60. [Google Scholar] [CrossRef]
- Fraiz, F.C.; Walter, L.R.D.F. Study of the Factors Associated with Dental Caries in Children Who Receive Early Dental Care. Pesqui. Odontológica Bras. 2001, 15, 201–207. [Google Scholar] [CrossRef] [Green Version]
- Borges, H.C.; Garbín, C.A.S.; Saliba, O.; Saliba, N.A.; Moimaz, S.A.S. Socio-Behavioral Factors Influence Prevalence and Severity of Dental Caries in Children with Primary Dentition. Braz. Oral Res. 2012, 26, 564–570. [Google Scholar] [CrossRef] [Green Version]
- Folayan, M.O.; Arije, O.; El Tantawi, M.; Kolawole, K.A.; Obiyan, M.; Arowolo, O.; Oziegbe, E.O. Association between Early Childhood Caries and Malnutrition in a Sub-Urban Population in Nigeria. BMC Pediatr. 2019, 19, 433. [Google Scholar] [CrossRef] [PubMed] [Green Version]
- Adeniyi, A.A.; Oyapero, O.A.; Ekekezie, O.O.; Braimoh, M.O. Dental Caries and Nutritional Status of School Children in Lagos, Nigeria–A Preliminary Survey. J. West African Coll. Surg. 2016, 6, 15. [Google Scholar]
- Renggli, E.P.; Turton, B.; Sokal-Gutierrez, K.; Hondru, G.; Chher, T.; Hak, S.; Poirot, E.; Laillou, A. Stunting Malnutrition Associated with Severe Tooth Decay in Cambodian Toddlers. Nutrients 2021, 13, 290. [Google Scholar] [CrossRef] [PubMed]
- Ndekero, T.S.; Carneiro, L.C.; Masumo, R.M. Prevalence of Early Childhood Caries, Risk Factors and Nutritional Status among 3-5-Year-Old Preschool Children in Kisarawe, Tanzania. PLoS ONE 2021, 16, e0247240. [Google Scholar] [CrossRef] [PubMed]
- Pérez, A.G.; Pineda, A.E.G.-A.; Ibáñez, R.R.; Chávez, J.A.R.; Cuevas-González, J.C.; Pérez, N.G.P.; Gutiérrez, T.V. Association between Sociodemographic Factors and Noncavitated and Cavitated Caries Lesions in 8-to 12-Year-Old Mexican Schoolchildren. Medicine 2021, 100, e26435. [Google Scholar] [CrossRef] [PubMed]
- Ayele, F.A.; Taye, B.W.; Ayele, T.A.; Gelaye, K.A. Predictors of Dental Caries among Children 7–14 Years Old in Northwest Ethiopia: A Community Based Cross-Sectional Study. BMC Oral Health 2013, 13, 7. [Google Scholar] [CrossRef] [Green Version]
- Wen, P.Y.F.; Chen, M.X.; Zhong, Y.J.; Dong, Q.Q.; Wong, H.M. Global Burden and Inequality of Dental Caries, 1990 to 2019. J. Dent. Res. 2021, 101, 392–399. [Google Scholar] [CrossRef]
- Peres, K.G.; Chaffee, B.W.; Feldens, C.A.; Flores-Mir, C.; Moynihan, P.; Rugg-Gunn, A. Breastfeeding and Oral Health: Evidence and Methodological Challenges. J. Dent. Res. 2018, 97, 251–258. [Google Scholar] [CrossRef] [Green Version]
- World Health Organization. Infant and Young Child Feeding. Available online: https://www.who.int/news-room/fact-sheets/detail/infant-and-young-child-feeding (accessed on 25 May 2022).
- Avila, W.M.; Pordeus, I.A.; Paiva, S.M.; Martins, C.C. Breast and Bottle Feeding as Risk Factors for Dental Caries: A Systematic Review and Meta-Analysis. PLoS ONE 2015, 10, e0142922. [Google Scholar] [CrossRef]
- Hong, L.; Levy, S.M.; Warren, J.J.; Broffitt, B. Infant Breast-Feeding and Childhood Caries: A Nine-Year Study. Pediatr. Dent. 2014, 36, 342–347. [Google Scholar]
- Chaffee, B.W.; Feldens, C.A.; Vítolo, M.R. Association of Long-Duration Breastfeeding and Dental Caries Estimated with Marginal Structural Models. Ann. Epidemiol. 2014, 24, 448–454. [Google Scholar] [CrossRef] [PubMed] [Green Version]
- Tham, R.; Bowatte, G.; Dharmage, S.C.; Tan, D.J.; Lau, M.X.Z.; Dai, X.; Allen, K.J.; Lodge, C.J. Breastfeeding and the Risk of Dental Caries: A Systematic Review and Meta-analysis. Acta Paediatr. 2015, 104, 62–84. [Google Scholar] [CrossRef] [PubMed] [Green Version]
- Neves, P.A.R.; Gatica-Domínguez, G.; Rollins, N.C.; Piwoz, E.; Baker, P.; Barros, A.J.D.; Victora, C.G. Infant Formula Consumption Is Positively Correlated with Wealth, within and between Countries: A Multi-Country Study. J. Nutr. 2020, 150, 910–917. [Google Scholar] [CrossRef] [PubMed]
- Rollins, N.C.; Bhandari, N.; Hajeebhoy, N.; Horton, S.; Lutter, C.K.; Martines, J.C.; Piwoz, E.G.; Richter, L.M.; Victora, C.G.; Group, T.L.B.S. Why Invest, and What It Will Take to Improve Breastfeeding Practices? Lancet 2016, 387, 491–504. [Google Scholar] [CrossRef]
- Baker, P.; Smith, J.; Salmon, L.; Friel, S.; Kent, G.; Iellamo, A.; Dadhich, J.P.; Renfrew, M.J. Global Trends and Patterns of Commercial Milk-Based Formula Sales: Is an Unprecedented Infant and Young Child Feeding Transition Underway? Public Health Nutr. 2016, 19, 2540–2550. [Google Scholar] [CrossRef] [Green Version]
- Blecher, E.; Liber, A.C.; Drope, J.M.; Nguyen, B.; Stoklosa, M. Peer Reviewed: Global Trends in the Affordability of Sugar-Sweetened Beverages, 1990–2016. Prev. Chronic Dis. 2017, 14. [Google Scholar] [CrossRef] [Green Version]
- Mobley, C.; Marshall, T.A.; Milgrom, P.; Coldwell, S.E. The Contribution of Dietary Factors to Dental Caries and Disparities in Caries. Acad. Pediatr. 2009, 9, 410–414. [Google Scholar] [CrossRef] [Green Version]
- Moynihan, P. Sugars and Dental Caries: Evidence for Setting a Recommended Threshold for Intake. Adv. Nutr. 2016, 7, 149–156. [Google Scholar] [CrossRef] [Green Version]
- Piombo, L.; Nicolella, G.; Barbarossa, G.; Tubili, C.; Pandolfo, M.M.; Castaldo, M.; Costanzo, G.; Mirisola, C.; Cavani, A. Outcomes of Culturally Tailored Dietary Intervention in the North African and Bangladeshi Diabetic Patients in Italy. Int. J. Environ. Res. Public Health 2020, 17, 8932. [Google Scholar] [CrossRef]
- Cullen, K.W.; Baranowski, T.; Owens, E.; Marsh, T.; Rittenberry, L.; de Moor, C. Availability, Accessibility, and Preferences for Fruit, 100% Fruit Juice, and Vegetables Influence Children’s Dietary Behavior. Health Educ. Behav. 2003, 30, 615–626. [Google Scholar] [CrossRef]
- Bastani, P.; Mohammadpour, M.; Mehraliain, G.; Delavari, S.; Edirippulige, S. What Makes Inequality in the Area of Dental and Oral Health in Developing Countries? A Scoping Review. Cost Eff. Resour. Alloc. 2021, 19, 54. [Google Scholar] [CrossRef] [PubMed]
- Schwendicke, F.; Dörfer, C.E.; Schlattmann, P.; Page, L.F.; Thomson, W.M.; Paris, S. Socioeconomic Inequality and Caries: A Systematic Review and Meta-Analysis. J. Dent. Res. 2015, 94, 10–18. [Google Scholar] [CrossRef] [PubMed]
- Masumo, R.; Bårdsen, A.; Åstrøm, A.N. Developmental Defects of Enamel in Primary Teeth and Association with Early Life Course Events: A Study of 6–36 Month Old Children in Manyara, Tanzania. BMC Oral Health 2013, 13, 21. [Google Scholar] [CrossRef] [PubMed] [Green Version]
- Popoola, B.O.; Denloye, O.O.; Iyun, O.I. Influence of Parental Socioeconomic Status on Caries Prevalence among Children Seen at the University College Hospital, Ibadan. Ann. Ibadan Postgrad. Med. 2013, 11, 81–86. [Google Scholar]
- Petersen, P.E. The World Oral Health Report 2003: Continuous Improvement of Oral Health in the 21st Century–the Approach of the WHO Global Oral Health Programme. Community Dent. Oral Epidemiol. 2003, 31, 3–24. [Google Scholar] [CrossRef]
- Aoun, A.; Darwiche, F.; Al Hayek, S.; Doumit, J. The Fluoride Debate: The Pros and Cons of Fluoridation. Prev. Nutr. food Sci. 2018, 23, 171. [Google Scholar] [CrossRef]
- Walsh, T.; Worthington, H.V.; Glenny, A.; Marinho, V.C.C.; Jeroncic, A. Fluoride Toothpastes of Different Concentrations for Preventing Dental Caries. Cochrane Database Syst. Rev. 2019. [Google Scholar] [CrossRef]
- Sheiham, A.; James, W.P.T. A Reappraisal of the Quantitative Relationship between Sugar Intake and Dental Caries: The Need for New Criteria for Developing Goals for Sugar Intake. BMC Public Health 2014, 14, 863. [Google Scholar] [CrossRef] [Green Version]
- Petersen, P.E.; Ogawa, H. Prevention of Dental Caries through the Use of Fluoride–the WHO Approach. Community Dent Health 2016, 33, 66–68. [Google Scholar]
- Peres, M.A.; Antunes, J.L.F.; Peres, K.G. Is Water Fluoridation Effective in Reducing Inequalities in Dental Caries Distribution in Developing Countries? Recent Findings from Brazil. Sozial-Und Präventivmedizin/Social Prev. Med. 2006, 51, 302–310. [Google Scholar] [CrossRef]
- Petersen, P.E.; Baez, R.J.; Lennon, M.A. Community-Oriented Administration of Fluoride for the Prevention of Dental Caries: A Summary of the Current Situation in Asia. Adv. Dent. Res. 2012, 24, 5–10. [Google Scholar] [CrossRef] [PubMed]
- Toumba, K.J.; Twetman, S.; Splieth, C.; Parnell, C.; Van Loveren, C.; Lygidakis, N.A. Guidelines on the Use of Fluoride for Caries Prevention in Children: An Updated EAPD Policy Document. Eur. Arch. Paediatr. Dent. 2019, 20, 507–516. [Google Scholar] [CrossRef] [PubMed] [Green Version]
- Du, M.; Bian, Z.; Guo, L.; Holt, R.; Champion, J.; Bedi, R. Caries Patterns and Their Relationship to Infant Feeding and Socio-Economic Status in 2–4-Year-Old Chinese Children. Int. Dent. J. 2000, 50, 385–389. [Google Scholar] [CrossRef] [PubMed]
- Ismail, A.I.; Sohn, W.; Lim, S.; Willem, J.M. Predictors of Dental Caries Progression in Primary Teeth. J. Dent. Res. 2009, 88, 270–275. [Google Scholar] [CrossRef] [Green Version]
- Thomson, W.M. Social Inequality in Oral Health. Community Dent. Oral Epidemiol. 2012, 40, 28–32. [Google Scholar] [CrossRef]
- Kim, S.W. Environmental, Maternal, and Child Factors Which Contribute to Early Childhood Caries: A Unifying Conceptual Model. Int. J. Paediatr. Dent. 2012, 22, 157–168. [Google Scholar]
- Franco, M.M.; Rodrigues, V.P.; Costa, J.F.; Costa, E.L. Association between Early Childhood Caries and Maternal Caries Status: A Cross-Section Study in São Luís, Maranhão, Brazil. Eur. J. Dent. 2015, 9, 122–126. [Google Scholar]
- Soares, F.C.; Dahllöf, G.; Hjern, A.; Julihn, A. U-Shaped Association between Maternal Age at Delivery and Dental Caries in Offspring. Acta Odontol. Scand. 2020, 78, 565–571. [Google Scholar] [CrossRef]
- Albino, J.; Tiwari, T. Preventing Childhood Caries: A Review of Recent Behavioral Research. J. Dent. Res. 2016, 95, 35–42. [Google Scholar] [CrossRef] [Green Version]
- George, A.; Johnson, M.; Blinkhorn, A.; Ellis, S.; Bhole, S.; Ajwani, S. Promoting Oral Health during Pregnancy: Current Evidence and Implications for Australian Midwives. J. Clin. Nurs. 2010, 19, 3324–3333. [Google Scholar] [CrossRef]
- World Health Organization Promoting Oral Health in Africa. Prevention and Control of Oral Diseases and Noma as Part of Essential Noncommunicable Disease Interventions. 2016. Available online: https://apps.who.int/iris/handle/10665/205886 (accessed on 25 May 2022).
- Plonka, K.A.; Pukallus, M.L.; Barnett, A.; Holcombe, T.F.; Walsh, L.J.; Seow, W.K. A Controlled, Longitudinal Study of Home Visits Compared to Telephone Contacts to Prevent Early Childhood Caries. Int. J. Paediatr. Dent. 2013, 23, 23–31. [Google Scholar] [CrossRef] [PubMed]
- World Health Organization. Be Smart Drink Water: A Guide for School Principals in Restricting the Sale and Marketing of Sugary Drinks in and around Schools; WHO Regional Office for the Western Pacific: Manila, Philippines, 2016. [Google Scholar]
- World Health Organization Oral Health Programme, Prevention of Noncommunicable Diseases WHO Headquarters. Ending Childhood Dental Caries: WHO Implementation Manual; World Health Organization: Geneva, Switzerland, 2019; pp. 1–57. [Google Scholar]
- Albino, J.; Tiwari, T.; Gansky, S.A.; Henshaw, M.M.; Barker, J.C.; Brega, A.G.; Gregorich, S.E.; Heaton, B.; Batliner, T.S.; Borrelli, B. The Basic Research Factors Questionnaire for Studying Early Childhood Caries. BMC Oral Health 2017, 17, 1–12. [Google Scholar] [CrossRef]
- Tinanoff, N.; Baez, R.J.; Diaz Guillory, C.; Donly, K.J.; Feldens, C.A.; McGrath, C.; Phantumvanit, P.; Pitts, N.B.; Seow, W.K.; Sharkov, N. Early Childhood Caries Epidemiology, Aetiology, Risk Assessment, Societal Burden, Management, Education, and Policy: Global Perspective. Int. J. Paediatr. Dent. 2019, 29, 238–248. [Google Scholar] [CrossRef] [PubMed]
- Phantumvanit, P.; Makino, Y.; Ogawa, H.; Rugg-Gunn, A.; Moynihan, P.; Petersen, P.E.; Evans, W.; Feldens, C.A.; Lo, E.; Khoshnevisan, M.H. WHO Global Consultation on Public Health Intervention against Early Childhood Caries. Community Dent. Oral Epidemiol. 2018, 46, 280–287. [Google Scholar] [CrossRef] [PubMed]


| Author-Year | Type of Study | Age (Years) at Enrollment | Duration of Follow-Up (Years) | Country | Sample Size (N) | Type of Dentition | Measurements Taken | Any Dental Caries (n, %) | DMFT Scores (Mean, SD) | Anthropometric Status (n, %) | Primary Objective | NOS Score |
|---|---|---|---|---|---|---|---|---|---|---|---|---|
| Pérez-2021 [47] | Cross-sectional | 9.9 years (SD: 1.2) | None | Mexico | 728 | Mixed | ICDAS II 1–6 index | Overall: 593 (81.5%); ICDAS II 1–3: 277 (38.1%); ICDAS II 4–6: 316 (43.4%) | NR | NR | To evaluate the association between sociodemographic factors and caries | 7 |
| Renggli−2021 [45] | Cross-sectional data of a prospective cohort | <2 years | 1 year | Cambodia | 1307 | Primary | dmft index; Anthropometric measures used the WHO Child Growth Standards; Socioeconomic status using Principal Component Analysis; Dietary intake with a 24-h food recall | Overall: 629 (51.9%); <6 months: 15 (10.5%); 6–12 months: 71 (25.5%); 12–18 months: 246 (56.2%); 18–24 months: 297 (66.3%) | Overall: 5.1 (SD: 3.6); Stunted: 2.3 (SD: 3.6); Non-stunted: 5.1 (SD: 3.6) (p = 0.053) | Stunted: 332 (25.4%) | To examine the association between dental caries and the presence of new cases of stunting malnutrition at 1-year follow-up | 8 |
| Ndekero-2021 [46] | Cross-sectional | 4.2 years (SD: 0.7) | None | Tanzania | 831 | Primary | dmft index; Anthropometric measures using WHO child growth standards | Overall: 372 (44.8%); 1–4 decays: 219 (26.4%); >5 decays: 101 (12.2%) | Overall: 2.5 | Stunted: 13 (1.6%); Underweight: 35 (4.2%); Wasted: 248 (29.8%) | To determine the prevalence of dental caries, risk factors and nutritional status | 6 |
| Folayan-2019 [43] | Cross-sectional | 3.7 years (SD: 1.3) | None | Nigeria | 370 | Primary | dmft index; Anthropometric measures using WHO child growth standards; OHI-S; Oral hygiene status (the index of Greene and Vermillion) | Overall: 18 (4.9%); 6–35 months: 0; 36–47 months: 5 (1.4%); 48–59 months: 8 (2.2%); 60–71 months: 5 (1.4%) | Overall: 0.14 (SD: 0.8) | Stunted: 120 (4.9%); Underweight: 20 (5.4%); Wasted: 67 (18.1%); Overweight: 20 (5.4%) | To determine the association between the prevalence of dental caries and malnutrition | 7 |
| Adeniyi-2016 [44] | Cross-sectional | 7.8 years (SD: 1.5) | None | Nigeria | 973 | Mixed | dmft and DMFT index; Anthropometric measures using WHO child growth standards; OHI | Overall: 211 (21.7%); 5 years: 55 (5.7%); 6 years: 162 (16.6%); 7 years: 165 (17%); 8 years: 198 (20.3%); 9 years: 177 (18.2%); 10 years: 216 (22.2%) | Overall: 0.5 (SD: 1.1); 5 years: 0.2 (SD: 0.7); 6 years: 0.5 (SD: 1.3); 7 years: 0.5 (SD: 1.2); 8 years: 0.6 (SD: 1.2); 9 years: 0.6 (SD: 1.1); 10 years: 0.3 (SD: 0.8) | Stunted: 135 (13.9%); Underweight: 132 (13.6%); Wasted: 106 (10.9%) | To determine the association between caries and the nutritional status | 6 |
| Ayele-2013 [48] | Cross-sectional | 7–14 years | None | Ethiopia | 842 | Mixed | dmft and DMFT index | Overall: 306 (36.3%) | NR | NR | To assess the prevalence and associated factors of dental caries | 5 |
| Borges-2012 [42] | Cross-sectional | 4–6 years | None | Brazil | 1993 | Primary | dmft index | Overall: 821 (41.2%) | Overall: 1.5 (SD: 2.6) | NR | To analyze the influence of socio-behavioral factors on the prevalence and severity of dental caries | 5 |
| Saraiva-2007 [39] | Cross-sectional | 2–5 years | None | Brazil | 3189 | Primary | dmft index; Anthropometric measures using WHO child growth standards | Overall: 907 (28.4%); >1: 689 (21.6%) | NR | NR | To assess the association between intrauterine growth restriction and dental caries | 5 |
| Moura-2006 [40] | Cross-sectional data of a prospective cohort | 3–6 years | 0–3 years | Brazil | 343 | Primary | dmft index | Overall: 152 (44.3%) | 2.1 (SD: 1.4) | NR | To evaluate the prevalence of caries in children that participate in a dental program attending mothers and children | 4 |
| Peres-2005 [38] | Prospective cohort | Birth | 12 years | Brazil | 339 | Mixed | dmft and DMFT index; Anthropometric measures using WHO child growth standards | Overall: 176 (51.8%) | Overall: 1.2 (SD: 1.6) | Height for age (HAZ) at 1 year >2 (caries vs. no caries): 149 (84.7%) vs. 154 (94.5%); ≤2 (caries vs. no caries): 23 (13.1%) vs. 5 (3.1%); Height for age (HAZ) at 4 years >2 (caries vs. no caries): 149 (84.7%) vs. 155 (95.1%); ≤2 (caries vs. no caries): 23 (13.1%) vs. 5 (3.1%) | To investigate the relationship between social and biological conditions experienced in very early life | 7 |
| Fraiz-2001 [41] | Cross-sectional data of a prospective cohort | 2.9 years (SD: 0.6) | 1 year | Brazil | 200 | Primary | dmft index | 65 (32.5%) | NR | NR | To investigate the factors associated with the development of dental caries in preschool children who receive regular dental care and follow-up | 6 |
| Author-year | Gender (n, %) | Ever Breastfed (n, %) | Ever Bottle-fed (n, %) | Bottle-Fed at Night (n, %) | Nutritional Patterns (n, %) | Brushing Patterns/Oral Hygiene Status (n, %) | ||||||
|---|---|---|---|---|---|---|---|---|---|---|---|---|
| Pérez-2021 [47] | Caries: 593 | No caries: 135 | Caries: 593 | No caries: 135 | Caries: 593 | No caries: 135 | Caries: 593 | No caries: 135 | Caries: 593 | No caries: 135 | Caries: 593 | No caries: 135 |
| Male: 300 (50.6%); Female: 293 (49.4%) | Male: 71 (52.6%); Female: 64 (47.4%) | NR | NR | NR | Sweets consumption: > Once per day: 357 (60.2%); Seldom/sometimes per week: 236 (39.8%); Soft drinks consumption: > Once per day: 348 (58.7%); Seldom/sometimes per week: 245 (41.3%) | Sweets consumption: > Once per day: 60 (44.4%); Seldom/sometimes per week: 75 (55.6%); Soft drinks consumption: > Once per day: 75 (55.6%); Seldom/sometimes per week: 60 (44.4%) | Brushing frequency: Less than twice daily: 369 (62.2%); Twice or more daily: 224 (37.8%); Oral hygiene: Good: 279 (47%); Poor: 314 (53%) | Brushing frequency: Less than twice daily: 65 (48.2%); Twice or more daily: 70 (51.8%); Oral hygiene: Good: 81 (60%); Poor: 54 (40%) | ||||
| Regnnli-2021 [45] | Caries: 629 | No caries: 678 | NR | NR | NR | Minimum acceptable diet: 640 (49.0%) | NR | |||||
| Male: 316 (50.2%); Female: 313 (49.9%) | Male: 315 (46.5%); Female: 363 (53.5%) | |||||||||||
| Ndekero-2021 [46] | Caries: 372 | No caries: 459 | NR | NR | NR | Caries: 372 | No caries: 459 | Caries: 372 | No caries: 459 | |||
| Male: 185 (49.7%); Female: 187 (50.3%) | Male: 214 (46.6%); Female: 245 (53.4%) | Sugary foods in between meals: 346 (93%); Drink juice or sodas or sugary drinks: 370 (99.5%); Eat fruits: 260 (69.9%) vs. 312 (68%); Eat vegetables: 369 (99.1%) | Sugary foods in between meals: 423 (92.2%); Drink juice or sodas or sugary drinks: 457 (99.6%); Eat fruits: 312 (68%); Eat vegetables: 450 (98%) | Not every day: 11 (3%); Once a day: 275 (73.9%); Twice or more daily: 86 (23.1%) | Not every day: 13 (2.8%); Once a day: 337 (73.4%); Twice or more daily: 106 (23.1%) | |||||||
| Folayan-2019 [43] | Caries: 18 | No caries: 352 | NR | NR | NR | Caries: 18 | No caries: 352 | Caries: 18 | No caries: 352 | |||
| Male: 7 (38.9%); Female: 11 (61.1%) | Male: 196 (55.7%); Female: 156 (44.3%) | ≥3 times daily sugar consumption between meals: 5 (27.7%); <3 times daily sugar consumption between meals: 13 (72.2%) | ≥3 times daily sugar consumption between meals: 55 (15.6%); <3 times daily sugar consumption between meals: 297 (84.4%) | Poor: 0; Fair: 8 (44.4%); Good: 10 (65.6%) | Poor: 8 (2.3%); Fair: 96 (27.3%); Good: 248 (70.5%) | |||||||
| Adeniyi-2016 [44] | Caries: 211 | No caries: 762 | NR | NR | NR | NR | NR | |||||
| Male: 99 (49.9%); Female: 112 (53.1%) | Male: 389 (51%); Female: 373 (49%) | |||||||||||
| Ayele-2013 [48] | Male: 379 (45%); Female: 463 (55%) | NR | NR | NR | Caries: 306 | No caries: 356 | Caries: 306 | No caries: 356 | ||||
| Snack frequency: Thrice/day: 178 (58.1%); Twice/day: 11 (3.6%); Once/day: 81 (26.5%); Occasional: 36 (11.8%); Sweet foods and drinks: 282 (92.2%); Soft drinks: 224 (73.2%); Sugared coffee: 175 (57.2%) | Snack frequency: Thrice/day: 346 (64.5%); Twice/day: 23 (4.3%); Once/day: 116 (21.6%); Occasional: 51 (9.5%); Sweet foods and drinks: 460 (85.8%); Soft drinks: 60 (11.2%); Sugared coffee: 303 (56.5%) | Rinsing mouth: 260 (85%); Cleaning teeth: 120 (39.2%) | Rinsing mouth: 49 (9.1%); Cleaning teeth: 357 (66.6%) | |||||||||
| Borges-2012 [42] | Male: 984 (49.4%) | NR | NR | NR | NR | Caries: 821 | No caries: 1172 | |||||
| Not at all or once a day: 91 (11.1%); Twice or more daily: 676 (82.3%) | Not at all or once a day: 108 (9.2%); Twice or more daily: 1010 (86.2%) | |||||||||||
| Saraiva-2007 [39] | NR | Caries: 907 | No caries: 689 | Caries: 907 | No caries: 689 | NR | Caries: 907 | No caries: 689 | NR | |||
| Yes: 158 (17.4%) | Yes: 133 (19.3%) | ≤19 months: 177 (19.5%); >19 months: 230 (25.4%) | ≤19 months: 96 (14%); >19 months: 134 (19.4%) | Carbohydrate intake: <161 g/day: 212 (23.4%); 161–249.1 g/day: 426 (47%); >249.2 g/day: 259 (28.5%); Sucrose intake: <35 g/day: 178 (19.6%); ≥35 g/day: 267 (29.4%) | Carbohydrate intake: <161 g/day: 130 (18.8%); 161–249.1 g/day: 242 (35.1%); >249.2 g/day; 135 (19.6%); Sucrose intake: <35 g/day: 76 (11%); ≥35 g/day: 90 (13.1%) | |||||||
| Moura-2006 [40] | Male: 169 (49.2%) | NR | NR | NR | Caries: 152 | No caries: 191 | Caries: 152 | No caries: 191 | ||||
| Daily sugar consumption: Always: 83 (54.6%); Sometimes: 64 (42.1%); Never: 4 (2.6%) | Daily sugar consumption: Always: 64 (33.5%); Sometimes: 16 (8.4%); Never: 11 (5.8%) | 1/day: 27 (17.8%); 2/day: 70 (46.1%); ≥3/day: 55 (36.2%); Brushing before going to sleep: Yes: 103 (67.8%); No: 48 (31.6%) | 1/day: 32 (16.8%); 2/day: 82 (42.9%); ≥3/day: 77 (40.3%); Brushing before going to sleep: Yes: 132 (69.1%); No: 59 (30.9%) | |||||||||
| Peres- 2005 [38] | Caries: 176 | No caries: 163 | NR | NR | NR | Caries: 176 | No caries: 163 | Caries: 176 | No caries: 163 | |||
| Male: 98 (55.7%); Female: 77 (43.8%) | Male: 84 (51.5%); Female: 80 (49.1%) | Sweet consumption: Almost never/less than once a day: 54 (30.7%); At least once daily: 121 (68.8%) | Sweet consumption: Almost never/less than once a day: 60 (36.8%); At least once daily: 99 (60.7%) | Brushing frequency: ≥2: 130 (73.9%); <2: 45 (25.6%); Child brushed teeth at emergence of 1st teeth: 39 (2; 2.2%); Child brushed teeth after 1 year: 100 (56.8%) | Brushing frequency: ≥2: 130 (79.8%); <2: 34 (20.9%); Child brushed teeth at emergence of 1st teeth: 59 (36.2%); Child brushed teeth after 1 year: 79 (48.5%) | |||||||
| Fraiz-2001 [41] | NR | NR | Caries: 65 | No caries: 135 | Caries: 65 | No caries: 135 | Caries: 65 | No caries: 135 | NR | |||
| Bottle-fed: 55 (84.6%); Never bottle-fed: 4 (6.2%); No longer bottle-fed: 6 (9.2%) | Bottle-fed: 107 (79.3%); Never bottled-fed: 13 (9.6%); No longer bottle-fed: 15 (11.1%) | Never to sleep: 22 (33.8%); To sleep: 23 (35.4%); Sleeping: 10 (15.4%) Not bottle-fed: 10 (15.4%) | Never to sleep: 78 (57.8%); To sleep: 23 (17%); Sleeping: 6 (4.4%); Not bottle-fed: 28 (20.7%) | Sugar consumption: High: 35 (53.8%); Moderate: 30 (46.2%) | Sugar consumption: High: 31 (23%); Moderate: 104 (77%) | |||||||
| Author-Year | Maternal Age (Years) | Parental Educational Status (n, %) | Help with Child Tooth Brushing (n, %) | Fluoride Toothpaste (n, %) | ||||
|---|---|---|---|---|---|---|---|---|
| Pérez-2021 [47] | NR | Caries: 593 | No caries: 135 | NR | NR | |||
| ≥9 years: 269 (45.4%); <9 years: 324 (54.6%) | ≥9 years: 77 (57%); <9 years: 58 (43%) | |||||||
| Ndekero-2021 [46] | NR | Caries: 372 | No caries: 459 | Caries: 372 | No caries: 459 | Caries: 352 | No caries: 459 | |
| Maternal: Informal and primary education: 272 (73.1%); Secondary education and above: 47 (12.6%); No education: 53 (14.8%) | Maternal: Informal and primary education: 328 (71.5%); Secondary education and above: 58 (12.6%); No education: 73 (15.9%) | Yes: 132 (35.5%) | Yes: 369 (80.4%) | 194 (52.2%) | 235 (51.2%) | |||
| Ayele-2013 [48] | NR | Caries: 306 | No caries: 356 | Caries: 306 | No caries: 356 | NR | ||
| Paternal: Illiterate: 44 (14.4%); Read & write: 38 (12.4%); 1–6 grade: 54 (17.6%); 7–12 grade: 95 (31%); >12th grade: 75 (24.5%) | Paternal: Illiterate: 68 (12.7%); Read & write: 56 (10.4%); 1–6 grade: 71 (13.2%); 7–12 grade: 148 (27.6%); >12th grade: 193 (36%) | Yes: 120 (39.2%); No: 186 (60.8%) | Yes: 357 (66.6%); No: 179 (33.4%) | |||||
| Borges-2012 [42] | NR | Caries: 821 | No caries: 1172 | NR | NR | |||
| Parents: Illiterate: 31 (3.8%); Elementary school: 191 (23.3%); High school: 413 (50.3%) University: 62 (7.6%) | Parents: Illiterate: 17 (1.5%); Elementary school: 211 (18%); High school: 647 (55.2%); University: 126 (10.7%) | |||||||
| Saraiva-2007 [39] | Caries: 907 | No caries: 689 | Caries: 907 | No caries: 689 | NR | Caries: 907 | No caries: 689 | |
| <20 years: 138 (15.2%); 20–29 years: 201 (22.2%); >29 years: 141 (15.5%) | <20 years: 147 (21.4%); 20–29 years: 114 (16.6%); >29 years: 74 (10.7%) | Maternal: >12 years of education: 181 (19.9%); 12 years: 235 (25.9%); <12 years: 331 (36.5%) | Maternal: >12 years of education: 85 (12.4%); 12 years: 132 (19.2%); <12 years: 205 (29.7%) | 244 (26.9%) | 132 (19.1%) | |||
| Moura-2006 [40] | NR | NR | Caries: 152 | No caries: 191 | NR | |||
| Yes: 129 (84.9%) | Yes: 160 (83.8%) | |||||||
| Peres- 2005 [38] | NR | Caries: 176 | No caries: 163 | NR | NR | |||
| Maternal: ≥8 years of education: 74 (42.3%); <8 years of education: 100 (56.6%); Paternal: ≥8 years of education: 33 (18.8%); <8 years of education: 147 (83.5%) | Maternal: ≥8 years of education: 41 (25.2%); <8 years of education: 113 (69.3%); Paternal: ≥8 years of education: 45 (27.6%); <8 years of education: 79 (48.5%) | |||||||
| Fraiz-2001 [41] | 26.3 years (SD: 5.1) | Caries: 65 | No caries: 135 | NR | NR | |||
| Maternal: ≤8: 25 (38.5%); >8: 40 (61.5%); Paternal: ≤8: 28 (43.1%); >8: 32 (49.2%) | Maternal: ≤8: 35 (25.9%); >8: 100 (74.1%); Paternal: ≤8: 37 (27.4%); >8: 87 (64.4%) | |||||||
| Author-Year | SES (n, %) | Setting (n, %) | Access to/Visited Dental Services (n, %) | Additional Comments | ||||
|---|---|---|---|---|---|---|---|---|
| Pérez-2021 [47] | Caries: 593 | No caries: 135 | Public schools | Caries: 593 | No caries: 135 | - | ||
| SES: Low: 312 (52.6%); Middle: 182 (30.7%); High: 99 (16.7%) | SES: Low: 51 (37.8%); Middle: 53 (39.2%); High: 31 (23%) | Yes: 260 (43.8%) | Yes: 74 (54.8%) | |||||
| Regnnli-2021 [45] | Caries: 629 | No caries: 678 | Caries: 629 | No caries: 678 | NR | - | ||
| SES: Lowest: 118 (9%); Low: 135 (10.3); Medium: 171 (13.1%); High: 115 (8.8%); Highest: 90 (6.8%) | SES: Lowest: 102 (7.8%); Low: 130 (9.9%); Medium: 222 (16.9%); High: 100 (7.6%); Highest: 124 (9.5%) | Rural: 476 (36.4); Urban: 153 (11.7) | Rural: 512 (39.2%); Urban: 166 (12.7%) | |||||
| Ndekero-2021 [46] | NR | Caries: 372 | No caries: 459 | NR | Caries: 372 | No caries: 459 | ||
| Rural: 315 (84.7%) vs. 346 (75.4%); Semi-rural: 57 (15.3%) vs. 113 (24.6%) | Rural: 346 (75.4%); Semi-rural: 113 (24.6%) | Siblings present: 321 (86.3%); Mother’s not formally employed: 358 (96.2%); Difficulty in purchasing food for child due to costs: 122 (32.8%) | Siblings present: 403 (87.8%); Mother’s not formally employed: 35 (7.6%); Difficulty in purchasing food for the child due to costs: 156 (34%) | |||||
| Folayan-2019 [43] | Caries: 18 | No caries: 352 | Peri-urban households | NR | Mean oral hygiene score: 1.1 (SD: 1.2) ~ good | |||
| Low: 8 (44.4%); Middle: 4 (22.2%); High: 6 (33.3%) | Low: 118 (33.5%); Middle: 157 (44.6%); High: 77 (21.9%) | |||||||
| Adeniyi-2016 [44] | NR | Caries: 211 | No caries: 762 | Yes: 155 (15.9%); No: 818 (84.1%) | OHI: 0.4 (SD: 1.1) ~ good: 608 (62.5%); 0.6 (SD = 1.2) ~ fair: 365 (37.5%) | |||
| Public school: 56 (26.5%); Private school: 55 (26.1%) | Public school: 505 (66.3%); Private school: 257 (33.7%) | |||||||
| Ayele-2013 [48] | Caries: 306 | No caries: 356 | Rural and urban households | NR | - | |||
| <28 USD: 157 (51.3%); 29–56 USD: 93 (30.4%); 57–84 USD: 20 (6.5%); 85–112 USD: 24 (7.8%); 113–167 USD: 8 (2.6%); >168 USD: 4 (1.3%) | <28 USD: 206 (38.4%); 29–56 USD: 146 (27.2%); 57–84 USD: 46 (8.6%); 85–112 USD: 69 (12.9%); 113–167 USD: 38 (7.1%); >168 USD: 31 (5.8%) | |||||||
| Borges-2012 [42] | Caries: 821 | No caries: 1172 | Public preschools | Caries: 821 | No caries: 1172 | - | ||
| <1 minimum wage: 84 (10.2%); 1–1.9 minimum wage: 366 (44.6%); 2–2.9 minimum wage: 163 (19.9%); ≥ 3 minimum wage: 106 (12.9%) | <1 minimum wage: 82 (7%); 1–1.9 minimum wage: 456 (38.9%); 2–2.9 minimum wage: 241 (20.6%); ≥ 3 minimum wage: 234 (20%) | Yes: 552 (67.2%); No: 265 (32.3%) | Yes: 659 (56.2%); No: 512 (43.7%) | |||||
| Saraiva-2007 [39] | Caries: 907 | No caries: 689 | NR | Caries: 907 | No caries: 689 | Caries: 907 | No caries: 689 | |
| Poverty ratio: >3.5: 93 (10.3%); 1.301–3.5: 201 (22.2%); <1.301: 314 (34.6%) | Poverty ratio: >3.5: 48 (7.7%); 1.3–3.5: 110 (16%); <1.3: 201 (29.2%) | Yes: 570 (62.8%) | 331 (48.1%) | Passive smoking: 483 (53.2%) | Passive smoking: 280 (40.7%) | |||
| Moura-2006 [40] | NR | Clinic | Caries: 152 | No caries: 191 | Data were obtained at follow-up after participation in the Preventive Program for Pregnant Mothers and Babies whose goals are to recover and maintain oral health in pregnant women and children aged 0–3 years | |||
| 1–6 months ago: 65 (42.8%); 6–12 months ago: 29 (19.1%); Over 12 months ago: 57 (37.5%) | 1–6 months ago: 62 (32.5%); 6–12 months ago: 44 (23%); Over 12 months ago: 85 (44.5%) | |||||||
| Peres- 2005 [38] | Caries: 176 | No caries: 163 | Caries: 176 | No caries: 163 | The same participants were followed at 6 and 12 years of age and caries are reported for the second follow-up at age 12; Piped water supply: Yes: 143 (81.3%) vs. 141 (86.5%); No: 30 (17%) vs. 21 (12.9%); Adequate birth weight and gestational age: Yes: 30 (17%) vs. 20 (12.3%); No: 113 (64.2%) vs. 116 (71.7%) | |||
| Income: 1st quartile: 40 (22.7%); 2nd quartile: 41 (23.3%); 3rd quartile: 46 (26.1%); 4th quartile: 44 (25%); Social class: Employers/Professional: 30 (17%); Skilled workers: 119 (67.6%); Unskilled workers: 11 (6.3%) | Income: 1st quartile: 42 (25.8%); 2nd quartile: 40 (24.5%); 3rd quartile: 36 (22.1%); 4th quartile: 42 (25.8%); Social class: Employers/Professional: 41 (25.2%); Skilled workers: 99 (60.7%); Unskilled workers: 6 (3.7%) | Urban households | Yes: 85 (48.3%); No: 90 (51.1%) | Yes: 72 (44.2%); No: 92 (56.4%) | ||||
| Fraiz-2001 [41] | NR | Clinic | NR | Children aged 1–2 years and mothers, who had already taken part in a dental program at a clinic during, at least, the previous twelve months were enrolled | ||||
Publisher’s Note: MDPI stays neutral with regard to jurisdictional claims in published maps and institutional affiliations. |
© 2022 by the authors. Licensee MDPI, Basel, Switzerland. This article is an open access article distributed under the terms and conditions of the Creative Commons Attribution (CC BY) license (https://creativecommons.org/licenses/by/4.0/).
Share and Cite
Yousaf, M.; Aslam, T.; Saeed, S.; Sarfraz, A.; Sarfraz, Z.; Cherrez-Ojeda, I. Individual, Family, and Socioeconomic Contributors to Dental Caries in Children from Low- and Middle-Income Countries. Int. J. Environ. Res. Public Health 2022, 19, 7114. https://0-doi-org.brum.beds.ac.uk/10.3390/ijerph19127114
Yousaf M, Aslam T, Saeed S, Sarfraz A, Sarfraz Z, Cherrez-Ojeda I. Individual, Family, and Socioeconomic Contributors to Dental Caries in Children from Low- and Middle-Income Countries. International Journal of Environmental Research and Public Health. 2022; 19(12):7114. https://0-doi-org.brum.beds.ac.uk/10.3390/ijerph19127114
Chicago/Turabian StyleYousaf, Madiha, Tahir Aslam, Sidra Saeed, Azza Sarfraz, Zouina Sarfraz, and Ivan Cherrez-Ojeda. 2022. "Individual, Family, and Socioeconomic Contributors to Dental Caries in Children from Low- and Middle-Income Countries" International Journal of Environmental Research and Public Health 19, no. 12: 7114. https://0-doi-org.brum.beds.ac.uk/10.3390/ijerph19127114