
Test of Gross Motor Development-3: Item Difficulty and Item Differential Functioning by Gender and Age with Rasch Analysis

 , and
, and
Abstract
:1. Introduction
2. Materials and Methods
2.1. Participants
2.2. Instrument
2.3. Procedures
2.4. Data Analysis
3. Results
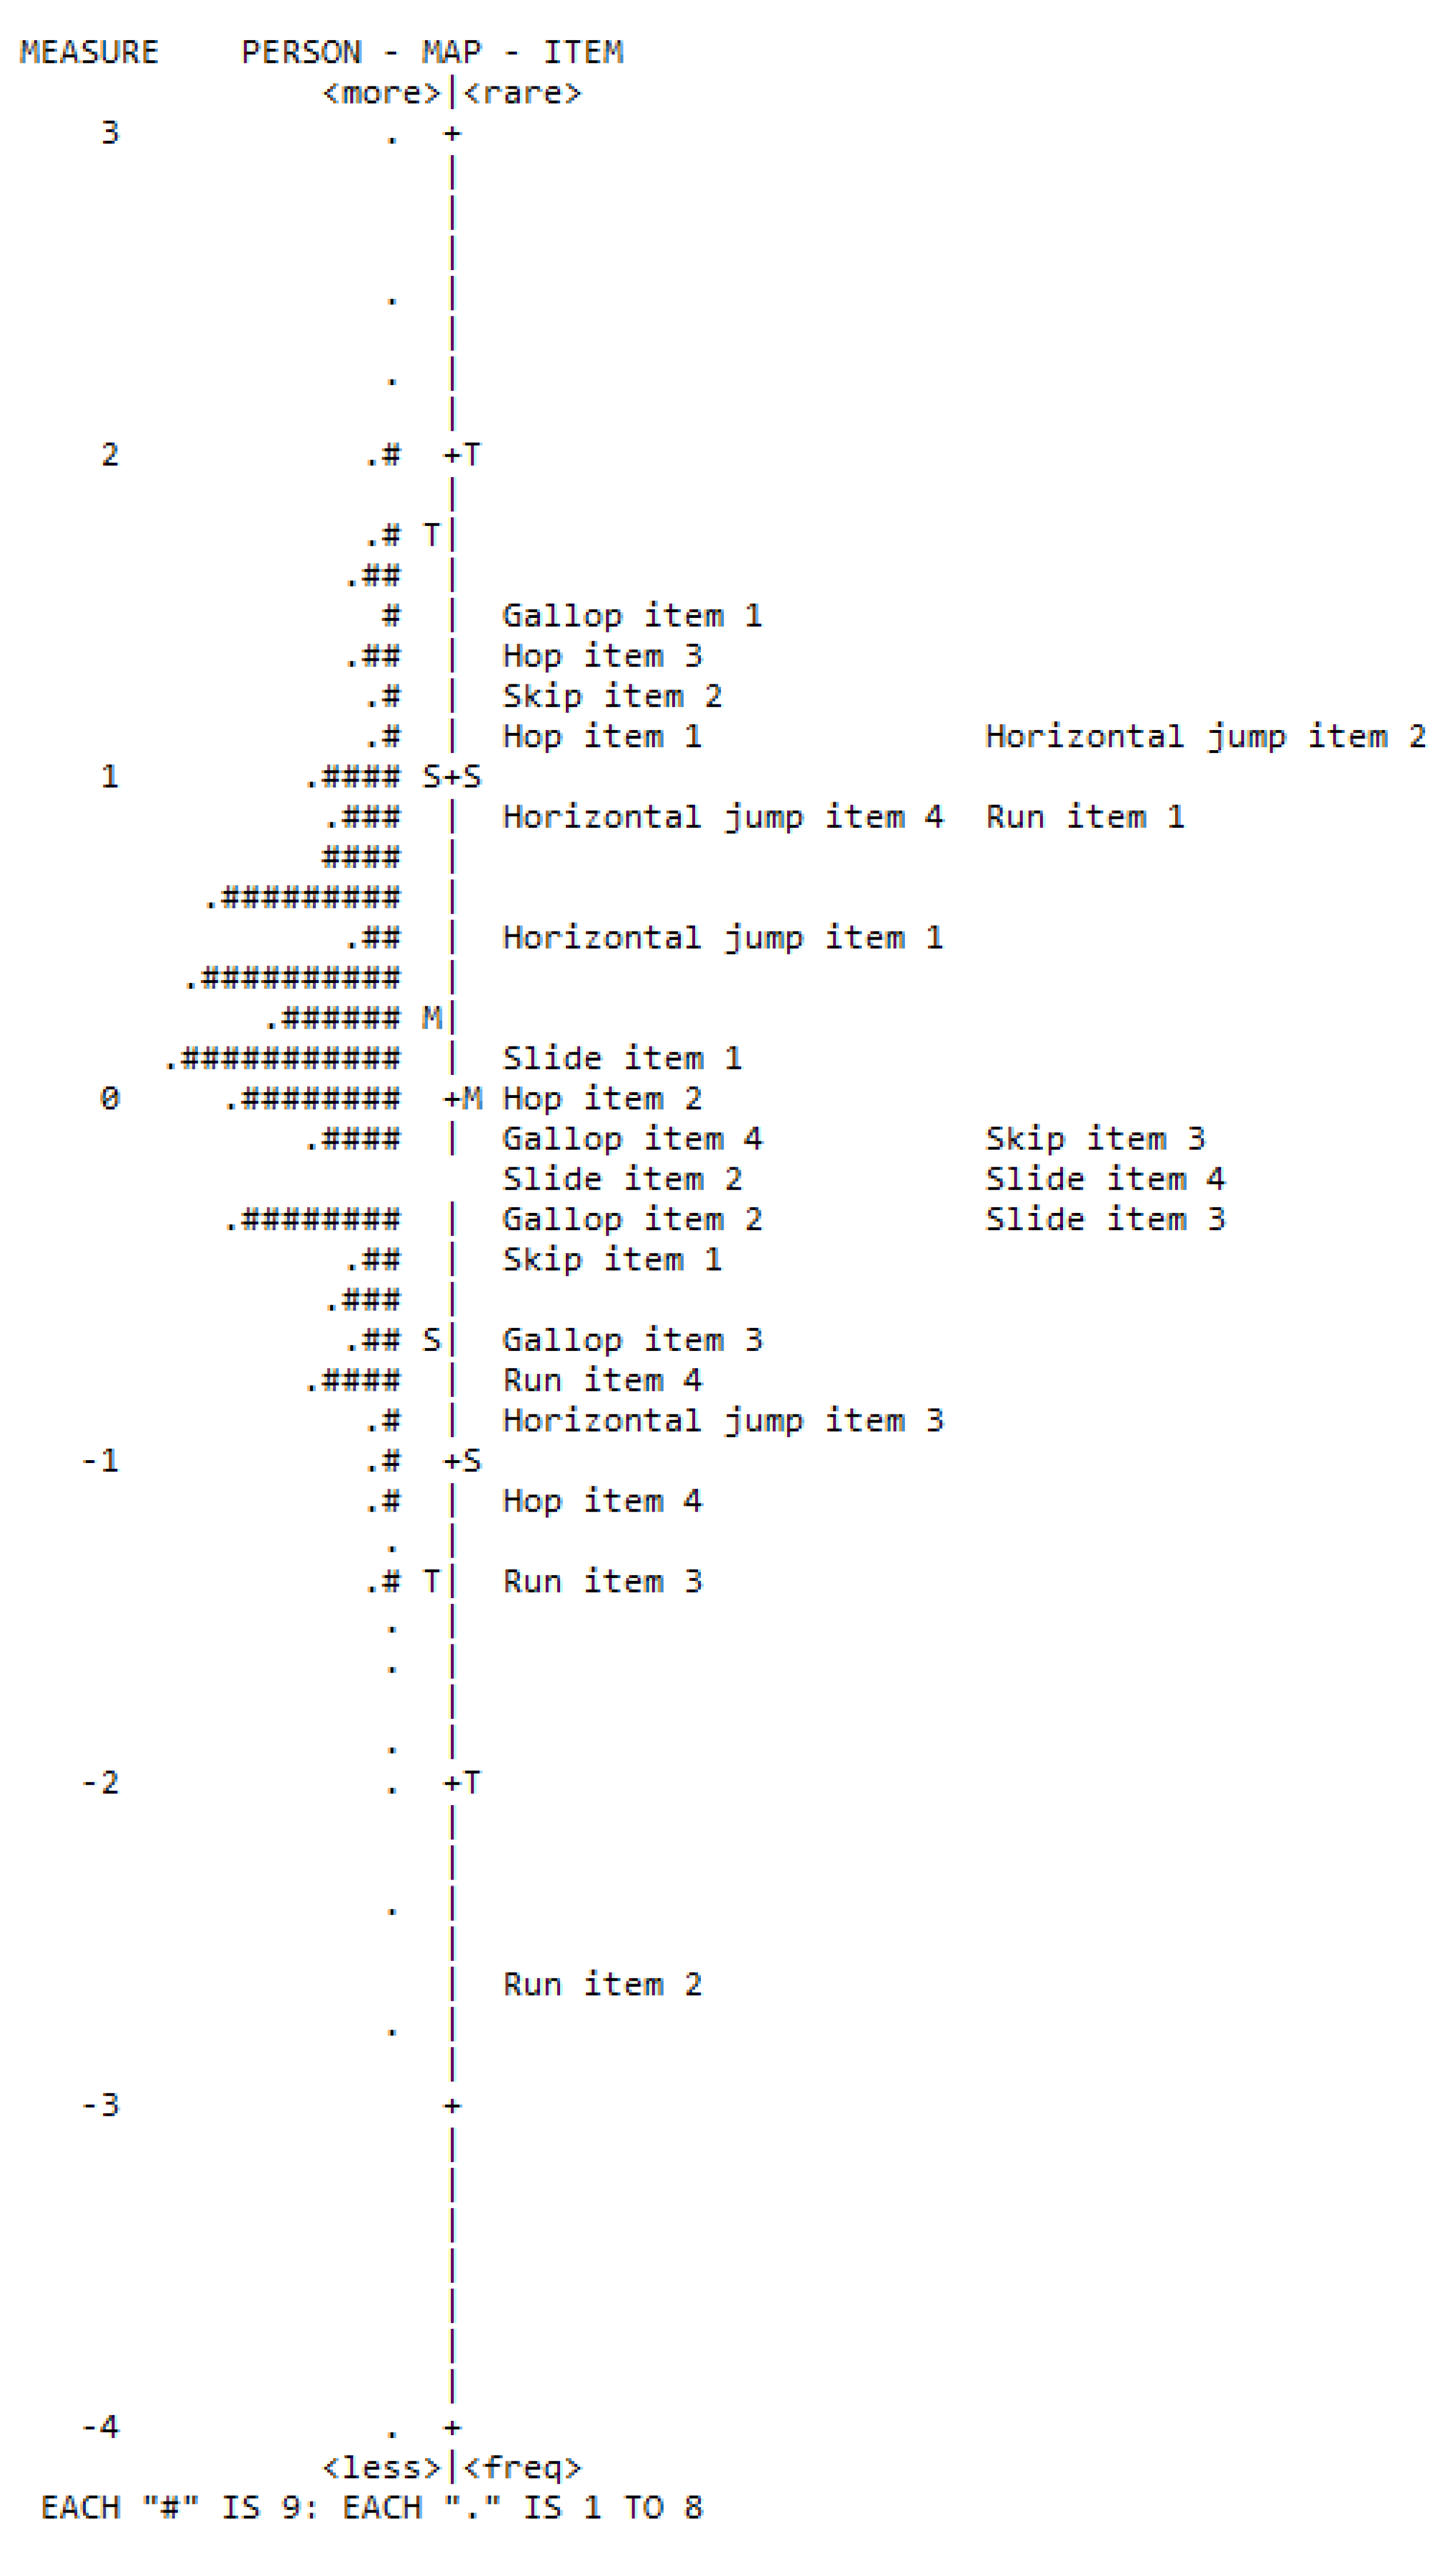
3.1. Locomotor
3.2. Ball Skills
3.3. Differential Item Functioning: Gender and Age Groups
4. Discussion
4.1. Differential Item Functioning between Gender and among Age Groups
4.2. Implications
4.3. Strength
4.4. Limitations
4.5. Future Directions
5. Conclusions
Supplementary Materials
Author Contributions
Funding
Institutional Review Board Statement
Informed Consent Statement
Data Availability Statement
Conflicts of Interest
References
- Goodway, J.D.; Ozmun, J.C.; Gallahue, D.L. Understanding Motor Development: Infants, Children, Adolescents, Adults; Jones & Bartlett Learning: Burlington, MA, USA, 2019. [Google Scholar]
- Logan, S.W.; Ross, S.M.; Chee, K.; Stodden, D.F.; Robinson, L.E. Fundamental motor skills: A systematic review of terminology. J. Sports Sci. 2018, 36, 781–796. [Google Scholar] [CrossRef] [PubMed]
- Burton, A.; Miller, D.E. Movement Skill Assessment; Human Kinetics: Champaign, IL, USA, 1998. [Google Scholar]
- Tamplain, P.; Webster, E.K.; Brian, A.; Valentini, N.C. Assessment of motor development in childhood: Contemporary issues, considerations, and future directions. JMLD 2020, 8, 391–409. [Google Scholar] [CrossRef]
- Valentini, N.C.; Clark, J.E.; Whitall, J. Developmental co-ordination disorder in socially disadvantaged Brazilian children. Child Care Health Dev. 2014, 41, 970–979. [Google Scholar] [CrossRef] [PubMed]
- Ulrich, D.A. Test of Gross Motor Development—Third Edition: Examiner’s Manual, 3rd ed.; PRO-ED: Austin, TX, USA, 2019. [Google Scholar]
- Berleze, A.; Valentini, N.C. Intervention for children with obesity and overweight and motor delays from low-income families: Fostering engagement, motor development, self-perceptions, and playtime. Int. J. Environ. Res. Public Health 2022, 19, 2545. [Google Scholar] [CrossRef] [PubMed]
- Kokstejn, J.; Musalek, M.; Wolanski, P.; Murawska-Cialowicz, E.; Stastny, P. Fundamental Motor Skills Mediate the Relationship Between Physical Fitness and Soccer-Specific Motor Skills in Young Soccer Players. Front. Physiol. 2019, 10, 596. [Google Scholar] [CrossRef] [Green Version]
- Píffero, C.M.; Valentini, N.C. Habilidades especializadas do tênis: Um estudo de intervenção na iniciação esportiva com crianças escolares. Rev. Bras. Educ. Fís. Esp. 2010, 24, 149–163. [Google Scholar] [CrossRef] [Green Version]
- Bolger, L.E.; Bolger, L.A.; O’Neill, C.; Coughlan, E.; O’Brien, W.; Lacey, S.; Bardid, F. Global levels of fundamental motor skills in children: A systematic review. J. Sports Sci. 2021, 39, 717–753. [Google Scholar] [CrossRef]
- Webster, E.K.; Ulrich, D.A. Evaluation of the psychometric properties of the test of gross motor development—Third edition. J. Mot. Learn. Dev. 2017, 5, 45–58. [Google Scholar] [CrossRef]
- Garn, A.C.; Webster, E.K. Bifactor structure and model reliability of the Test of Gross Motor Development—3rd edition. J. Sci. Med. Sport 2021, 24, 67–73. [Google Scholar] [CrossRef]
- Valentini, N.C.; Zanella, L.W.; Webster, E.K. Test of Gross Motor Development—Third Edition: Establishing Content and Construct Validity for Brazilian Children. J. Mot. Learn. Dev. 2017, 5, 15–28. [Google Scholar] [CrossRef]
- Valentini, N.C.; Nobre, G.C.; Zanella, L.W.; Pereira, K.G.; Albuquerque, M.R.; Rudisill, M.E. Test of Gross Motor Development–3 Validity and Reliability: A Screening Form. J. Mot. Learn. Dev. 2021, 9, 438–455. [Google Scholar] [CrossRef]
- Wagner, M.O.; Webster, E.K.; Ulrich, D. Psychometric properties of the test of gross motor development, (German translation): Results of a pilot study. J. Mot. Learn. Dev. 2017, 5, 29–44. [Google Scholar] [CrossRef]
- Mohammadi, F.; Bahram, A.; Khalaji, H.; Ghadiri, F. Determining Motor Development Status of 3–10 Year Old Children in Ahvaz City Using TGMD-3 Test. Int. J. Bas. Sci. Med. 2017, 2, 139–146. [Google Scholar] [CrossRef] [Green Version]
- Mohammadi, F.; Bahram, A.; Khalaji, H.; Ulrich, D.A.; Ghadiri, F. Evaluation of the psychometric properties of the Persian version of the test of gross motor development–3rd edition. J. Mot. Learn. Dev. 2019, 7, 106–121. [Google Scholar] [CrossRef]
- Mehmedinović, S.; Bratovčić, V.; Kuduzović, E.; Avdić, B.; Kožljak, L. Metric characteristics of the test of gross motor development (tgmd 3). Res. Educ. 2021, 2, 146–155. [Google Scholar] [CrossRef]
- Estevan, I.; Molina-García, J.; Queralt, A.; Álvarez, O.; Castillo, I.; Barnett, L. Validity and reliability of the Spanish version of the test of gross motor development–3. J. Mot. Learn. Dev. 2017, 5, 69–81. [Google Scholar] [CrossRef]
- Magistro, D.; Piumatti, G.; Carlevaro, F.; Sherar, L.B.; Esliger, D.W.; Bardaglio, G.; Musella, G. Psychometric proprieties of the Test of Gross Motor Development–Third Edition in a large sample of Italian children. J. Sci. Med. Sport 2020, 23, 860–865. [Google Scholar] [CrossRef]
- Maiano, C.; Morin, A.J.; April, J.; Webster, E.K.; Hue, O.; Dugas, C.; Ulrich, D. Psychometric Properties of a French-Canadian Version of the Test of Gross Motor Development-(TGMD-3): A Bifactor Structural Equation Modeling Approach. Meas. Phys. Educ. Exerc. Sci. 2022, 26, 51–62. [Google Scholar] [CrossRef]
- Magistro, D.; Piumatti, G.; Carlevaro, F.; Sherar, L.B.; Esliger, D.W.; Bardaglio, G.; Musella, G. Measurement invariance of TGMD-3 in children with and without mental and behavioral disorders. Psychol. Asses. 2018, 30, 1421. [Google Scholar] [CrossRef] [Green Version]
- Duncan, M.J.; Martins, C.; Ribeiro, P.F.R.; Issartel, J.; Peers, C.; Belton, S.; Behan, S. TGMD-3 short version: Evidence of validity and associations with sex in Irish children. J. Sports Sci. 2022, 40, 138–145. [Google Scholar] [CrossRef]
- Carballo-Fazanes, A.; Rey, E.; Valentini, N.C.; Rodríguez-Fernández, J.E.; Varela-Casal, C.; Rico-Díaz, J.; Barcala-Furelos, R.; Abelairas-Gómez, C. Intra-Rater (Live vs. Video Assessment) and Inter-Rater (Expert vs. Novice) Reliability of the Test of Gross Motor Development—Third Edition. Int. J. Environ. Res. Public Health 2021, 18, 1652. [Google Scholar] [CrossRef] [PubMed]
- Maeng, H.; Webster, E.K.; Pitchford, E.A.; Ulrich, D.A. Inter- and Intrarater Reliabilities of the Test of Gross Motor Development-Third Edition Among Experienced TGMD-2 Raters. Adapt. Phys. Act. Q. 2017, 34, 442–455. [Google Scholar] [CrossRef] [PubMed]
- Griffiths, G.; Billard, R. The fundamental movement skills of a year 9 group and a gifted and talented cohort. APE 2013, 3, 215–220. [Google Scholar] [CrossRef] [Green Version]
- Spessato, B.C.; Gabbard, C.; Valentini, N.C.; Rudisill, M. Gender differences in Brazilian children’s fundamental movement skill performance. Early Child Dev. Care 2013, 183, 916–923. [Google Scholar] [CrossRef]
- Venetsanou, F.; Kambas, A. Motor proficiency in young children: A closer look at potential gender differences. SAGE Open 2016, 6, 2158244015626226. [Google Scholar] [CrossRef] [Green Version]
- Fredricks, J.A.; Eccles, J.S. Children’s competence and value beliefs from childhood through adolescence: Growth trajectories in two male-sex-typed domains. Dev. Psychol. 2002, 38, 519. [Google Scholar] [CrossRef]
- Larson, J.C.; Mostofsky, S.H.; Goldberg, M.C.; Cutting, L.E.; Denckla, M.B.; Mahone, E.M. Effects of gender and age on motor exam in typically developing children. Dev. Neuropsyc. 2007, 32, 543–562. [Google Scholar]
- Brasil, C.D.C.E.; Filiadas, B.E. ABEP: Associação Brasileira de Empresas de Pesquisa. Available online: http://www.abep.org (accessed on 20 November 2020).
- Linacre, J.M. Investigating Rating Scale Category Utility. J. Outcome Meas. 1999, 3, 103–122. [Google Scholar]
- Linacre, J.M. What do Infit and Outfit, Mean-square and Standardized mean? Rasch Meas. Trans. 2002, 16, 878. [Google Scholar]
- Walter, S.D.; Eliasziw, M.; Donner, A. Sample size and optimal designs for reliability studies. Stat. Med. 1998, 17, 101–110. [Google Scholar] [CrossRef]
- Statistical Package for the Social Sciences for Windows, Version 22.0. SPSS Inc.: Chicago, IL, USA, 2020.
- Hambleton, R.K.; Swaminathan, H. Item Response Theory: Principles and Applications; Kuwer Nijhoff Publishing: Leiden, Belgium, 2010. [Google Scholar]
- Andrich, D. A rating formulation for ordered response categories. Psychometrika 1978, 43, 561–573. [Google Scholar]
- Wright, B.D.; Linacre, J.M. Reasonable mean-square fit values. Rasch Meas. Trans. 1994, 8, 370. [Google Scholar]
- Tavakol, M.; Dennick, R. Psychometric evaluation of a knowledge-based examination using Rasch analysis: An illustrative guide: AMEE Guide No. 72. Med. Teach. 2013, 35, e838–e848. [Google Scholar] [PubMed] [Green Version]
- Allen, M.J.; Yen, W.M. Introduction to Measurement Theory; Waveland Press Inc.: Prospect Heights, IL, USA, 1979. [Google Scholar]
- Walker, C.M. What’s the DIF? Why differential item functioning analyses are an important part of instrument development and validation. J. Psychoed. Assess. 2011, 29, 364–376. [Google Scholar]
- Linacre, J.M. A User’s Guide to WINSTEPS, MINISTEP Rasch-Model Computer Programs. Available online: http://www.winsteps.com/winman/index.htm?copyright.htm (accessed on 5 April 2022).
- R Core Team. R: A Language and Environment for Statistical Computing; R Foundation for Statistical Computing: Vienna, Austria; Available online: http://www.R-project.org/ (accessed on 14 March 2022).
- Revelle, W. Psych: Procedures for Personality and Psychological Research. Available online: http://cran.r-project.org/package=psych (accessed on 3 March 2022).
- Rosseel, Y. lavaan: An R package for structural equation modeling. J. Stat. Softw. 2012, 48, 1–36. [Google Scholar]
- Linacre, J.M. KR-20/Cronbach Alpha or Rasch Person Reliability: Which Tells the “Truth”? Rasch Meas. Trans. 1997, 11, 580–581. [Google Scholar]
- Bach, M.M.; Daffertshofer, A.; Dominici, N. The development of mature gait patterns in children during walking and running. Eur. J. Appl. Physiol. 2021, 121, 1073–1085. [Google Scholar] [CrossRef]
- Dewolf, A.H.; Sylos-Labini, F.; Cappellini, G.; Lacquaniti, F.; Ivanenko, Y. Emergence of different gaits in infancy: Relationship between developing neural circuitries and changing biomechanics. Front. Bioeng. Biotechnol. 2020, 8, 473. [Google Scholar]
- Schepens, B.; Willems, P.A.; Cavagna, G.A. The mechanics of running in children. J. Physiol. 1998, 509, 927–940. [Google Scholar]
- Bruening, D.A.; Pohl, M.B.; Takahashi, K.Z.; Barrios, J.A. Midtarsal locking, the windlass mechanism, and running strike pattern: A kinematic and kinetic assessment. J. Biomech. 2018, 73, 185–191. [Google Scholar]
- Cheung, R.T.; Davis, I.S. Landing pattern modification to improve patellofemoral pain in runners: A case series. J. Orthopaed. Sports Phys. 2011, 41, 914–919. [Google Scholar] [CrossRef] [PubMed]
- Deschamps, K.; Eerdekens, M.; Desmet, D.; Matricali, G.A.; Wuite, S.; Staes, F. Estimation of foot joint kinetics in three and four segment foot models using an existing proportionality scheme: Application in paediatric barefoot walking. J. Biomech. 2017, 61, 168–175. [Google Scholar] [CrossRef] [PubMed]
- Deprá, P.P.; Vieira, L.F.; Chinaglia, M.P. A abordagem desenvolvimentista do caminhar. J. Phys. Educ. 2017, 21, 37–46. [Google Scholar] [CrossRef]
- Mihajlović, I.; Tončev, I.; Hmjelovec, I. Prevalence of flatfoot deformity in boys depending on their age. Acta Kinesiol. 2008, 2, 103–106. [Google Scholar]
- Pfeiffer, M.; Kotz, R.; Ledl, T.; Hauser, G.; Sluga, M. Prevalence of flat foot in preschool-aged children. Pediatrics 2006, 118, 634–639. [Google Scholar] [CrossRef] [PubMed]
- Cordazzo, S.T.D.; Vieira, M.L. Caracterização de brincadeiras de crianças em idade escolar. Psicol. Reflex E Crít. 2008, 21, 365–373. [Google Scholar] [CrossRef]
- Gallahue, D.L.; Donnelly, F.C. Educação Física Desenvolvimentista Para Todas as Crianças, 4th ed.; Phorte: São Paulo, Brasil, 2007. [Google Scholar]
- Santos, A.K.; Dias, A. Comportamentos lúdicos entre crianças do nordeste do Brasil: Categorização de brincadeiras. Psicol. Teor. E Pesq. 2010, 26, 585–594. [Google Scholar] [CrossRef] [Green Version]
- Franchi, S. Jogos tradicionais/populares como conteúdo da cultura corporal na Educação Física escolar. Motriviv 2013, 40, 168–177. [Google Scholar] [CrossRef]
- Molon, S.I.; Albuquerque, A.S. Brincadeiras, atividades e interações das crianças do primeiro ano do ensino fundamental. Rev. Educ. PUC-Camp. 2012, 17, 55–63. [Google Scholar]
- Corrêa, M.M.L.; Freitas, T.C.R.; Silva, S.A. O ensino dos esportes de raquete no ambiente escolar. Cad De Educ. Fís. E Esp. 2019, 17, 309–316. [Google Scholar] [CrossRef]
- Mortari, J.A.; Sagrillo, D.R. O ensino do tênis de campo na educação física escolar. Braz. J. Dev. 2021, 7, 33559–33568. [Google Scholar] [CrossRef]
- de Brouwer, A.J.; Flanagan, J.R.; Spering, M. Functional use of eye movements for an acting system. Trends Cogn. Sci. 2021, 25, 252–263. [Google Scholar] [CrossRef] [PubMed]
- Mello, J.; Pedretti, A.; Caporal, G.; Mahique, J.; Ferreira, A.; Reppold-Filho, A.; Gaya, A. Secular trend of sports practice of Brazilian children and young people in the decade of mega-sport events. J. Hum. Sport Exerc. 2020, 17, 1–9. [Google Scholar] [CrossRef]


| Characteristics of Participants | N = 989 n (%) |
|---|---|
| Gender | |
| Boys | 498 (50.65) |
| Girls | 491 (49.64) |
| Age (in years) | |
| 3 | 37 (3.74) |
| 4 | 115 (11.62) |
| 5 | 167 (16.88) |
| 6 | 131 (13.25) |
| 7 | 128 (12.95) |
| 8 | 128 (12.95) |
| 9 | 158 (15.97) |
| 10 | 125 (12.64) |
| Schools | |
| Private schools | 80 (8.09) |
| Public schools | 909 (91.91) |
| Children’s educational level | |
| Pre-school | 310 (31.34) |
| Fundamental school | 679 (68.66) |
| Socioeconomic status | |
| High | 98 (9.90) |
| Middle | 296 (29.92) |
| Middle-low and poor | 595 (60.18) |
| Skills | Item | Response Categories (%) | Difficulty | Infit | Outfit | Point-Biserial | ||
|---|---|---|---|---|---|---|---|---|
| 0 | 1 | 2 | ||||||
| Run | 1 | 63.3 | 12.1 | 24.6 | 0.83 | 0.96 | 1.08 | 0.47 |
| 2 | 2.0 | 1.4 | 96.6 | −2.45 | 1.04 | 1.51 * | 0.29 | |
| 3 | 10.3 | 2.9 | 86.8 | −1.27 | 1.45 | 3.82 * | 0.14 | |
| 4 | 17.1 | 11.2 | 71.7 | −0.78 | 1.24 | 1.79 * | 0.29 | |
| Gallop | 1 | 81.7 | 6.8 | 11.5 | 1.50 | 0.87 | 0.88 | 0.46 |
| 2 | 29.1 | 13.4 | 57.4 | −0.27 | 1.19 | 1.48 | 0.35 | |
| 3 | 19.8 | 10.2 | 70.0 | −0.67 | 1.01 | 1.08 | 0.46 | |
| 4 | 31.0 | 14.0 | 55.0 | −0.20 | 1.05 | 1.24 | 0.44 | |
| Hop | 1 | 75.6 | 4.1 | 20.2 | 1.09 | 0.76 | 0.68 | 0.56 |
| 2 | 38.6 | 12.9 | 48.4 | 0.04 | 1.00 | 0.98 | 0.49 | |
| 3 | 80.6 | 5.0 | 14.5 | 1.35 | 0.75 | 0.64 | 0.54 | |
| 4 | 12.7 | 7.7 | 79.6 | −1.05 | 0.99 | 1.37 | 0.42 | |
| Skip | 1 | 29.0 | 6.8 | 64.2 | −0.35 | 0.88 | 0.83 | 0.55 |
| 2 | 78.9 | 2.8 | 18.3 | 1.19 | 0.80 | 0.68 | 0.54 | |
| 3 | 35.0 | 7.3 | 57.7 | −0.15 | 0.98 | 1.14 | 0.49 | |
| Jump | 1 | 49.5 | 16.6 | 33.9 | 0.44 | 0.88 | 0.82 | 0.56 |
| 2 | 67.0 | 18.8 | 14.2 | 1.21 | 1.08 | 1.06 | 0.38 | |
| 3 | 12.7 | 15.6 | 71.7 | −0.96 | 1.19 | 1.47 | 0.32 | |
| 4 | 67.0 | 9.2 | 23.8 | 0.89 | 0.87 | 0.84 | 0.53 | |
| Slide | 1 | 39.2 | 20.6 | 40.1 | 0.17 | 1.14 | 1.34 | 0.38 |
| 2 | 34.1 | 15.4 | 50.6 | −0.08 | 0.90 | 0.90 | 0.55 | |
| 3 | 27.4 | 14.2 | 58.4 | −0.32 | 0.84 | 0.78 | 0.58 | |
| 4 | 31.7 | 15.5 | 52.8 | −0.15 | 0.83 | 0.80 | 0.58 | |
| Skills | Item | Response Categories (%) | Difficulty | Infit | Outfit | Point-Biserial | ||
|---|---|---|---|---|---|---|---|---|
| 0 | 1 | 2 | ||||||
| Two-handstrike | 1 | 30.2 | 8.0 | 61.8 | −0.49 | 1.13 | 1.19 | 0.35 |
| 2 | 47.6 | 13.7 | 38.7 | 0.11 | 1.16 | 1.24 | 0.35 | |
| 3 | 51.3 | 16.4 | 32.4 | 0.27 | 0.89 | 0.87 | 0.54 | |
| 4 | 62.7 | 14.5 | 22.9 | 0.63 | 0.93 | 0.94 | 0.50 | |
| 5 | 11.3 | 35.3 | 53.4 | −0.95 | 1.07 | 1.13 | 0.30 | |
| One-handstrike | 1 | 57.3 | 10.3 | 32.4 | 0.35 | 0.96 | 0.89 | 0.50 |
| 2 | 66.7 | 10.2 | 23.1 | 0.67 | 0.79 | 0.73 | 0.59 | |
| 3 | 54.7 | 19.1 | 26.2 | 0.45 | 0.81 | 0.77 | 0.59 | |
| 4 | 81.4 | 4.9 | 13.8 | 1.13 | 0.90 | 0.70 | 0.49 | |
| One-handdribble | 1 | 71.1 | 10.9 | 18.0 | 0.87 | 1.02 | 0.97 | 0.43 |
| 2 | 50.4 | 6.4 | 43.3 | 0.07 | 0.89 | 0.84 | 0.55 | |
| 3 | 62.7 | 14.9 | 22.4 | 0.64 | 0.85 | 0.76 | 0.56 | |
| Two-handCatch | 1 | 15.9 | 5.2 | 79.0 | −1.05 | 1.26 | 3.48 * | 0.06 |
| 2 | 8.5 | 8.6 | 82.9 | −1.44 | 0.95 | 0.85 | 0.37 | |
| 3 | 31.6 | 20.8 | 47.5 | −0.28 | 0.84 | 0.81 | 0.57 | |
| Kick | 1 | 19.3 | 11.2 | 69.5 | −0.84 | 1.16 | 1.37 | 0.27 |
| 2 | 64.1 | 10.8 | 25.1 | 0.59 | 0.84 | 0.76 | 0.57 | |
| 3 | 21.4 | 18.5 | 60.1 | −0.67 | 1.03 | 0.98 | 0.41 | |
| 4 | 10.9 | 8.6 | 80.5 | −1.27 | 0.91 | 0.76 | 0.43 | |
| Overhandthrow | 1 | 19.8 | 5.6 | 74.6 | −0.88 | 1.06 | 1.31 | 0.34 |
| 2 | 72.3 | 7.4 | 20.3 | 0.81 | 0.91 | 0.77 | 0.52 | |
| 3 | 62.6 | 11.3 | 26.1 | 0.55 | 0.97 | 0.94 | 0.49 | |
| 4 | 66.4 | 10.7 | 22.9 | 0.67 | 1.01 | 1.03 | 0.44 | |
| Underhandthrow | 1 | 24.7 | 11.0 | 64.3 | −0.64 | 1.09 | 1.19 | 0.35 |
| 2 | 71.7 | 11.0 | 17.3 | 0.90 | 1.12 | 1.39 | 0.33 | |
| 3 | 17.3 | 18.9 | 63.8 | −0.84 | 1.20 | 1.43 | 0.22 | |
| 4 | 64.6 | 12.7 | 22.6 | 0.66 | 1.09 | 1.17 | 0.38 | |
| Skills | Item | Gender | Age Groups Comparison (Logit Scores) | ||
|---|---|---|---|---|---|
| Boys vs. Girls | 3–5 yrs vs. 6–8 yrs | 3–5 yrs vs. 9–10 yrs | 6–8 yrs vs. 9–10 yrs | ||
| Run | 1 | 0.27 | −0.53 | −0.77 * | −0.24 |
| 2 | −0.52 | 1.86 * | 0.60 | −1.26 * | |
| 3 | −0.20 | 0.67 * | 0.62 | −0.05 | |
| 4 | 0.20 | −0.40 | −0.56 | −0.17 | |
| Gallop | 1 | 0.00 | −0.44 | −0.25 | 0.19 |
| 2 | 0.00 | −0.35 | −0.34 | 0.01 | |
| 3 | 0.00 | −0.14 | −0.17 | −0.03 | |
| 4 | −0.09 | −0.03 | 0.07 | 0.11 | |
| Hop | 1 | 0.08 | −0.17 | −0.26 | −0.08 |
| 2 | −0.07 | 0.22 | −0.15 | −0.36 | |
| 3 | 0.00 | −0.30 | −0.34 | −0.03 | |
| 4 | −0.14 | 1.10 * | 1.46 * | 0.38 | |
| Skip | 1 | −0.19 | 0.10 | 0.38 | 0.29 |
| 2 | 0.08 | 0.97 * | 0.96 * | 0.00 | |
| 3 | −0.23 | −0.07 | 0.16 | 0.26 | |
| Jump | 1 | 0.20 | 0.12 | 0.06 | −0.08 |
| 2 | −0.10 | −0.43 | −0.49 | −0.06 | |
| 3 | −0.11 | −0.51 | −0.53 | −0.03 | |
| 4 | 0.00 | −0.48 | −0.56 * | −0.08 | |
| Slide | 1 | 0.11 | −0.18 | −0.13 | 0.04 |
| 2 | 0.14 | 0.40 | 0.39 | −0.02 | |
| 3 | −0.05 | 0.35 | 0.70 * | 0.33 | |
| 4 | 0.05 | 0.44 | 0.74 * | 0.28 | |
| Skills | Item | Gender | Age Groups Comparison (Logit Scores) | ||
|---|---|---|---|---|---|
| Boys vs. Girls | 3–5 yrs vs. 6–8 yrs | 3–5 yrs vs. 9–10 yrs | 6–8 yrs vs. 9–10 yrs | ||
| Two-hand strike | 1 | −0.18 | −0.07 | −0.09 | −0.02 |
| 2 | −0.16 | −0.59 | −0.87 * | −0.28 | |
| 3 | 0.22 | 0.33 | −0.10 | −0.43 | |
| 4 | 0.07 | 0.02 | −0.24 | −0.26 | |
| 5 | −0.09 | 0.00 | −0.08 | −0.08 | |
| One-hand strike | 1 | 0.00 | 0.30 | 0.56 | 0.25 |
| 2 | −0.05 | 0.50 | 0.48 | −0.01 | |
| 3 | 0.38 | 0.31 | 0.71 | 0.40 | |
| 4 | 0.14 | −0.40 | −0.50 | −0.10 | |
| Two-hand catch | 1 | −0.38 | −0.28 | −0.60 | −0.31 |
| 2 | −0.03 | 0.33 | 0.78 * | 0.46 | |
| 3 | −0.18 | 0.97 * | 1.41 * | 0.43 | |
| One-hand dribble | 1 | −0.23 | −0.38 | −0.36 | 0.01 |
| 2 | −0.05 | 0.81 * | 1.44 * | 0.63 | |
| 3 | −0.14 | 0.79 * | 1.19 * | 0.40 | |
| Kick | 1 | −0.09 | −0.37 | −1.04 * | −0.67 * |
| 2 | 0.22 | −0.09 | −0.06 | 0.03 | |
| 3 | −0.09 | −0.22 | −0.36 | −0.14 | |
| 4 | 0.10 | 0.50 | 0.95 * | 0.45 | |
| Overhand throw | 1 | −0.20 | 0.21 | 0.20 | −0.01 |
| 2 | 0.26 | 0.00 | −0.21 | −0.21 | |
| 3 | 0.23 | −0.25 | −0.07 | 0.18 | |
| 4 | 0.17 | −0.53 | −0.79 * | −0.26 | |
| Underhand throw | 1 | −0.09 | −0.03 | 0.09 | 0.12 |
| 2 | 0.20 | −0.81 * | −0.63 | 0.19 | |
| 3 | −0.09 | 0.07 | 0.29 | 0.22 | |
| 4 | 0.00 | −0.79 * | −0.78 * | 0.01 | |
Publisher’s Note: MDPI stays neutral with regard to jurisdictional claims in published maps and institutional affiliations. |
© 2022 by the authors. Licensee MDPI, Basel, Switzerland. This article is an open access article distributed under the terms and conditions of the Creative Commons Attribution (CC BY) license (https://creativecommons.org/licenses/by/4.0/).
Share and Cite
Valentini, N.C.; Duarte, M.G.; Zanella, L.W.; Nobre, G.C. Test of Gross Motor Development-3: Item Difficulty and Item Differential Functioning by Gender and Age with Rasch Analysis. Int. J. Environ. Res. Public Health 2022, 19, 8667. https://0-doi-org.brum.beds.ac.uk/10.3390/ijerph19148667
Valentini NC, Duarte MG, Zanella LW, Nobre GC. Test of Gross Motor Development-3: Item Difficulty and Item Differential Functioning by Gender and Age with Rasch Analysis. International Journal of Environmental Research and Public Health. 2022; 19(14):8667. https://0-doi-org.brum.beds.ac.uk/10.3390/ijerph19148667
Chicago/Turabian StyleValentini, Nadia Cristina, Marcelo Gonçalves Duarte, Larissa Wagner Zanella, and Glauber Carvalho Nobre. 2022. "Test of Gross Motor Development-3: Item Difficulty and Item Differential Functioning by Gender and Age with Rasch Analysis" International Journal of Environmental Research and Public Health 19, no. 14: 8667. https://0-doi-org.brum.beds.ac.uk/10.3390/ijerph19148667