
Comparative Analysis of Male Cyclist Population in Four Asia Countries for Anthropometric Measurements


Abstract
:1. Introduction
2. Materials and Methods
2.1. Participants
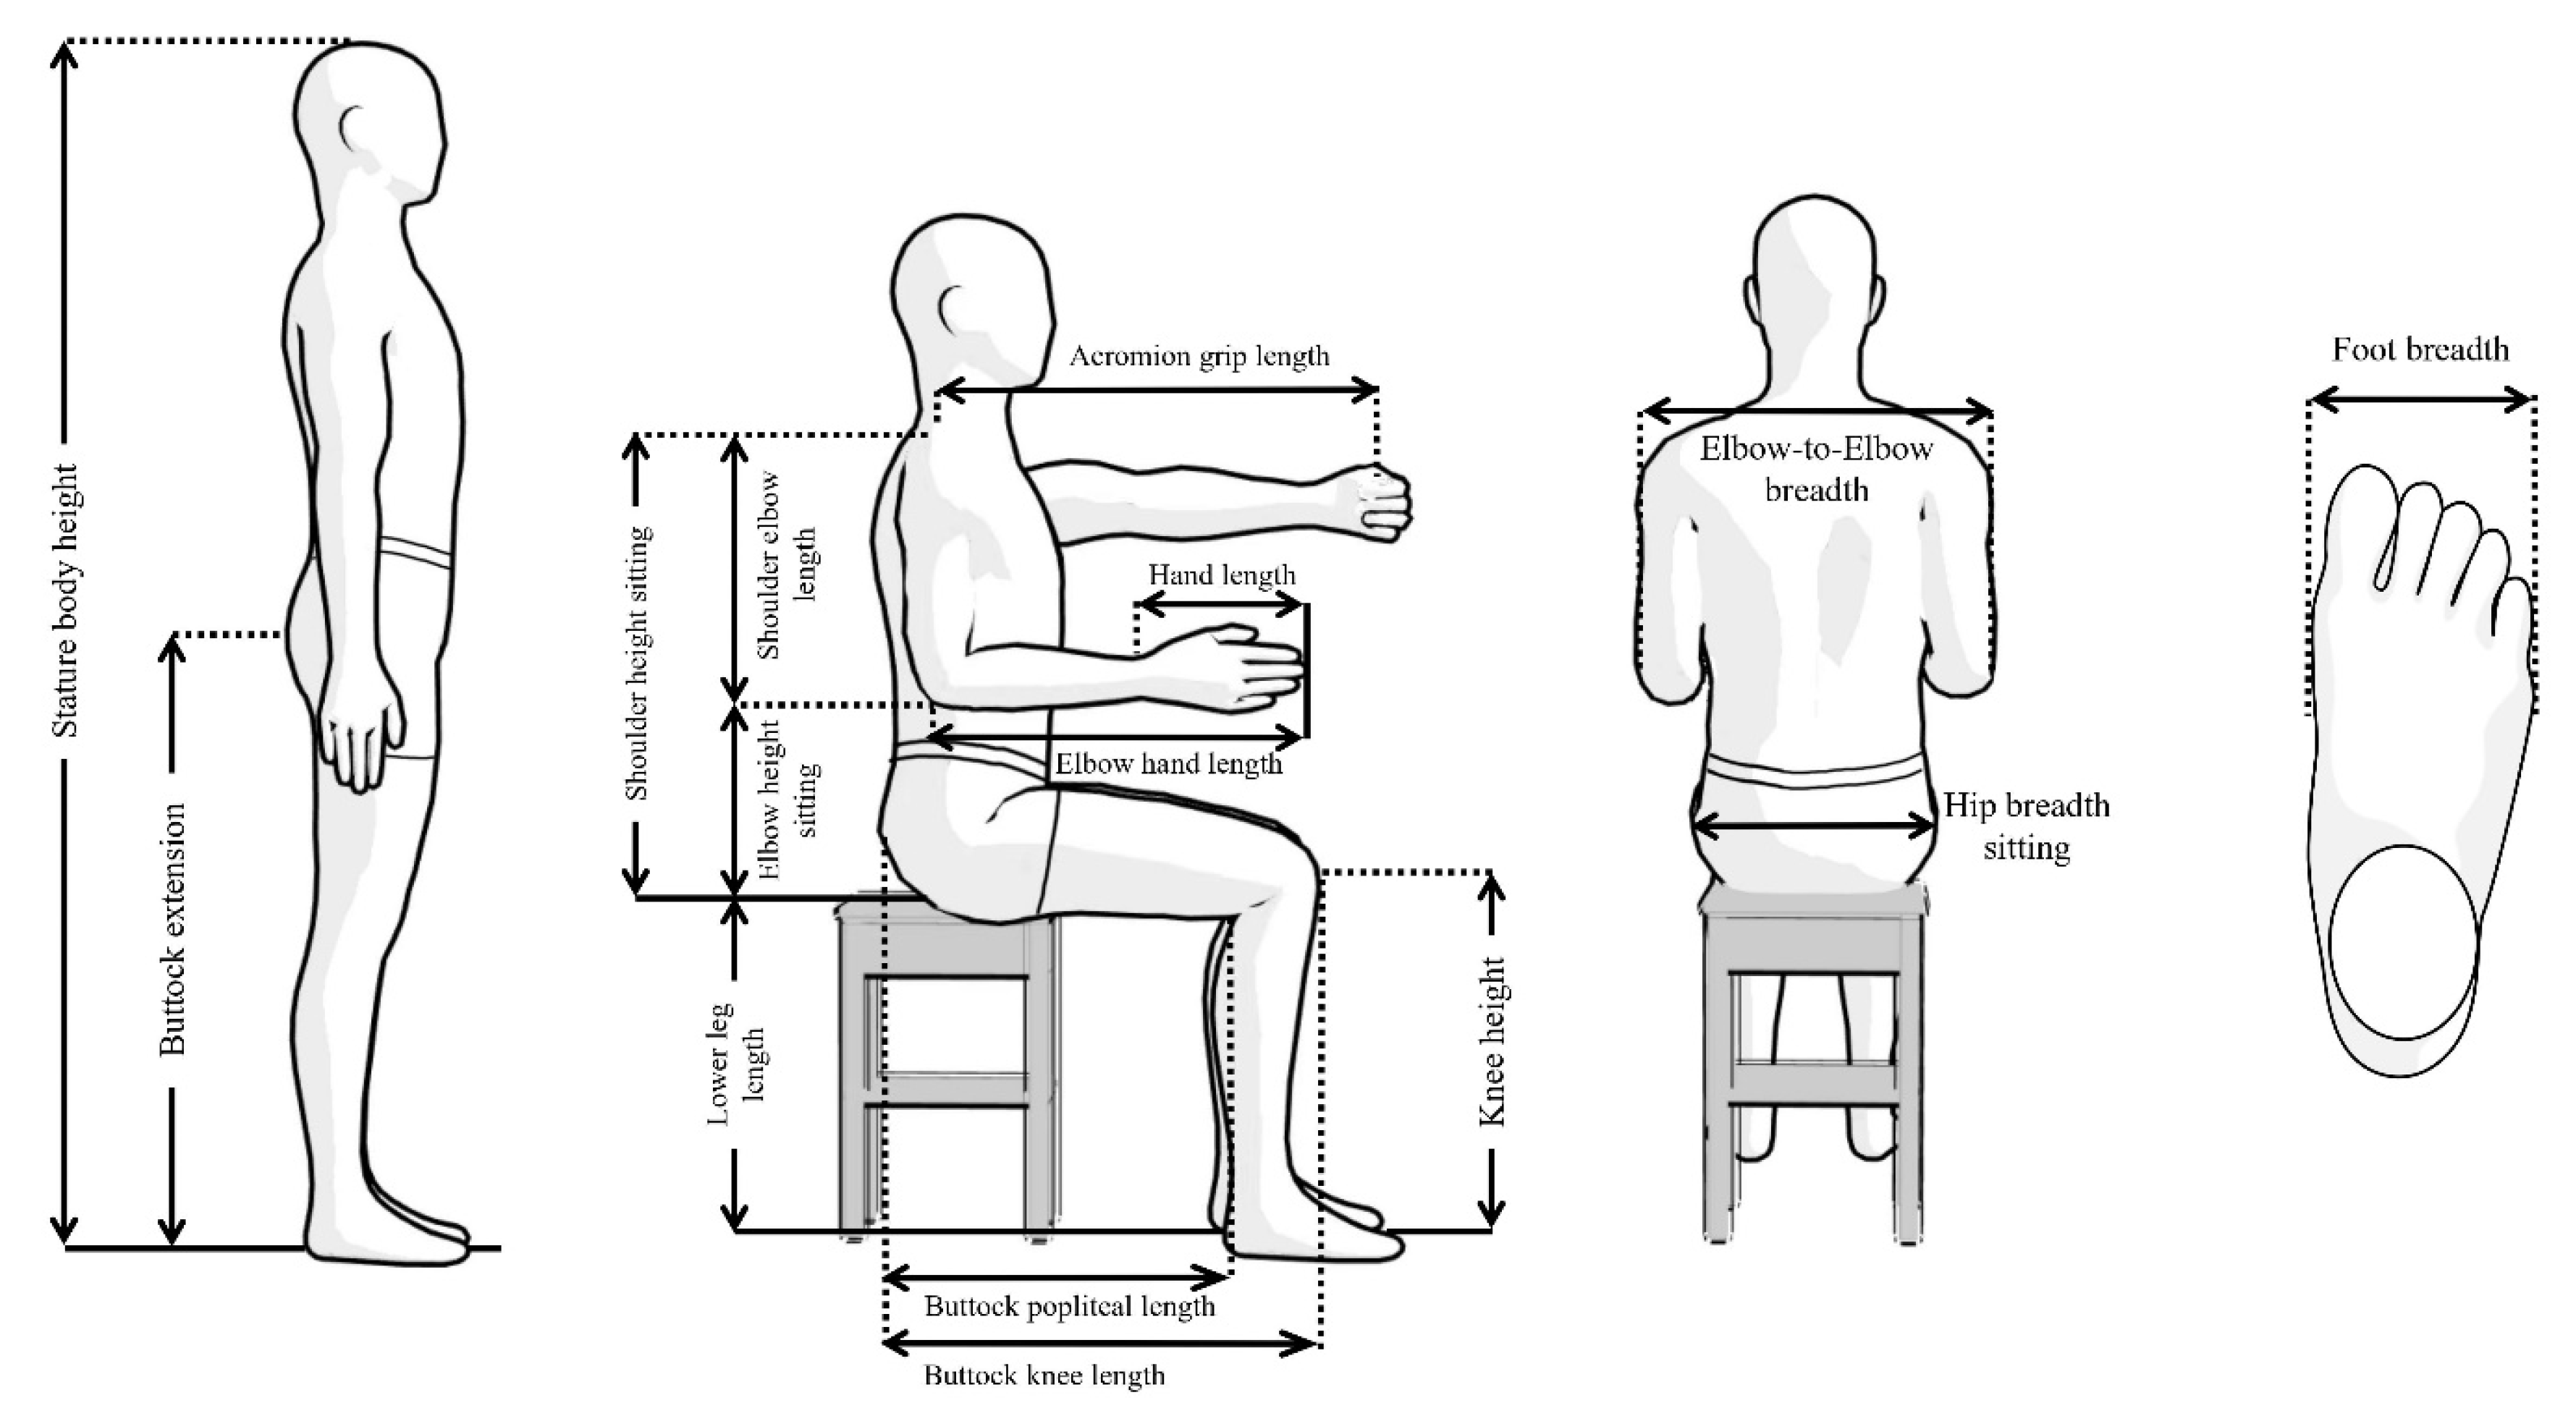
2.2. Selection of Anthropometric Variables
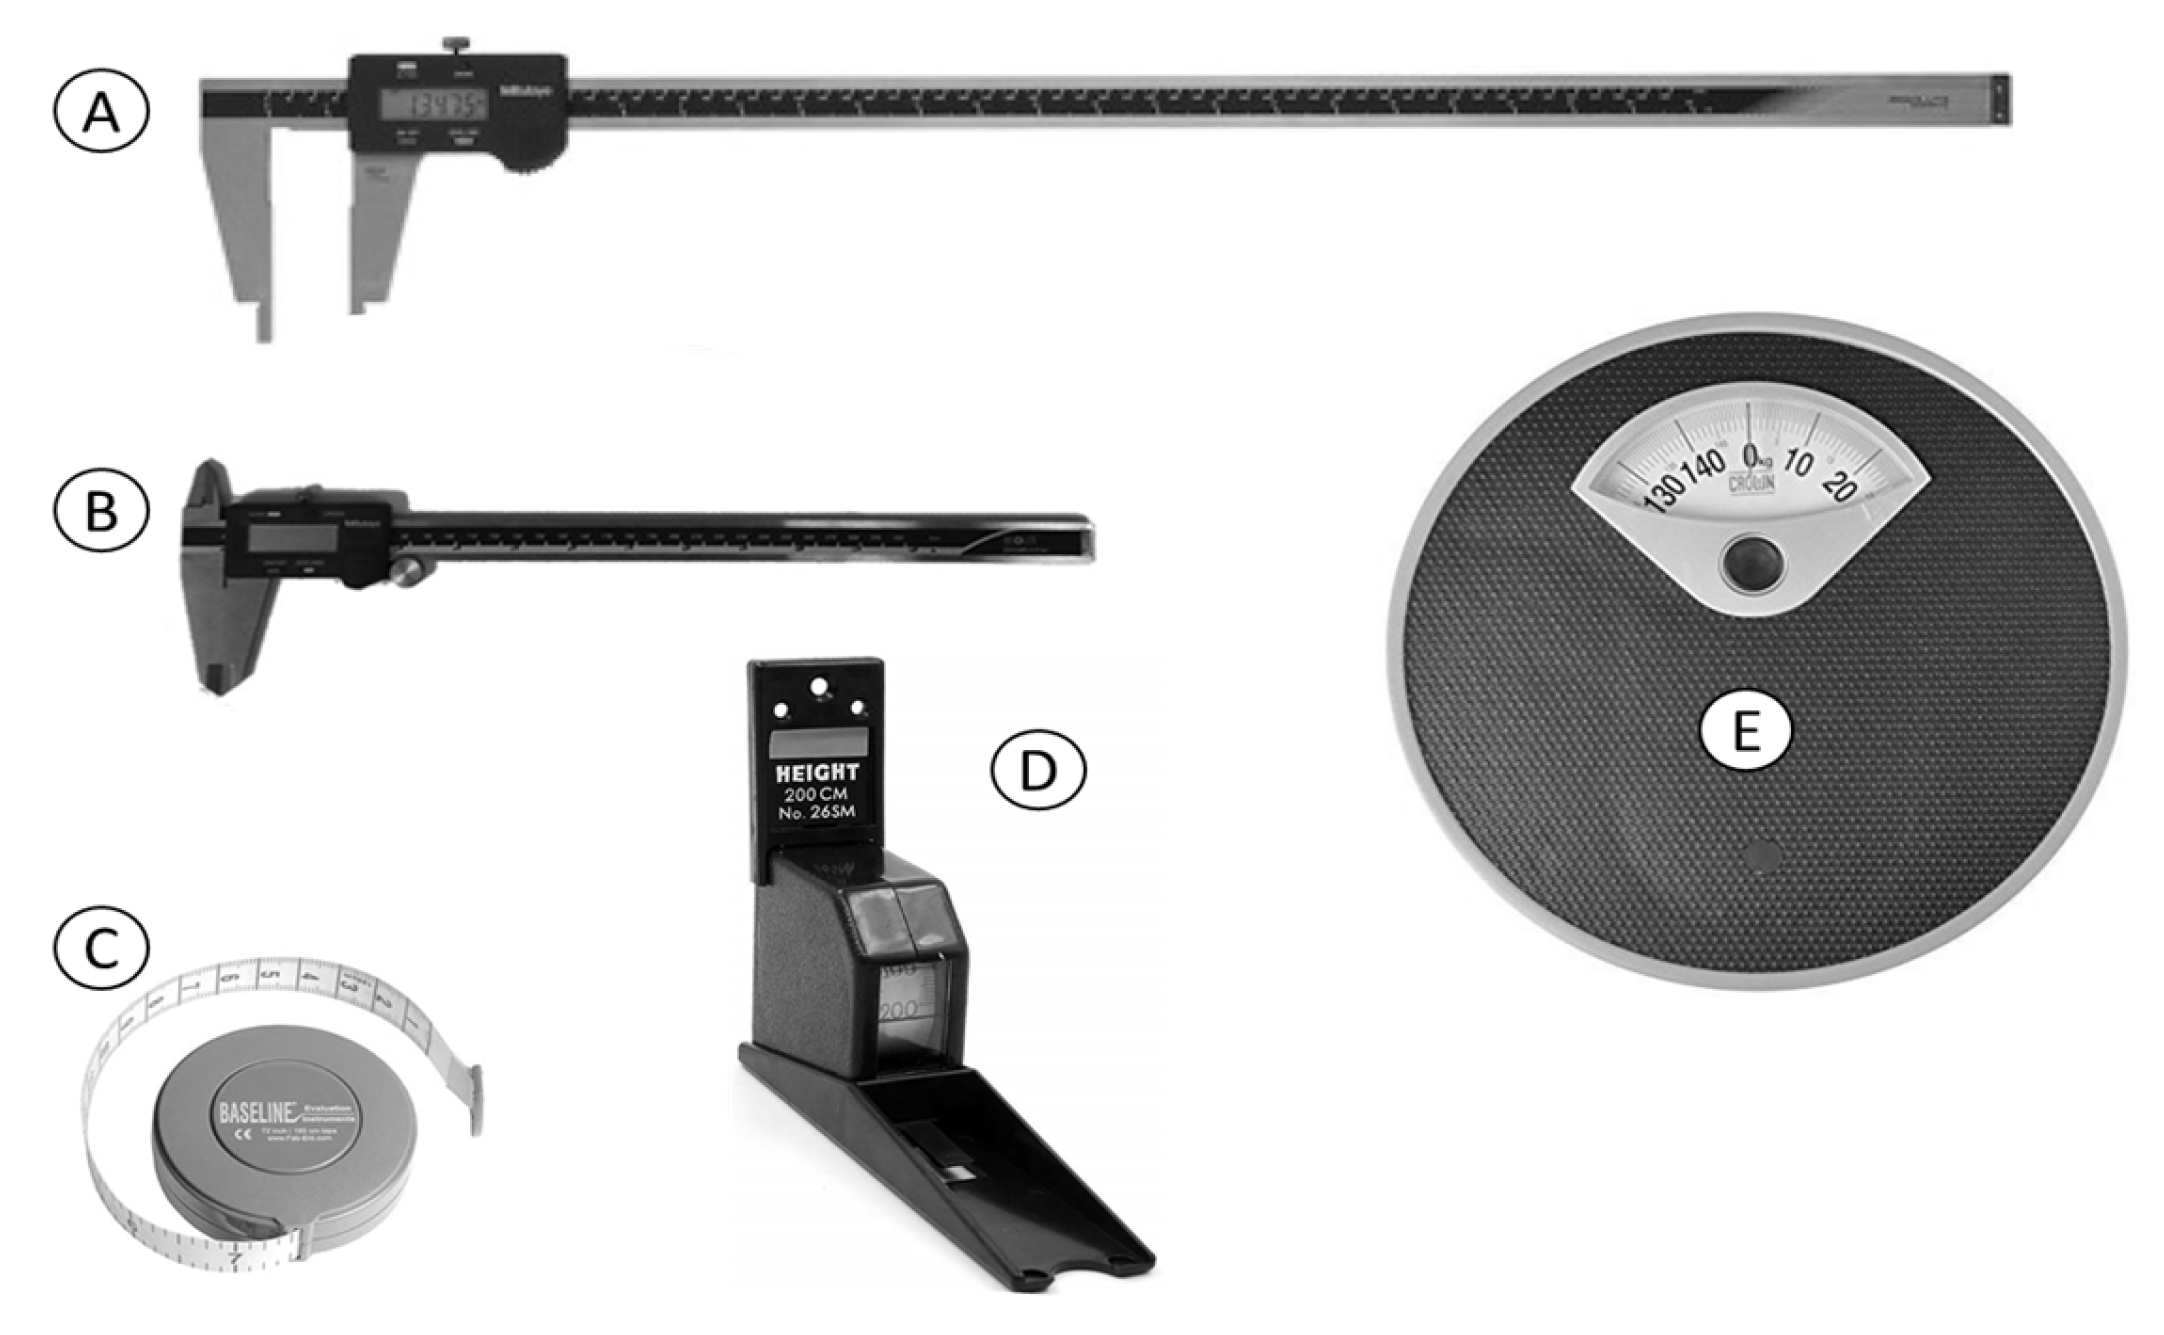
2.3. Measuring Instruments
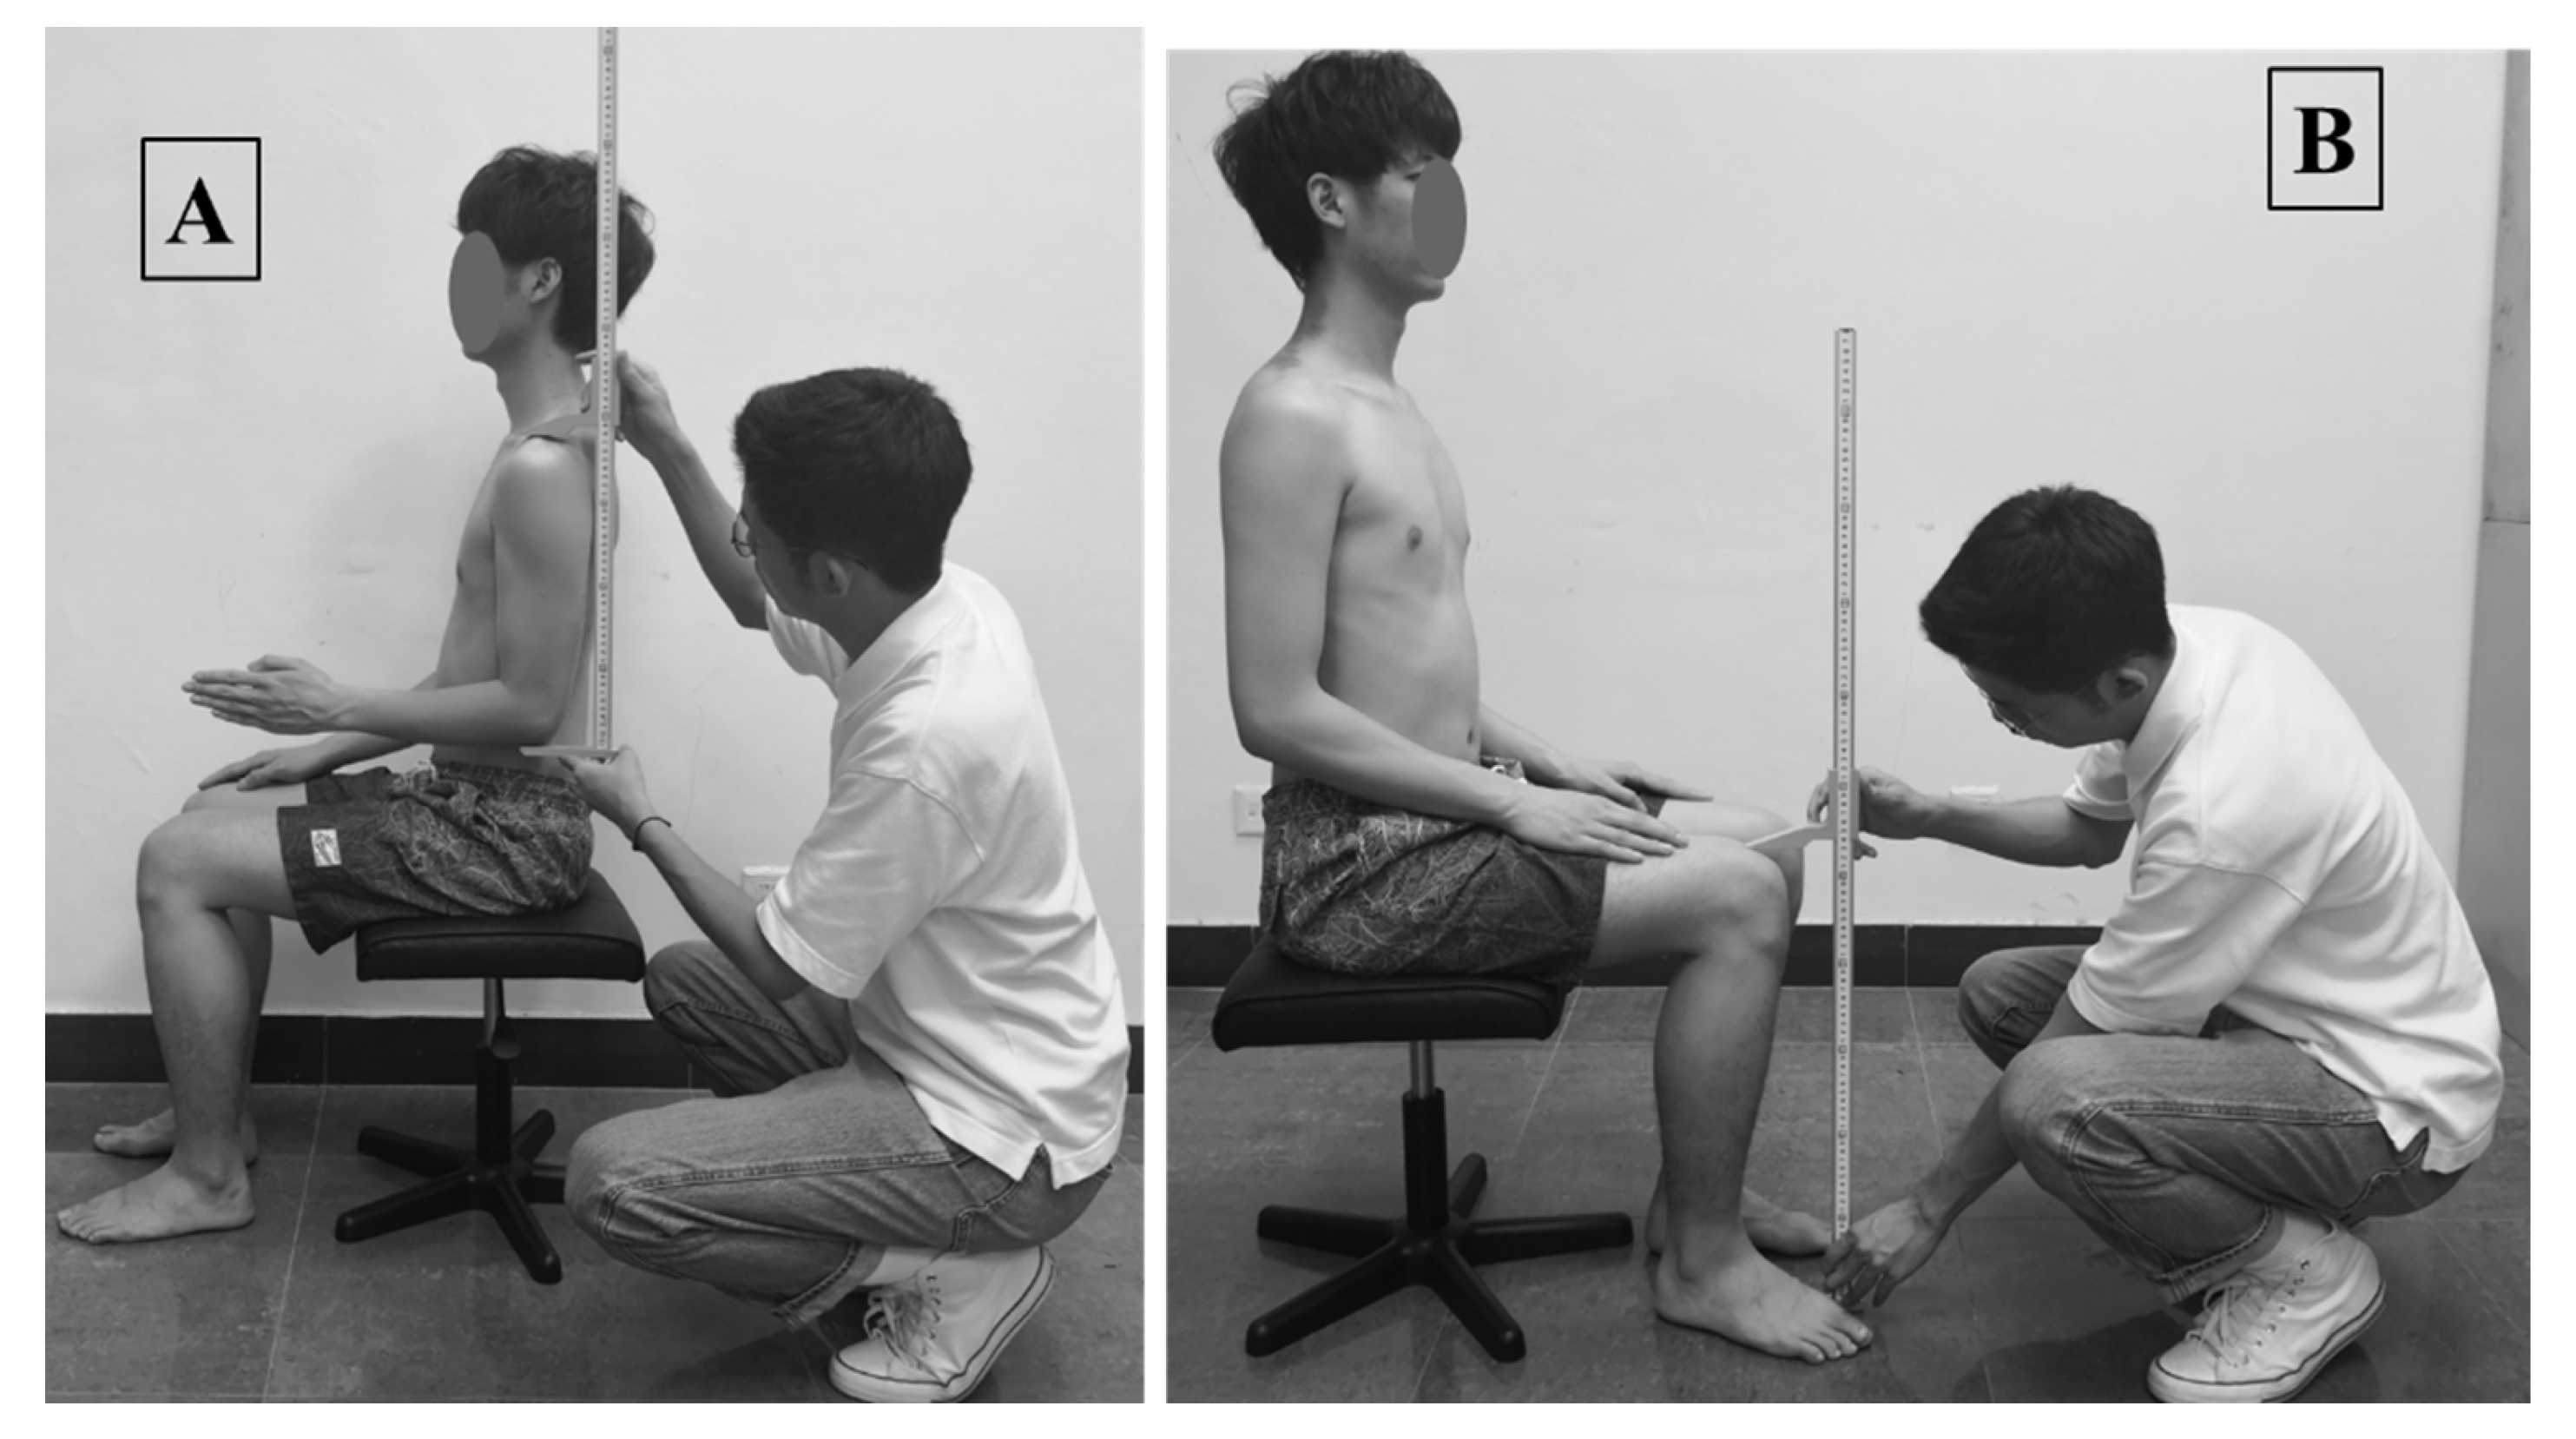
2.4. Measurement Procedure
2.5. Intra-/Inter- Reliability Assessment of Anthropometry
2.6. Data Analysis
3. Results
4. Discussion
5. Conclusions
Author Contributions
Funding
Institutional Review Board Statement
Informed Consent Statement
Data Availability Statement
Conflicts of Interest
Appendix A

| Anthropometric Variables | Confidence Interval | Chinese | Indian | Taiwanese | Singaporeans | |
|---|---|---|---|---|---|---|
| Stature body height | 95% Confidence Interval for Mean | Lower Bound | 1710.74 | 1680.81 | 1710.38 | 1668.51 |
| Upper Bound | 1734.10 | 1707.56 | 1731.55 | 1698.75 | ||
| Std. Deviation | 59.78 | 68.78 | 54.95 | 76.20 | ||
| Buttock extension | 95% Confidence Interval for Mean | Lower Bound | 872.56 | 832.64 | 854.58 | 956.57 |
| Upper Bound | 903.09 | 856.15 | 869.84 | 975.97 | ||
| Std. Deviation | 78.10 | 60.43 | 39.63 | 48.90 | ||
| Shoulder height (Sitting) | 95% Confidence Interval for Mean | Lower Bound | 613.47 | 571.20 | 509.94 | 570.42 |
| Upper Bound | 630.42 | 583.23 | 523.66 | 589.00 | ||
| Std. Deviation | 43.38 | 30.92 | 35.62 | 46.84 | ||
| Shoulder-elbow length | 95% Confidence Interval for Mean | Lower Bound | 360.76 | 350.09 | 251.22 | 325.55 |
| Upper Bound | 375.36 | 358.79 | 258.40 | 346.45 | ||
| Std. Deviation | 37.35 | 22.38 | 18.63 | 52.66 | ||
| Elbow height (Sitting) | 95% Confidence Interval for Mean | Lower Bound | 243.91 | 217.00 | 256.62 | 237.40 |
| Upper Bound | 259.17 | 227.50 | 267.37 | 250.02 | ||
| Std. Deviation | 39.03 | 27.01 | 27.90 | 31.81 | ||
| Lower leg length | Mean | 425.69 | 447.60 | 419.97 | 413.90 | |
| 95% Confidence Interval for Mean | Lower Bound | 417.77 | 439.58 | 414.84 | 408.37 | |
| Upper Bound | 433.62 | 455.61 | 425.10 | 419.43 | ||
| Std. Deviation | 40.55 | 41.19 | 26.62 | 27.88 | ||
| Knee height | 95% Confidence Interval for Mean | Lower Bound | 527.47 | 542.67 | 503.37 | 493.31 |
| Upper Bound | 538.43 | 559.79 | 512.91 | 509.09 | ||
| Std. Deviation | 28.04 | 44.03 | 24.76 | 39.74 | ||
| Acromion-grip length | 95% Confidence Interval for Mean | Lower Bound | 623.07 | 621.17 | 563.71 | 639.99 |
| Upper Bound | 638.88 | 637.18 | 574.21 | 663.81 | ||
| Std. Deviation | 40.45 | 41.14 | 27.26 | 60.04 | ||
| Hand length | 95% Confidence Interval for Mean | Lower Bound | 181.13 | 175.03 | 176.09 | 180.49 |
| Upper Bound | 189.67 | 180.23 | 179.93 | 183.85 | ||
| Std. Deviation | 21.83 | 13.38 | 9.98 | 8.47 | ||
| Elbow-hand length | 95% Confidence Interval for Mean | Lower Bound | 443.44 | 469.51 | 362.80 | 456.79 |
| Upper Bound | 454.49 | 479.59 | 370.34 | 467.33 | ||
| Std. Deviation | 28.26 | 25.91 | 19.59 | 26.58 | ||
| Buttock-popliteal length | 95% Confidence Interval for Mean | Lower Bound | 430.79 | 490.09 | 350.04 | 449.87 |
| Upper Bound | 446.01 | 505.37 | 359.62 | 460.57 | ||
| Std. Deviation | 38.95 | 39.29 | 24.88 | 26.96 | ||
| Buttock-knee length | 95% Confidence Interval for Mean | Lower Bound | 534.05 | 588.29 | 447.78 | 556.45 |
| Upper Bound | 561.01 | 602.02 | 459.74 | 568.05 | ||
| Std. Deviation | 68.97 | 35.29 | 31.04 | 29.21 | ||
| Elbow-Elbow breadth | 95% Confidence Interval for Mean | Lower Bound | 442.06 | 422.84 | 394.65 | 429.26 |
| Upper Bound | 461.10 | 437.78 | 403.56 | 440.64 | ||
| Std. Deviation | 48.70 | 38.41 | 23.15 | 28.67 | ||
| Hip breadth (Sitting) | 95% Confidence Interval for Mean | Lower Bound | 352.53 | 331.53 | 371.65 | 302.97 |
| Upper Bound | 367.68 | 342.24 | 381.84 | 311.37 | ||
| Std. Deviation | 38.76 | 27.54 | 26.44 | 21.19 | ||
| Foot breadth | 95% Confidence Interval for Mean | Lower Bound | 98.69 | 100.11 | 103.40 | 99.73 |
| Upper Bound | 105.27 | 103.33 | 105.21 | 102.39 | ||
| Std. Deviation | 16.82 | 8.27 | 4.70 | 6.70 | ||
| Weight (kg) | 95% Confidence Interval for Mean | Lower Bound | 68.26 | 66.15 | 65.94 | 64.47 |
| Upper Bound | 72.45 | 70.32 | 69.24 | 67.41 | ||
| Std. Deviation | 10.72 | 10.72 | 8.56 | 7.42 | ||
| BMI (kg/m2) | 95% Confidence Interval for Mean | Lower Bound | 23.08 | 23.09 | 21.87 | 22.84 |
| Upper Bound | 24.33 | 24.51 | 22.87 | 23.69 | ||
| Std. Deviation | 3.22 | 3.67 | 2.61 | 2.13 | ||
| Anthropometric Variables | Singaporean vs. Taiwanese | Singaporean vs. Chinese | Singaporean vs. Indian | Taiwanese vs. Chinese | Indian vs. Taiwanese | Indian vs. Chinese |
|---|---|---|---|---|---|---|
| Stature body height | 86.7 | 85.67 | 98.62 | 104.22 | 91.58 | 90.66 |
| 119.35 | 117.85 | 106.24 | 105.81 | 119.16 | 117.47 | |
| Buttock extension | 150.74 | 136.49 | 149.64 | 88.45 | 97.54 | 82.55 |
| 58.94 | 68.51 | 57.18 | 122.03 | 113.31 | 125.66 | |
| Shoulder height (Sitting) | 140.45 | 77.13 | 102.76 | 56.46 | 147.46 | 71.41 |
| 68.65 | 126.15 | 102.25 | 154.96 | 64.33 | 136.91 | |
| Shoulder-elbow length | 152.48 | 85.82 | 92.04 | 53.51 | 158.46 | 95.04 |
| 57.3 | 117.71 | 112.56 | 157.99 | 53.54 | 113.04 | |
| Elbow height (Sitting) | 85.66 | 93.02 | 122.27 | 111.34 | 68.85 | 79.18 |
| 120.33 | 110.72 | 83.49 | 98.47 | 141.46 | 129.06 | |
| Lower leg length | 95.83 | 87.31 | 75.12 | 97.28 | 128.69 | 119.18 |
| 110.74 | 116.27 | 128.83 | 112.95 | 82.75 | 88.67 | |
| Knee height | 92.66 | 73.69 | 67.95 | 79.04 | 140.23 | 118.74 |
| 113.73 | 129.49 | 135.73 | 131.71 | 71.43 | 89.12 | |
| Acromion-grip length | 145.83 | 112.97 | 114 | 62.12 | 146.92 | 104.88 |
| 63.57 | 91.35 | 91.44 | 149.13 | 64.86 | 103.12 | |
| Hand length | 116.84 | 92.29 | 113.6 | 85.53 | 104.96 | 86.42 |
| 90.92 | 111.43 | 91.83 | 125.03 | 106.03 | 121.75 | |
| Elbow-hand length | 156.14 | 116.79 | 90.6 | 54.84 | 158.49 | 130.43 |
| 53.84 | 87.64 | 113.94 | 156.62 | 53.51 | 77.31 | |
| Buttock-popliteal length | 155.69 | 117.59 | 70.1 | 58.14 | 158.43 | 141 |
| 54.26 | 86.86 | 133.66 | 153.22 | 53.57 | 66.64 | |
| Buttock-knee length | 155.48 | 112.83 | 75.81 | 57.13 | 158.45 | 133.39 |
| 54.47 | 91.49 | 128.16 | 154.26 | 53.55 | 74.33 | |
| Elbow-to-elbow breadth | 139.11 | 84.22 | 105.09 | 63.21 | 132.75 | 87.87 |
| 69.91 | 119.26 | 100.01 | 148.01 | 78.76 | 120.29 | |
| Hip breadth (Sitting) | 52.57 | 60.59 | 70.25 | 122.2 | 67.61 | 82.98 |
| 151.55 | 142.2 | 133.51 | 87.3 | 142.68 | 125.23 | |
| Foot breadth | 88.42 | 106.83 | 98.71 | 123.33 | 97.18 | 109.5 |
| 117.73 | 97.32 | 106.14 | 86.13 | 113.67 | 98.45 | |
| BMI | 116.23 | 96.98 | 95.4 | 90.93 | 119.86 | 106.53 |
| 91.49 | 106.87 | 109.33 | 119.48 | 91.42 | 101.44 | |
| Weight | 96.8 | 87.74 | 93.29 | 96.95 | 109.42 | 100.73 |
| 109.83 | 115.84 | 111.36 | 113.28 | 101.65 | 107.3 |
| Characteristic | Singapore (SGD) | India (INR) | Taiwan (ROC) | China (PRC) | ||||||||
|---|---|---|---|---|---|---|---|---|---|---|---|---|
| Mean | Range | Mean | Range | Mean | Range | Mean | Range | |||||
| Min | Max | Min | Max | Min | Max | Min | Max | |||||
| Age (Yrs.) | 27 | 20 | 56 | 25 | 18 | 37 | 30 | 20 | 49 | 32 | 19 | 59 |
| Body surface area (m2) | 1.76 | 1.46 | 2.20 | 1.78 | 1.33 | 2.11 | 1.79 | 1.54 | 2.33 | 1.83 | 1.33 | 2.33 |
| HRmax (beats/min) | 194 | 175 | 198 | 195 | 187 | 199 | 192 | 180 | 198 | 191 | 173 | 199 |
| Performance level (VO2) | 79 | 78 | 82 | 79 | 78 | 80 | 79 | 78 | 81 | 79 | 78 | 82 |
| Years of practice | 9 | 2 | 38 | 7 | 1 | 19 | 12 | 2 | 31 | 14 | 1 | 41 |
| Weekly training load (km) | 2650 | 2452 | 2978 | 2785 | 2125 | 3250 | 2700 | 1985 | 2985 | 2520 | 2085 | 2920 |
| Anthropometric Variables | Intra-Observer Technical Error (%TEM) | Inter-Observer Technical Error (%TEM) | ||||||
|---|---|---|---|---|---|---|---|---|
| Singapore (SGD) | India (INR) | Taiwan (ROC) | China (PRC) | Singapore (SGD) | India (INR) | Taiwan (ROC) | China (PRC) | |
| Stature body height | 0.47 | 0.51 | 0.35 | 0.49 | 0.11 | 0.24 | 0.34 | 0.45 |
| Buttock extension | 0.32 | 0.34 | 0.28 | 0.30 | 0.35 | 0.48 | 0.54 | 0.54 |
| Shoulder height (Sitting) | 0.94 | 0.93 | 0.86 | 0.84 | 1.20 | 1.09 | 1.24 | 0.59 |
| Shoulder-elbow length | 1.11 | 1.24 | 0.92 | 1.01 | 0.98 | 1.09 | 1.32 | 1.45 |
| Elbow height (Sitting) | 1.73 | 1.68 | 1.45 | 1.64 | 1.20 | 1.54 | 1.05 | 0.95 |
| Lower leg length | 1.2 | 1.23 | 0.89 | 0.98 | 0.89 | 0.97 | 0.85 | 1.57 |
| Knee height | 0.40 | 0.54 | 0.65 | 0.35 | 0.68 | 0.78 | 0.56 | 1.25 |
| Acromion-grip length | 0.64 | 0.79 | 0.68 | 0.54 | 0.60 | 0.63 | 0.70 | 1.01 |
| Hand length | 1.33 | 1.35 | 1.21 | 1.01 | 1.21 | 1.51 | 1.24 | 1.32 |
| Elbow-hand length | 0.91 | 0.93 | 0.78 | 0.89 | 0.78 | 0.88 | 0.78 | 0.85 |
| Buttock-popliteal length | 1.10 | 1.39 | 1.56 | 1.23 | 0.68 | 0.87 | 0.74 | 0.65 |
| Buttock-knee length | 0.86 | 0.66 | 0.98 | 0.78 | 0.65 | 0.73 | 0.69 | 0.95 |
| Elbow-to-elbow breadth | 0.64 | 0.80 | 0.75 | 0.74 | 0.85 | 0.89 | 0.94 | 1.02 |
| Hip breadth (Sitting) | 0.95 | 0.96 | 0.98 | 0.9 | 1.01 | 1.18 | 1.25 | 1.35 |
| Foot breadth | 0.64 | 0.78 | 0.85 | 0.54 | 0.94 | 0.98 | 0.86 | 0.89 |
| Weight | 0.23 | 0.15 | 0.3 | 0.25 | 0.23 | 0.34 | 0.32 | 0.35 |
References
- World Health Organization. Physical Activity. Available online: https://www.euro.who.int/en/health-topics/environment-and-health/Transport-and-health/data-and-statistics/physical-activity2 (accessed on 20 March 2021).
- Pucher, J.; Buehler, R.; Seinen, M. Bicycling renaissance in North America? an update and re-appraisal of cycling trends and policies. Transport. Res. Part A Pol. Pract. 2011, 45, 451–475. [Google Scholar] [CrossRef]
- Young, M.; Savan, B.; Manaugh, K.; Scott, L. Mapping the demand and potential for cycling in Toronto. Int. J. Sustain. Transport. 2021, 15, 285–293. [Google Scholar] [CrossRef]
- Assunçao-Denis, M.; Tomalty, R. Increasing cycling for transportation in Canadian communities: Understanding what works. Transport. Res. A Pol. Pract. 2019, 123, 288–304. [Google Scholar] [CrossRef]
- Aldred, R.; Woodcock, J.; Goodman, A. Does more cycling mean more diversity in cycling? Transp. Rev. 2016, 36, 28–44. [Google Scholar] [CrossRef]
- Chen, C.F.; Chen, P.C. Estimating recreational cyclists’ preferences for bicycle routes—Evidence from Taiwan. Transp. Policy 2013, 26, 23–30. [Google Scholar] [CrossRef]
- Hsieh, L.Y.; Lin, Y.C.; Lee, Y.H.; Lee, S.T. Relationship between bikeway image, tourism value and intention to revisit bikeways in Taiwan. J. Inf. Optim. Sci. 2021, 42, 235–248. [Google Scholar] [CrossRef]
- Goel, R.; Goodman, A.; Aldred, R.; Nakamura, R.; Tatah, L.; Martin, L.; Garcia, T.; Zapata-Diomedi, B.; De Sa, T.H.; Tiwari, G.; et al. Cycling behaviour in 17 countries across 6 continents: Levels of cycling, who cycles, for what purpose, and how far? Transp. Rev. 2022, 42, 58–81. [Google Scholar] [CrossRef]
- Streisfeld, G.M.; Bartoszek, C.; Creran, E.; Inge, B.; McShane, M.D.; Johnston, T. Relationship between body positioning, muscle activity, and spinal kinematics in cyclists with and without low back pain: A systematic review. Sports Health 2017, 9, 75–79. [Google Scholar] [CrossRef]
- Brand, A.; Sepp, T.; Klöpfer-Krämer, I.; Müßig, J.A.; Kröger, I.; Wackerle, H.; Augat, P. Upper Body posture and muscle activation in recreational cyclists: Immediate effects of variable cycling setups. Res. Q. Exerc. Sport. 2020, 91, 298–308. [Google Scholar] [CrossRef]
- Garimella, R.; Peeters, T.; Parrilla, E.; Uriel, J.; Sels, S.; Huysmans, T.; Verwulgen, S. Estimating cycling aerodynamic performance using anthropometric measures. Appl. Sci. 2020, 10, 8635. [Google Scholar] [CrossRef]
- Menaspa, P.; Rampinini, E.; Bosio, A.; Carlomagno, D.; Riggio, M.; Sassi, A. Physiological and anthropometric characteristics of junior cyclists of different specialties and performance levels. Scand. J. Med. Sci. Sports 2012, 22, 392–398. [Google Scholar] [CrossRef] [PubMed]
- Brunkhorst, L.; Kielstein, H. Comparison of anthropometric characteristics between professional triathletes and cyclists. Biol. Sport 2013, 30, 269–273. [Google Scholar] [CrossRef] [PubMed]
- Grainger, K.; Dodson, Z.; Korff, T. Predicting bicycle setup for children based on anthropometrics and comfort. Appl. Ergon. 2017, 59, 449–459. [Google Scholar] [CrossRef] [PubMed]
- Wadsworth, D.J.S.; Weinrauch, P. The roel of a bike fit in cyclists with hip pain. A clinical commentary. Int. J. Sports Phys. Ther. 2019, 14, 468–486. [Google Scholar] [CrossRef]
- Holliday, W.; Swart, J. Anthropometrics, flexibility and training history as determinants for bicycle configuration. Sports Med. Health Sci. 2021, 3, 93–100. [Google Scholar] [CrossRef]
- Scoz, R.D.; Amorim, C.F.; Espindola, T.; Santiago, M.; Mendes, J.J.B.; De Oliverira, P.R.; Ferreira, L.M.A.; Brito, R.N. Discomfort, pain and fatigue levels of 160 cyclists after a kinematic bike-fitting method: An experimental study. BMJ Open Sport Exerc. Med. 2021, 7, e001096. [Google Scholar] [CrossRef]
- Wang, E.M.Y.; Wang, M.J.; Yeh, W.Y.; Shih, Y.C.; Lin, Y.C. Development of anthropometric work environment for Taiwanese workers. Int. J. Ind. Ergon. 1999, 23, 3–8. [Google Scholar] [CrossRef]
- Del Prado-Lu, J.L. Anthropometric measurement of Filipino manufacturing workers. Int. J. Ind. Ergon. 2007, 37, 497–503. [Google Scholar] [CrossRef]
- Klamklay, J.; Sungkhapong, A.; Yodpijit, N.; Patterson, P.E. Anthropometry of the southern Thai population. Int. J. Ind. Ergon. 2008, 38, 111–118. [Google Scholar] [CrossRef]
- Iseri, A.; Arslan, N. Estimated anthropometric measurements of Turkish adults and effects of geographical regions. Int. J. Ind. Ergon. 2009, 39, 860–865. [Google Scholar]
- Khadem, M.M.; Islam, M.A. Development of anthropometric data for Bangladeshi male population. Int. J. Ind. Ergon. 2014, 44, 407–412. [Google Scholar] [CrossRef]
- Sadeghi, F.; Mazloumi, A.; Kazemi, Z. An anthropometric data bank for the Iranian working population with ethnic diversity. Appl. Ergon. 2015, 48, 95–103. [Google Scholar] [CrossRef] [PubMed]
- Dawal, S.Z.M.; Ismail, Z.; Yusuf, K.; Abdul-Rashid, S.H.; Shalahim, N.S.M.; Abdullah, N.S.; Kamil, N.S.M. Determination of the significant anthropometry dimensions for user-friendly designs of domestic furniture and appliances—Experience from a study in Malaysia. Measurement 2015, 59, 205–215. [Google Scholar] [CrossRef]
- Vyavahare, R.T.; Kallurkar, S.P. Anthropometry of male agricultural workers of western India for the design of tools and equipment. Int. J. Ind. Ergon. 2016, 53, 80–85. [Google Scholar] [CrossRef]
- Hartono, M. Indonesian anthropometry update for special populations incorporating Drillis and Contini revisited. Int. J. Ind. Ergon. 2018, 64, 89–101. [Google Scholar] [CrossRef]
- Lee, Y.C.; Chen, C.H.; Lee, C.H. Body anthropometric measurements of Singaporean adult and elderly population. Measurement 2019, 148, 106949. [Google Scholar] [CrossRef]
- Arunachalam, M.; Singh, S.P.; Karmakar, S. Determination of the key anthropometric and range of motion measurements for the ergonomic design of motorcycle. Measurement 2020, 159, 107751. [Google Scholar] [CrossRef]
- Lin, Y.C.; Wang, M.J.J.; Wang, E.M. The comparisons of anthropometric characteristics among four peoples in East Asia. Appl. Ergon. 2004, 35, 173–178. [Google Scholar] [CrossRef]
- Yap, W.S.; Chan, C.C.; Chan, S.P.; Wang, Y.T. Ethnic difference in anthropometry among adult Singaporean, Malay and Indians, and their effects on lung volumes. Respir. Med. 2001, 95, 297–304. [Google Scholar] [CrossRef]
- Mohammad, Y.A. Anthropometric characteristics of the hand based on laterality and sex among Jordanian. Int. J. Ind. Ergon. 2005, 35, 747–754. [Google Scholar] [CrossRef]
- Chuan, T.K.; Hartono, M.; Kumar, N. Anthropometry of the Singaporean and Indonesian populations. Int. J. Ind. Ergon. 2010, 40, 757–766. [Google Scholar] [CrossRef]
- Widyanti, A.; Susanti, L.; Sutalaksana, I.Z.; Muslim, K. Ethnic differences in Indonesian anthropometry data: Evidence from three different largest ethnics. Int. J. Ind. Ergon. 2015, 47, 72–78. [Google Scholar] [CrossRef]
- Bhattacharjya, R.B.; Kakoty, S.K. A survey of the anthropometric data relating to five ethnic groups in Assam considering gender and ethnic diversity: Application of the data in designing an improvised pedal-operated Chaak. Int. J. Ind. Ergon. 2020, 76, 102927. [Google Scholar] [CrossRef]
- Da Silva, G.V.; Gordon, C.C.; Halpern, M. Comparison of anthropometry of Brazilian and US Military population for flight deck design. Int. J. Ind. Ergon. 2018, 64, 170–177. [Google Scholar] [CrossRef]
- Rahman, N.I.; Dawal, S.Z.; Yusoff, N.; Kamil, N.S.M. Anthropometric measurements among four Asian countries in designing sitting and standing workstations. Sādhanā 2018, 43, 10. [Google Scholar] [CrossRef]
- Krejcie, R.V.; Morgan, D.W. Determining sample size for research activities. Educ. Psychol. Meas. 1970, 30, 607–610. [Google Scholar] [CrossRef]
- McLean, B.D.; Parker, A.W. An anthropometric analysis of elite Australian track cyclists. J. Sports Sci. 1989, 7, 247–255. [Google Scholar] [CrossRef]
- Hsiao, S.W.; Chen, R.Q.; Leng, W.L. Applying riding-posture optimization on bicycle frame design. Appl. Ergon. 2015, 51, 69–79. [Google Scholar] [CrossRef]
- Foley, J.P.; Bird, S.R.; White, J.A. Anthropometric comparison of cyclists from different events. Br. J. Sports Med. 1989, 23, 30–33. [Google Scholar] [CrossRef]
- Donkers, P.C.M.; Toussaint, H.M.; Molenbroek, J.F.M.; Steenbekkers, L.P.A. Recommendations for the assessment and design of young children’s bicycles on the basis of anthropometric data. Appl. Ergon. 1993, 24, 109–118. [Google Scholar] [CrossRef]
- Laios, L.; Giannatsis, J. Ergonomic evaluation and redesign of children bicycles based on anthropometric data. Appl. Ergon. 2010, 41, 428–435. [Google Scholar] [CrossRef] [PubMed]
- Christiaans, H.H.; Bremner, A. Comfort on bicycles and the validity of a commercial bicycle fitting system. Appl. Ergon. 1998, 29, 201–211. [Google Scholar] [CrossRef]
- Lee, Y.C.; Lin, G.; Wang, M.J.J. Comparing 3D foot scanning with conventional measurement methods. J. Foot Ankle Res. 2014, 7, 44. [Google Scholar] [CrossRef]
- Mishra, P.; Pandey, C.M.; Singh, U.; Gupta, A.; Sahu, C.; Keshri, A. Descriptive statistics and normality tests for statistical data. Ann. Card. Anaesth. 2019, 22, 67. [Google Scholar] [PubMed]
- Fujimoto, S.; Watanabe, T. Studies on the body surface area of Japanese. Acta Med. Nagasaki 1969, 13, 1–13. [Google Scholar]
- Nes, B.M.; Janszky, I.; Wisløff, U.; Støylen, A.; Karlsen, T. Age-predicted maximal heart rate in healthy subjects: The HUNT Fitness Study. Scand. J. Med. Sci. Sports 2013, 23, 697–704. [Google Scholar] [CrossRef]
- Uth, N.; Sørensen, H.; Overgaard, K.; Pedersen, P.K. Estimation of VO2max from the ratio between HRmax and HRrest—The heart rate ratio method. Eur. J. Appl. Physiol. 2004, 91, 111–115. [Google Scholar] [CrossRef]


| Characteristic | Mean | Range | |
|---|---|---|---|
| Min | Max | ||
| Age (Yrs.) | 28 | 18 | 50 |
| Body surface area (m2) | 1.79 | 1.47 | 2.20 |
| HRmax (beats/min) | 193 | 179 | 199 |
| Performance level (VO2) | 79 | 78 | 81 |
| Years of practice | 10 | 1 | 32 |
| Weekly training load (km) | 2664 | 2162 | 3033 |
| S. No | Anthropometric | Countries | Median | Mean | Std. Deviation | Minimum | Maximum | Interquartile Range | Range | Percentiles | ||
|---|---|---|---|---|---|---|---|---|---|---|---|---|
| 5th | 50th | 95th | ||||||||||
| 1 | Stature body height | India | 1680 | 1694.18 | 68.78 | 1540.00 | 1875.00 | 99.25 | 335.00 | 1599.00 | 1680.00 | 1823.75 |
| Singapore | 1677 | 1683.63 | 76.20 | 1521.00 | 1900.00 | 102.75 | 379.00 | 1552.40 | 1677.00 | 1820.00 | ||
| Taiwan | 1715.8 | 1720.97 | 54.95 | 1587.40 | 1855.20 | 83.52 | 267.80 | 1634.16 | 1715.80 | 1813.36 | ||
| China | 1720 | 1722.42 | 59.78 | 1600.00 | 1933.40 | 80 | 333.40 | 1630.00 | 1720.00 | 1818.70 | ||
| 2 | Buttock extension | India | 855 | 844.39 | 60.43 | 575.00 | 980.00 | 70 | 405.00 | 725.00 | 855.00 | 935.00 |
| Singapore | 971 | 966.27 | 48.90 | 820.00 | 1073.00 | 57 | 253.00 | 877.10 | 971.00 | 1039.95 | ||
| Taiwan | 859.35 | 862.21 | 39.63 | 775.00 | 955.00 | 55.92 | 180.00 | 797.28 | 859.35 | 930.62 | ||
| China | 891 | 887.83 | 78.10 | 470.00 | 1099.30 | 74 | 629.30 | 775.10 | 891.00 | 1000.00 | ||
| 3 | Shoulder height (Sitting) | India | 572.2 | 577.22 | 30.92 | 507.10 | 654.00 | 44.48 | 146.90 | 522.38 | 572.20 | 632.60 |
| Singapore | 569.5 | 579.71 | 46.84 | 493.00 | 711.00 | 54 | 218.00 | 512.10 | 569.50 | 653.95 | ||
| Taiwan | 515.6 | 516.80 | 35.62 | 435.30 | 599.30 | 53.6 | 164.00 | 460.91 | 515.60 | 580.50 | ||
| China | 622.5 | 621.94 | 43.38 | 450.00 | 740.00 | 44.5 | 290.00 | 555.26 | 622.50 | 700.00 | ||
| 4 | Shoulder-elbow length | India | 352.85 | 354.44 | 22.38 | 301.70 | 410.10 | 27.52 | 108.40 | 315.85 | 352.85 | 393.53 |
| Singapore | 317.5 | 336.00 | 52.66 | 263.00 | 432.00 | 32.75 | 169.00 | 268.15 | 317.50 | 419.95 | ||
| Taiwan | 253.85 | 254.81 | 18.63 | 210.00 | 312.10 | 24.92 | 102.10 | 222.52 | 253.85 | 285.33 | ||
| China | 358 | 368.06 | 37.35 | 310.00 | 500.00 | 33 | 190.00 | 323.14 | 358.00 | 450.00 | ||
| 5 | Elbow height (Sitting) | India | 224.2 | 222.25 | 27.01 | 160.60 | 284.90 | 39.25 | 124.30 | 175.38 | 224.20 | 270.93 |
| Singapore | 243 | 243.71 | 31.81 | 190.00 | 358.00 | 45.5 | 168.00 | 198.00 | 243.00 | 292.95 | ||
| Taiwan | 261.05 | 262.00 | 27.90 | 201.30 | 321.80 | 43.85 | 120.50 | 219.68 | 261.05 | 311.06 | ||
| China | 257 | 251.54 | 39.03 | 140.00 | 320.00 | 53 | 180.00 | 179.20 | 257.00 | 309.78 | ||
| 6 | Lower leg length | India | 444.6 | 447.60 | 41.19 | 373.80 | 710.30 | 50.3 | 336.50 | 393.05 | 444.60 | 498.05 |
| Singapore | 410 | 413.90 | 27.88 | 356.00 | 493.00 | 35.5 | 137.00 | 370.15 | 410.00 | 464.75 | ||
| Taiwan | 417.3 | 419.97 | 26.62 | 362.60 | 477.00 | 34.6 | 114.40 | 375.66 | 417.30 | 465.67 | ||
| China | 428.5 | 425.69 | 40.55 | 160.00 | 500.00 | 40 | 340.00 | 366.94 | 428.50 | 480.00 | ||
| 7 | Knee height | India | 551.6 | 551.23 | 44.03 | 463.10 | 835.40 | 47.5 | 372.30 | 492.00 | 551.60 | 603.63 |
| Singapore | 491.5 | 501.20 | 39.74 | 425.00 | 680.00 | 53.75 | 255.00 | 453.25 | 491.50 | 572.95 | ||
| Taiwan | 506.85 | 508.14 | 24.76 | 458.60 | 560.10 | 38.57 | 101.50 | 469.15 | 506.85 | 549.68 | ||
| China | 534 | 532.95 | 28.04 | 430.00 | 601.00 | 35.1 | 171.00 | 490.00 | 534.00 | 590.20 | ||
| 8 | Acromion-grip length | India | 627.55 | 629.17 | 41.14 | 528.60 | 750.00 | 51.2 | 221.40 | 561.85 | 627.55 | 702.58 |
| Singapore | 650 | 651.90 | 60.04 | 542.00 | 800.00 | 54 | 258.00 | 553.70 | 650.00 | 764.75 | ||
| Taiwan | 566.825 | 568.96 | 27.26 | 491.50 | 635.80 | 33.67 | 144.30 | 521.44 | 566.83 | 617.38 | ||
| China | 625 | 630.97 | 40.45 | 550.00 | 750.00 | 52 | 200.00 | 580.00 | 625.00 | 716.00 | ||
| 9 | Hand length | India | 177.95 | 177.63 | 13.38 | 150.90 | 209.30 | 21.58 | 58.40 | 155.60 | 177.95 | 199.80 |
| Singapore | 183 | 182.17 | 8.47 | 160.00 | 205.00 | 11 | 45.00 | 168.00 | 183.00 | 196.95 | ||
| Taiwan | 178.1 | 178.01 | 9.98 | 148.00 | 200.50 | 10.97 | 52.50 | 159.38 | 178.10 | 195.49 | ||
| China | 185 | 185.40 | 21.83 | 76.00 | 300.00 | 15.9 | 224.00 | 170.00 | 185.00 | 209.20 | ||
| 10 | Elbow-hand length | India | 475.05 | 474.55 | 25.91 | 420.30 | 538.90 | 35.65 | 118.60 | 433.50 | 475.05 | 523.68 |
| Singapore | 461.5 | 462.06 | 26.58 | 386.00 | 520.00 | 36.75 | 134.00 | 413.10 | 461.50 | 497.00 | ||
| Taiwan | 367.15 | 366.57 | 19.59 | 317.00 | 420.60 | 24.43 | 103.60 | 340.24 | 367.15 | 408.84 | ||
| China | 450 | 448.96 | 28.26 | 270.00 | 500.00 | 29 | 230.00 | 406.80 | 450.00 | 490.00 | ||
| 11 | Buttock-popliteal length | India | 497.95 | 497.73 | 39.29 | 398.30 | 569.80 | 57.82 | 171.50 | 436.25 | 497.95 | 563.18 |
| Singapore | 458 | 455.22 | 26.96 | 356.00 | 508.00 | 29.75 | 152.00 | 400.15 | 458.00 | 497.00 | ||
| Taiwan | 353.05 | 354.83 | 24.88 | 289.30 | 416.00 | 33.55 | 126.70 | 307.97 | 353.05 | 398.92 | ||
| China | 440 | 438.40 | 38.95 | 330.00 | 524.00 | 41.5 | 194.00 | 360.00 | 440.00 | 508.00 | ||
| 12 | Buttock-knee length | India | 596.65 | 595.15 | 35.29 | 497.70 | 675.40 | 51.4 | 177.70 | 538.95 | 596.65 | 655.03 |
| Singapore | 568.5 | 562.25 | 29.21 | 470.00 | 624.00 | 32.5 | 154.00 | 491.70 | 568.50 | 596.85 | ||
| Taiwan | 455 | 453.76 | 31.04 | 351.70 | 517.10 | 40.67 | 165.40 | 393.27 | 455.00 | 499.90 | ||
| China | 549.4 | 547.53 | 68.97 | 478.56 | 671.00 | 47.5 | 671.00 | 480.00 | 549.40 | 630.80 | ||
| 13 | Elbow-to-elbow breadth | India | 434 | 430.31 | 38.41 | 330.00 | 533.00 | 60 | 203.00 | 357.75 | 434.00 | 488.75 |
| Singapore | 430.5 | 434.95 | 28.67 | 379.00 | 533.00 | 40.5 | 154.00 | 399.10 | 430.50 | 489.50 | ||
| Taiwan | 401.55 | 399.11 | 23.15 | 349.20 | 449.80 | 35.65 | 100.60 | 361.62 | 401.55 | 435.73 | ||
| China | 450 | 451.58 | 48.70 | 150.00 | 600.00 | 40 | 450.00 | 393.00 | 450.00 | 518.94 | ||
| 14 | Hip breadth (Sitting) | India | 340 | 336.88 | 27.54 | 270.00 | 425.00 | 34.75 | 155.00 | 290.00 | 340.00 | 380.00 |
| Singapore | 306 | 307.17 | 21.19 | 250.00 | 371.00 | 26.75 | 121.00 | 273.00 | 306.00 | 347.75 | ||
| Taiwan | 376.95 | 376.75 | 26.44 | 321.90 | 445.60 | 34.05 | 123.70 | 327.20 | 376.95 | 421.18 | ||
| China | 360 | 360.11 | 38.76 | 250.00 | 550.00 | 40 | 300.00 | 299.20 | 360.00 | 413.54 | ||
| 15 | Foot breadth | India | 100 | 101.72 | 8.27 | 85.00 | 115.00 | 15 | 30.00 | 90.00 | 100.00 | 115.00 |
| Singapore | 102 | 101.06 | 6.70 | 82.00 | 114.00 | 8 | 32.00 | 90.05 | 102.00 | 112.90 | ||
| Taiwan | 104.05 | 104.31 | 4.70 | 91.60 | 120.30 | 6.13 | 28.70 | 96.65 | 104.05 | 111.90 | ||
| China | 100 | 101.98 | 16.82 | 76.00 | 240.00 | 10.7 | 164.00 | 88.40 | 100.00 | 121.60 | ||
| 16 | BMI (kg/m²) | India | 23.81 | 23.80 | 3.67 | 13.71 | 31.74 | 5.71 | 18.03 | 18.48 | 23.81 | 29.25 |
| Singapore | 22.8 | 23.27 | 2.13 | 18.94 | 31.63 | 2.83 | 12.69 | 19.96 | 22.80 | 27.22 | ||
| Taiwan | 22.18 | 22.37 | 2.61 | 17.96 | 31.14 | 3.05 | 13.18 | 18.43 | 22.18 | 27.29 | ||
| China | 23.53 | 23.71 | 3.22 | 17.04 | 34.84 | 3.53 | 17.80 | 18.62 | 23.53 | 29.26 | ||
| 17 | Weight (kg) | India | 68.5 | 68.24 | 10.72 | 38.00 | 96.00 | 16.13 | 58.00 | 51.00 | 68.50 | 83.50 |
| Singapore | 64 | 65.94 | 7.42 | 50.00 | 95.00 | 9.75 | 45.00 | 58.00 | 64.00 | 79.95 | ||
| Taiwan | 67.5 | 67.59 | 8.56 | 53.00 | 92.00 | 11.25 | 39.00 | 55.00 | 67.50 | 85.00 | ||
| China | 70 | 70.36 | 10.72 | 52.00 | 110.00 | 12 | 58.00 | 55.00 | 70.00 | 90.80 | ||
| Anthropometric Variables | Kruskal– Wallis Test | p-Value | Group’s Mean Rank | |||
|---|---|---|---|---|---|---|
| H | p | Singapore (SGD) | India (INR) | Taiwan (ROC) | China (PRC) | |
| Stature body height | 26.36 | 0.0001 | 169.98 | 183.48 | 235.73 | 237.13 |
| Buttock extension | 178.65 | 0.002 | 335.86 | 132.27 | 153.7 | 212.2 |
| Shoulder height (Sitting) | 199.9 | 0.002 | 219.33 | 216.13 | 82.43 | 314.01 |
|
Shoulder-elbow length | 235.15 | 0.004 | 229.34 | 261.06 | 57.34 | 284.74 |
| Elbow height (Sitting) | 79.01 | 0.0001 | 199.94 | 126.52 | 266.14 | 234.25 |
| Lower leg length | 52.29 | 0.004 | 157.25 | 271.71 | 183.76 | 213.88 |
| Knee height | 117.67 | 0.003 | 133.29 | 289.69 | 157.2 | 246.33 |
| Acromion-grip length | 157.64 | 0.0001 | 271.79 | 238.24 | 83.55 | 239.6 |
| Hand length | 31.07 | 0.0001 | 221.73 | 178.21 | 175.48 | 254.21 |
| Elbow-hand length | 254.18 | 0.0001 | 262.53 | 297.87 | 55.19 | 217.57 |
| Buttock-popliteal length | 278.97 | 0.002 | 242.38 | 328.1 | 58.97 | 202.72 |
| Buttock-knee length | 259.74 | 0.0001 | 243.12 | 315 | 58.15 | 216.07 |
| Elbow-to-elbow breadth | 123.45 | 0.003 | 227.42 | 215.63 | 104.88 | 283.56 |
| Hip breadth (Sitting) | 206.55 | 0.0001 | 82.4 | 179.1 | 309.43 | 250.73 |
| Foot breadth | 19.91 | 0.004 | 192.96 | 207.82 | 247.73 | 177.9 |
| BMI | 18.14 | 0.0001 | 207.61 | 230.72 | 166.84 | 223.79 |
| Weight | 11.97 | 0.0001 | 176.82 | 216.51 | 201.43 | 232.43 |
| Statistical Parameters | SGD vs. ROC | SGD vs. PRC | SGD vs. INR | |||
| Mann–Whitney U | Sig (2-Tailed) p-Value | Mann–Whitney U | Sig (2-Tailed) p-Value | Mann–Whitney U | Sig (2-Tailed) p-Value | |
| BMI | 4027 | 0.003 | 4648 | 0.23 | 4490 | 0.09 |
| Weight | 4629.5 | 0.11 | 3724 | 0.001 | 4278.5 | 0.02 |
| Stature body height | 3619.5 | 0 | 3517 | 0 | 4811.5 | 0.35 |
| Buttock extension | 576.5 | 0 | 1701 | 0 | 486.5 | 0 |
| Shoulder height (Sitting) | 1605.5 | 0 | 2662.5 | 0 | 5174.5 | 0.95 |
| Shoulder-elbow length | 402.5 | 0 | 3532 | 0 | 4154 | 0.01 |
| Elbow height (Sitting) | 3515.5 | 0 | 4251.5 | 0.03 | 3223 | 0 |
| Lower leg length | 4532.5 | 0.07 | 3680.5 | 0 | 2461.5 | 0 |
| Knee height | 4216 | 0.01 | 2318.5 | 0 | 1744.5 | 0 |
| Acromion-grip length | 1067.5 | 0 | 4053.5 | 0.009 | 4050 | 0.006 |
| Hand length | 3966.5 | 0.002 | 4179 | 0.02 | 4090 | 0.008 |
| Elbow-hand length | 36.5 | 0 | 3671 | 0 | 4010 | 0.005 |
| Buttock-popliteal length | 81 | 0 | 3591 | 0 | 1959.5 | 0 |
| Buttock-knee length | 102.5 | 0 | 4067 | 0.01 | 2531 | 0 |
| Elbow-to-elbow breadth | 1739.5 | 0 | 3372 | 0 | 4941 | 0.53 |
| Hip breadth (Sitting) | 206.5 | 0 | 1009 | 0 | 1974.5 | 0 |
| Foot breadth | 3792 | 0 | 4667.5 | 0.24 | 4821 | 0.36 |
| Statistical Parameters | ROC vs. PRC | INR vs. ROC | INR vs. PRC | |||
| Mann–Whitney U | Sig (2-Tailed) p-Value | Mann–Whitney U | Sig (2-Tailed) p-Value | Mann–Whitney U | Sig (2-Tailed) p-Value | |
| BMI | 3968 | 0.001 | 4019 | 0.001 | 5092.5 | 0.54 |
| Weight | 4606 | 0.051 | 5104 | 0.35 | 5016 | 0.43 |
| Stature body height | 5376 | 0.849 | 4064.5 | 0.001 | 3968.5 | 0.001 |
| Buttock extension | 3705 | 0 | 4684.5 | 0.06 | 3125.5 | 0 |
| Shoulder height (Sitting) | 313.5 | 0 | 1148 | 0 | 1966.5 | 0 |
| Shoulder-elbow length | 1 | 0 | 4 | 0 | 4424.5 | 0.03 |
| Elbow height (Sitting) | 4786.5 | 0.124 | 1700.5 | 0 | 2775 | 0 |
| Lower leg length | 4640.5 | 0.061 | 3100 | 0 | 3777 | 0 |
| Knee height | 2707.5 | 0 | 1900.5 | 0 | 3823.5 | 0 |
| Acromion-grip length | 914 | 0 | 1204 | 0 | 5265 | 0.83 |
| Hand length | 3395.5 | 0 | 5456 | 0.89 | 3528 | 0 |
| Elbow-hand length | 142 | 0 | 1 | 0 | 2607 | 0 |
| Buttock-popliteal length | 492 | 0 | 7 | 0 | 1507.5 | 0 |
| Buttock-knee length | 385 | 0 | 5 | 0 | 2299.5 | 0 |
| Elbow-to-elbow breadth | 1029 | 0 | 2677.5 | 0 | 3678 | 0 |
| Hip breadth (Sitting) | 3635.5 | 0 | 1571 | 0 | 3169.5 | 0 |
| Foot breadth | 3515.5 | 0 | 4646.5 | 0.04 | 4784.5 | 0.18 |
Publisher’s Note: MDPI stays neutral with regard to jurisdictional claims in published maps and institutional affiliations. |
© 2022 by the authors. Licensee MDPI, Basel, Switzerland. This article is an open access article distributed under the terms and conditions of the Creative Commons Attribution (CC BY) license (https://creativecommons.org/licenses/by/4.0/).
Share and Cite
Muthiah, A.; Lee, Y.-C. Comparative Analysis of Male Cyclist Population in Four Asia Countries for Anthropometric Measurements. Int. J. Environ. Res. Public Health 2022, 19, 10078. https://0-doi-org.brum.beds.ac.uk/10.3390/ijerph191610078
Muthiah A, Lee Y-C. Comparative Analysis of Male Cyclist Population in Four Asia Countries for Anthropometric Measurements. International Journal of Environmental Research and Public Health. 2022; 19(16):10078. https://0-doi-org.brum.beds.ac.uk/10.3390/ijerph191610078
Chicago/Turabian StyleMuthiah, Arunachalam, and Yu-Chi Lee. 2022. "Comparative Analysis of Male Cyclist Population in Four Asia Countries for Anthropometric Measurements" International Journal of Environmental Research and Public Health 19, no. 16: 10078. https://0-doi-org.brum.beds.ac.uk/10.3390/ijerph191610078