
Characteristics of Japanese Older Adults Whose Trunk Muscle Mass Decreased during the COVID-19 Pandemic
 , , , , , , ,
Abstract
:1. Introduction
2. Materials and Methods
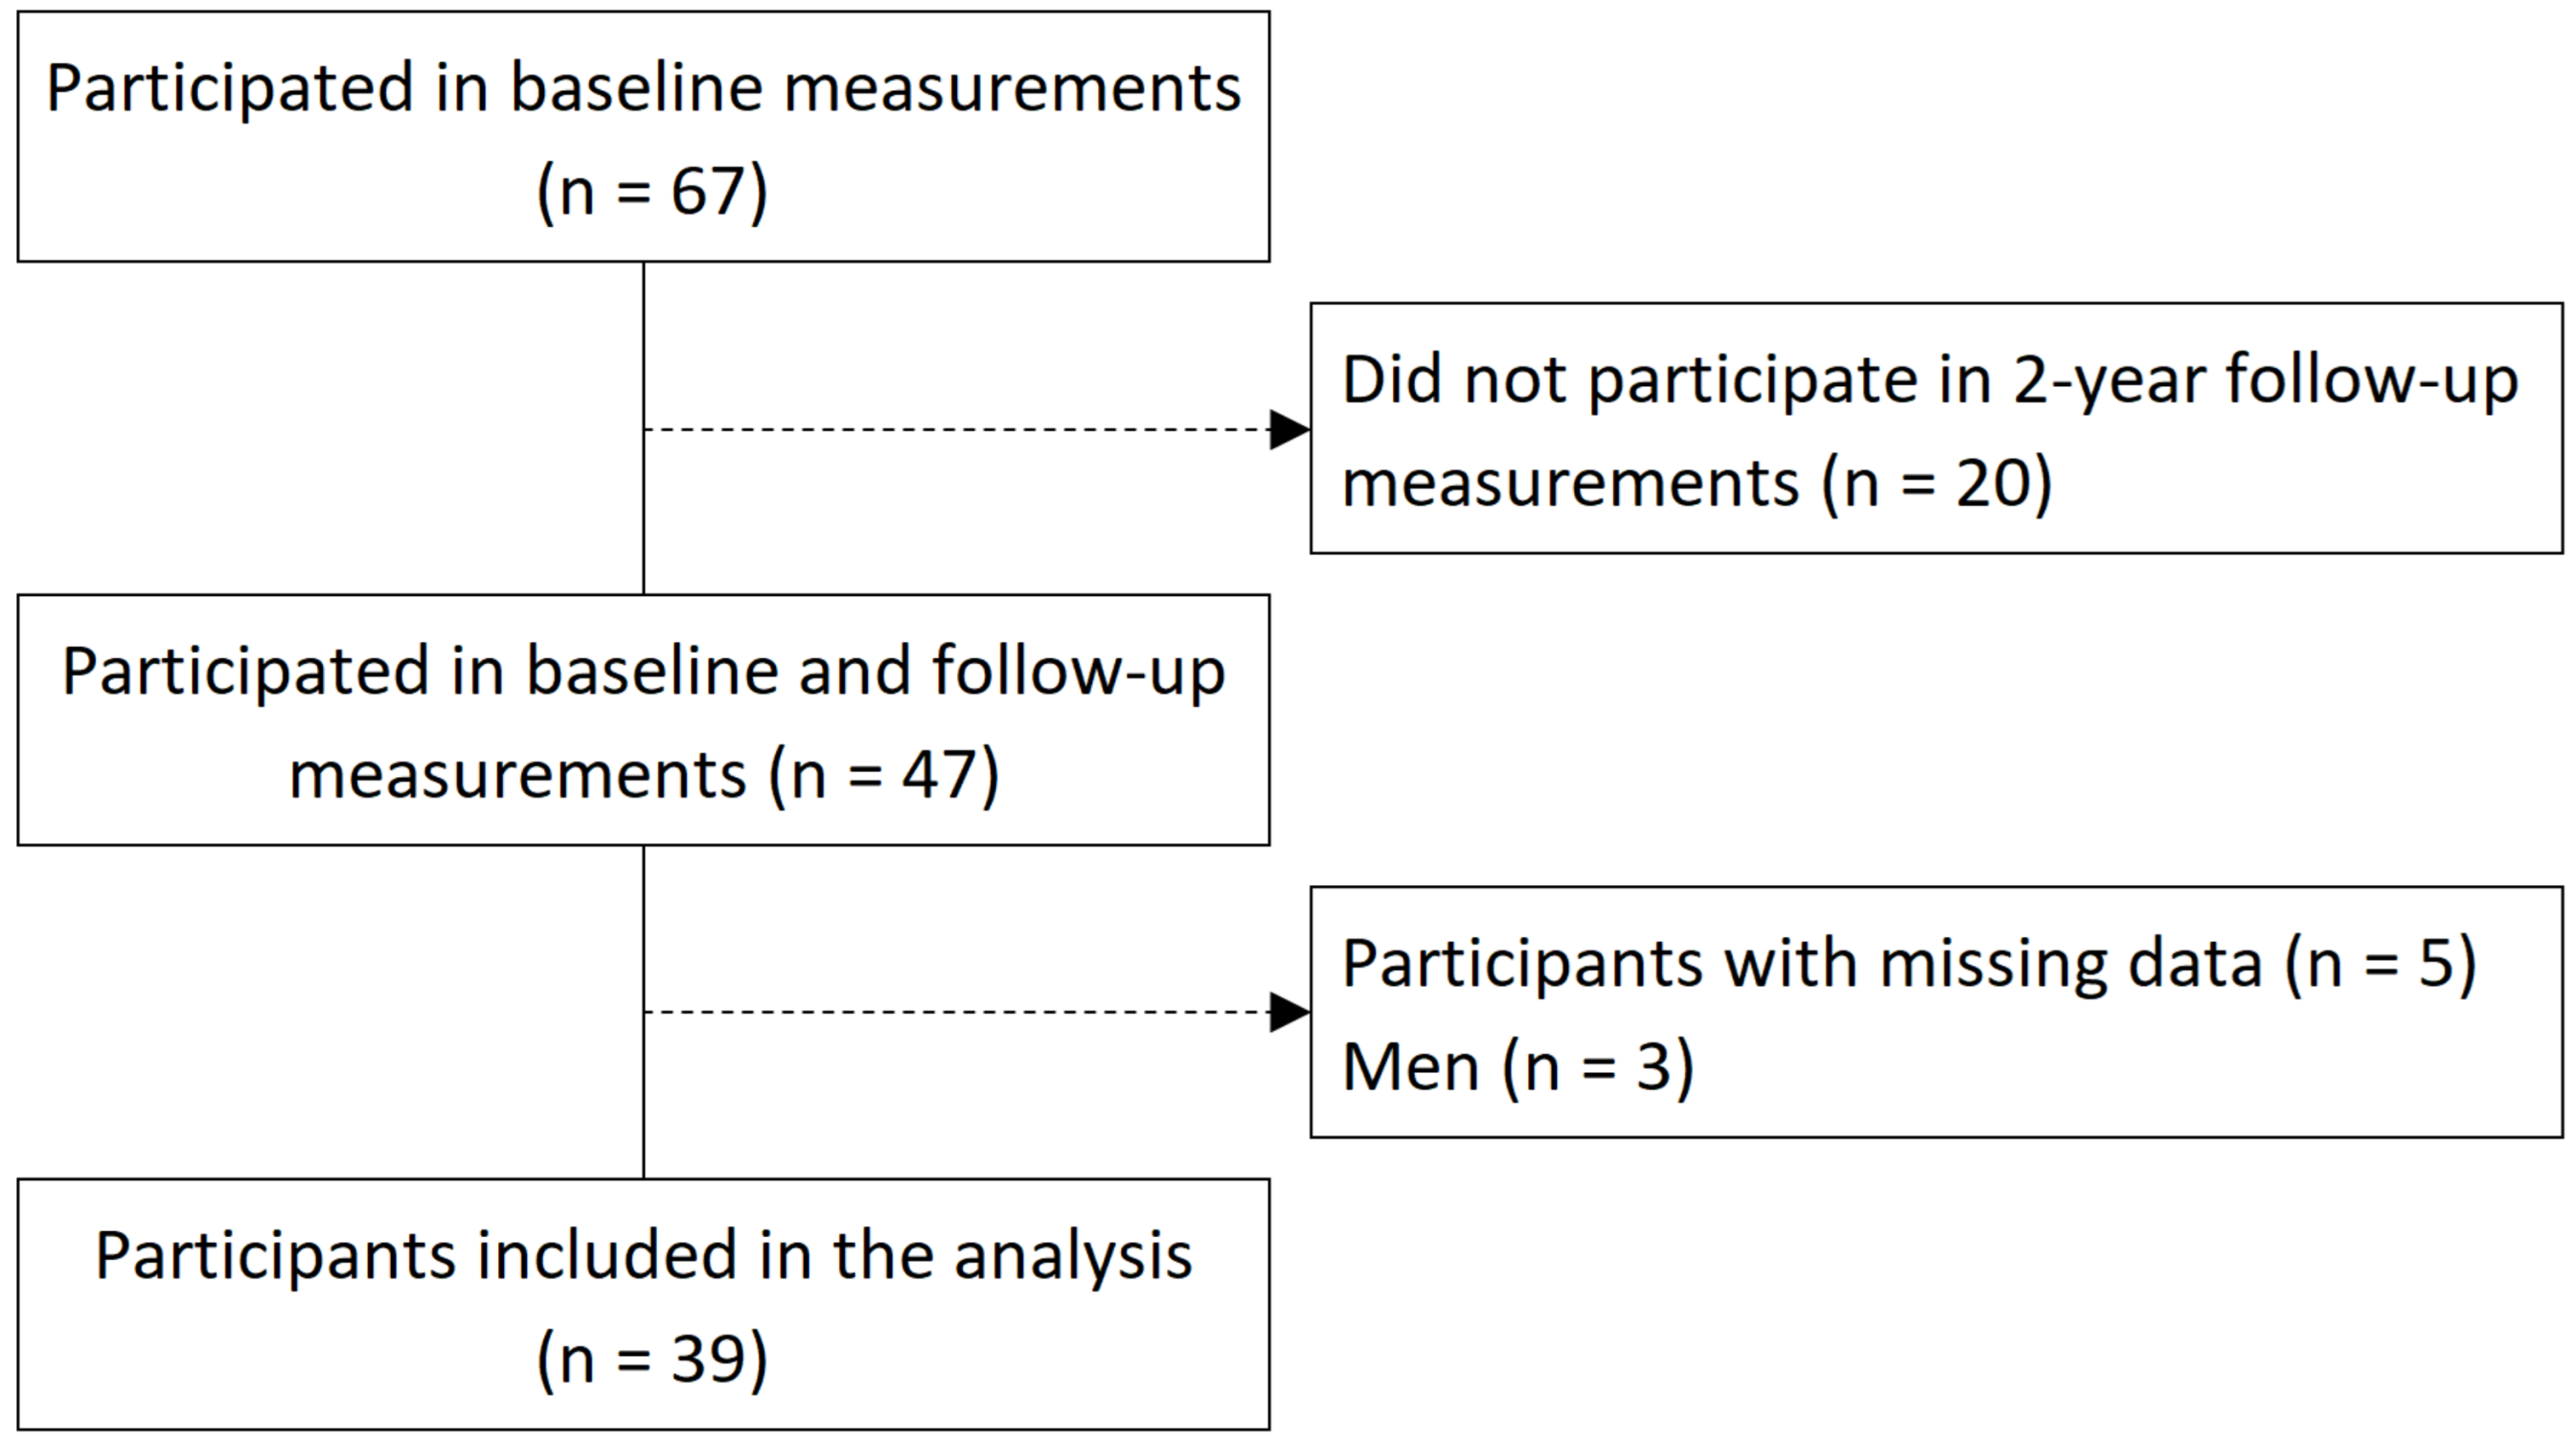
2.1. Study Design and Participants
2.2. Body Composition, Handgrip Strength, Walking Speed, and Calf Circumference
2.3. Evaluation of Frailty
2.4. Evaluation of Background Factors
2.5. Statistical Analysis
3. Results
4. Discussion
5. Conclusions
Author Contributions
Funding
Institutional Review Board Statement
Informed Consent Statement
Data Availability Statement
Acknowledgments
Conflicts of Interest
References
- Hirose, T.; Sawaya, Y.; Shiba, T.; Ishizaka, M.; Onoda, K.; Kubo, A.; Urano, T. Characteristics of patients discontinuing outpatient services under long-term care insurance and its effect on frailty during COVID-19. PeerJ 2021, 9, e11160. [Google Scholar] [CrossRef] [PubMed]
- Mostaza, J.M.; García-Iglesias, F.; González-Alegre, T.; Blanco, F.; Varas, M.; Hernández-Blanco, C.; Hontañón, V.; Jaras-Hernández, M.J.; Martínez-Prieto, M.; Menéndez-Saldaña, A.; et al. Clinical course and prognostic factors of COVID-19 infection in an elderly hospitalized population. Arch. Gerontol. Geriatr. 2020, 91, 104204. [Google Scholar] [CrossRef] [PubMed]
- Niu, S.; Tian, S.; Lou, J.; Kang, X.; Zhang, L.; Lian, H.; Zhang, J. Clinical characteristics of older patients infected with COVID-19: A descriptive study. Arch. Gerontol. Geriatr. 2020, 89, 104058. [Google Scholar] [CrossRef] [PubMed]
- Bonanad, C.; García-Blas, S.; Tarazona-Santabalbina, F.; Sanchis, J.; Bertomeu-González, V.; Fácila, L.; Ariza, A.; Núñez, J.; Cordero, A. The effect of age on mortality in patients with COVID-19: A meta-analysis with 611,583 Subjects. J. Am. Med. Dir. Assoc. 2020, 21, 915–918. [Google Scholar] [CrossRef] [PubMed]
- Shinohara, T.; Saida, K.; Tanaka, S.; Murayama, A. Association between frailty and changes in lifestyle and physical or psychological conditions among older adults affected by the coronavirus disease 2019 countermeasures in Japan. Geriatr. Gerontol. Int. 2021, 21, 39–42. [Google Scholar] [CrossRef] [PubMed]
- Abe, T.; Thiebaud, R.S.; Loenneke, J.P. Age-related change in handgrip strength in men and women: Is muscle quality a contributing factor? Age 2016, 38, 28. [Google Scholar] [CrossRef] [PubMed]
- Makizako, H.; Shimada, H.; Doi, T.; Tsutsumimoto, K.; Lee, S.; Lee, S.C.; Harada, K.; Hotta, R.; Nakakubo, S.; Bae, S.; et al. Age-dependent changes in physical performance and body composition in community-dwelling Japanese older adults. J. Cachexia Sarcopenia Muscle 2017, 8, 607–614. [Google Scholar] [CrossRef]
- Seino, S.; Shinkai, S.; Iijima, K.; Obuchi, S.; Fujiwara, Y.; Yoshida, H.; Kawai, H.; Nishi, M.; Murayama, H.; Taniguchi, Y.; et al. Reference values and age differences in body composition of community-dwelling older Japanese men and women: A pooled analysis of four cohort studies. PLoS ONE 2015, 10, e0131975. [Google Scholar] [CrossRef]
- Bohannon, R.W.; Williams Andrews, A. Normal walking speed: A descriptive meta-analysis. Physiotherapy 2011, 97, 182–189. [Google Scholar] [CrossRef]
- Lauretani, F.; Russo, C.R.; Bandinelli, S.; Bartali, B.; Cavazzini, C.; Di Iorio, A.; Corsi, A.M.; Rantanen, T.; Guralnik, J.M.; Ferrucci, L. Age-associated changes in skeletal muscles and their effect on mobility: An operational diagnosis of sarcopenia. J. Appl. Physiol. 2003, 95, 1851–1860. [Google Scholar] [CrossRef] [Green Version]
- Yamada, M.; Kimura, Y.; Ishiyama, D.; Otobe, Y.; Suzuki, M.; Koyama, S.; Kikuchi, T.; Kusumi, H.; Arai, H. The influence of the COVID-19 pandemic on physical activity and new incidence of frailty among initially non-frail older adults in Japan: A follow-up online survey. J. Nutr. Health Aging 2021, 25, 751–756. [Google Scholar] [CrossRef]
- Suzuki, Y.; Maeda, N.; Hirado, D.; Shirakawa, T.; Urabe, Y. Physical activity changes and its risk factors among community-dwelling Japanese older adults during the COVID-19 epidemic: Associations with subjective well-being and health-related quality of life. Int. J. Environ. Res. Public Health 2020, 17, 6591. [Google Scholar] [CrossRef]
- Otaki, N.; Yokoro, M.; Yano, M.; Imamura, T.; Akita, M.; Tanino, N.; Fukuo, K. Social contact impacts physical activity and sedentary behavior among older adults in Japan due to COVID-19. BMC Geriatr. 2022, 22, 491. [Google Scholar] [CrossRef]
- Son, B.K.; Imoto, T.; Inoue, T.; Nishimura, T.; Tanaka, T.; Iijima, K. Social detachment influenced muscle mass and strength during the COVID-19 pandemic in Japanese community-dwelling older women. J. Frailty Aging 2022, 11, 231–235. [Google Scholar] [CrossRef]
- Kojima, M.; Satake, S.; Osawa, A.; Arai, H. Management of frailty under COVID-19 pandemic in Japan. Glob. Health Med. 2021, 3, 196–202. [Google Scholar] [CrossRef]
- Yamada, Y.; Nishizawa, M.; Uchiyama, T.; Kasahara, Y.; Shindo, M.; Miyachi, M.; Tanaka, S. Developing and validating an age-independent equation using multi-frequency bioelectrical impedance analysis for estimation of appendicular skeletal muscle mass and establishing a cutoff for sarcopenia. Int. J. Environ. Res. Public Health 2017, 14, 809. [Google Scholar] [CrossRef]
- Bohannon, R.W. Test-retest reliability of measurements of hand-grip strength obtained by dynamometry from older adults: A systematic review of research in the PubMed database. J. Frailty Aging 2017, 6, 83–87. [Google Scholar] [CrossRef]
- Peolsson, A.; Hedlund, R.; Oberg, B. Intra- and inter-tester reliability and reference values for hand strength. J. Rehabil. Med. 2001, 33, 36–41. [Google Scholar] [CrossRef]
- Liston, R.A.; Brouwer, B.J. Reliability and validity of measures obtained from stroke patients using the Balance Master. Arch. Phys. Med. Rehabil. 1996, 77, 425–430. [Google Scholar] [CrossRef]
- Bohannon, R.W. Comfortable and maximum walking speed of adults aged 20-79 years: Reference values and determinants. Age Ageing 1997, 26, 15–19. [Google Scholar] [CrossRef] [Green Version]
- Jamaiyah, H., Jr.; Geeta, A.; Safiza, M.N.; Wong, N.F.; Kee, C.C.; Ahmad, A.Z.; Suzana, S.; Rahmah, R.; Khor, G.L.; Ruzita, A.T.; et al. Reliability and technical error of calf circumference and mid-half arm span measurements for nutritional status assessment of elderly persons in Malaysia. Malays. J. Nutr. 2008, 14, 137–150. [Google Scholar]
- Satake, S.; Senda, K.; Hong, Y.J.; Miura, H.; Endo, H.; Sakurai, T.; Kondo, I.; Toba, K. Validity of the Kihon Checklist for assessing frailty status, Geriatr. Gerontol. Int. 2016, 16, 709–715. [Google Scholar] [CrossRef]
- Sewo Sampaio, P.Y.; Sampaio, R.A.; Yamada, M.; Arai, H. Systematic review of the Kihon Checklist: Is it a reliable assessment of frailty? Geriatr. Gerontol. Int. 2016, 16, 893–902. [Google Scholar] [CrossRef]
- Dent, E.; Lien, C.; Lim, W.S.; Wong, W.C.; Wong, C.H.; Ng, T.P.; Woo, J.; Dong, B.; de la Vega, S.; Hua Poi, P.J.; et al. The Asia-Pacific Clinical Practice Guidelines for the Management of Frailty. J. Am. Med. Dir. Assoc. 2017, 18, 564–575. [Google Scholar] [CrossRef]
- Satake, S.; Shimokata, H.; Senda, K.; Kondo, I.; Toba, K. Validity of Total Kihon Checklist Score for predicting the incidence of 3-year dependency and mortality in a community-dwelling older population. J. Am. Med. Dir. Assoc. 2017, 18, 552.e1. [Google Scholar] [CrossRef]
- Martins, B.A.; Visvanathan, R.; Barrie, H.; Huang, C.H.; Matsushita, E.; Okada, K.; Satake, S.; Uno, C.; Kuzuya, M. Frailty prevalence using Frailty Index, associated factors and level of agreement among frailty tools in a cohort of Japanese older adults. Arch. Gerontol. Geriatr. 2019, 84, 103908. [Google Scholar] [CrossRef]
- Arai, H.; Satake, S. English translation of the Kihon Checklist. Geriatr. Gerontol. Int. 2015, 15, 518–519. [Google Scholar] [CrossRef]
- Satake, S.; Arai, H. The revised Japanese version of the cardiovascular Health Study criteria (revised J-CHS criteria). Geriatr. Gerontol. Int. 2020, 20, 992–993. [Google Scholar] [CrossRef]
- Makizako, H.; Shimada, H.; Tsutsumimoto, K.; Lee, S.; Doi, T.; Nakakubo, S.; Hotta, R.; Suzuki, T. Social frailty in community-dwelling older adults as a risk factor for disability. J. Am. Med. Dir. Assoc. 2015, 16, 1003.e7. [Google Scholar] [CrossRef]
- Chen, L.K.; Woo, J.; Assantachai, P.; Auyeung, T.W.; Chou, M.Y.; Iijima, K.; Jang, H.C.; Kang, L.; Kim, M.; Kim, S.; et al. Asian Working Group for Sarcopenia: 2019 consensus update on sarcopenia diagnosis and treatment. J. Am. Med. Dir. Assoc. 2020, 21, 300–307.e2. [Google Scholar] [CrossRef]
- Faul, F.; Erdfelder, E.; Lang, A.G.; Buchner, A. G*Power 3: A flexible statistical power analysis program for the social, behavioral, and biomedical sciences. Behav. Res. Methods 2007, 39, 175–191. [Google Scholar] [CrossRef]
- Cohen, J. A power primer. Psychol. Bull. 1992, 112, 155–159. [Google Scholar] [CrossRef] [PubMed]
- Keller, K.; Engelhardt, M. Strength and muscle mass loss with aging process. Age and strength loss. Muscles Ligaments Tendons J. 2013, 3, 346–350. [Google Scholar] [CrossRef] [PubMed]
- Yamada, M.; Moriguch, Y.; Mitani, T.; Aoyama, T.; Arai, H. Age-dependent changes in skeletal muscle mass and visceral fat area in Japanese adults from 40 to 79 years-of-age. Geriatr. Gerontol. Int. 2014, 14 (Suppl. 1), 8–14. [Google Scholar] [CrossRef]
- Tanimoto, Y.; Watanabe, M.; Kono, R.; Hirota, C.; Takasaki, K.; Kono, K. Aging changes in muscle mass of Japanese. Jpn. J. Geriatr. 2010, 47, 52–57. [Google Scholar] [CrossRef] [PubMed]
- Hughes, V.A.; Frontera, W.R.; Wood, M.; Evans, W.J.; Dallal, G.E.; Roubenoff, R.; Fiatarone Singh, M.A. Longitudinal muscle strength changes in older adults: Influence of muscle mass, physical activity, and health. J. Gerontol. A Biol. Sci. Med. Sci. 2001, 56, B209–B217. [Google Scholar] [CrossRef] [PubMed]
- Yamada, M.; Kimura, Y.; Ishiyama, D.; Otobe, Y.; Suzuki, M.; Koyama, S.; Kikuchi, T.; Kusumi, H.; Arai, H. Effect of the COVID-19 epidemic on physical activity in community-dwelling older adults in Japan: A Cross-Sectional Online Survey. J. Nutr. Health Aging 2020, 24, 948–950. [Google Scholar] [CrossRef] [PubMed]
- Hirose, T.; Sawaya, Y.; Ishizaka, M.; Hashimoto, N.; Kubo, A.; Urano, T. Kihon Checklist items associated with the development of frailty and recovery to robust status during the COVID-19 pandemic. Geriatr. Gerontol. Int. 2022, 22, 745–752. [Google Scholar] [CrossRef]
- Yamada, M.; Arai, H. Does the COVID-19 pandemic robustly influence the incidence of frailty? Geriatr. Gerontol. Int. 2021, 21, 754–755. [Google Scholar] [CrossRef]
- Xue, Q.L.; Bandeen-Roche, K.; Varadhan, R.; Zhou, J.; Fried, L.P. Initial manifestations of frailty criteria and the development of frailty phenotype in the Women’s Health and Aging Study II. J. Gerontol. A Biol. Sci. Med. Sci. 2008, 63, 984–990. [Google Scholar] [CrossRef]
- Kono, A.; Kai, I.; Sakato, C.; Rubenstein, L.Z. Frequency of going outdoors predicts long-range functional change among ambulatory frail elders living at home. Arch. Gerontol. Geriatr. 2007, 45, 233–242. [Google Scholar] [CrossRef]
- Fujita, K.; Fujiwara, Y.; Chaves, P.H.; Motohashi, Y.; Shinkai, S. Frequency of going outdoors as a good predictors for incident disability of physical function as well as disability recovery in community-dwelling older adults in rural Japan. J. Epidemiol. 2006, 16, 261–270. [Google Scholar] [CrossRef]
- Tanimoto, Y.; Watanabe, M.; Sun, W.; Hirota, C.; Sugiura, Y.; Kono, R.; Saito, M.; Kono, K. Association between muscle mass and disability in performing instrumental activities of daily living (IADL) in community-dwelling elderly in Japan. Arch. Gerontol. Geriatr. 2012, 54, e230–e233. [Google Scholar] [CrossRef]
- Ikezoe, T.; Mori, N.; Nakamura, M.; Ichihashi, N. Effects of age and inactivity due to prolonged bed rest on atrophy of trunk muscles. Eur. J. Appl. Physiol. 2012, 112, 43–48. [Google Scholar] [CrossRef]
- Shimokihara, S.; Maruta, M.; Akasaki, Y.; Ikeda, Y.; Han, G.; Kamasaki, T.; Tokuda, K.; Hidaka, Y.; Akasaki, Y.; Tabira, T. Association between frequency of going out and psychological condition among community-dwelling older adults after the COVID-19 pandemic in Japan. Healthcare 2022, 10, 439. [Google Scholar] [CrossRef]
- Makizako, H.; Nakai, Y.; Shiratsuchi, D.; Akanuma, T.; Yokoyama, K.; Matsuzaki-Kihara, Y.; Yoshida, H. Perceived declining physical and cognitive fitness during the COVID-19 state of emergency among community-dwelling Japanese old-old adults. Geriatr. Gerontol. Int. 2021, 21, 364–369. [Google Scholar] [CrossRef]
- Tanaka, T.; Takahashi, K.; Hirano, H.; Kikutani, T.; Watanabe, Y.; Ohara, Y.; Furuya, H.; Tetsuo, T.; Akishita, M.; Iijima, K. Oral frailty as a risk factor for physical frailty and mortality in community-dwelling elderly. J. Gerontol. A Biol. Sci. Med. Sci. 2018, 73, 1661–1667. [Google Scholar] [CrossRef]
- Doi, T.; Tsutsumimoto, K.; Ishii, H.; Nakakubo, S.; Kurita, S.; Shimada, H. Frailty and driving status associated with disability: A 24-month follow-up longitudinal study. BMJ Open 2021, 11, e042468. [Google Scholar] [CrossRef]
- Herr, M.; Sirven, N.; Grondin, H.; Pichetti, S.; Sermet, C. Frailty, polypharmacy, and potentially inappropriate medications in old people: Findings in a representative sample of the French population. Eur. J. Clin. Pharmacol. 2017, 73, 1165–1172. [Google Scholar] [CrossRef] [Green Version]


| Baseline | Follow-Up | p Value | |
|---|---|---|---|
| Body weight (kg) | 53.1 ± 8.3 | 52.0 ± 8.5 | 0.010 * |
| BMI (kg/m2) | 23.6 ± 3.7 | 23.4 ± 3.9 | 0.285 |
| Body fat (kg) | 17.8 ± 6.6 | 17.7 ± 6.8 | 0.859 |
| Arm fat (kg) | 1.5 ± 0.7 | 1.5 ± 0.7 | 0.798 |
| Leg fat (kg) | 6.5 ± 2.1 | 6.7 ± 2.1 | 0.168 |
| Trunk fat (kg) | 9.8 ± 3.9 | 9.6 ± 4.2 | 0.259 |
| Body fat percentage (%) | 32.5 ± 7.9 | 33.0 ± 8.3 | 0.413 |
| Calf circumference (cm) | 33.5 ± 2.8 | 33.5 ± 2.8 | 0.889 |
| Handgrip strength (kg) | 23.2 ± 3.7 | 23.0 ± 3.4 | 0.413 |
| Usual walking speed (m/s) | 1.3 ± 0.2 | 1.4 ± 0.3 | 0.382 |
| ASMI (kg/m2) † | 6.3 ± 0.7 | 6.4 ± 0.5 | 0.118 |
| ASM (kg) | 14.1 ± 1.8 | 14.3 ± 1.8 | 0.468 |
| Arm muscle mass (kg) | 3.2 ± 0.4 | 3.1 ± 0.4 | 0.516 |
| Leg muscle mass (kg) | 11.0 ± 1.5 | 11.2 ± 1.5 | 0.324 |
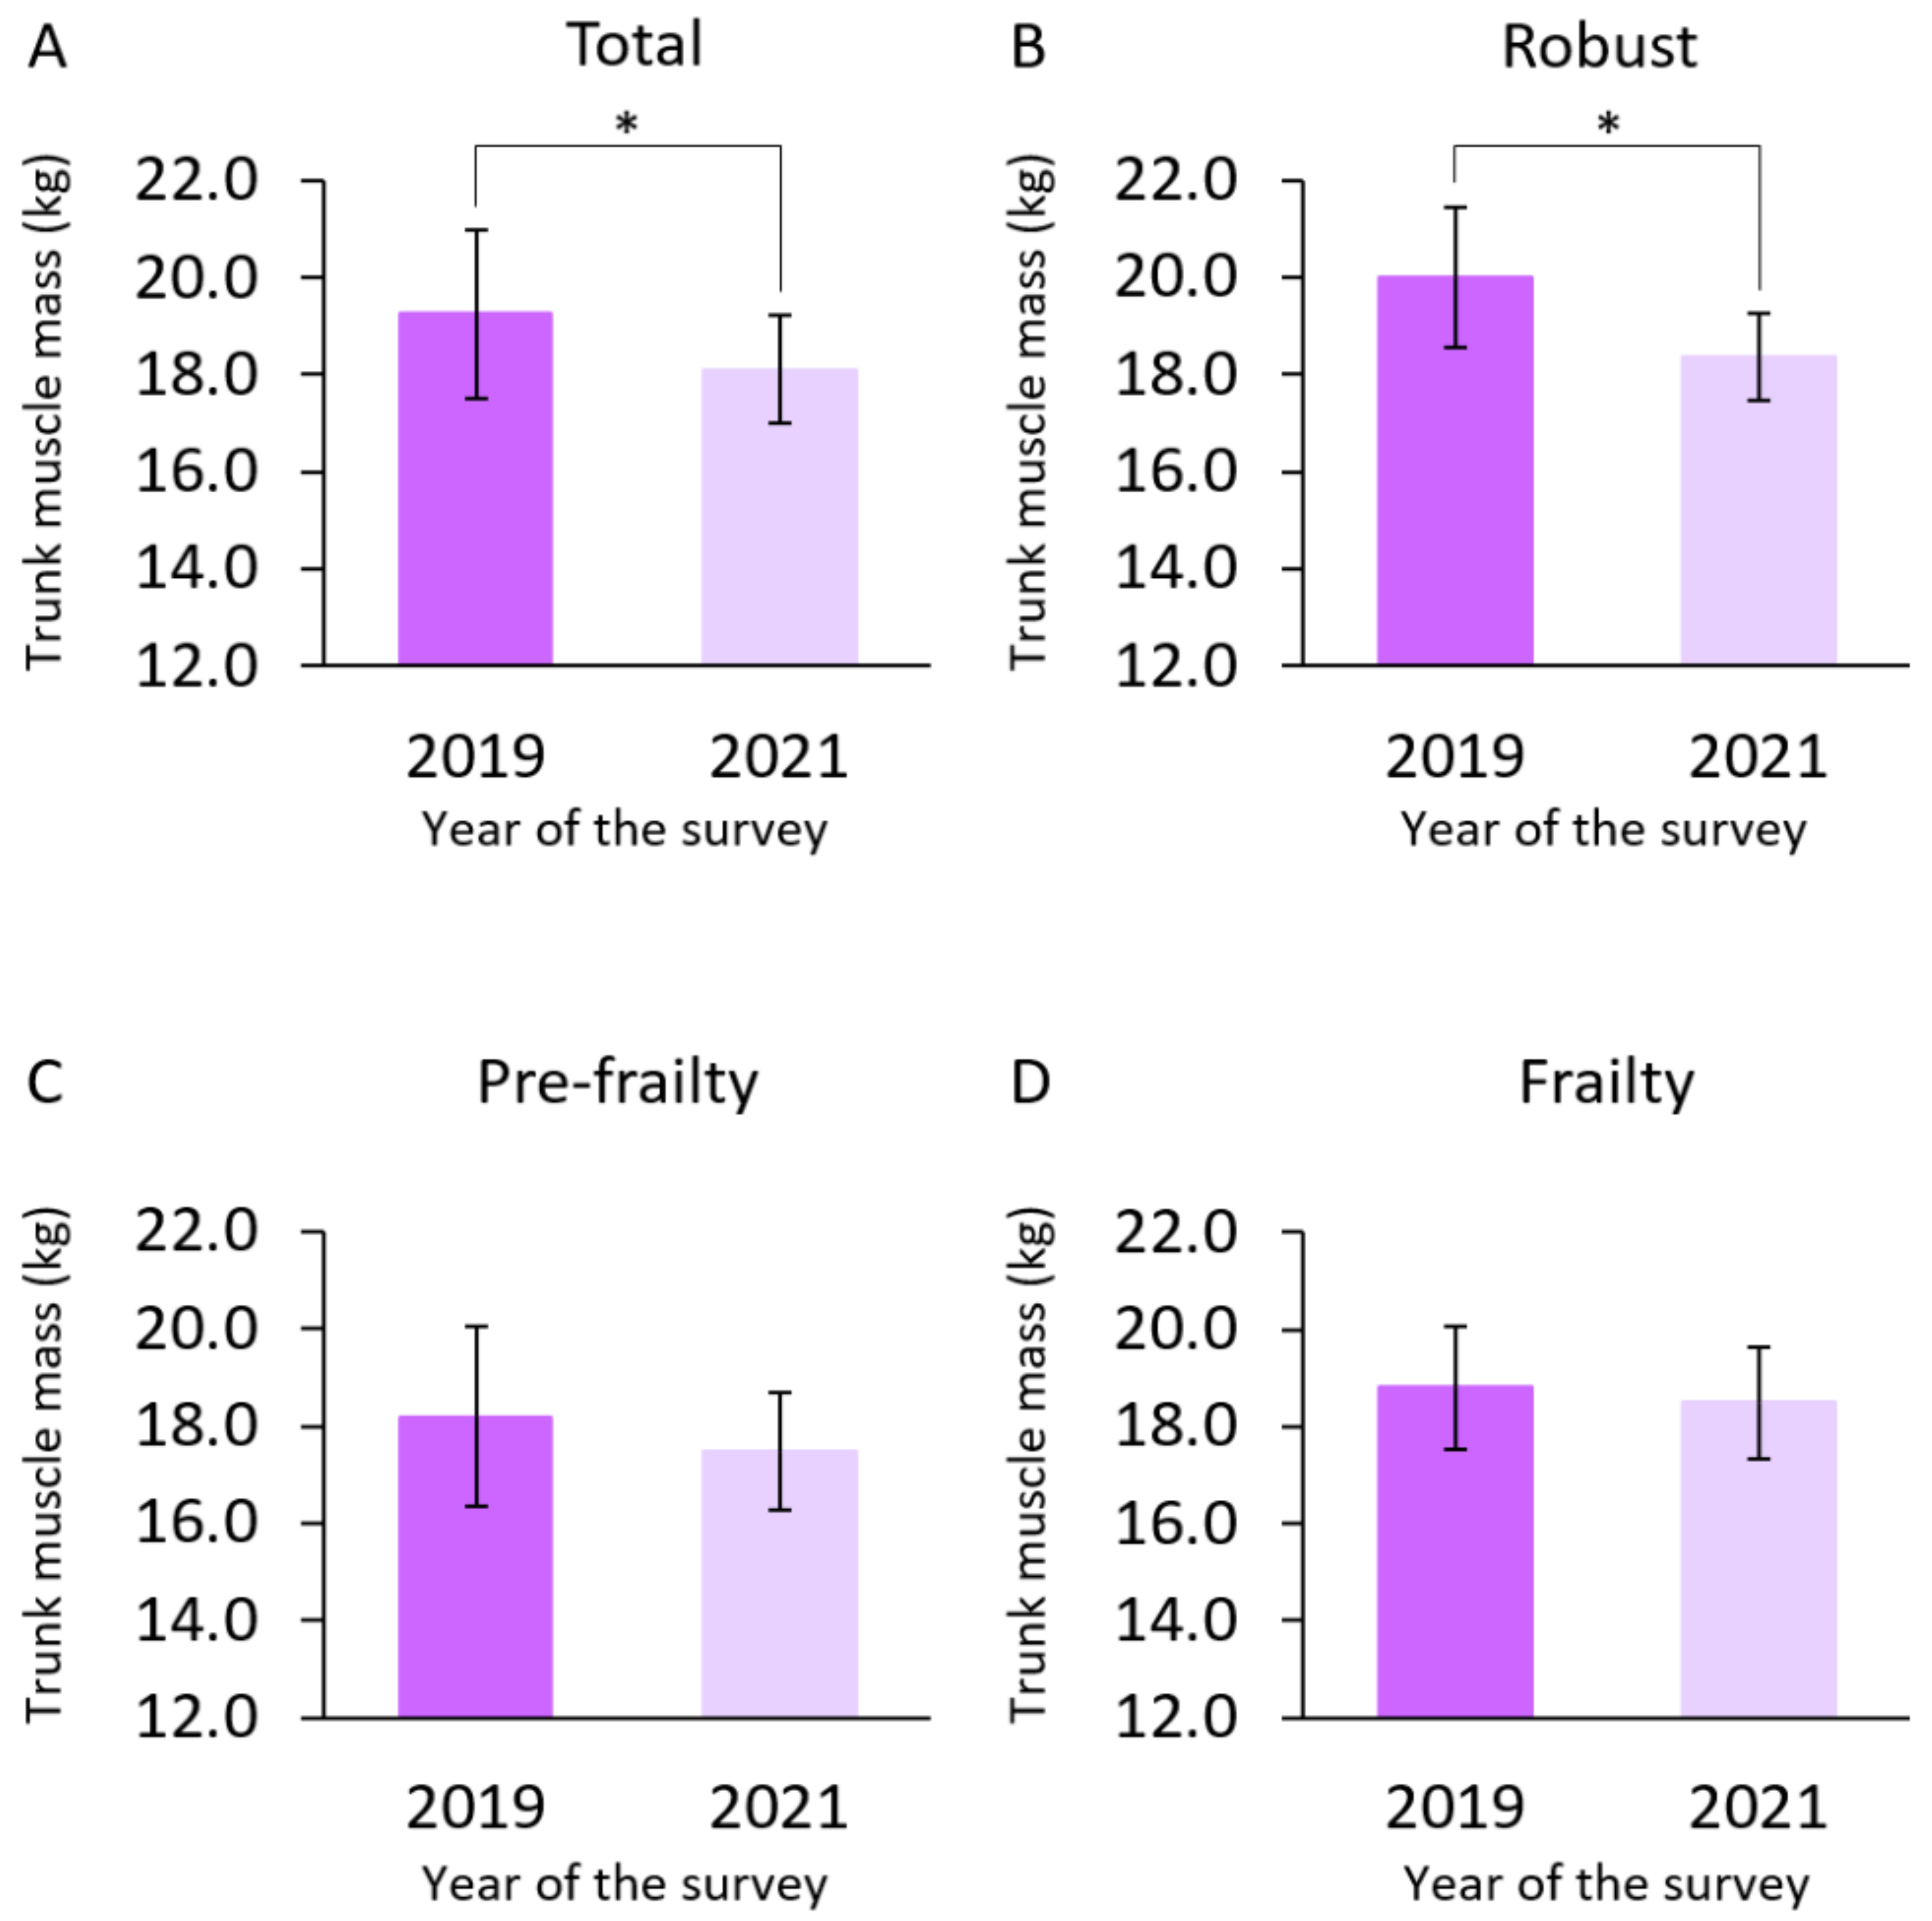
| Trunk muscle mass (kg) | 19.3 ± 1.7 | 18.1 ± 1.1 | <0.001 * |
| Baseline | |||
|---|---|---|---|
| Age | 76.1 ± 5.9 | ||
| Number of medications | 2.9 ± 2.5 | ||
| “Do you engage in low levels of physical exercise aimed at health?” | Yes (36) | No (3) | |
| “Do you engage in moderate levels of physical exercise or sports aimed at health?” | Yes (29) | No (10) | |
| Sarcopenia | No sarcopenia (38) | Sarcopenia (1) | |
| Frailty status | Robust (21) | Pre-frailty (12) | Frailty (6) |
| Follow-Up | |||
| Number of medications | 3.4 ± 2.6 | ||
| Living alone | Yes (9) | No (30) | |
| “Do you go out less frequently compared with last year?” | Yes (16) | No (23) | |
| “Do you engage in low levels of physical exercise aimed at health?” | Yes (34) | No (5) | |
| “Do you engage in moderate levels of physical exercise or sports aimed at health?” | Yes (27) | No (12) | |
| Deterioration of frailty stage | Presence (9) | Absence (30) |
| β | 95% CI | p Value | |
|---|---|---|---|
| Frailty status at baseline † | 0.714 | 0.101 to 1.327 | 0.024 * |
| “Do you go out less frequently compared with last year”? at follow-up ‡ | −0.933 | −1.852 to −0.014 | 0.047 * |
Publisher’s Note: MDPI stays neutral with regard to jurisdictional claims in published maps and institutional affiliations. |
© 2022 by the authors. Licensee MDPI, Basel, Switzerland. This article is an open access article distributed under the terms and conditions of the Creative Commons Attribution (CC BY) license (https://creativecommons.org/licenses/by/4.0/).
Share and Cite
Hirose, T.; Sawaya, Y.; Ishizaka, M.; Hashimoto, N.; Ito, A.; Endo, Y.; Kobayashi, K.; Yakabi, A.; Onoda, K.; Hara, T.; et al. Characteristics of Japanese Older Adults Whose Trunk Muscle Mass Decreased during the COVID-19 Pandemic. Int. J. Environ. Res. Public Health 2022, 19, 11438. https://0-doi-org.brum.beds.ac.uk/10.3390/ijerph191811438
Hirose T, Sawaya Y, Ishizaka M, Hashimoto N, Ito A, Endo Y, Kobayashi K, Yakabi A, Onoda K, Hara T, et al. Characteristics of Japanese Older Adults Whose Trunk Muscle Mass Decreased during the COVID-19 Pandemic. International Journal of Environmental Research and Public Health. 2022; 19(18):11438. https://0-doi-org.brum.beds.ac.uk/10.3390/ijerph191811438
Chicago/Turabian StyleHirose, Tamaki, Yohei Sawaya, Masahiro Ishizaka, Naori Hashimoto, Akihiro Ito, Yoshiaki Endo, Kaoru Kobayashi, Akihiro Yakabi, Ko Onoda, Tsuyoshi Hara, and et al. 2022. "Characteristics of Japanese Older Adults Whose Trunk Muscle Mass Decreased during the COVID-19 Pandemic" International Journal of Environmental Research and Public Health 19, no. 18: 11438. https://0-doi-org.brum.beds.ac.uk/10.3390/ijerph191811438