
Does Physical Activity Reduce the Risk of Perceived Negative Health in the Smoking Population?
 , , ,
, , ,  , , , ,
Abstract
:1. Introduction
2. Materials and Methods
2.1. Ethical Considerations
2.2. Study Design
2.3. Participants
2.4. Variables and Procedures
2.5. Statistical Analysis
3. Results
4. Discussion
4.1. Main Findings and Theoretical Implications
4.2. Practical Implications
4.3. Limitations and Future Lines
5. Conclusions
Author Contributions
Funding
Institutional Review Board Statement
Informed Consent Statement
Data Availability Statement
Conflicts of Interest
Appendix A


References
- Artacho, H.N.; del Valle, A.M.; Vicente, V.C. Tabaquismo y Morbimortalidad Durante 20 Años En España: A Propósito de La Enfermedad Pulmonar Obstructiva Crónica y de La Cardiopatía Isquémica. Aten. Primaria 2017, 49, 368. [Google Scholar] [CrossRef] [PubMed]
- Córdoba-García, R. Catorce Años de Ley de Control Del Tabaco En España. Situación Actual y Propuestas. Aten. Primaria 2020, 52, 563. [Google Scholar] [CrossRef]
- Rey-Brandariz, J.; Pérez-Ríos, M.; Santiago-Pérez, M.I.; Varela-Lema, L.; Giraldo-Osorio, A.; Mourino, N.; Ruano-Ravina, A.; Carolina, F.; Madrid, E.; Correspondencia, E. Mortalidad Atribuida al Consumo de Tabaco En España: Revisión Sistemática. Adicciones 2021. [Google Scholar] [CrossRef]
- West, R. Tobacco Smoking: Health Impact, Prevalence, Correlates and Interventions. Psychol. Health 2017, 32, 1018. [Google Scholar] [CrossRef] [PubMed] [Green Version]
- Adams, T.N.; Morris, J. Smoking. Lancet 2021, 127, 1177. [Google Scholar] [CrossRef]
- Firth, J.; Solmi, M.; Wootton, R.E.; Vancampfort, D.; Schuch, F.B.; Hoare, E.; Gilbody, S.; Torous, J.; Teasdale, S.B.; Jackson, S.E.; et al. A Meta-review of “Lifestyle Psychiatry”: The Role of Exercise, Smoking, Diet and Sleep in the Prevention and Treatment of Mental Disorders. World Psychiatry 2020, 19, 360. [Google Scholar] [CrossRef]
- Chang, J.T.; Anic, G.M.; Rostron, B.L.; Tanwar, M.; Chang, C.M. Cigarette Smoking Reduction and Health Risks: A Systematic Review and Meta-Analysis. Nicotine Tob. Res. 2021, 23, 635–642. [Google Scholar] [CrossRef]
- Noguchi, K.S.; Pryzbek, M.; Moncion, K.; McQuarrie, A.; Macdonald, M.J.; Tang, A. A History of Smoking Does Not Reduce Long-Term Benefits of Cardiac Rehabilitation on Cardiorespiratory Fitness in Men and Women with Cardiovascular Disease. Appl. Physiol. Nutr. Metab. 2021, 46, 155–160. [Google Scholar] [CrossRef]
- Xiao, D.; Chen, Z.; Wu, S.; Huang, K.; Xu, J.; Yang, L.; Xu, Y.; Zhang, X.; Bai, C.; Kang, J.; et al. Prevalence and Risk Factors of Small Airway Dysfunction, and Association with Smoking, in China: Findings from a National Cross-Sectional Study. Lancet Respir. Med. 2020, 8, 1081–1093. [Google Scholar] [CrossRef]
- Thacher, J.D.; Schultz, E.S.; Hallberg, J.; Hellberg, U.; Kull, I.; Thunqvist, P.; Pershagen, G.; Gustafsson, P.M.; Melén, E.; Bergström, A. Tobacco Smoke Exposure in Early Life and Adolescence in Relation to Lung Function. Eur. Respir. J. 2018, 51, 1702111. [Google Scholar] [CrossRef]
- Su, F.Y.; Wang, S.H.; Lu, H.H.S.; Lin, G.M. Association of Tobacco Smoking with Physical Fitness of Military Males in Taiwan: The CHIEF Study. Can. Respir. J. 2020, 2020, 5968189. [Google Scholar] [CrossRef] [PubMed]
- Jeon, H.G.; Kim, G.; Jeong, H.S.; So, W.Y. Association between Cigarette Smoking and Physical Fitness Level of Korean Adults and the Elderly. Healthcare 2021, 9, 185. [Google Scholar] [CrossRef] [PubMed]
- Miller, M.E.; Tidey, J.W.; Bunn, J.Y.; Gaalema, D.E.; Scott-Sheldon, L.A.J.; Pericot-Valverde, I.; Japuntich, S.J. Self-Perceived Mental Health and Population-Level Tobacco Use Disparities. Tob. Regul. Sci. 2018, 4, 3–11. [Google Scholar] [CrossRef] [PubMed]
- Qiu, D.; Chen, T.; Liu, T.; Song, F. Smoking Cessation and Related Factors in Middle-Aged and Older Chinese Adults: Evidence from a Longitudinal Study. PLoS ONE 2020, 15, e0240806. [Google Scholar] [CrossRef]
- Gómez-García, A.R.; Portalanza-Chavarría, C.A.; Arias-Ulloa, C.A.; Espinoza-Samaniego, C.E. Salaried Workers’ Self-Perceived Health and Psychosocial Risk in Guayaquil, Ecuador. Int. J. Environ. Res. Public Health 2020, 17, 9099. [Google Scholar] [CrossRef]
- Au, N.; Johnston, D.W. Self-Assessed Health: What Does It Mean and What Does It Hide? Soc. Sci. Med. 2014, 121, 21–28. [Google Scholar] [CrossRef]
- Mendoza-Romero, D.; Urbina, A.; Cristancho-Montenegro, A.; Rombaldi, A. Impact of Smoking and Physical Inactivity on Self-Rated Health in Women in Colombia. Prev. Med. Rep. 2019, 16, 100976. [Google Scholar] [CrossRef]
- Miko, H.C.; Zillmann, N.; Ring-Dimitriou, S.; Dorner, T.E.; Titze, S.; Bauer, R. Effects of Physical Activity on Health. Gesundheitswesen 2020, 82, S184–S195. [Google Scholar] [CrossRef]
- Thivel, D.; Tremblay, A.; Genin, P.M.; Panahi, S.; Rivière, D.; Duclos, M. Physical Activity, Inactivity, and Sedentary Behaviors: Definitions and Implications in Occupational Health. Front. Public Health 2018, 6, 288. [Google Scholar] [CrossRef] [Green Version]
- Pescatello, L.S.; Buchner, D.M.; Jakicic, J.M.; Powell, K.E.; Kraus, W.E.; Bloodgood, B.; Campbell, W.W.; Dietz, S.; Dipietro, L.; George, S.M.; et al. Physical Activity to Prevent and Treat Hypertension: A Systematic Review. Med. Sci. Sports Exerc. 2019, 51, 1314–1323. [Google Scholar] [CrossRef]
- Huai, P.; Xun, H.; Reilly, K.H.; Wang, Y.; Ma, W.; Xi, B. Physical Activity and Risk of Hypertension: A Meta-Analysis of Prospective Cohort Studies. Hypertension 2013, 62, 1021–1026. [Google Scholar] [CrossRef] [PubMed] [Green Version]
- Aune, D.; Norat, T.; Leitzmann, M.; Tonstad, S.; Vatten, L.J. Physical Activity and the Risk of Type 2 Diabetes: A Systematic Review and Dose-Response Meta-Analysis. Eur. J. Epidemiol. 2015, 30, 529–542. [Google Scholar] [CrossRef] [PubMed]
- Patel, A.V.; Friedenreich, C.M.; Moore, S.C.; Hayes, S.C.; Silver, J.K.; Campbell, K.L.; Winters-Stone, K.; Gerber, L.H.; George, S.M.; Fulton, J.E.; et al. American College of Sports Medicine Roundtable Report on Physical Activity, Sedentary Behavior, and Cancer Prevention and Control. Med. Sci. Sports Exerc. 2019, 51, 2391–2402. [Google Scholar] [CrossRef] [PubMed] [Green Version]
- Webel, A.R.; Jenkins, T.; Vest, M.; Oliveira, V.H.F.; Longenecker, C.T.; Liu, J.; Currie, J.; Sattar, A.; Josephson, R. Cardiorespiratory Fitness Is Associated with Inflammation and Physical Activity in HIV+ Adults. AIDS 2019, 33, 1023–1030. [Google Scholar] [CrossRef] [PubMed]
- Ross, R.; Blair, S.N.; Arena, R.; Church, T.S.; Després, J.P.; Franklin, B.A.; Haskell, W.L.; Kaminsky, L.A.; Levine, B.D.; Lavie, C.J.; et al. Importance of Assessing Cardiorespiratory Fitness in Clinical Practice: A Case for Fitness as a Clinical Vital Sign: A Scientific Statement From the American Heart Association. Circulation 2016, 134, e653–e699. [Google Scholar] [CrossRef]
- Alsubaie, S.F.; Alkathiry, A.A.; Abdelbasset, W.K.; Nambi, G. The Physical Activity Type Most Related to Cognitive Function and Quality of Life. BioMed Res. Int. 2020, 2020, 8856284. [Google Scholar] [CrossRef]
- O’Donovan, G.; Hamer, M.; Stamatakis, E. Relationships between Exercise, Smoking Habit and Mortality in More than 100,000 Adults. Int. J. Cancer 2017, 140, 1819–1827. [Google Scholar] [CrossRef] [Green Version]
- González, K.; Fuentes, J.; Márquez, J.L. Physical Inactivity, Sedentary Behavior and Chronic Diseases. Korean J. Fam. Med. 2017, 38, 111–115. [Google Scholar] [CrossRef] [Green Version]
- Huaman-Carhuas, L.; Bolaños-Sotomayor, N.; Huaman-Carhuas, L.; Bolaños-Sotomayor, N. Sobrepeso, Obesidad y Actividad Física En Estudiantes de Enfermería Pregrado de Una Universidad Privada. Enfermería Nefrológica 2020, 23, 184–190. [Google Scholar] [CrossRef]
- Palmer, M.; Sutherland, J.; Barnard, S.; Wynne, A.; Rezel, E.; Doel, A.; Grigsby-Duffy, L.; Edwards, S.; Russell, S.; Hotopf, E.; et al. The Effectiveness of Smoking Cessation, Physical Activity/Diet and Alcohol Reduction Interventions Delivered by Mobile Phones for the Prevention of Non-Communicable Diseases: A Systematic Review of Randomised Controlled Trials. PLoS ONE 2018, 13, e0189801. [Google Scholar] [CrossRef]
- Lim, S.S.; Vos, T.; Flaxman, A.D.; Danaei, G.; Shibuya, K.; Adair-Rohani, H.; Amann, M.; Anderson, H.R.; Andrews, K.G.; Aryee, M.; et al. A Comparative Risk Assessment of Burden of Disease and Injury Attributable to 67 Risk Factors and Risk Factor Clusters in 21 Regions, 1990–2010: A Systematic Analysis for the Global Burden of Disease Study 2010. Lancet 2012, 380, 2224–2260. [Google Scholar] [CrossRef] [Green Version]
- Cannioto, R.; Etter, J.L.; LaMonte, M.J.; Ray, A.D.; Joseph, J.M.; Al Qassim, E.; Eng, K.H.; Moysich, K.B. Lifetime physical inactivity is associated with lung cancer risk and mortality. Cancer Treat. Res. Commun. 2018, 14, 37. [Google Scholar] [CrossRef] [PubMed]
- Jackson, S.E.; Brown, J.; Ussher, M.; Shahab, L.; Steptoe, A.; Smith, L. Combined Health Risks of Cigarette Smoking and Low Levels of Physical Activity: A Prospective Cohort Study in England with 12-Year Follow-Up. BMJ Open 2019, 9, e032852. [Google Scholar] [CrossRef] [Green Version]
- Ministerio de Sanidad, Consumo y Bienestar Social. Encuesta Nacional De Salud 2017; Instituto Nacional de Estadística: Madrid, Spain, 2017. Available online: https://www.sanidad.gob.es/estadEstudios/estadisticas/encuestaNacional/encuesta2017.htm (accessed on 20 June 2022).
- Tenforde, M.W.; Kim, S.S.; Lindsell, C.J.; Billig Rose, E.; Shapiro, N.I.; Files, D.C.; Gibbs, K.W.; Erickson, H.L.; Steingrub, J.S.; Smithline, H.A.; et al. Symptom Duration and Risk Factors for Delayed Return to Usual Health among Outpatients with COVID-19 in a Multistate Health Care Systems Network—United States, March–June 2020. MMWR Morb. Mortal. Wkly. Rep. 2020, 69, 993–998. [Google Scholar] [CrossRef] [PubMed]
- Croezen, S.; Burdorf, A.; van Lenthe, F.J. Self-Perceived Health in Older Europeans: Does the Choice of Survey Matter? Eur. J. Public Health 2016, 26, 686–692. [Google Scholar] [CrossRef] [Green Version]
- de Bruin, A. Health Interview Surveys: Towards International Harmonization of Methods and Instruments; WHO Regional Publications, European Series, No. 58; WHO: Geneva, Switzerland, 1996.
- European Commission; Eurostat. European Health Interview Survey (EHIS Wave 2): Methodological Manual: 2013 Edition; European Commission: Brussels, Belgium, 2013.
- Denche-Zamorano, Á.; Mendoza-Muñoz, M.; Carlos-Vivas, J.; Muñoz-Bermejo, L.; Rojo-Ramos, J.; Pastor-Cisneros, R.; Giakoni-Ramírez, F.; Godoy-Cumillaf, A.; Barrios-Fernandez, S. A Cross-Sectional Study on Self-Perceived Health and Physical Activity Level in the Spanish Population. Int. J. Environ. Res. Public Health 2022, 19, 5656. [Google Scholar] [CrossRef]
- Maniscalco, L.; Miceli, S.; Bono, F.; Matranga, D. Self-Perceived Health, Objective Health, and Quality of Life among People Aged 50 and Over: Interrelationship among Health Indicators in Italy, Spain, and Greece. Int. J. Environ. Res. Public Health 2020, 17, 2414. [Google Scholar] [CrossRef] [Green Version]
- Craig, C.L.; Marshall, A.L.; Sjöström, M.; Bauman, A.E.; Booth, M.L.; Ainsworth, B.E.; Pratt, M.; Ekelund, U.; Yngve, A.; Sallis, J.F.; et al. International Physical Activity Questionnaire: 12-Country Reliability and Validity. Med. Sci. Sports Exerc. 2003, 35, 1381–1395. [Google Scholar] [CrossRef] [Green Version]
- Nes, B.M.; Janszky, I.; Vatten, L.J.; Nilsen, T.I.L.; Aspenes, S.T.; WislØff, U. Estimating V⋅O 2peak from a Nonexercise Prediction Model: The HUNT Study, Norway. Med. Sci. Sports Exerc. 2011, 43, 2024–2030. [Google Scholar] [CrossRef]
- Denche-Zamorano, Á.; Franco-García, J.M.; Carlos-Vivas, J.; Mendoza-Muñoz, M.; Pereira-Payo, D.; Pastor-Cisneros, R.; Merellano-Navarro, E.; Adsuar, J.C. Increased Risks of Mental Disorders: Youth with Inactive Physical Activity. Healthcare 2022, 10, 237. [Google Scholar] [CrossRef]
- Organización Mundial de la Salud Tabaco. 2022. Available online: https://www.who.int/es/news-room/fact-sheets/detail/tobacco (accessed on 25 August 2022).
- Reitsma, M.B.; Fullman, N.; Ng, M.; Salama, J.S.; Abajobir, A.; Abate, K.H.; Abbafati, C.; Abera, S.F.; Abraham, B.; Abyu, G.Y.; et al. Smoking Prevalence and Attributable Disease Burden in 195 Countries and Territories, 1990–2015: A Systematic Analysis from the Global Burden of Disease Study 2015. Lancet 2017, 389, 1885. [Google Scholar] [CrossRef] [Green Version]
- Moral-García, J.E.; Agraso-López, A.D.; Ramos-Morcillo, A.J.; Jiménez, A.; Jiménez-Eguizábal, A. The Influence of Physical Activity, Diet, Weight Status and Substance Abuse on Students’ Self-Perceived Health. Int. J. Environ. Res. Public Health 2020, 17, 1387. [Google Scholar] [CrossRef] [PubMed] [Green Version]
- Baena, A.C.M.; Chillón, P.; Martín-Matillas, M.; López, I.P.; Castillo, R.; Zapatera, B.; Vicente-Rodríguez, G.; Casajús, J.A.; Álvarez-Granda, L.; Cerezo, C.R.; et al. Actitudes Hacia La Práctica de Actividad Físico-Deportiva Orientada a La Salud En Adolescentes Españoles: Estudio AVENA (Attitudes toward the Physical Activity and Sport Practice in Spanish Adolescents: The AVENA Study). Retos 2012, 22, 43–48. [Google Scholar] [CrossRef]
- AlDukhail, S.; Bahdila, D. Self-Perception of Health and Physical Activity among Adults before and amidst the COVID-19 Pandemic: United States, 2019–2020. Prev. Med. 2022, 158, 107037. [Google Scholar] [CrossRef] [PubMed]
- De Sousa, T.F.; Da Silva, K.S.; Martin, L.; Garcia, T.; Firpo, G.; Duca, D.; Santina, E.; de Oliveira, A.; Nahas, M.V. Autoavaliação de Saúde e Fatores Associados Em Adolescentes Do Estado de Santa Catarina, Brasil. Rev. Paul. Pediatr. 2010, 28, 333–339. [Google Scholar] [CrossRef]
- da Silva, A.O.; Diniz, P.R.B.; Santos, M.E.P.; Ritti-Dias, R.M.; Farah, B.Q.; Tassitano, R.M.; Oliveira, L.M.F.T. Health Self-Perception and Its Association with Physical Activity and Nutritional Status in Adolescents. J. Pediatr. 2019, 95, 458–465. [Google Scholar] [CrossRef]
- Alricsson, M.; Landstad, B.J.; Romild, U.; Werner, S. Self-Related Health, Physical Activity and Complaints in Swedish High School Students. Sci. World J. 2006, 6, 816–826. [Google Scholar] [CrossRef] [Green Version]
- Benyamini, Y.; Leventhal, E.A.; Leventhal, H. Gender Differences in Processing Information for Making Self-Assessments of Health. Psychosom. Med. 2000, 62, 354–364. [Google Scholar] [CrossRef]
- Branco, L.; Hilário, M.; Cintra, I.D.P. Percepção e Satisfação Corporal Em Adolescentes Ea Relação Com Seu Estado Nutricional. Arch. Clin. Psychiatry 2006, 33, 292–296. [Google Scholar] [CrossRef] [Green Version]
- Pelegrini, A.; Coqueiro, R.D.S.; Beck, C.C.; Ghedin, K.D.; Lopes, A.D.S.; Petroski, E.L. Dissatisfaction with Body Image among Adolescent Students: Association with Socio-Demographic Factors and Nutritional Status. Ciênc. Saúde Coletiva 2014, 19, 1201–1208. [Google Scholar] [CrossRef]
- Dostálová, R.; Stillman, C.; Erickson, K.I.; Slepička, P.; Mudrák, J. The Relationship between Physical Activity, Self-Perceived Health, and Cognitive Function in Older Adults. Brain Sci. 2021, 11, 492. [Google Scholar] [CrossRef]
- Lera-López, F.; Irisarri, M.A.G.; Ollo-López, A.; Iriso, E.S.; Hita, J.M.C.; Santos, J.M.S. Actividad Física y Salud Autopercibida En Personas Mayores de 50 Años. Rev. Int. Med. Cienc. Act. Fis. Deporte 2017, 17, 559–571. [Google Scholar] [CrossRef]
- Dogra, S. Better Self-Perceived Health Is Associated with Lower Odds of Physical Inactivity in Older Adults with Chronic Disease. J. Aging Phys. Act. 2011, 19, 322–335. [Google Scholar] [CrossRef] [PubMed]
- Piko, B.F. Self-Perceived Health among Adolescents: The Role of Gender and Psychosocial Factors. Eur. J. Pediatr. 2007, 166, 701–708. [Google Scholar] [CrossRef] [PubMed]
- Kaleta, D.; Makowiec-Dąbrowska, T.; Dziankowska-Zaborszczyk, E.; Jegier, A. Physical activity and self-perceived health status. Int. J. Occup. Med. Environ. Health 2006, 19, 61–69. [Google Scholar] [CrossRef] [PubMed] [Green Version]
- Daskapan, A.; Tuzun, E.H.; Eker, L. Perceived Barriers to Physical Activity in University Students. J. Sports Sci. Med. 2006, 5, 615. [Google Scholar]
- Baena, A.C.M.; Chillón, P.; Martín-Matillas, M.; López, I.P.; Castillo, R.; Zapatera, B.; Delgado-Fernández, M. Motivos de Abandono y No Práctica de Actividad Físico-Deportiva En Adolescentes Españoles: Estudio Avena. Cuad. Psicol. Deporte 2012, 12, 45–54. [Google Scholar] [CrossRef] [Green Version]
- Jurado, M.A.A.; Madrona, P.G.; Dato, J.F.O.; Blanco, Ó.F.R. Mejora de La Condición Física y La Salud En Estudiantes Tras Un Programa de Descansos Activos. Rev. Esp. Salud Publica 2020, 92, e201809068. [Google Scholar]
- Mavilidi, M.F.; Drew, R.; Morgan, P.J.; Lubans, D.R.; Schmidt, M.; Riley, N. Effects of Different Types of Classroom Physical Activity Breaks on Children’s on-Task Behaviour, Academic Achievement and Cognition. Acta Paediatr. 2020, 109, 158–165. [Google Scholar] [CrossRef] [Green Version]
- Cullati, S.; Bochatay, N.; Rossier, C.; Guessous, I.; Burton-Jeangros, C.; Courvoisier, D.S. Does the Single-Item Self-Rated Health Measure the Same Thing across Different Wordings? Construct Validity Study. Qual. Life Res. 2020, 29, 2593–2604. [Google Scholar] [CrossRef]
- Zajacova, A.; Dowd, J.B. Reliability of Self-Rated Health in US Adults. Am. J. Epidemiol. 2011, 174, 977–983. [Google Scholar] [CrossRef] [PubMed] [Green Version]
- de Lossada, A.; Rejas, J. Calidad de Vida Relacionada Con La Salud En La Población General Española Fumadora: Una Aproximación Desde La Encuesta Nacional de Salud. SEMERGEN-Med. Fam. 2016, 42, 431–439. [Google Scholar] [CrossRef] [PubMed]
- Latorre-Román, P.Á.; Carmona-Torres, J.M.; Cobo-Cuenca, A.I.; Laredo-Aguilera, J.A. Physical Activity, Ability to Walk, Weight Status, and Multimorbidity Levels in Older Spanish People: The National Health Survey (2009–2017). Int. J. Environ. Res. Public Health 2020, 17, 4333. [Google Scholar] [CrossRef] [PubMed]
- De La Hoz, K.F.; Leon, D.A. Self-Perceived Health Status and Inequalities in Use of Health Services in Spain. Int. J. Epidemiol. 1996, 25, 593–603. [Google Scholar] [CrossRef] [PubMed] [Green Version]
- Shields, M.; Shooshtari, S. Determinants of Self-Perceived Health. Health Rep. 2001, 13, 35–52. [Google Scholar] [PubMed]
- Nayak, S.; Hubbard, A.; Sidney, S.; Syme, S.L. Characteristics Associated with Self-Rated Health in the CARDIA Study: Contextualising Health Determinants by Income Group. Prev. Med. Rep. 2016, 4, 199–208. [Google Scholar] [CrossRef] [PubMed] [Green Version]
- Bonner, W.I.A.; Weiler, R.; Orisatoki, R.; Lu, X.; Andkhoie, M.; Ramsay, D.; Yaghoubi, M.; Steeves, M.; Szafron, M.; Farag, M. Determinants of Self-Perceived Health for Canadians Aged 40 and Older and Policy Implications. Int. J. Equity Health 2017, 16, 1–9. [Google Scholar] [CrossRef]

| Variables | ||||
|---|---|---|---|---|
| Age (Years) | Overall = 17,708 | Men = 8482 | Women = 9226 | p |
| Median (IQR) | 47 (21) | 47 (21) | 47 (21) | 0.313 |
| Mean (SD) | 45.8 (14.1) | 45.7 (14.1) | 46.0 (14.1) | - |
| Age group | Overall n (%) | Men n (%) | Women n (%) | p * |
| 18–34 years | 3871 (21.9) | 1851 (21.8) | 2020 (21.9) | 0.286 |
| 35–49 years | 6174 (34.9) | 2990 (35.3) | 3184 (34.5) | |
| 50–64 years | 5953 (33.6) | 2858 (33.7) | 3095 (33.5) | |
| 65–69 years | 1710 (9.7) | 783 (9.2) | 927(9.7) | |
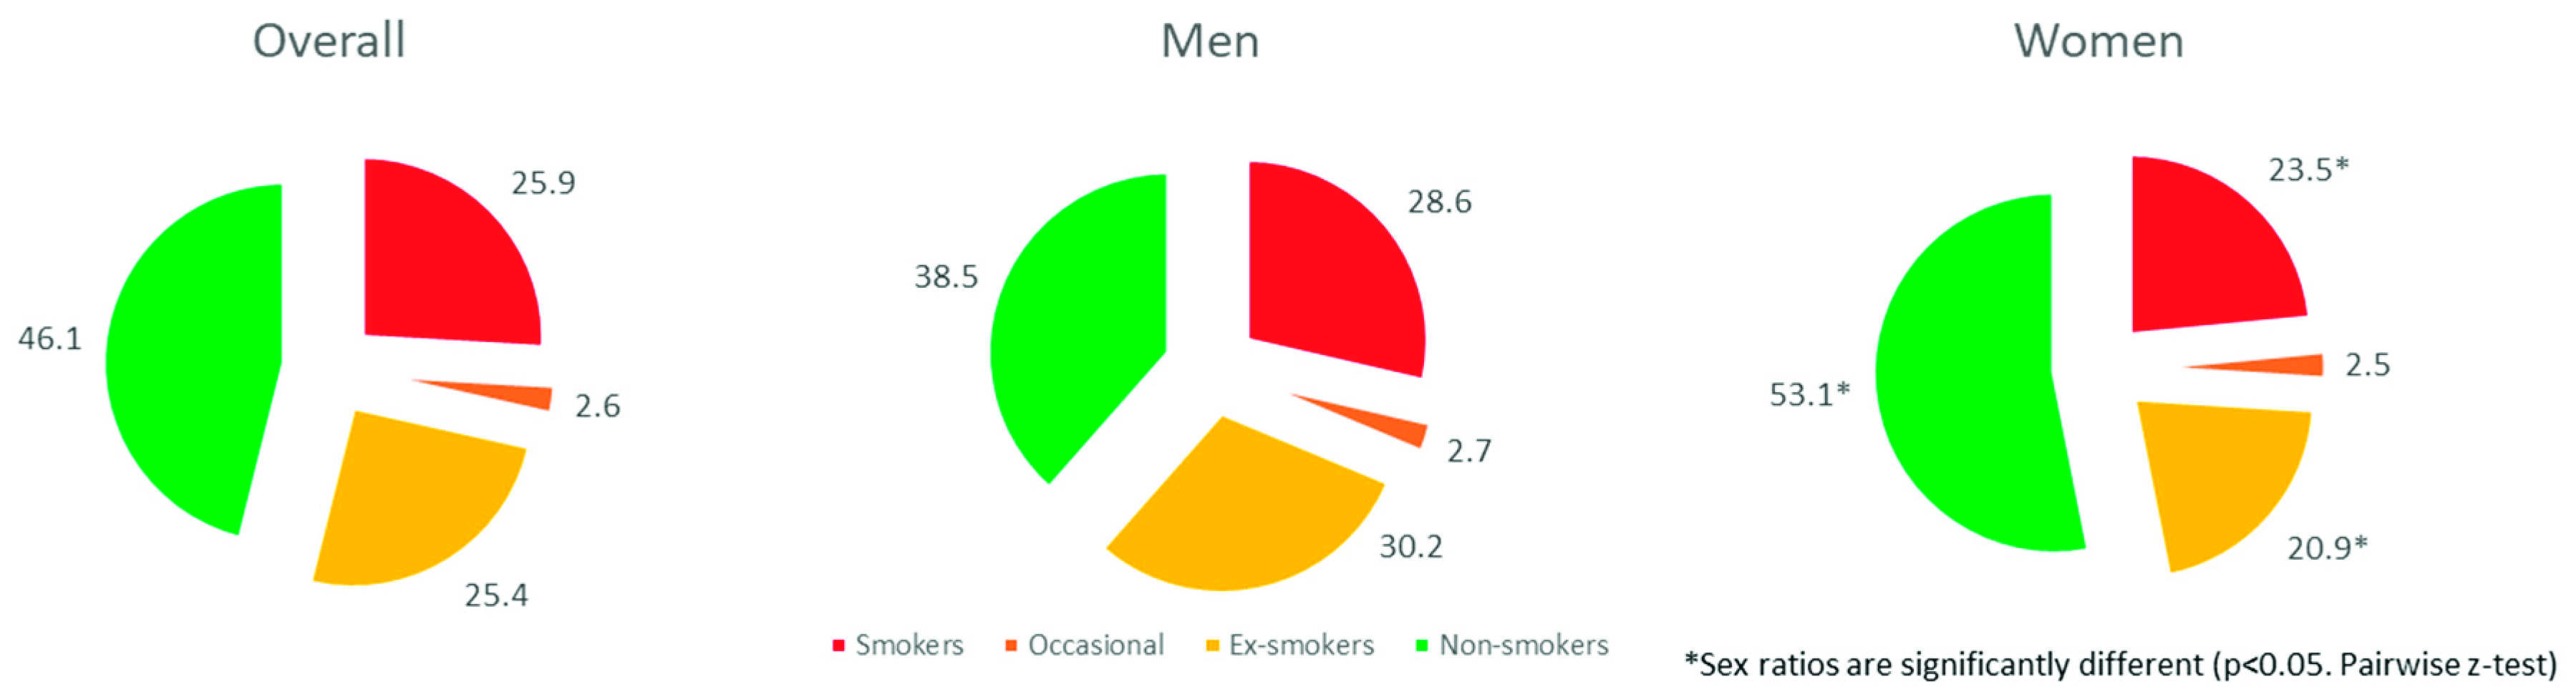
| Smoking group | Overall n (%) | Men n (%) | Women n (%) | p * |
| Smokers | 4590 (25.9) | 2425 (28.6) | 2165 (23.5) b | <0.001 |
| Occasionals | 465 (2.6) | 230 (2.7) | 235 (2.5) | |
| Ex-smokers | 4489 (25.4) | 2564 (30.2) | 1925 (20.9) b | |
| Non-smokers | 8164 (46.1) | 3263 (38.5) | 4901 (53.1) b | |
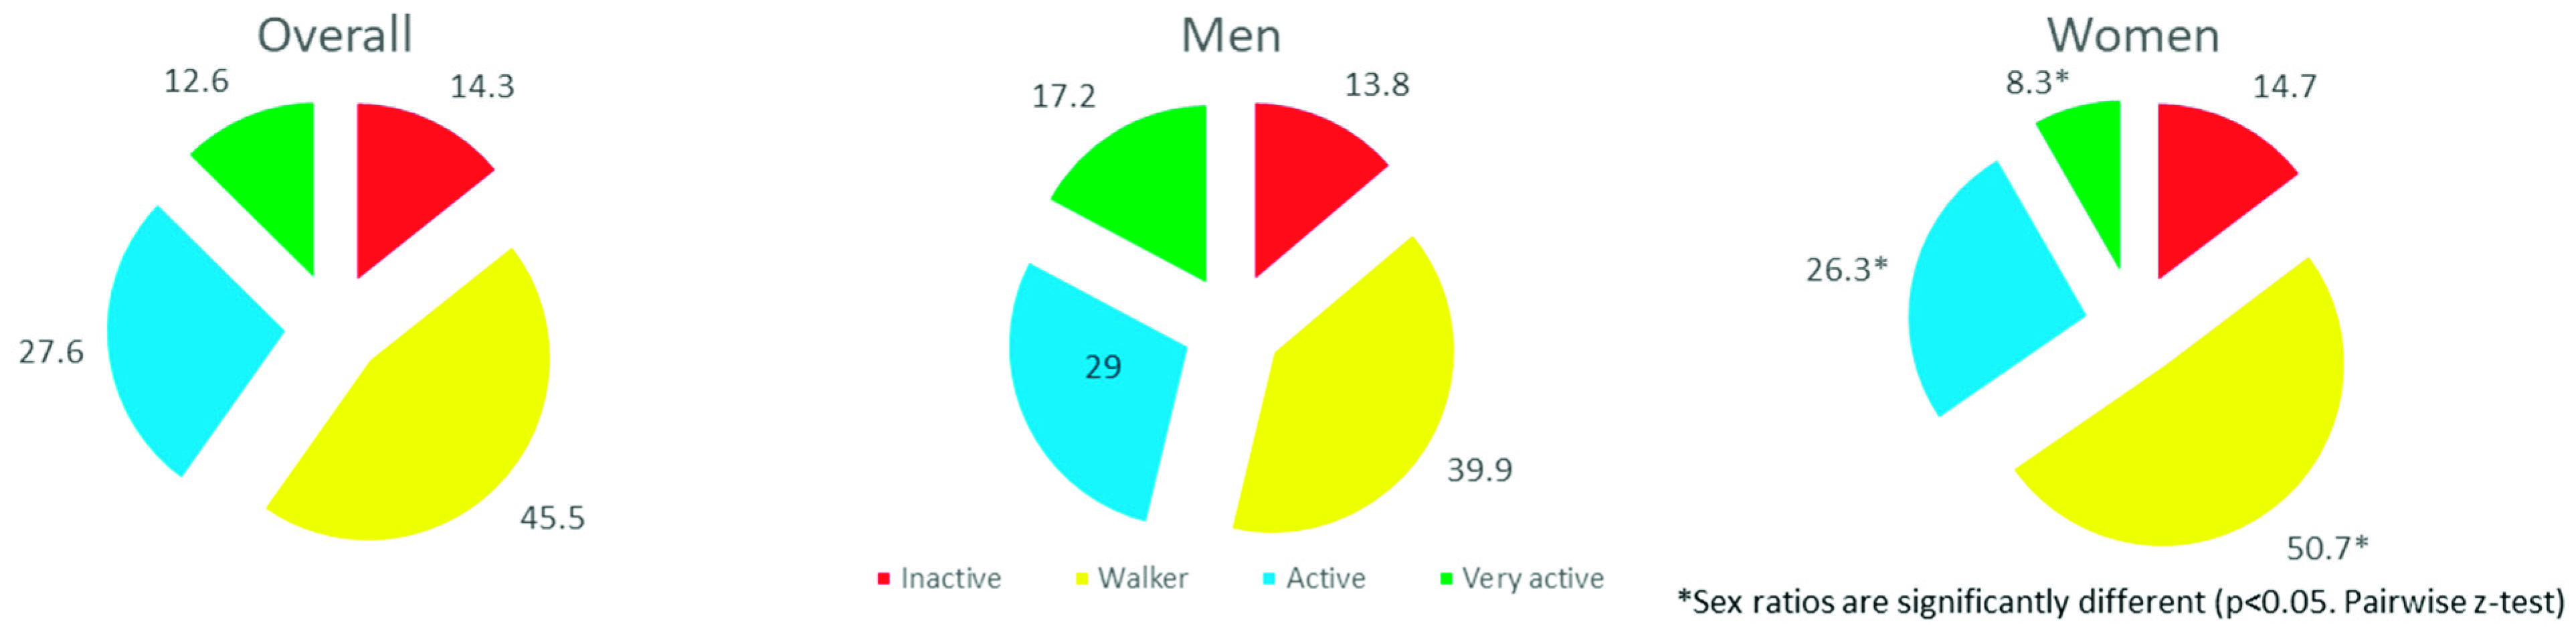
| PAL | Overall n (%) | Men n (%) | Women n (%) | p * |
| Inactive | 2532 (14.3) | 1174 (13.8) | 1358 (14.7) | <0.001 |
| Walker | 8062 (45.5) | 3385 (39.9) | 4677 (50.7) b | |
| Active | 4886 (27.6) | 2460 (29.0) | 2426 (26.3) b | |
| Very active | 2228 (12.6) | 1463 (17.2) | 765 (8.3) b |
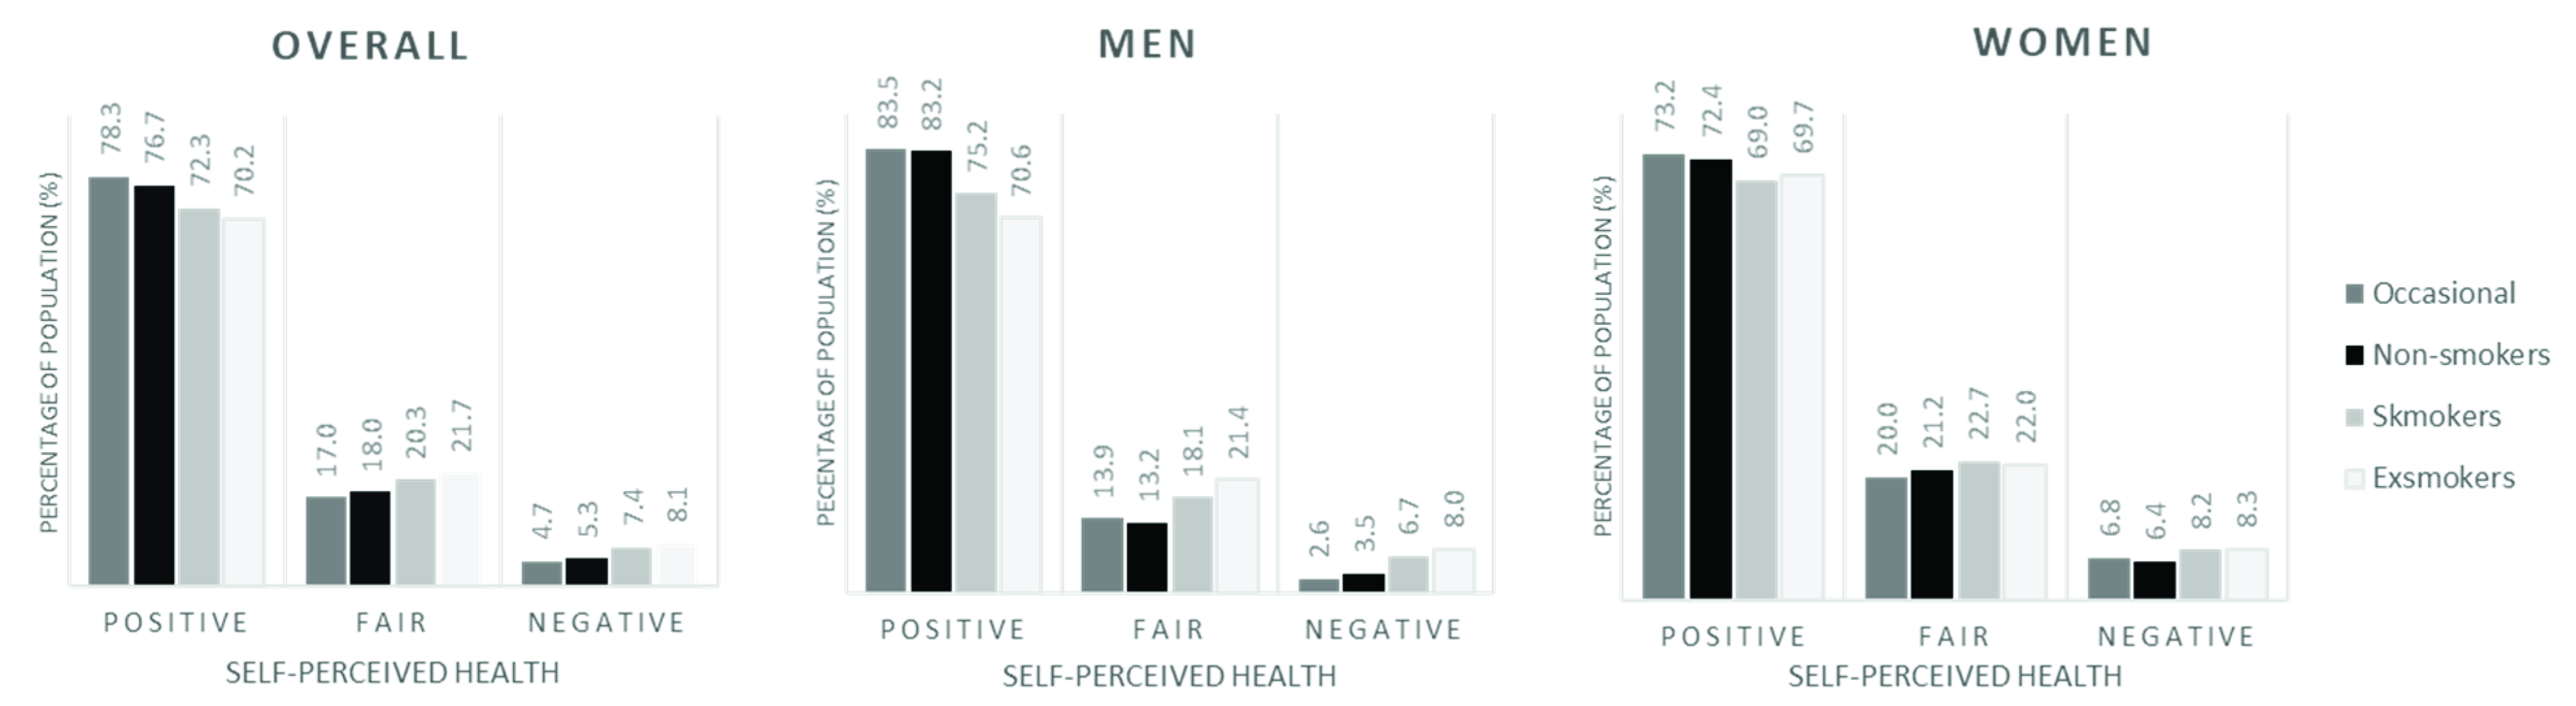
| Overall | |||||
|---|---|---|---|---|---|
| SPH | Ex-Smokers | Smokers | Occasionals | Non-Smokers | p |
| Positive | 3153 (70.2) a | 3317 (72.3) b | 364 (78.3) c | 6264 (76.7) c | <0.001 |
| Fair | 972 (21.7) a | 932 (20.3) ab | 79 (17.0) bc | 1469 (18.0) c | |
| Negative | 364 (8.1) a | 341 (7.4) a | 22 (4.7) b | 431 (5.3) b | |
| Men | |||||
| SPH | Ex-smokers | Smokers | Occasionals | Non-smokers | p |
| Positive | 1811 (70.6) a | 1823 (75.2) b | 192 (83.5) c | 2716 (83.2) c | <0.001 |
| Fair | 548 (21.4) a | 440 (18.1) b | 32 (13.9) bc | 432 (13.2) c | |
| Negative | 205 (8.0) a | 162 (6.7) a | 6 (2.6) b | 115 (3.5) b | |
| Women | |||||
| SPH | Ex-smokers | Smokers | Occasionals | Non-smokers | p |
| Positive | 1342 (69.7) a | 1494 (69.0) a | 172 (73.2) ab | 3548 (72.4) b | <0.001 |
| Fair | 424 (22.0) a | 492 (22.7) a | 47 (20.0) a | 1037 (21.2) a | |
| Negative | 159 (8.3) a | 179 (8.2) a | 16 (6.8) ab | 316 (6.4) b | |
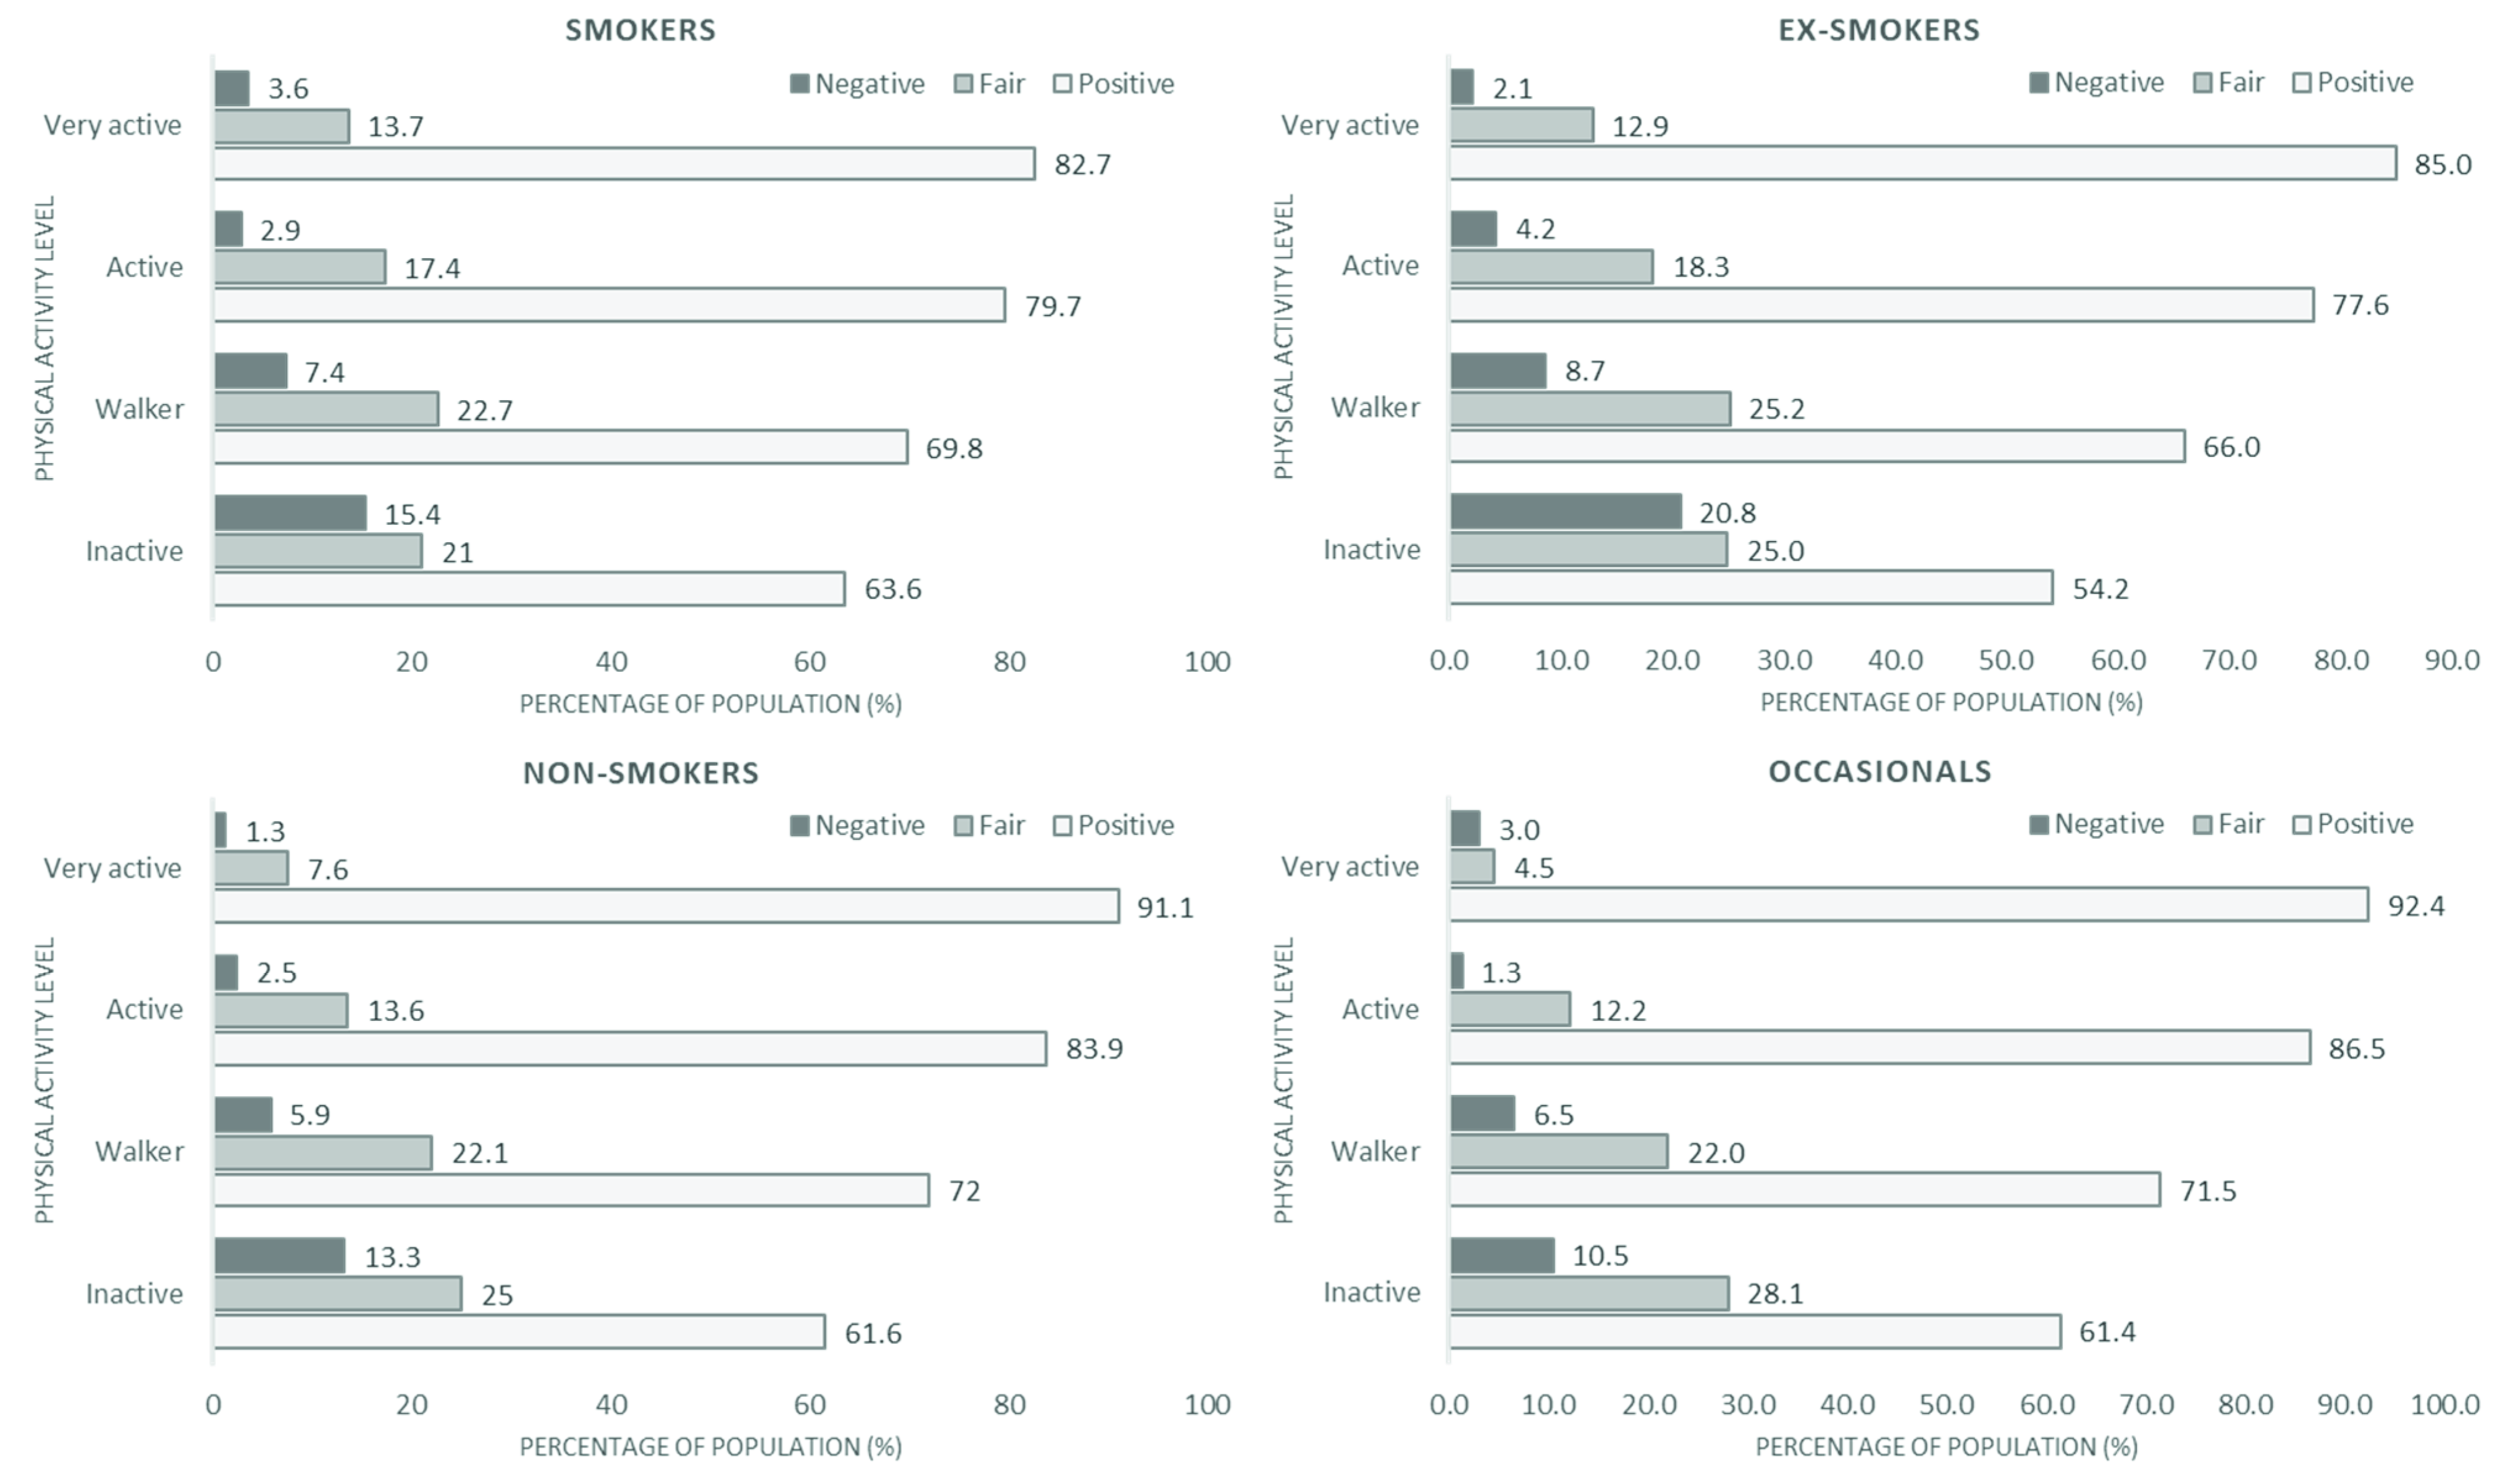
| Smokers | Occasionals | ||||||||
| Self-Perceived Health | Positive | Fair | Negative | p | Self-Perceived Health | Positive | Fair | Negative | p |
| Inactive | 507 (63.6) a | 167 (21.0) a,b | 123 (15.4) a | <0.001 | Inactive | 35 (61.4) a | 16 (28.1) a | 6 (10.5) a | <0.001 |
| Walker | 1607 (69.8) b | 523 (22.7) b | 171 (7.4) b | Walker | 133 (71.5) a | 41 (22.0) a | 12 (6.5) a | ||
| Active | 812 (79.7) c | 177 (17.4) a,c | 30 (2.9) c | Active | 135 (86.5) b | 19 (12.2) b | 2 (1.3) b | ||
| Very active | 391 (82.7) c | 65 (13.7) c | 17 (3.6) c | Very active | 61 (92.4) b | 3 (4.5) b | 2 (3.0) a, b | ||
| Ex-smokers | Non-smokers | ||||||||
| Self-Perceived Health | Positive | Fair | Negative | p | Self-Perceived Health | Positive | Fair | Negative | p |
| Inactive | 308 (54.2) a | 142 (25.0) a | 118 (20.8) a | <0.001 | Inactive | 684 (61.6) a | 278 (25.0) a | 148 (13.3) a | <0.001 |
| Walker | 1360 (66.0) b | 520 (25.2) a | 180 (8.7) b | Walker | 2531 (72.0) b | 777 (22.1) b | 207 (5.9) b | ||
| Active | 1009 (77.6) c | 238 (18.3) b | 54 (4.2) c | Active | 2021 (83.9) c | 328 (13.6) c | 61 (2.5) c | ||
| Very active | 476 (85.0) d | 72 (12.9) c | 12 (2.1) d | Very active | 1028 (91.1) d | 86 (7.6) d | 15 (1.3) d | ||
| Risks of Negative SPH: Smokers | |||||||
| PAL | OR | CI 95% | RR | CI 95% | rho | p | |
| Inactive | Walker | 2.27 | 1.78–2.91 | 2.08 | 1.67–2.58 | 0.119 | <0.001 |
| Active | 6.02 | 3.99–9.07 | 5.24 | 3.56–7.73 | 0.223 | <0.001 | |
| Very active | 4.90 | 2.91–8.24 | 4.29 | 2.62–7.04 | 0.183 | <0.001 | |
| Walker | Active | 2.65 | 1.78–3.93 | 2.52 | 1.73–3.69 | 0.087 | <0.001 |
| Very active | 2.15 | 1.30–3.58 | 2.07 | 1.27–3.37 | 0.057 | <0.005 | |
| Active | Very active | 0.81 | 0.44–1.49 | 0.82 | 0.46–1.47 | −0.017 | 0.504 |
| Risks of negative SPH: Ex-smokers | |||||||
| PAL | OR | CI 95% | RR | CI 95% | rho | p | |
| Inactive | Walker | 2.74 | 2.13–3.53 | 2.38 | 1.92–2.94 | 0.156 | <0.001 |
| Active | 6.05 | 4.31–8.50 | 5.00 | 3.68–6.80 | 0.265 | <0.001 | |
| Very active | 11.98 | 6.53–21.97 | 9.70 | 5.42–17.36 | 0.292 | <0.001 | |
| Walker | Active | 2.21 | 1.62–3.03 | 2.11 | 1.57–2.83 | 0.088 | <0.001 |
| Very active | 4.37 | 2.42–7.90 | 4.08 | 2.29–7.26 | 0.104 | <0.001 | |
| Active | Very active | 1.98 | 1.05–3.73 | 1.94 | 1.04–3.59 | 0.05 | <0.05 |
| Risks of negative SPH: Non-smokers | |||||||
| PAL | OR | CI 95% | RR | CI 95% | rho | p | |
| Inactive | Walker | 2.46 | 1.97–3.07 | 2.26 | 1.85–2.77 | 0.119 | <0.001 |
| Active | 5.92 | 3.94–7.04 | 5.27 | 3.94–7.04 | 0.212 | <0.001 | |
| Very active | 11.43 | 6.67–19.57 | 10.04 | 5.94–16.96 | 0.231 | <0.001 | |
| Walker | Active | 2.41 | 1.80–3.22 | 2.33 | 1.76–3.08 | 0.079 | <0.001 |
| Very active | 4.65 | 2.74–7.88 | 4.43 | 2.64–7.45 | 0.092 | <0.001 | |
| Active | Very active | 1.93 | 1.09–3.41 | 1.91 | 1.09–3.34 | 0.039 | <0.05 |
Publisher’s Note: MDPI stays neutral with regard to jurisdictional claims in published maps and institutional affiliations. |
© 2022 by the authors. Licensee MDPI, Basel, Switzerland. This article is an open access article distributed under the terms and conditions of the Creative Commons Attribution (CC BY) license (https://creativecommons.org/licenses/by/4.0/).
Share and Cite
Denche-Zamorano, Á.; Mendoza-Muñoz, D.M.; Pereira-Payo, D.; Ruiz, M.J.; Contreras-Barraza, N.; Iturra-González, J.A.; Urbano-Mairena, J.; Cornejo-Orellana, C.; Mendoza-Muñoz, M. Does Physical Activity Reduce the Risk of Perceived Negative Health in the Smoking Population? Int. J. Environ. Res. Public Health 2022, 19, 14366. https://0-doi-org.brum.beds.ac.uk/10.3390/ijerph192114366
Denche-Zamorano Á, Mendoza-Muñoz DM, Pereira-Payo D, Ruiz MJ, Contreras-Barraza N, Iturra-González JA, Urbano-Mairena J, Cornejo-Orellana C, Mendoza-Muñoz M. Does Physical Activity Reduce the Risk of Perceived Negative Health in the Smoking Population? International Journal of Environmental Research and Public Health. 2022; 19(21):14366. https://0-doi-org.brum.beds.ac.uk/10.3390/ijerph192114366
Chicago/Turabian StyleDenche-Zamorano, Ángel, David Manuel Mendoza-Muñoz, Damián Pereira-Payo, Manuel J. Ruiz, Nicolás Contreras-Barraza, José A. Iturra-González, Javier Urbano-Mairena, Carolina Cornejo-Orellana, and María Mendoza-Muñoz. 2022. "Does Physical Activity Reduce the Risk of Perceived Negative Health in the Smoking Population?" International Journal of Environmental Research and Public Health 19, no. 21: 14366. https://0-doi-org.brum.beds.ac.uk/10.3390/ijerph192114366