
Social and Behavioural Correlates of High Physical Activity Levels among Aboriginal Adolescent Participants of the Next Generation: Youth Wellbeing Study
 , , , , , ,
  and
and
Abstract
:1. Introduction
2. Materials and Methods
2.1. Participants
2.2. Measures
2.3. Data Analysis
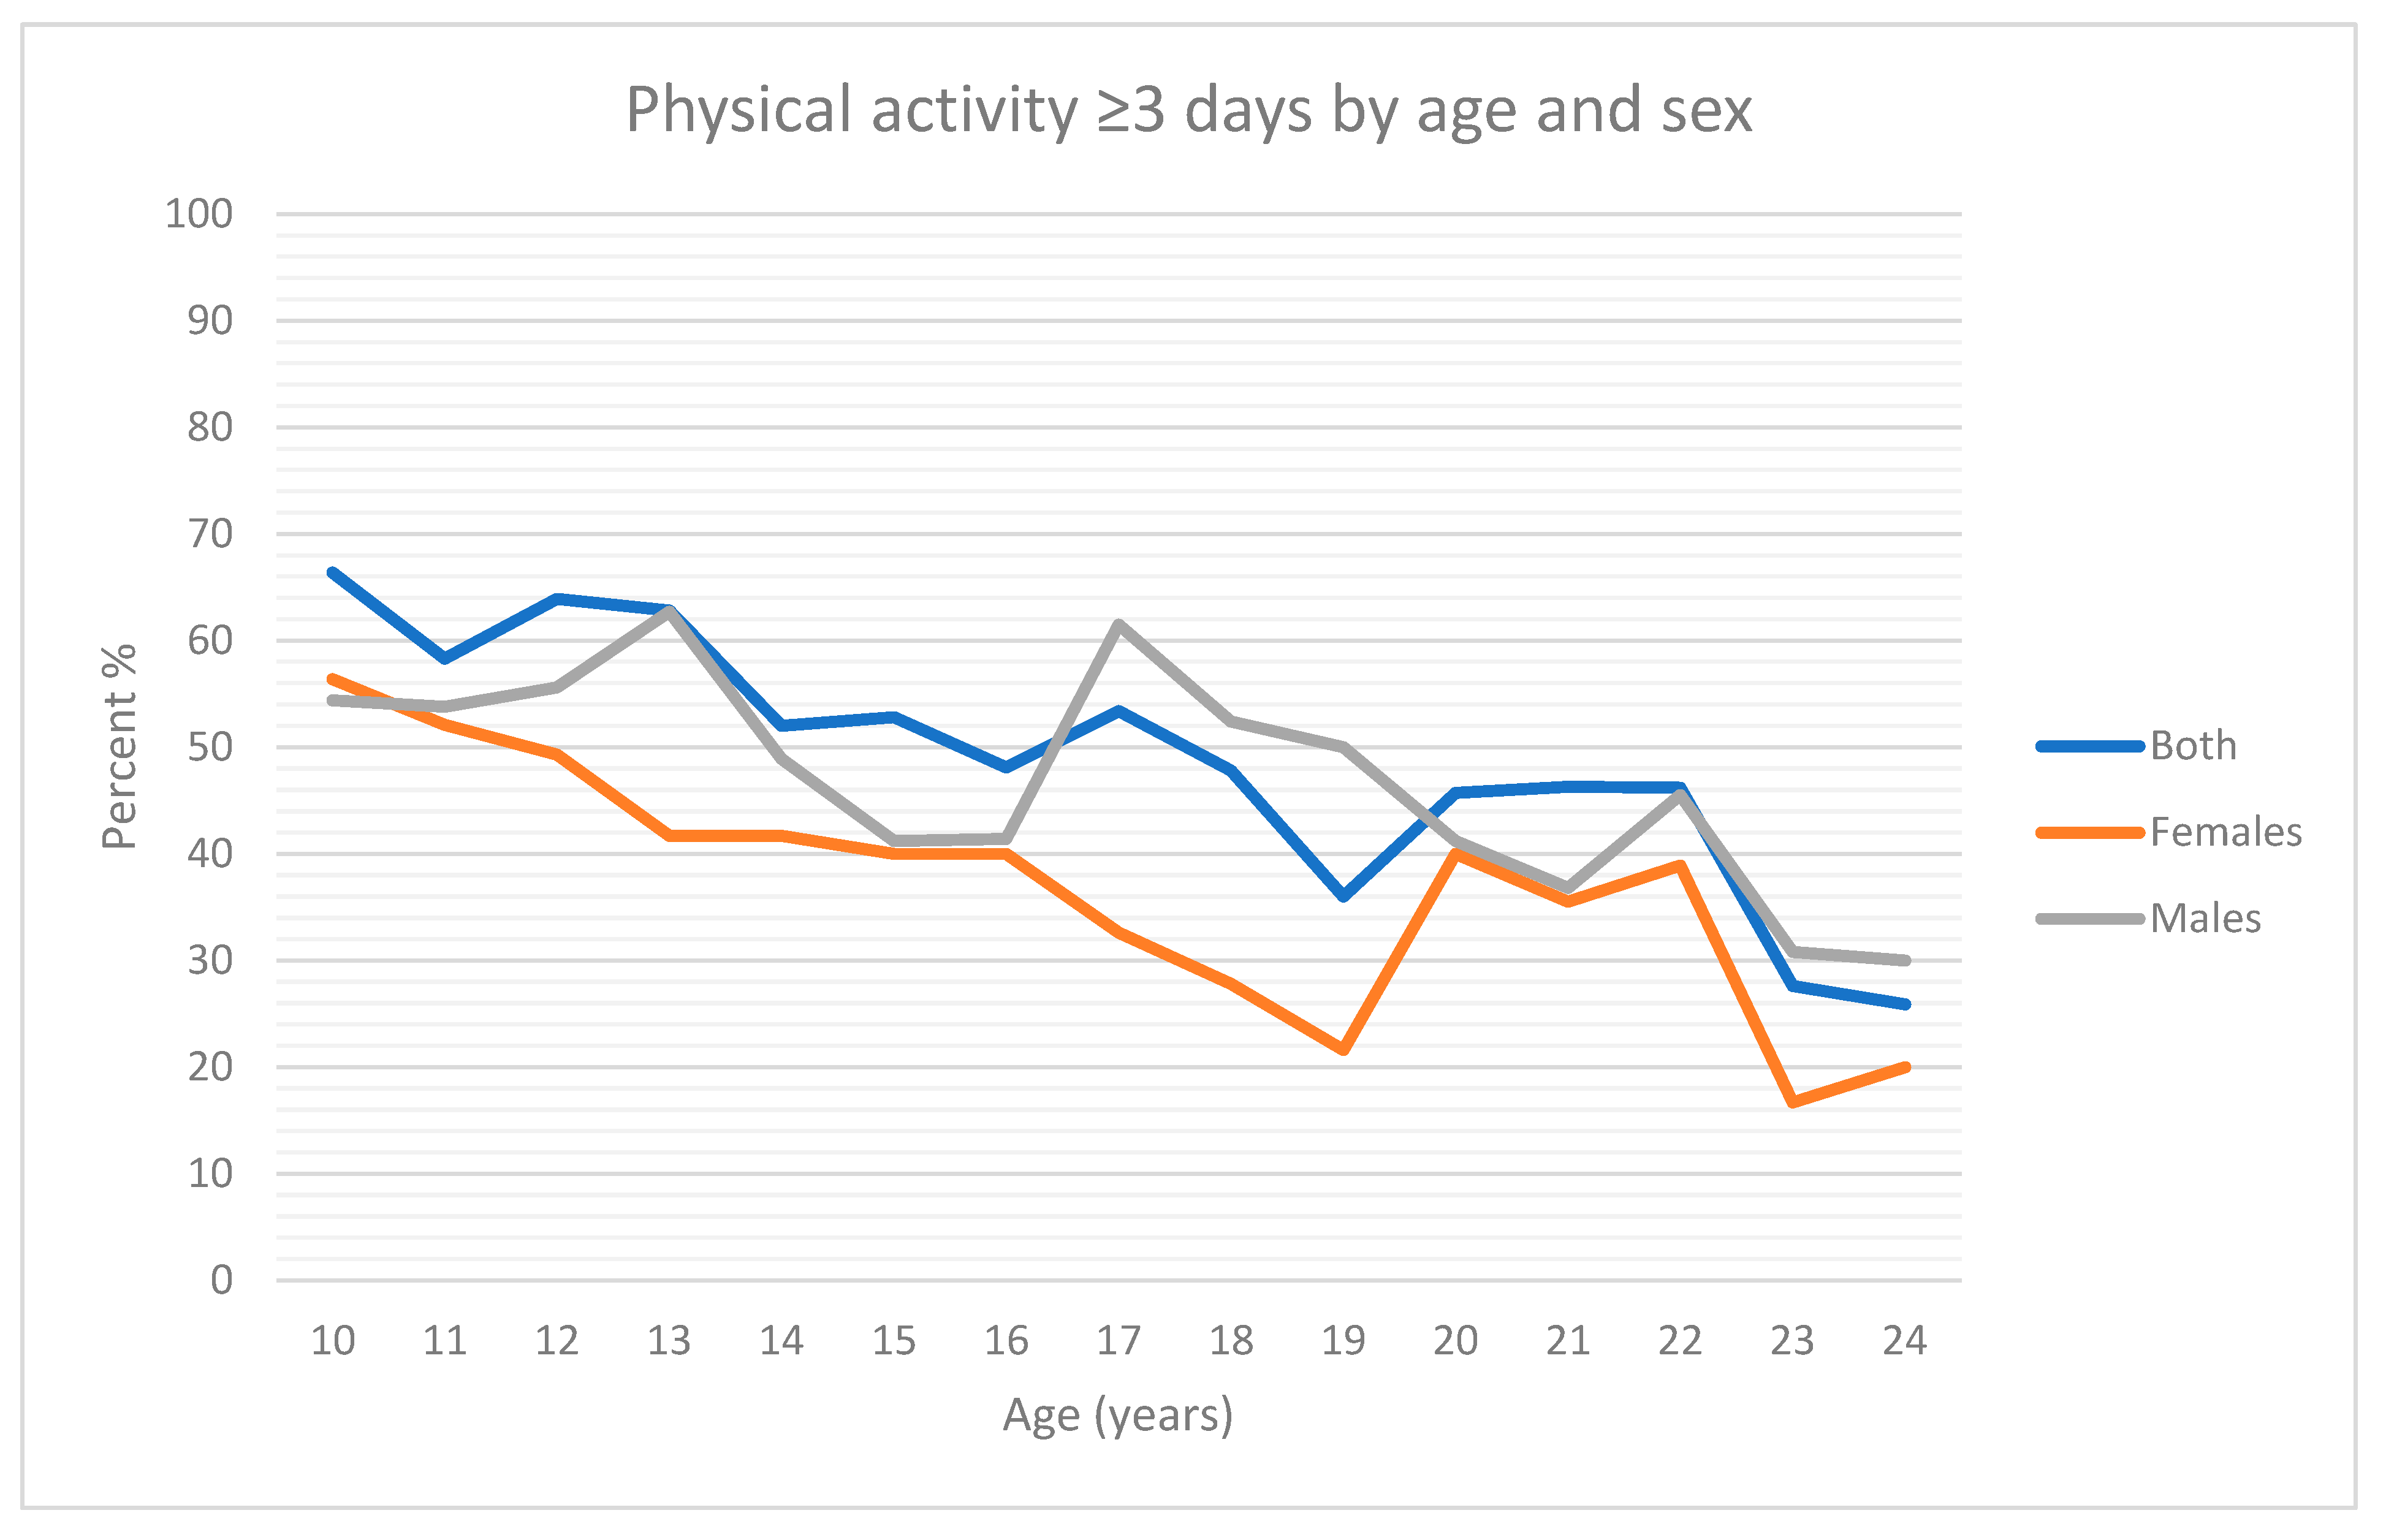
3. Results
4. Discussion
5. Conclusions
Author Contributions
Funding
Institutional Review Board Statement
Informed Consent Statement
Data Availability Statement
Acknowledgments
Conflicts of Interest
References
- Australian Institute of Health and Welfare. 3238.0—Estimates and Projections, Aboriginal and Torres Strait Islander Australians, 2006 to 2031; AIHW: Canberra, Australia, 2019.
- Azzopardi, P.; Blow, N.; Purcell, T.; Brown, N.; Ritchie, T.; Brown, A. Investing in the health of Aboriginal and Torres Strait Islander adolescents: A foundation for achieving health equity. Med. J. Aust. 2020, 212, 202–204.e1. [Google Scholar] [CrossRef] [PubMed]
- Gubhaju, L.; Banks, E.; Ward, J.; D’Este, C.; Ivers, R.; Roseby, R.; Azzopardi, P.; Williamson, A.; Chamberlain, C.; Liu, B.; et al. ‘Next Generation Youth Well-being Study’: Understanding the health and social well-being trajectories of Australian Aboriginal adolescents aged 10–24 years: Study protocol. BMJ Open 2019, 9, e028734. [Google Scholar] [CrossRef] [PubMed] [Green Version]
- Chaput, J.-P.; Willumsen, J.; Bull, F.; Chou, R.; Ekelund, U.; Firth, J.; Jago, R.; Ortega, F.B.; Katzmarzyk, P.T. 2020 WHO guidelines on physical activity and sedentary behaviour for children and adolescents aged 5–17 years: Summary of the evidence. Int. J. Behav. Nutr. Phys. Act. 2020, 17, 141. [Google Scholar] [CrossRef] [PubMed]
- McKay, C.D.; O’Bryan, E.; Gubhaju, L.; McNamara, B.; Gibberd, A.J.; Azzopardi, P.; Eades, S. Potential Determinants of Cardio-Metabolic Risk among Aboriginal and Torres Strait Islander Children and Adolescents: A Systematic Review. Int. J. Environ. Res. Public Health 2022, 19, 9180. [Google Scholar] [CrossRef]
- Walker, T.; Molenaar, A.; Palermo, C. A qualitative study exploring what it means to be healthy for young Indigenous Australians and the role of social media in influencing health behaviour. Heal. Promot. J. Aust. 2020, 32, 532–540. [Google Scholar] [CrossRef]
- Pressick, E.L.; Gray, M.A.; Cole, R.L.; Burkett, B. A systematic review on research into the effectiveness of group-based sport and exercise programs designed for Indigenous adults. J. Sci. Med. Sport 2016, 19, 726–732. [Google Scholar] [CrossRef] [Green Version]
- Macniven, R.; Foley, B.C.; Owen, K.B.; Evans, J.R.; Bauman, A.E.; Reece, L.J. Physical activity and sport participation characteristics of Indigenous children registered in the Active Kids voucher program in New South Wales. J. Sci. Med. Sport 2020, 23, 1178–1184. [Google Scholar] [CrossRef]
- Australian Bureau of Statistics (ABS). Australian Aboriginal and Torres Strait Islander Health Survey: Physical activity, 2012–2013; Australian Bureau of Statistics (ABS): Canberra, Australia, 2014.
- Evans, J.R.; Wilson, R.; Coleman, C.; Man, N.; Olds, T. Physical activity among indigenous Australian children and youth in remote and non-remote areas. Soc. Sci. Med. 2018, 206, 93–99. [Google Scholar] [CrossRef]
- Wilson, R.; Evans, J.; Macniven, R. Long term trends in Aboriginal and Torres Strait Islander youth sport participation 2005–2019. Ann. Leis. Res. 2020, 1–11. [Google Scholar] [CrossRef]
- Macniven, R.; Hearn, S.; Grunseit, A.; Richards, J.; Nutbeam, D.; Bauman, A. Correlates of physical activity among Australian Indigenous and non-Indigenous adolescents. Aust. N. Z. J. Public Health 2016, 41, 187–192. [Google Scholar] [CrossRef] [Green Version]
- Dumuid, D.; Wake, M.; Burgner, D.; Tremblay, M.S.; Okely, A.D.; Edwards, B.; Dwyer, T.; Olds, T. Balancing time use for children’s fitness and adiposity: Evidence to inform 24-hour guidelines for sleep, sedentary time and physical activity. PLoS ONE 2021, 16, e0245501. [Google Scholar] [CrossRef] [PubMed]
- Okely, A.D.; Ghersi, D.; Loughran, S.P.; Cliff, D.P.; Shilton, T.; Jones, R.A.; Stanley, R.M.; Sherring, J.; Toms, N.; Eckermann, S.; et al. A collaborative approach to adopting/adapting guidelines. The Australian 24-hour movement guidelines for children (5–12 years) and young people (13–17 years): An integration of physical activity, sedentary behaviour, and sleep. Int. J. Behav. Nutr. Phys. Act. 2022, 19, 1–21. [Google Scholar] [CrossRef] [PubMed]
- Wilson, R.; Dumuid, D.; Olds, T.; Evans, J. Lifestyle clusters and academic achievement in Australian Indigenous children: Empirical findings and discussion of ecological levers for closing the gap. SSM-Popul. Health 2020, 10, 100535. [Google Scholar] [CrossRef]
- Macniven, R.; Wilson, R.; Olds, T.; Evans, J. Footprints in Time: Physical Activity Levels and Sociodemographic and Movement-Related Associations Within the Longitudinal Study of Indigenous Children. J. Phys. Act. Health 2021, 18, 279–286. [Google Scholar] [CrossRef] [PubMed]
- Ding, D.; Rogers, K.; Macniven, R.; Kamalesh, V.; Kritharides, L.; Chalmers, J.; Bauman, A. Revisiting lifestyle risk index assessment in a large Australian sample: Should sedentary behavior and sleep be included as additional risk factors? Prev. Med. 2014, 60, 102–106. [Google Scholar] [CrossRef]
- East, K.; McNeill, A.; Thrasher, J.F.; Hitchman, S.C. Social norms as a predictor of smoking uptake among youth: A systematic review, meta-analysis and meta-regression of prospective cohort studies. Addiction 2021, 116, 2953–2967. [Google Scholar] [CrossRef]
- Sudhinaraset, M.; Wigglesworth, C.; Takeuchi, D. Social and Cultural Contexts of Alcohol Use: Influences in a Social-Ecological Framework. Alcohol Res. 2016, 38, 35–45. [Google Scholar]
- Noble, N.; Paul, C.; Sanson-Fisher, R.; Turon, H.; Turner, N.; Conigrave, K. Ready, set, go: A cross-sectional survey to understand priorities and preferences for multiple health behaviour change in a highly disadvantaged group. BMC Health Serv. Res. 2016, 16, 1–11. [Google Scholar] [CrossRef] [Green Version]
- Noble, N.; Paul, C.; Turon, H.; Oldmeadow, C. Which modifiable health risk behaviours are related? A systematic review of the clustering of Smoking, Nutrition, Alcohol and Physical activity (‘SNAP’) health risk factors. Prev. Med. 2015, 81, 16–41. [Google Scholar] [CrossRef]
- Centre for Epidemiology and Evidence; NSW Ministry of Health. NSW Population Health Survey (SAPHaRI); NSW Ministry of Health: Sydney, Australia, 2022.
- The SEARCH Investigators. The Study of Environment on Aboriginal Resilience and Child Health (SEARCH): Study protocol. BMC Public Health 2010, 10, 287. [Google Scholar] [CrossRef] [Green Version]
- Booth, M.L.; Okely, A.D.; Chey, T.; Bauman, A. The reliability and validity of the physical activity questions in the WHO health behaviour in schoolchildren (HBSC) survey: A population study. Br. J. Sports Med. 2001, 35, 263–267. [Google Scholar] [CrossRef] [PubMed] [Green Version]
- Bull, F.C.; Al-Ansari, S.S.; Biddle, S.; Borodulin, K.; Buman, M.P.; Cardon, G.; Carty, C.; Chaput, J.-P.; Chastin, S.; Chou, R.; et al. World Health Organization 2020 guidelines on physical activity and sedentary behaviour. Br. J. Sports Med. 2020, 54, 1451–1462. [Google Scholar] [CrossRef] [PubMed]
- Biddle, N. Population Projections—CAEPR Indigenous Population Project 2011 Census Papers, No. 14/2013; Centre for Aboriginal Economic Policy Research (CAEPR), ANU: Canberra, Australia, 2013. [Google Scholar]
- Buysse, D.J.; Reynolds, C.F., III.; Monk, T.H.; Berman, S.R.; Kupfer, D.J. The Pittsburgh sleep quality index: A new instrument for psychiatric practice and research. Psychiatry Res. 1989, 28, 193–213. [Google Scholar] [CrossRef] [PubMed]
- Australian Institute of Health and Welfare. National Drug Strategy Household Survey 2019; AIHW: Canberra, Asutralia, 2020.
- Thurber, K.A.; Thandrayen, J.; Banks, E.; Doery, K.; Sedgwick, M.; Lovett, R. Strengths-based approaches for quantitative data analysis: A case study using the australian Longitudinal Study of Indigenous Children. SSM-Popul. Health 2020, 12, 100637. [Google Scholar] [CrossRef]
- Sterdt, E.; Liersch, S.; Walter, U. Correlates of physical activity of children and adolescents: A systematic review of reviews. Health Educ. J. 2014, 73, 72–89. [Google Scholar] [CrossRef]
- Mayne, S.L.; Virudachalam, S.; Fiks, A.G. Clustering of unhealthy behaviors in a nationally representative sample of U.S. children and adolescents. Prev. Med. 2019, 130, 105892. [Google Scholar] [CrossRef]
- Harding, S.K.; Page, A.S.; Falconer, C.; Cooper, A.R. Longitudinal changes in sedentary time and physical activity during adolescence. Int. J. Behav. Nutr. Phys. Act. 2015, 12, 1–7. [Google Scholar] [CrossRef] [Green Version]
- Macniven, R.; Stanley, R.M.; Biles, B.; Dumuid, D.; Olds, T.; Okely, A.D.; Chandler, P.; Evans, J. Parent wellbeing, family screen time and socioeconomic status during early childhood predict physical activity of Aboriginal and Torres Strait Islander children at ages 8–13. J. Sci. Med. Sport 2022, 25, 896–902. [Google Scholar] [CrossRef]
- Graham, S.; Heris, C.L.; Gubhaju, L.; Eades, F.; Williams, R.; Davis, K.; Whitby, J.; Hunt, K.; Chimote, N.; Eades, S.J. Young Aboriginal people in Australia who have never used marijuana in the ‘Next Generation Youth Well-being study’: A strengths-based approach. Int. J. Drug Policy 2021, 95, 103258. [Google Scholar] [CrossRef]
- VanKim, N.A.; Laska, M.N.; Ehlinger, E.; Lust, K.; Story, M. Understanding young adult physical activity, alcohol and tobacco use in community colleges and 4-year post-secondary institutions: A cross-sectional analysis of epidemiological surveillance data. BMC Public Health 2010, 10, 208–209. [Google Scholar] [CrossRef] [Green Version]
- Macniven, R.; Elwell, M.; Ride, K.; Bauman, A.; Richards, J. A snapshot of physical activity programs targeting Aboriginal and Torres Strait Islander people in Australia. Health Promot. J. Aust. 2017, 28, 185–206. [Google Scholar] [CrossRef] [PubMed]
- Pedišić, Ž.; Bauman, A. Accelerometer-based measures in physical activity surveillance: Current practices and issues. Br. J. Sports Med. 2015, 49, 219–223. [Google Scholar] [CrossRef] [PubMed]


| High Physical Activity (≥3 Days/Week) | ||||||
|---|---|---|---|---|---|---|
| Yes | No | p Value * | Don’t Remember | |||
| N | % | N (%) | ||||
| Total | 1170 | n/a | 524 (41.9) | 455 (36.4) | 191 (15.3) | |
| Sociodemographic | ||||||
| Sex | ||||||
| Female | 661 | 57.3 | 266 (40.2) | 274 (41.5) | 0.002 | 121 (18.3) |
| Male | 493 | 42.7 | 251 (50.9) | 172 (34.9) | 70 (14.2) | |
| Age (years) | ||||||
| 10–11 | 265 | 22.6 | 146 (55.1) | 85 (32.1) | <0.001 | 34 (12.8) |
| 12–13 | 245 | 20.9 | 128 (52.2) | 81 (33.1) | 36 (14.7) | |
| 14–15 | 193 | 16.5 | 83 (43.0) | 75 (38.9) | 35 (18.1) | |
| 16–17 | 160 | 13.7 | 66 (41.3) | 65 (40.6) | 29 (18.1) | |
| 18–19 | 115 | 9.8 | 39 (33.9) | 54 (47.0) | 22 (19.1) | |
| 20–21 | 93 | 7.9 | 35 (37.6) | 41 (44.1) | 17 (18.3) | |
| 22–24 | 99 | 8.5 | 27 (27.3) | 54 (54.5) | 18 (18.2) | |
| State site | ||||||
| Central Australia | 84 | 7.2 | 34 (40.5) | 43 (51.2) | 0.022 | 7 (8.3) |
| Western Australia | 735 | 62.8 | 345 (46.9) | 262 (35.6) | 128 (17.4) | |
| New South Wales | 351 | 30.0 | 145 (41.3) | 150 (42.7) | 56 (16.0) | |
| IRSEO tertiles | ||||||
| Most advantaged | 178 | 30.2 | 100 (44.1) | 78 (34.4) | 0.363 | 49 (21.6) |
| Middle advantaged | 212 | 36.0 | 104 (41.6) | 108 (43.2) | 38 (15.2) | |
| Most disadvantaged | 199 | 33.8 | 102 (45.9) | 78 (34.4) | 23 (10.4) | |
| Movement Behaviours | ||||||
| Weekday recreational screen time | ||||||
| High (≥3 h/day) | 564 | 49.6 | 248 (44.0) | 266 (47.2) | <0.001 | 50 (8.9) |
| Low (0–2 h/day) | 434 | 38.1 | 240 (55.3) | 137 (31.6) | 57 (13.1) | |
| Don’t remember | 140 | 12.3 | 26 (18.6) | 39 (27.9) | 75 (53.6) | |
| Weekend recreational screen time | ||||||
| High (≥3 h/day) | 569 | 49.9 | 247 (43.4) | 263 (46.2) | <0.001 | 59 (10.4) |
| Low (0–2 h/day) | 438 | 38.3 | 238 (54.3) | 147 (33.6) | 53 (12.1) | |
| Don’t remember | 138 | 12.1 | 27 (19.6) | 38 (27.5) | 73 (52.9) | |
| Sleep quality | ||||||
| Very good | 430 | 38.3 | 204 (47.4) | 152 (35.3) | 0.02 | 74 (17.2) |
| Fairly good | 517 | 46.1 | 230 (44.5) | 203 (39.3) | 84 (16.2) | |
| Fairly bad/very bad | 175 | 15.6 | 66 (37.7) | 85 (48.6) | 24 (13.7) | |
| Health behaviours | ||||||
| Ever tried smoking | ||||||
| No | 799 | 70.4 | 406 (50.8) | 274 (34.3) | <0.001 | 119 (14.9) |
| Yes | 302 | 26.6 | 94 (31.1) | 154 (51.0) | 54 (17.9) | |
| Prefer not to say | 34 | 3.0 | 9 (26.5) | 14 (41.2) | 11 (32.4) | |
| How many friends smoke | ||||||
| None | 476 | 45.1 | 240 (50.4) | 167 (35.1) | <0.001 | 69 (14.5) |
| A few | 387 | 36.7 | 154 (39.8) | 163 (42.1) | 70 (18.1) | |
| About half | 104 | 9.9 | 48 (46.2) | 43 (41.3) | 13 (12.5) | |
| All of most | 88 | 8.3 | 22 (25.0) | 50 (56.8) | 16 (18.2) | |
| Ever had a full serving of alcohol | ||||||
| No | 650 | 67.6 | 318 (48.9) | 227 (34.9) | <0.001 | 105 (16.2) |
| Yes | 312 | 32.4 | 119 (38.1) | 153 (49.0) | 40 (12.8) | |
| How many friends drink alcohol? | ||||||
| None | 362 | 37.9 | 174 (48.1) | 137 (37.8) | 0.004 | 51 (14.1) |
| Don’t know | 66 | 6.9 | 23 (34.8) | 26 (39.4) | 17 (25.8) | |
| A few | 255 | 26.7 | 99 (38.8) | 110 (43.1) | 46 (18.0) | |
| About half | 92 | 9.6 | 50 (54.3) | 30 (32.6) | 12 (13.0) | |
| All or most | 179 | 18.8 | 63 (35.2) | 92 (51.4) | 24 (13.4) | |
| All | Females | Males | ||||
|---|---|---|---|---|---|---|
| Variable | OR (95% CI) | OR (95% CI) | OR (95% CI) | |||
| High Physical Activity | Don’t Remember | High Physical Activity | Don’t Remember | High Physical Activity | Don’t Remember | |
| Sociodemographic | ||||||
| Gender (ref male) | ||||||
| Female | 0.57 (0.41–0.81) | 1.42 (0.82–2.47) | - | - | - | - |
| Age (years; ref 22–24) | ||||||
| 10–11 | 2.10 (0.80–5.52) | 0.33 (0.08–1.27) | 0.83 (0.23–3.05) | 0.28 (0.05–1.45) | 6.83 (1.43–35.57) | 0.20 (0.01–3.14) |
| 12–13 | 2.18 (0.89–5.35) | 0.51 (0.15–1.67) | 1.23 (0.37–4.11) | 0.77 (0.20–3.07) | 4.80 (1.10–20.99) | 0.06 (0.00–0.93) |
| 14–15 | 1.87 (0.83–4.23) | 0.73 (0.26–2.03) | 1.86 (0.63–5.49) | 0.72 (0.21–2.50) | 2.45 (0.63–9.44) | 0.64 (0.08–5.07) |
| 16–17 | 1.48 (0.65–3.35) | 0.58 (0.19–1.74) | 1.05 (0.36–3.03) | 0.70 (0.20–2.42) | 2.26 (0.57–8.91) | 0.26 (0.01–5.00) |
| 18–19 | 1.34 (0.58–3.12) | 0.82 (0.28–2.38) | 0.52 (0.16–1.72) | 0.71 (0.20–2.54) | 4.59 (1.06–19.96) | 2.62 (0.30–23.34) |
| 20–21 | 1.84 (0.79–4.26) | 0.95 (0.30–2.97) | 1.92 (0.67–5.54) | 0.92 (0.23–3.73) | 1.64 (0.38–7.08) | 2.03 (0.21–19.54) |
| State site (ref New South Wales) | ||||||
| Central Australia | 1.17 (0.89–2.33) | 0.64 (0.20–2.13) | 0.97 (0.35–2.72) | 0.53 (0.09–3.03) | 1.27 (0.52–3.11) | 0.30 (0.04–2.18) |
| Western Australia | 1.10 (0.77–1.57) | 1.17 (0.68–1.99) | 0.85 (0.51–1.40) | 1.18 (0.61–2.30) | 1.39 (0.81–2.41) | 0.72 (0.24–2.17) |
| Movement behaviours | ||||||
| Weekday recreational screen time (ref high ≥ 3 h/day) | ||||||
| Low 0–2 h/day | 1.70 (1.11–2.61) | 1.86 (0.93–3.72) | 1.35 (0.73–2.51) | 1.80 (0.76–4.25) | 2.20 (1.12–4.30) | 2.44 (0.58–10.31) |
| Don’t remember | 0.84 (0.35–2.04) | 6.73 (2.70–16.77) | 0.87 (0.27–2.74) | 5.01 (1.71–14.72) | 0.69 (0.15–3.10) | 44.44 (4.40–494.98) |
| Weekend recreational screen time (ref high ≥ 3 h/day) | ||||||
| Low 0–2 h/day | 1.41 (0.92–2.15) | 0.97 (0.49–1.91) | 1.33 (0.73–2.43) | 0.84 (0.36–1.97) | 1.49 (0.77–2.88) | 0.92 (0.23–3.73) |
| Don’t remember | 0.77 (0.33–1.82) | 2.20 (0.89–5.41) | 0.62 (0.19–2.01) | 2.33 (0.81–6.74) | 1.00 (0.26–3.92) | 0.99 (0.10–9.99) |
| Sleep quality (ref fairly/very bad) | ||||||
| Very good | 1.18 (0.73–1.91) | 1.78 (0.84–3.77) | 1.27 (0.66–2.43) | 1.59 (0.66–3.81) | 1.18 (0.53–2.61) | 3.69 (0.62–22.10) |
| Fairly good | 0.91 (0.53–1.56) | 1.92 (0.83–4.40) | 0.95 (0.44–2.05) | 2.02 (0.75–5.45) | 0.99 (0.42–2.32) | 3.65 (0.54–24.74) |
| Health behaviours | ||||||
| Ever tried smoking (ref yes) | ||||||
| No | 1.44 (0.89–2.33) | 0.69 (0.34–1.39) | 2.35 (1.19–4.63) | 0.76 (0.33–1.75) | 0.87 (0.41–1.84) | 1.42 (0.35–5.83) |
| Prefer not to say | 0.87 (0.27–2.82) | 2.08 (0.50–8.67) | 0.72 (1.17–4.52) | 1.58 (0.24–10.47) | 0.87 (0.16–4.67) | 5.41 (0.47–62.12) |
| Ever tried a full serve of alcohol (ref yes) | ||||||
| No | 0.78 (0.44–1.36) | 1.96 (0.91–4.24) | 0.80 (0.35–1.80) | 1.86 (0.71–4.89) | 0.71 (0.30–1.64) | 3.98 (0.92–17.24) |
| Peer behaviours | ||||||
| How many friends smoke (ref all of most) | ||||||
| None | 2.12 (0.96–4.71) | 1.42 (0.44–4.62) | 2.38 (8.22–6.87) | 2.58 (0.62–10.72) | 1.54 (0.40–5.89) | 0.07 (0.00–1.22) |
| A few | 1.52 (0.77–3.00) | 1.58 (0.59–4.26) | 1.47 (0.58–3.71) | 2.63 (0.78–8.88) | 1.44 (0.52–4.59) | 0.22 (0.02–2.22) |
| About half | 1.92 (0.89–4.11) | 1.12 (0.35–3.60) | 2.48 (0.86–7.17) | 1.26 (0.29–5.53) | 1.31 (0.39–4.41) | 0.51 (0.05–5.29) |
| How many friends drink alcohol (ref all or most) | ||||||
| None | 0.87 (0.41–1.85) | 0.90 (0.30–2.65) | 1.19 (0.42–3.39) | 0.73 (0.20–2.73) | 0.60 (0.18–2.06) | 2.16 (0.16–28.71) |
| Don’t know | 0.53 (0.22–1.30) | 0.75 (0.23–2.44) | 0.45 (0.11–1.81) | 1.28 (0.32–5.14) | 0.50 (0.14–1.82) | 0.08 (0.00–2.28) |
| A few | 0.88 (0.49–1.57) | 0.97 (0.42–2.26) | 0.69 (0.32–1.53) | 0.82 (0.30–2.21) | 0.87 (0.32–2.38) | 1.64 (0.19–14.03) |
| About half | 2.08 (1.04–4.15) | 1.20 (0.41–3.55) | 2.09 (0.77–5.62) | 1.72 (0.46–6.46) | 1.81 (0.62–5.26) | 0.46 (0.05–4.67) |
| All | Females | Males | ||||
|---|---|---|---|---|---|---|
| OR (95% CI) | OR (95% CI) | OR (95% CI) | ||||
| High Activity | Don’t Remember | High Activity | Don’t Remember | High Activity | Don’t Remember | |
| Movement behaviours | ||||||
| Weekday recreational screen time (ref high ≥ 3 h/day) | ||||||
| Low 0–2 h/day | 1.72 (1.29–2.28) | 2.33 (1.50–3.62) | 1.32 (0.89–1.94) | 2.13 (1.19–3.82) | 2.29 (1.49–2.48) | 2.63 (1.31–5.29) |
| Don’t remember | 0.73 (0.42–1.26) | 11.21 (6.74–18.64) | 0.67 (0.35–1.29) | 9.21 (4.93–17.21) | 0.89 (3.21–2.48) | 18.03 (6.91–47.05) |
| Weekend recreational screen time (ref high ≥ 3 h/day) | ||||||
| Low 0–2 h/day | 1.61 (1.22–2.13) | 1.63 (1.06–2.50) | 1.43 (0.97–2.11) | 1.55 (0.90–2.67) | 1.84 (1.22–2.79) | 1.10 (0.41–2.94) |
| Don’t remember | 0.76 (0.44–1.31) | 9.21 (5.59–15.21) | 0.68 (0.35–1.33) | 6.35 (3.46–11.66) | 1.85 (0.91–3.79) | 19.79 (7.62–51.39) |
| Sleep quality (ref fairly/very bad) | ||||||
| Very good | 1.33 (0.88–2.01) | 1.95 (1.12–3.42) | 1.61 (0.92–2.81) | 1.79 (0.91–3.55) | 1.13 (0.60–2.16) | 3.21 (1.13–9.09) |
| Fairly good | 1.30 (0.88–1.91) | 1.51 (0.89–2.57) | 1.31 (0.78–2.19) | 1.29 (0.69–2.41) | 1.36 (0.73–2.51) | 2.31 (0.64–6.37) |
| Health behaviours | ||||||
| Ever tried smoking (ref yes) | ||||||
| No | 1.86 (1.30–2.65) | 1.22 (0.77–1.92) | 3.14 (1.92–5.15) | 1.47 (0.84–2.58) | 0.97 (0.55–1.71) | 0.98 (0.44–2.19) |
| Prefer not to say | 0.84 (0.34–2.07) | 2.01 (0.84–4.84) | 1.12 (0.35–3.57) | 1.28 (0.40–4.12) | 0.62 (0.14–2.73) | 3.68 (0.83–16.38) |
| Ever tried a full serve of alcohol (ref yes) | ||||||
| No | 0.96 (0.60–1.54) | 2.08 (1.11–3.91) | 1.19 (0.62–2.27) | 2.19 (1.02–4.72) | 0.74 (0.36–1.50) | 1.90 (0.61–5.91) |
| Peer behaviours | ||||||
| How many friends smoke (ref all of most) | ||||||
| None | 2.24 (1.24–4.05) | 1.22 (0.61–2.46) | 3.06 (1.35–6.92) | 1.71 (0.68–4.31) | 1.50 (0.59–3.80) | 0.73 (0.22–2.40) |
| A few | 1.80 (1.02–3.16) | 1.21 (0.63–2.30) | 1.88 (0.85–4.15) | 1.75 (0.74–4.15) | 1.70 (0.72–4.02) | 0.71 (0.25–2.04) |
| About half | 2.36 (1.22–4.59) | 0.90 (0.38–2.10) | 3.29 (1.33–8.17) | 1.03 (0.33–3.27) | 1.45 (0.52–4.01) | 0.70 (0.18–2.65) |
| How many friends drink alcohol (ref all or most) | ||||||
| None | 1.31 (0.68–2.51) | 0.75 (0.36–1.56) | 1.32 (0.67–2.60) | 1.79 (0.78–4.10) | 0.70 (0.28–1.71) | 4.51 (1.12–18.15) |
| Don’t know | 1.35 (0.70–2.59) | 0.58 (0.28–1.18) | 1.01 (0.38–2.70) | 2.70 (0.98–7.49) | 0.54 (0.19–1.55) | 3.53 (0.86–14.50) |
| A few | 2.66 (1.24–5.69) | 0.54 (0.21–1.36) | 1.16 (0.64–2.10) | 1.62 (0.80–3.28) | 0.87 (0.41–1.84) | 1.88 (0.60–5.84) |
| About half | 2.22 (1.26–3.90) | 0.32 (0.14–0.71) | 2.72 (1.29–5.75) | 1.42 (0.51–4.02) | 1.30 (0.52–3.23) | 1.81 (0.44–7.47) |
Disclaimer/Publisher’s Note: The statements, opinions and data contained in all publications are solely those of the individual author(s) and contributor(s) and not of MDPI and/or the editor(s). MDPI and/or the editor(s) disclaim responsibility for any injury to people or property resulting from any ideas, methods, instructions or products referred to in the content. |
© 2023 by the authors. Licensee MDPI, Basel, Switzerland. This article is an open access article distributed under the terms and conditions of the Creative Commons Attribution (CC BY) license (https://creativecommons.org/licenses/by/4.0/).
Share and Cite
Macniven, R.; McKay, C.D.; Graham, S.; Gubhaju, L.; Williams, R.; Williamson, A.; Joshy, G.; Evans, J.R.; Roseby, R.; Porykali, B.; et al. Social and Behavioural Correlates of High Physical Activity Levels among Aboriginal Adolescent Participants of the Next Generation: Youth Wellbeing Study. Int. J. Environ. Res. Public Health 2023, 20, 3738. https://0-doi-org.brum.beds.ac.uk/10.3390/ijerph20043738
Macniven R, McKay CD, Graham S, Gubhaju L, Williams R, Williamson A, Joshy G, Evans JR, Roseby R, Porykali B, et al. Social and Behavioural Correlates of High Physical Activity Levels among Aboriginal Adolescent Participants of the Next Generation: Youth Wellbeing Study. International Journal of Environmental Research and Public Health. 2023; 20(4):3738. https://0-doi-org.brum.beds.ac.uk/10.3390/ijerph20043738
Chicago/Turabian StyleMacniven, Rona, Christopher D. McKay, Simon Graham, Lina Gubhaju, Robyn Williams, Anna Williamson, Grace Joshy, John Robert Evans, Robert Roseby, Bobby Porykali, and et al. 2023. "Social and Behavioural Correlates of High Physical Activity Levels among Aboriginal Adolescent Participants of the Next Generation: Youth Wellbeing Study" International Journal of Environmental Research and Public Health 20, no. 4: 3738. https://0-doi-org.brum.beds.ac.uk/10.3390/ijerph20043738