
Determinants of Future Physical Activity Participation in New Zealand Adolescents across Sociodemographic Groups: A Descriptive Study

 ,
,
Abstract
:1. Introduction
2. Materials and Methods
2.1. Study Design, Participants, and Procedures
2.2. Sociodemographic Variables
2.3. Key Determinants of Future PA Participation
- Current weekly PA duration—Respondents were asked to identify what activities they participated in during the past seven days and how long they participated in each for. The survey listed 77 activities and provided an “Other” option [26,27,28]. The total sum of these durations was calculated as a numerical value for this variable.
- Current number of PA settings—For activities that they had participated in, respondents were asked to answer yes/no to what settings they had participated: “In PE or class at school” (physical education); “In a competition or tournament” (competitive sport); “Training or practising with a coach/instructor” (coached sports training); “Playing or hanging out with family or friends” (social sport); “Playing on my own” (solo sport); “For extra exercise, training, or practice without a coach or instructor” (uncoached sports training). The total number of settings that they had participated in determined a final score for this variable ranging from 0 to 6.
- Current number of PA types—From the 77 PA options provided, we developed a summated score showing the number of activities that any one respondent participated in.
- Current physical literacy: An aggregated measure of responses to four questions regarding knowledge, confidence, competence, and motivation to participate in PA. Full details of the questions are provided in Appendix A. The response for each question ranged from 1 to 5 (1 = Disagree a lot, 5 = Agree a lot). The final score ranged from 4 (very low) to 20 (very high).
- Current social support for PA: An aggregated measure of responses to eleven questions that were grouped into five score categories: (1) “Family/peer social barriers” (Questions 1–4); (2) “General social barriers” (Questions 5–8); (3) “Social encouragement” (Question 9); (4) “Social cohesion” (Question 10); and (5) “Family enjoyment” (Question 11). Full details of the questions are provided in Appendix A. The response for each question ranged from 1 to 5 (Questions 1–8: 1 = Disagree a lot, 5 = Agree a lot; Questions 9–11: 1 = Little social support, 5 = Great social support). The final score ranged from 5 (very low) to 25 (very high).
- Current PA availability issues: An indicator of whether PA is perceived as available to adolescents and whether they have the capability to be active in the way they want. This binary variable was constructed from the responses to two questions. The first question asked “What activities have you participated in during the last 7 days?”. Participants then had the option of stating whether they wanted to perform more PA or not. Of those that wanted to perform more PA, a second question was asked “What’s ONE activity you would do more of if you could?”. Some participants wanted to perform more of an activity they did not currently participate in (attained from question 1), so we assumed they had availability challenges (coded as yes). Those that wanted to perform more of a PA they were already participating in were assumed to not have availability challenges (coded as No). The final score was presented as the proportion of respondents that had availability issues.
2.4. Statistical Analyses
3. Results
3.1. Participant Characteristics

| Sociodemographic Variables | n (%) | |
|---|---|---|
| Age (years) | ||
| 12 | 1477 | (21.4) |
| 13 | 1333 | (19.3) |
| 14 | 1258 | (18.2) |
| 15 | 1137 | (16.5) |
| 16 | 944 | (13.7) |
| 17 | 757 | (11.0) |
| Gender | ||
| Male | 3003 | (43.5) |
| Female | 3853 | (55.8) |
| Diverse | 50 | (0.7) |
| Ethnicity | ||
| Māori | 1008 | (14.6) |
| European | 5845 | (84.6) |
| Pacific | 332 | (4.8) |
| Asian | 754 | (10.9) |
| Other | 165 | (2.4) |
| Physical Disability | ||
| Yes | 389 | (5.6) |
| Deprivation Status a | ||
| Low (1–3) | 2539 | (36.9) |
| Mid (4–7) | 2247 | (32.7) |
| High (8–10) | 1004 | (14.6) |
| Unknown | 1091 | (15.9) |
3.2. Current Determinants of Future PA across Sociodemographic Groups
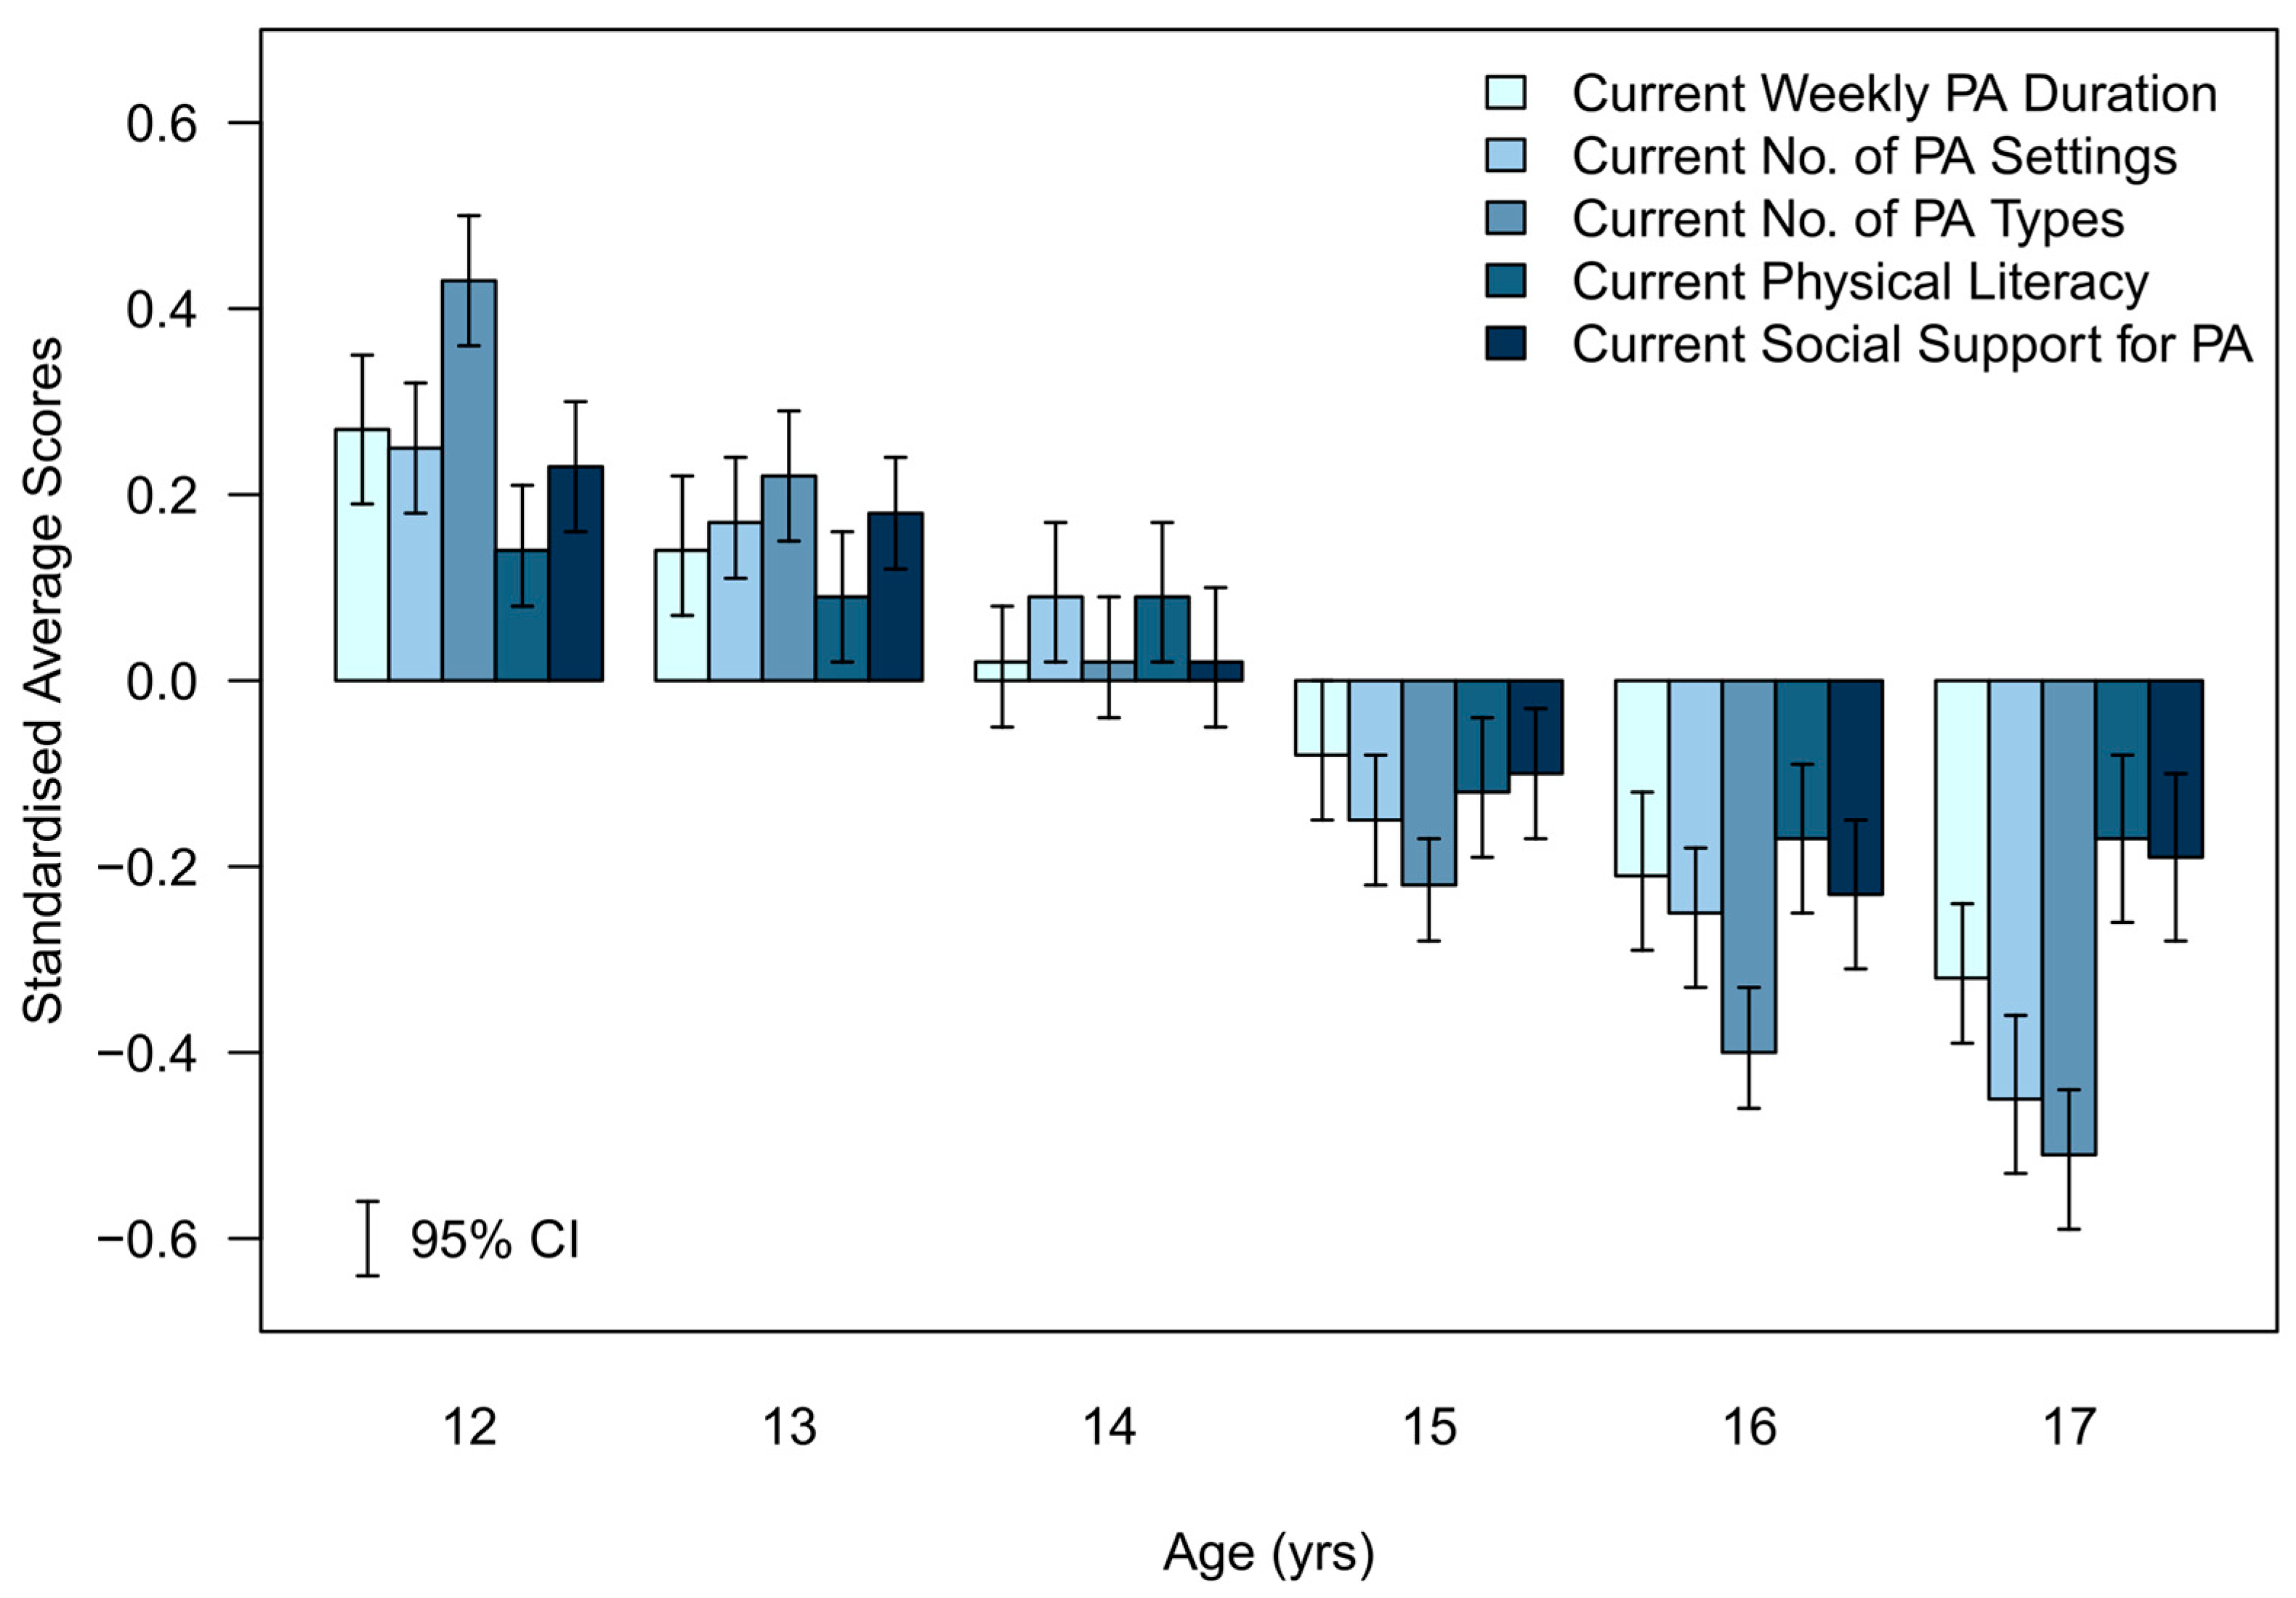
3.2.1. Age
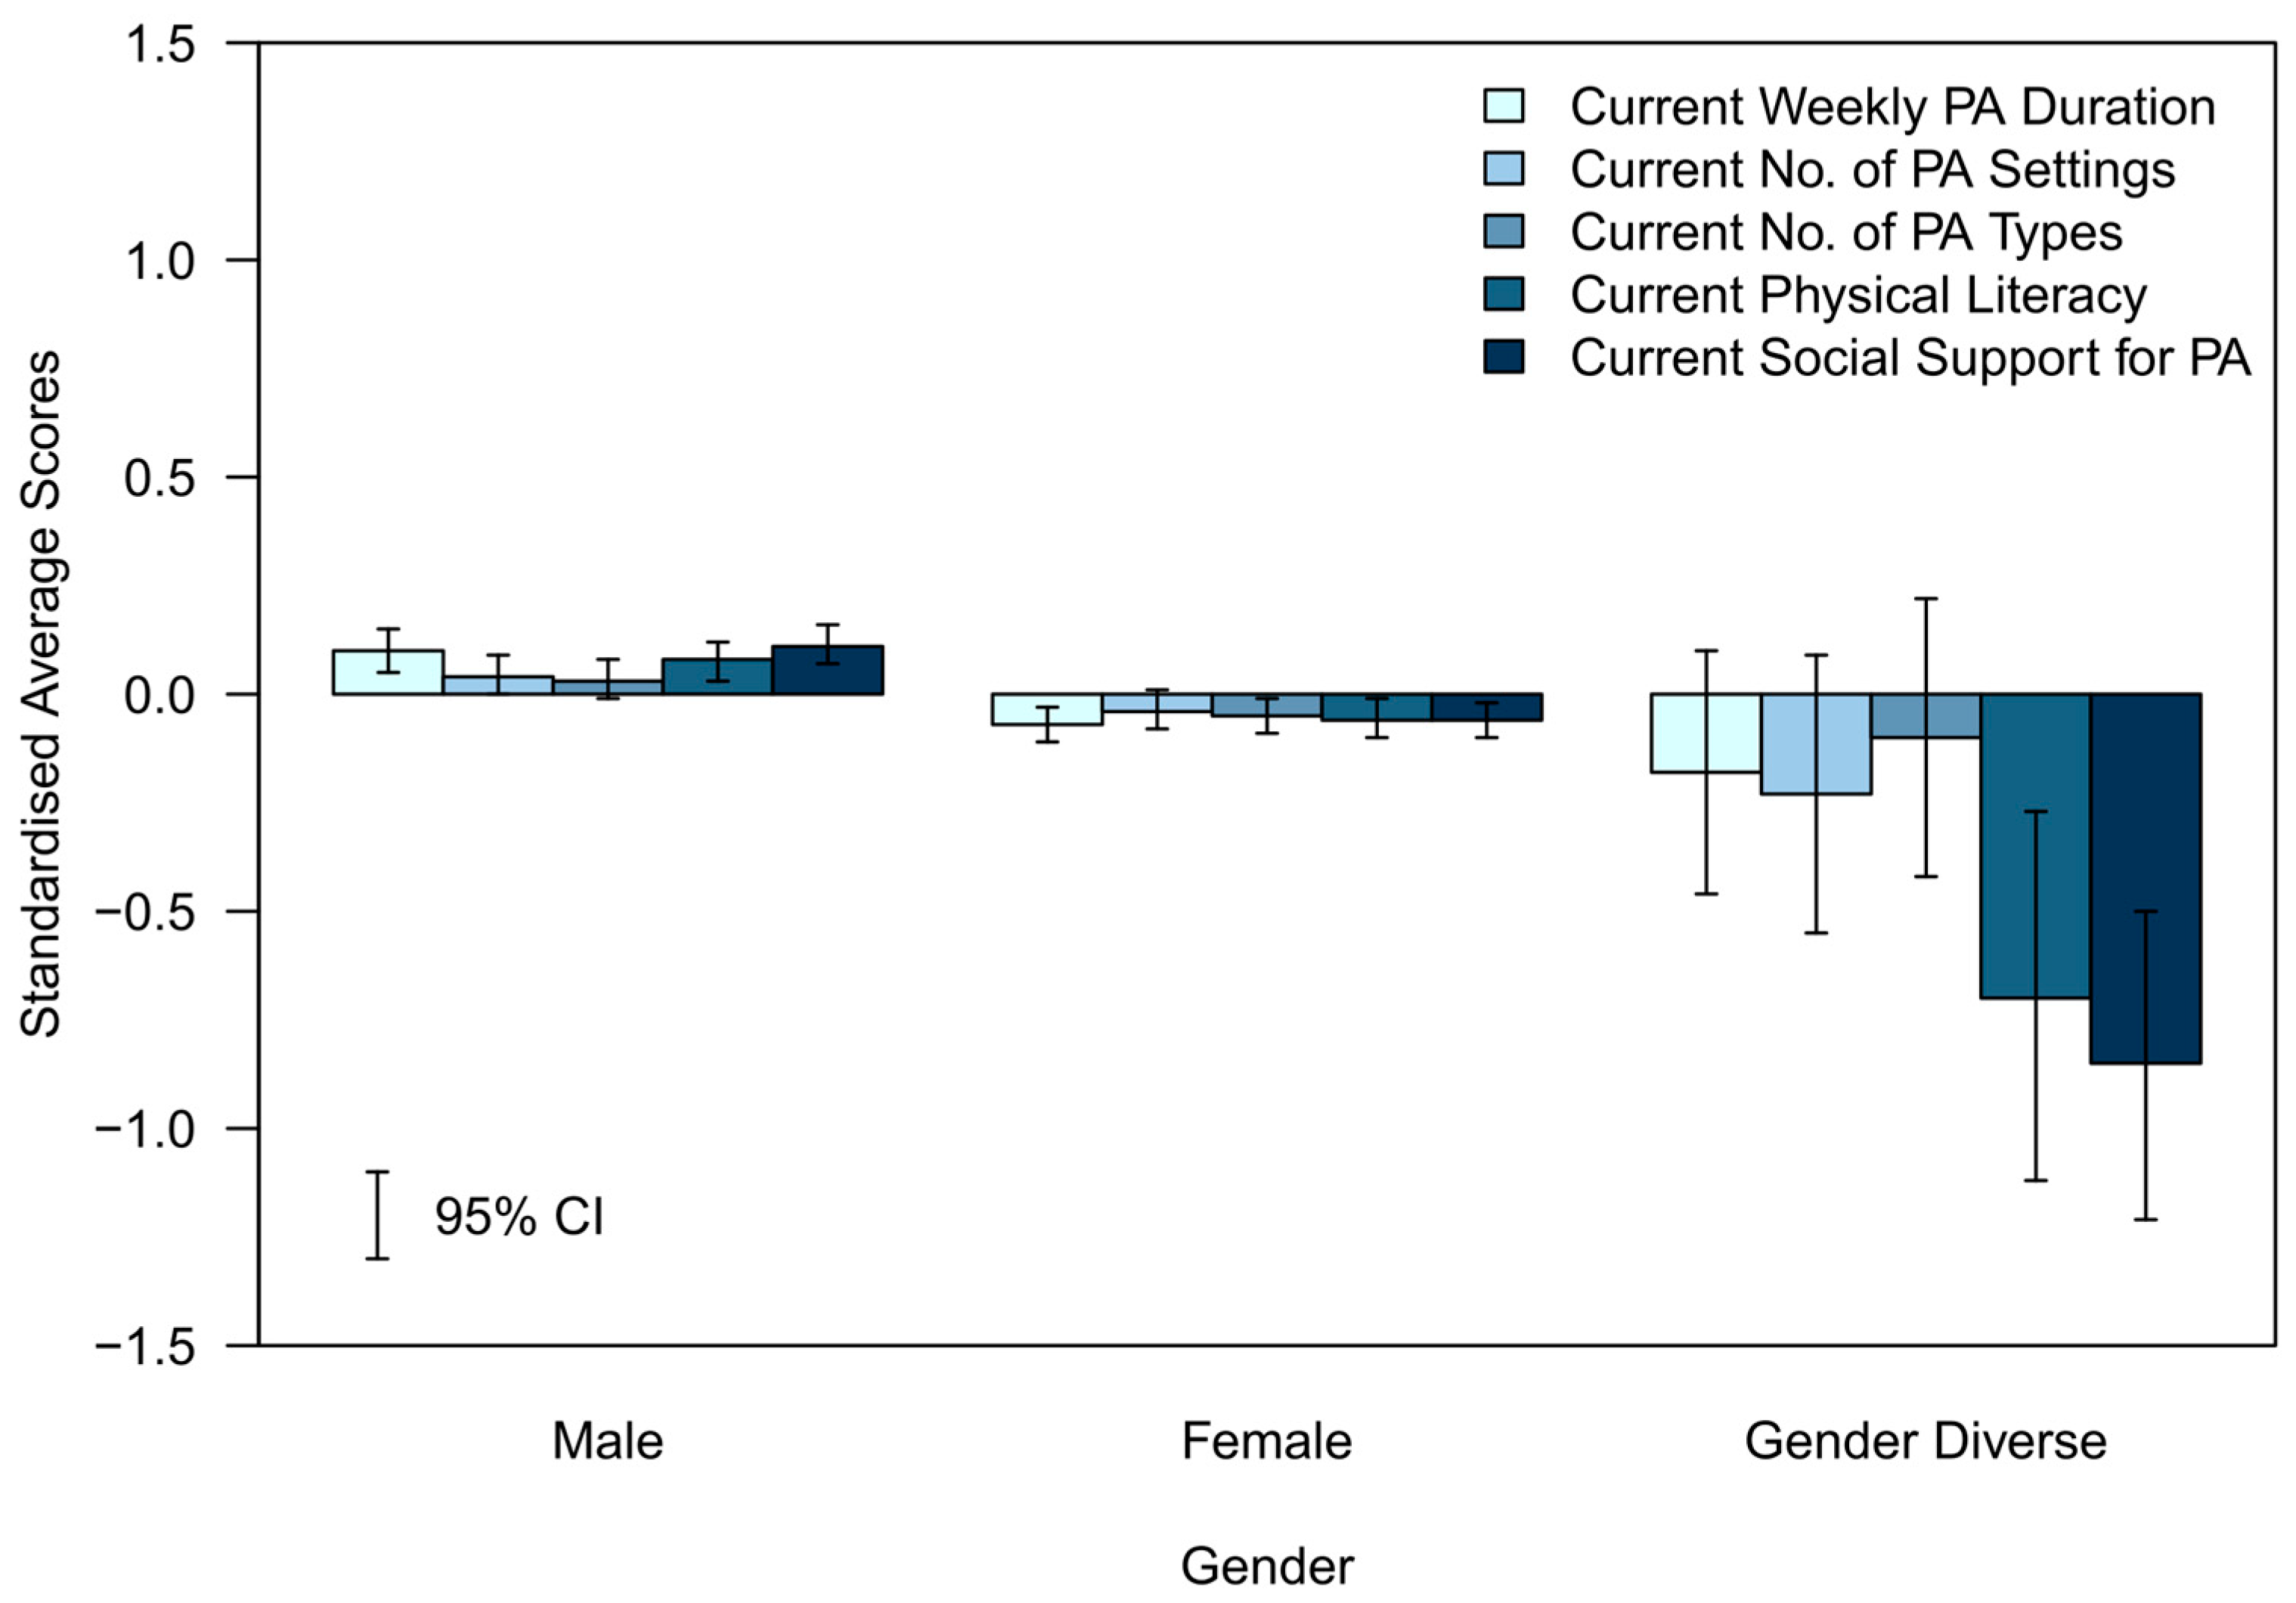
3.2.2. Gender
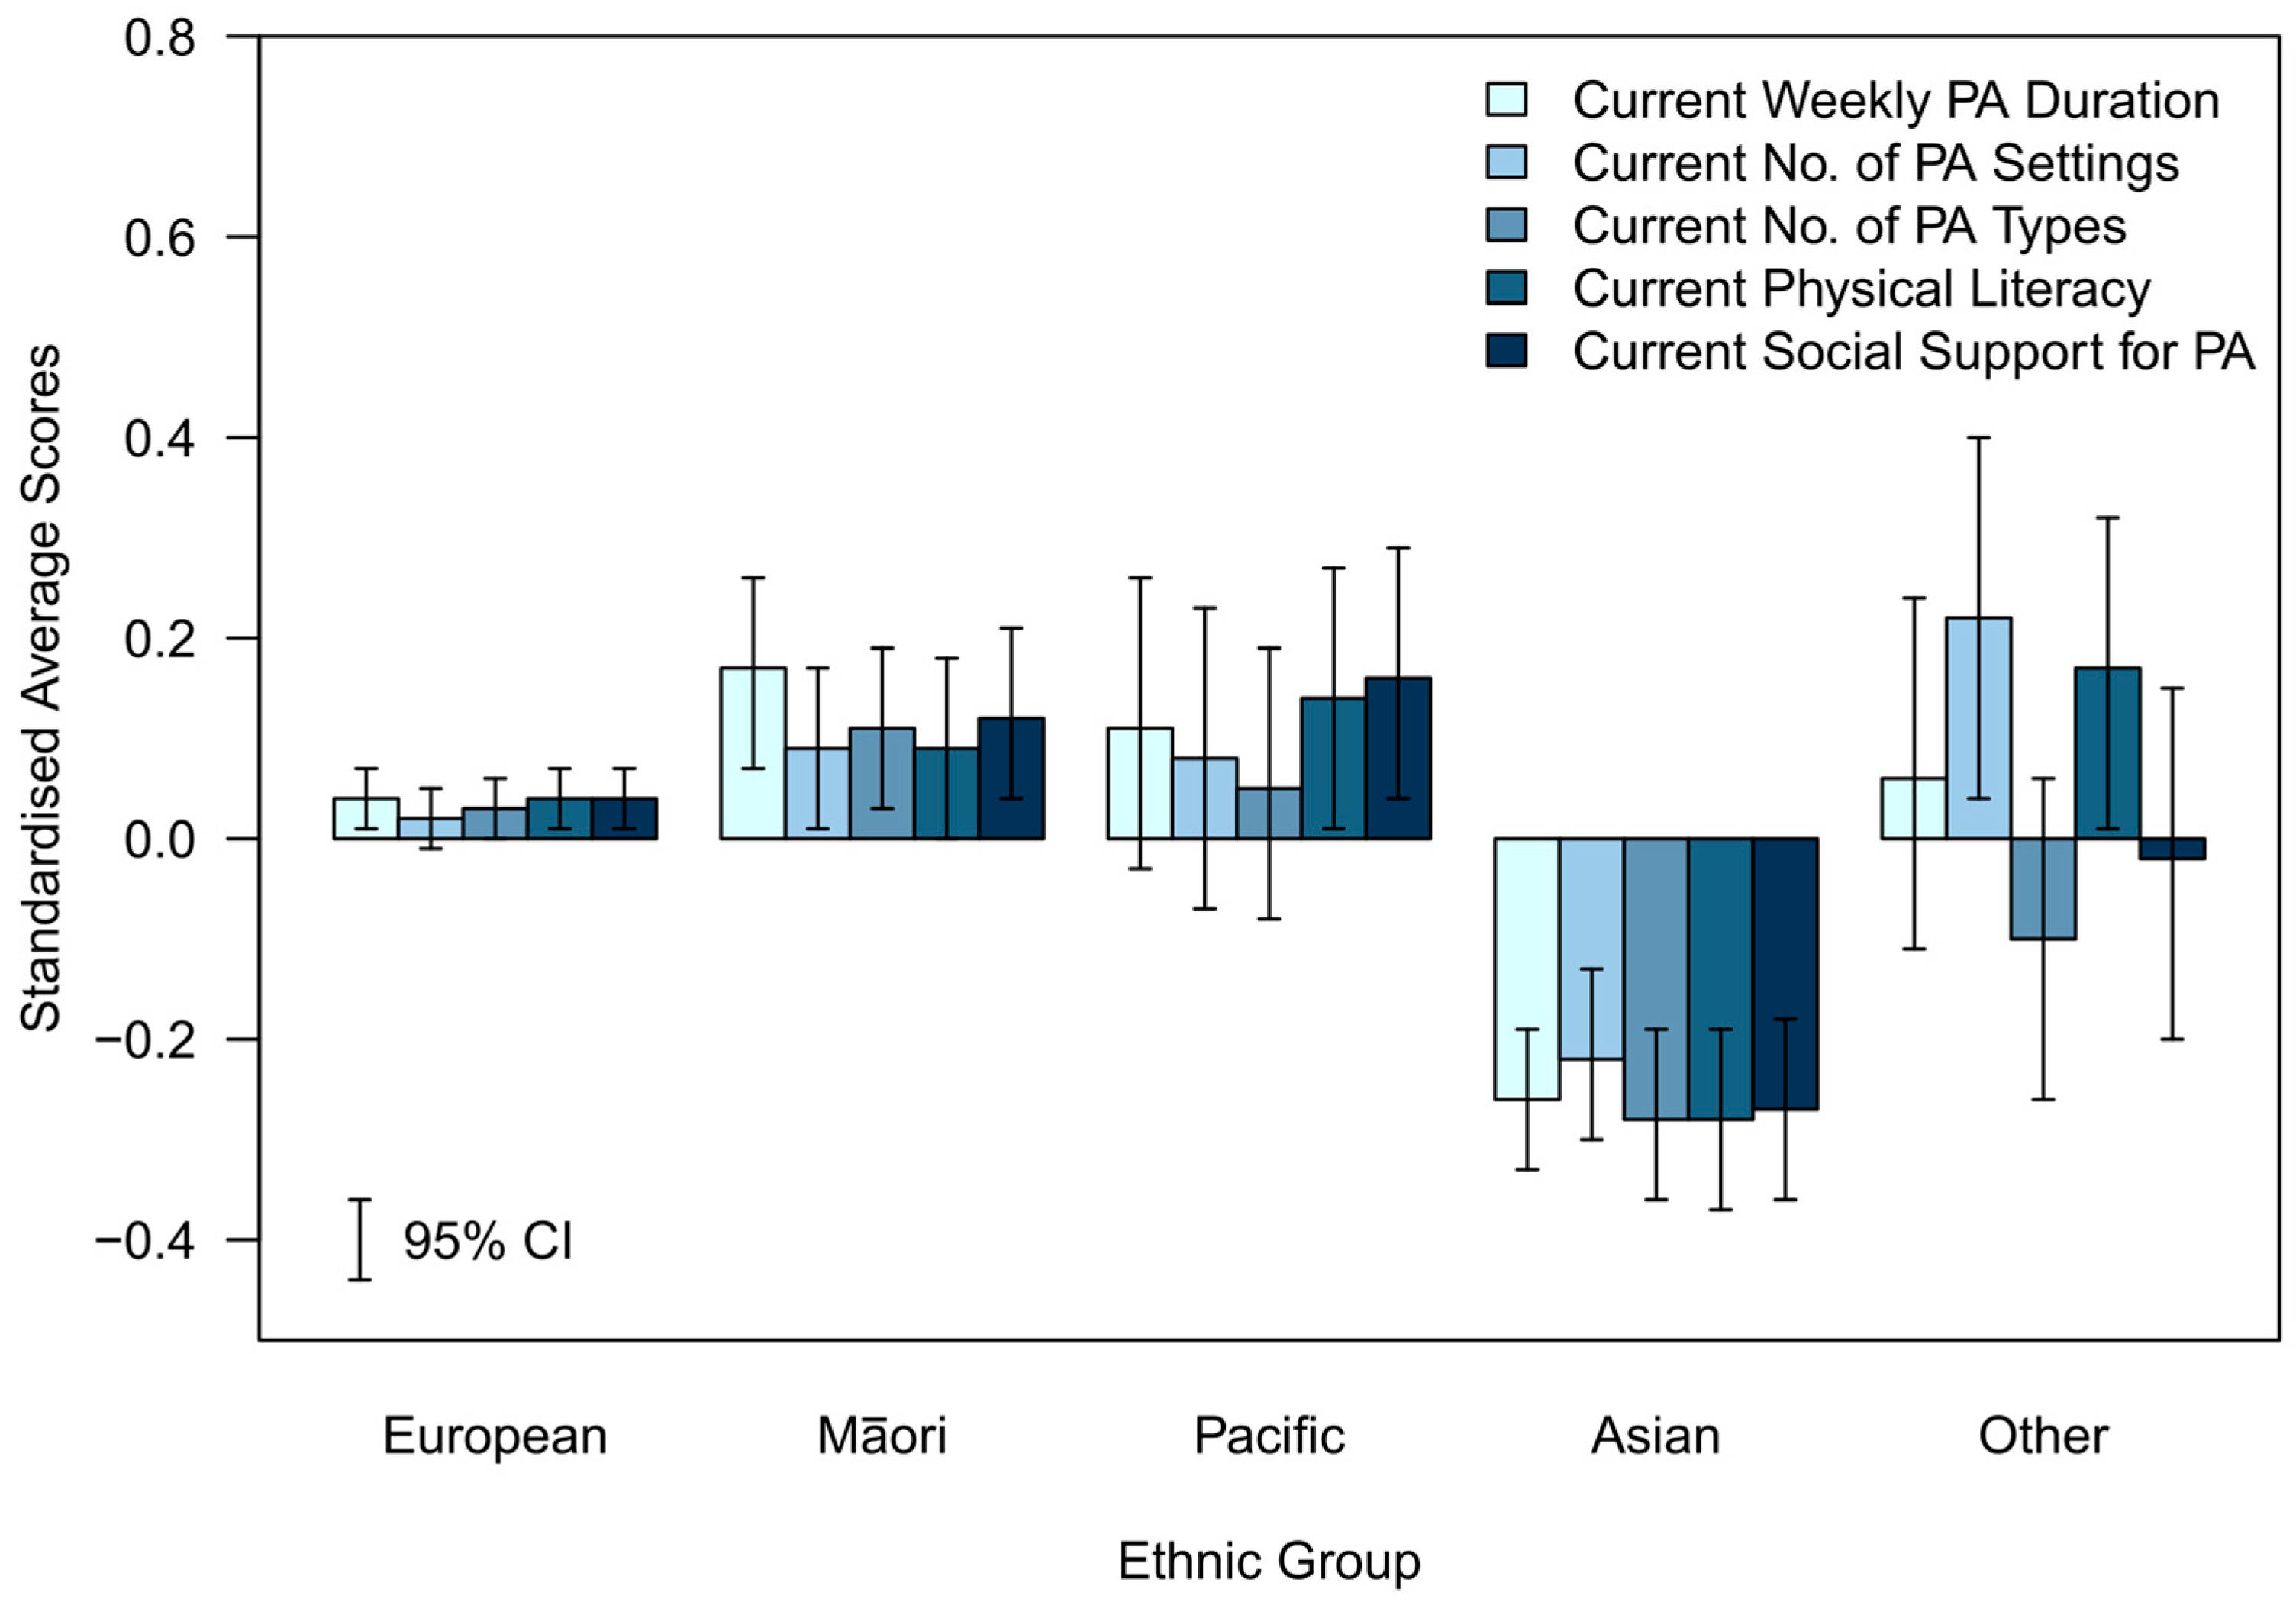
3.2.3. Ethnicity
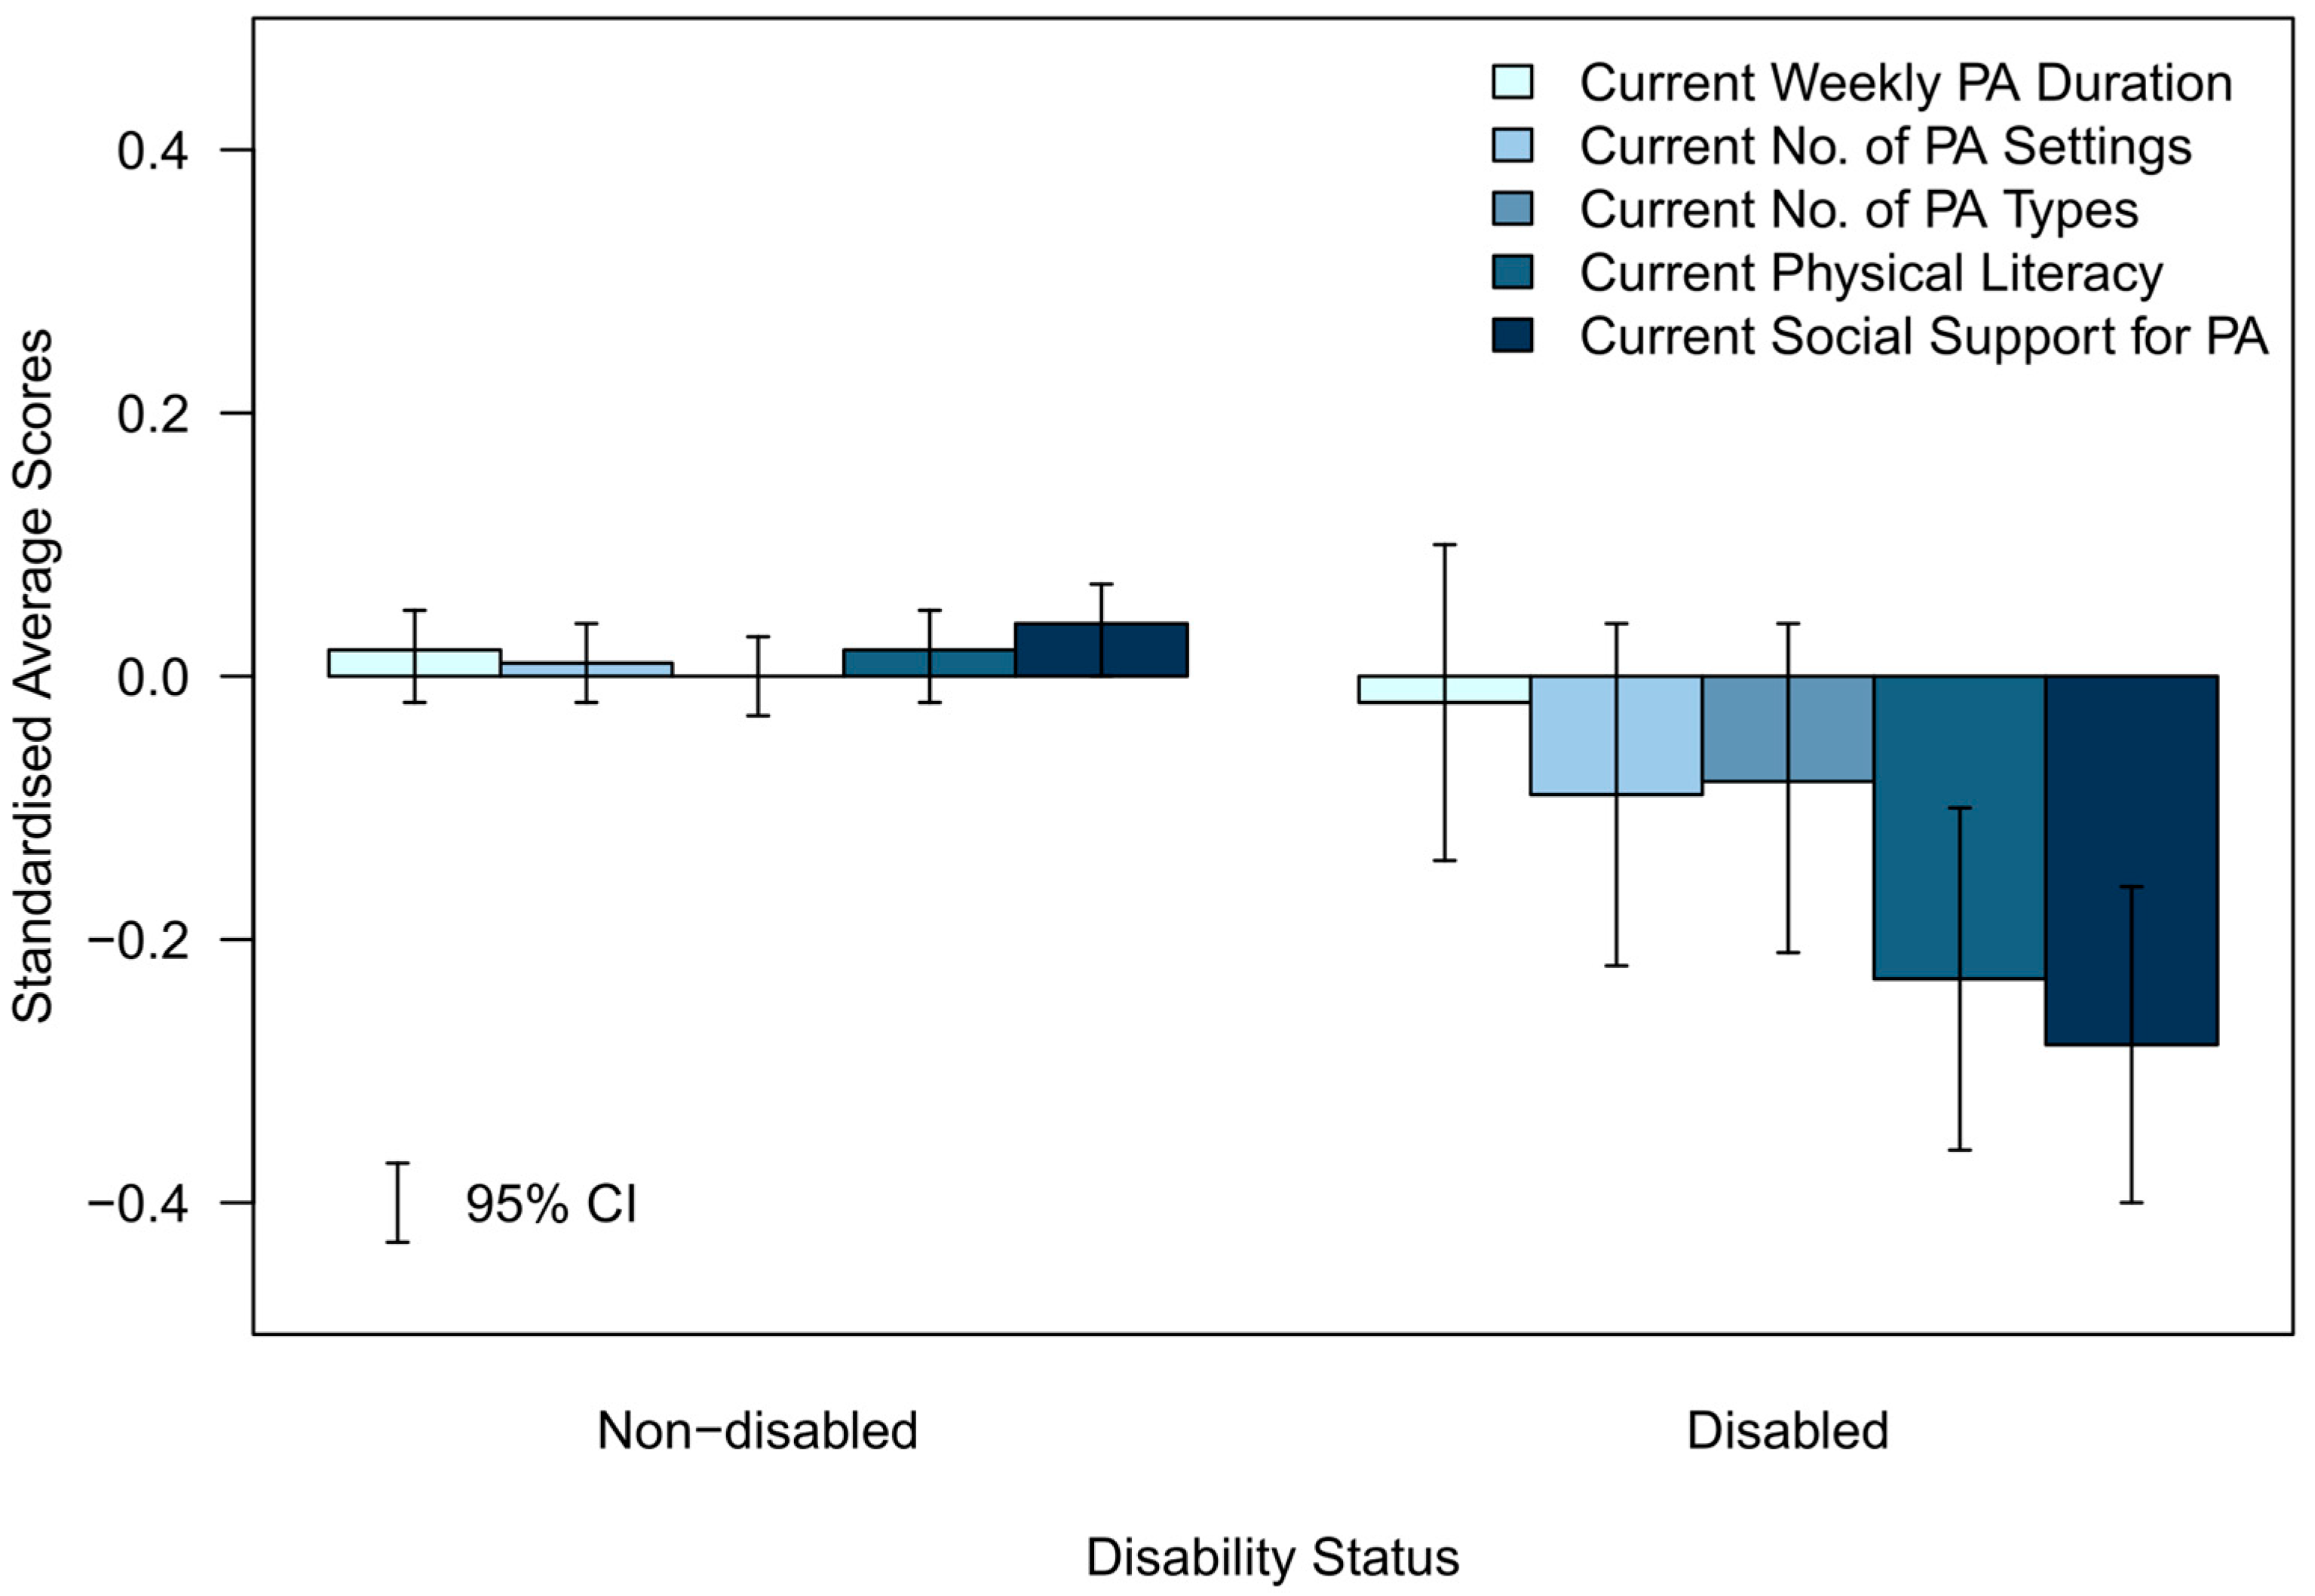
3.2.4. Physical Disability Status
3.2.5. Deprivation
| Sociodemographic Variables | Current PA Participation | Current Physical Literacy | Current Social Support for PA | Current PA Availability Issues | ||
|---|---|---|---|---|---|---|
| Current Weekly PA Duration (Hrs/Week) | Current Number of PA Settings | Current Number of PA Types | ||||
| Average Score (95% CI) | Percentage (95% CI) | |||||
| Overall | 10.8 (10.5, 11.1) | 3.3 (3.2, 3.3) | 5.5 (5.40, 5.6) | 16.6 (16.5, 16.7) | 21.4 (21.3, 21.4) | 58.3 (56.5, 60.0) |
| Missing n (%) | 34 (0.5%) | 258 (3.7%) | 0 (0%) | 957 (13.9%) | 957 (13.9%) | 2144 (31.0%) |
| Age (yrs) | ||||||
| 12 | 13.4 (12.6, 14.3) | 3.6 (3.5, 3.7) | 7.3 (7.0, 7.6) | 17.1 (16.9, 17.3) | 21.9 (21.7, 22.1) | 56.2 (52.2, 60.2) |
| 13 | 12.1 (11.4, 12.9) | 3.5 (3.4, 3.6) | 6.4 (6.2, 6.7) | 16.9 (16.7, 17.1) | 21.8 (21.6, 21.9) | 54.9 (51.0, 58.8) |
| 14 | 10.8 (10.2, 11.5) | 3.4 (3.3, 3.5) | 5.6 (5.4, 5.9) | 16.9 (16.7, 17.1) | 21.4 (21.2, 21.6) | 55.0 (50.7, 59.2) |
| 15 | 9.9 (9.1, 10.6) | 3.1 (3.0, 3.2) | 4.7 (4.4, 4.9) | 16.3 (16.0, 16.5) | 21.1 (20.9, 21.2) | 58.7 (54.5, 62.9) |
| 16 | 8.5 (7.7, 9.4) | 2.9 (2.8, 3.0) | 4.0 (3.7, 4.2) | 16.1 (15.9, 16.4) | 20.7 (20.5, 20.9) | 60.4 (55.8, 64.9) |
| 17 | 7.4 (6.6, 8.2) | 2.6 (2.5, 2.8) | 3.5 (3.2, 3.8) | 16.1 (15.8, 16.4) | 20.8 (20.6, 21.1) | 69.3 (64.3, 74.3) |
| Gender | ||||||
| Male | 11.7 (11.2, 12.2) | 3.3 (3.3, 3.4) | 5.7 (5.5, 5.9) | 16.9 (16.7, 17.0) | 21.6 (21.5, 21.7) | 51.7 (49.1, 54.4) |
| Female | 9.9 (9.5, 10.3) | 3.2 (3.2, 3.3) | 5.4 (5.2, 5.5) | 16.4 (16.3, 16.6) | 21.2 (21.1, 21.3) | 63.6 (61.4, 65.9) |
| Diverse | 8.8 (6.0, 11.7) | 2.9 (2.5, 3.4) | 5.1 (3.9, 6.4) | 14.5 (13.2, 15.8) | 19.2 (18.3, 20.1) | 75.6 (59.0, 92.2) |
| Ethnicity | ||||||
| Māori | 12.4 (11.4, 13.3) | 3.4 (3.3, 3.5) | 6.0 (5.7, 6.3) | 16.9 (16.6, 17.2) | 21.6 (21.4, 21.8) | 55.0 (50.4, 59.6) |
| European | 11.0 (10.7, 11.3) | 3.3 (3.3, 3.4) | 5.7 (5.5, 5.8) | 16.7 (16.7, 16.8) | 21.4 (21.3, 21.5) | 57.8 (56.1, 59.5) |
| Pacific | 11.8 (10.3, 13.3) | 3.4 (3.2, 3.6) | 5.8 (5.2, 6.3) | 17.0 (16.6, 17.4) | 21.7 (21.4, 22.0) | 54.4 (46.7, 62.1) |
| Asian | 8.0 (7.3, 8.7) | 3.0 (2.8, 3.1) | 4.5 (4.1, 4.8) | 15.8 (15.5, 16.1) | 20.6 (20.4, 20.9) | 61.3 (56.3, 66.3) |
| Other | 11.3 (9.5, 13.0) | 3.6 (3.3, 3.9) | 5.2 (4.5, 5.8) | 17.1 (16.7, 17.6) | 21.3 (20.8, 21.7) | 56.1 (46.2, 66.0) |
| Disability | ||||||
| Non-disabled | 10.8 (10.5, 11.1) | 3.3 (3.2, 3.3) | 5.5 (5.4, 5.7) | 16.7 (16.6, 16.8) | 21.4 (21.3, 21.5) | 57.9 (56.1, 59.7) |
| Disabled | 10.4 (9.2, 11.7) | 3.1 (3.0, 3.3) | 5.2 (4.7, 5.7) | 15.9 (15.5, 16.3) | 20.6 (20.3, 20.9) | 64.6 (57.8, 71.4) |
| Deprivation Status | ||||||
| Low (1–3) | 11.0 (10.5, 11.5) | 3.3 (3.3, 3.4) | 5.6 (5.4, 5.8) | 16.9 (16.7, 17.0) | 21.4 (21.3, 21.6) | 55.7 (52.9, 58.4) |
| Mid (4–7) | 10.6 (10.1, 11.2) | 3.3 (3.2, 3.3) | 5.4 (5.2, 5.6) | 16.4 (16.2, 16.6) | 21.2 (21.1, 21.4) | 59.9 (56.8, 62.9) |
| High (8–10) | 10.4 (9.5, 11.3) | 3.3 (3.1, 3.4) | 5.4 (5.1, 5.7) | 16.4 (16.1, 16.7) | 21.3 (21.1, 21.5) | 59.9 (54.8, 64.9) |
3.3. Standardised Differences between Current Determinants of Future PA across Sociodemographic Groups
3.3.1. Age (Standardised)—Figure 1

3.3.2. Gender (Standardised)—Figure 2

3.3.3. Ethnicity (Standardised)—Figure 3

3.3.4. Physical Disability Status (Standardised)—Figure 4

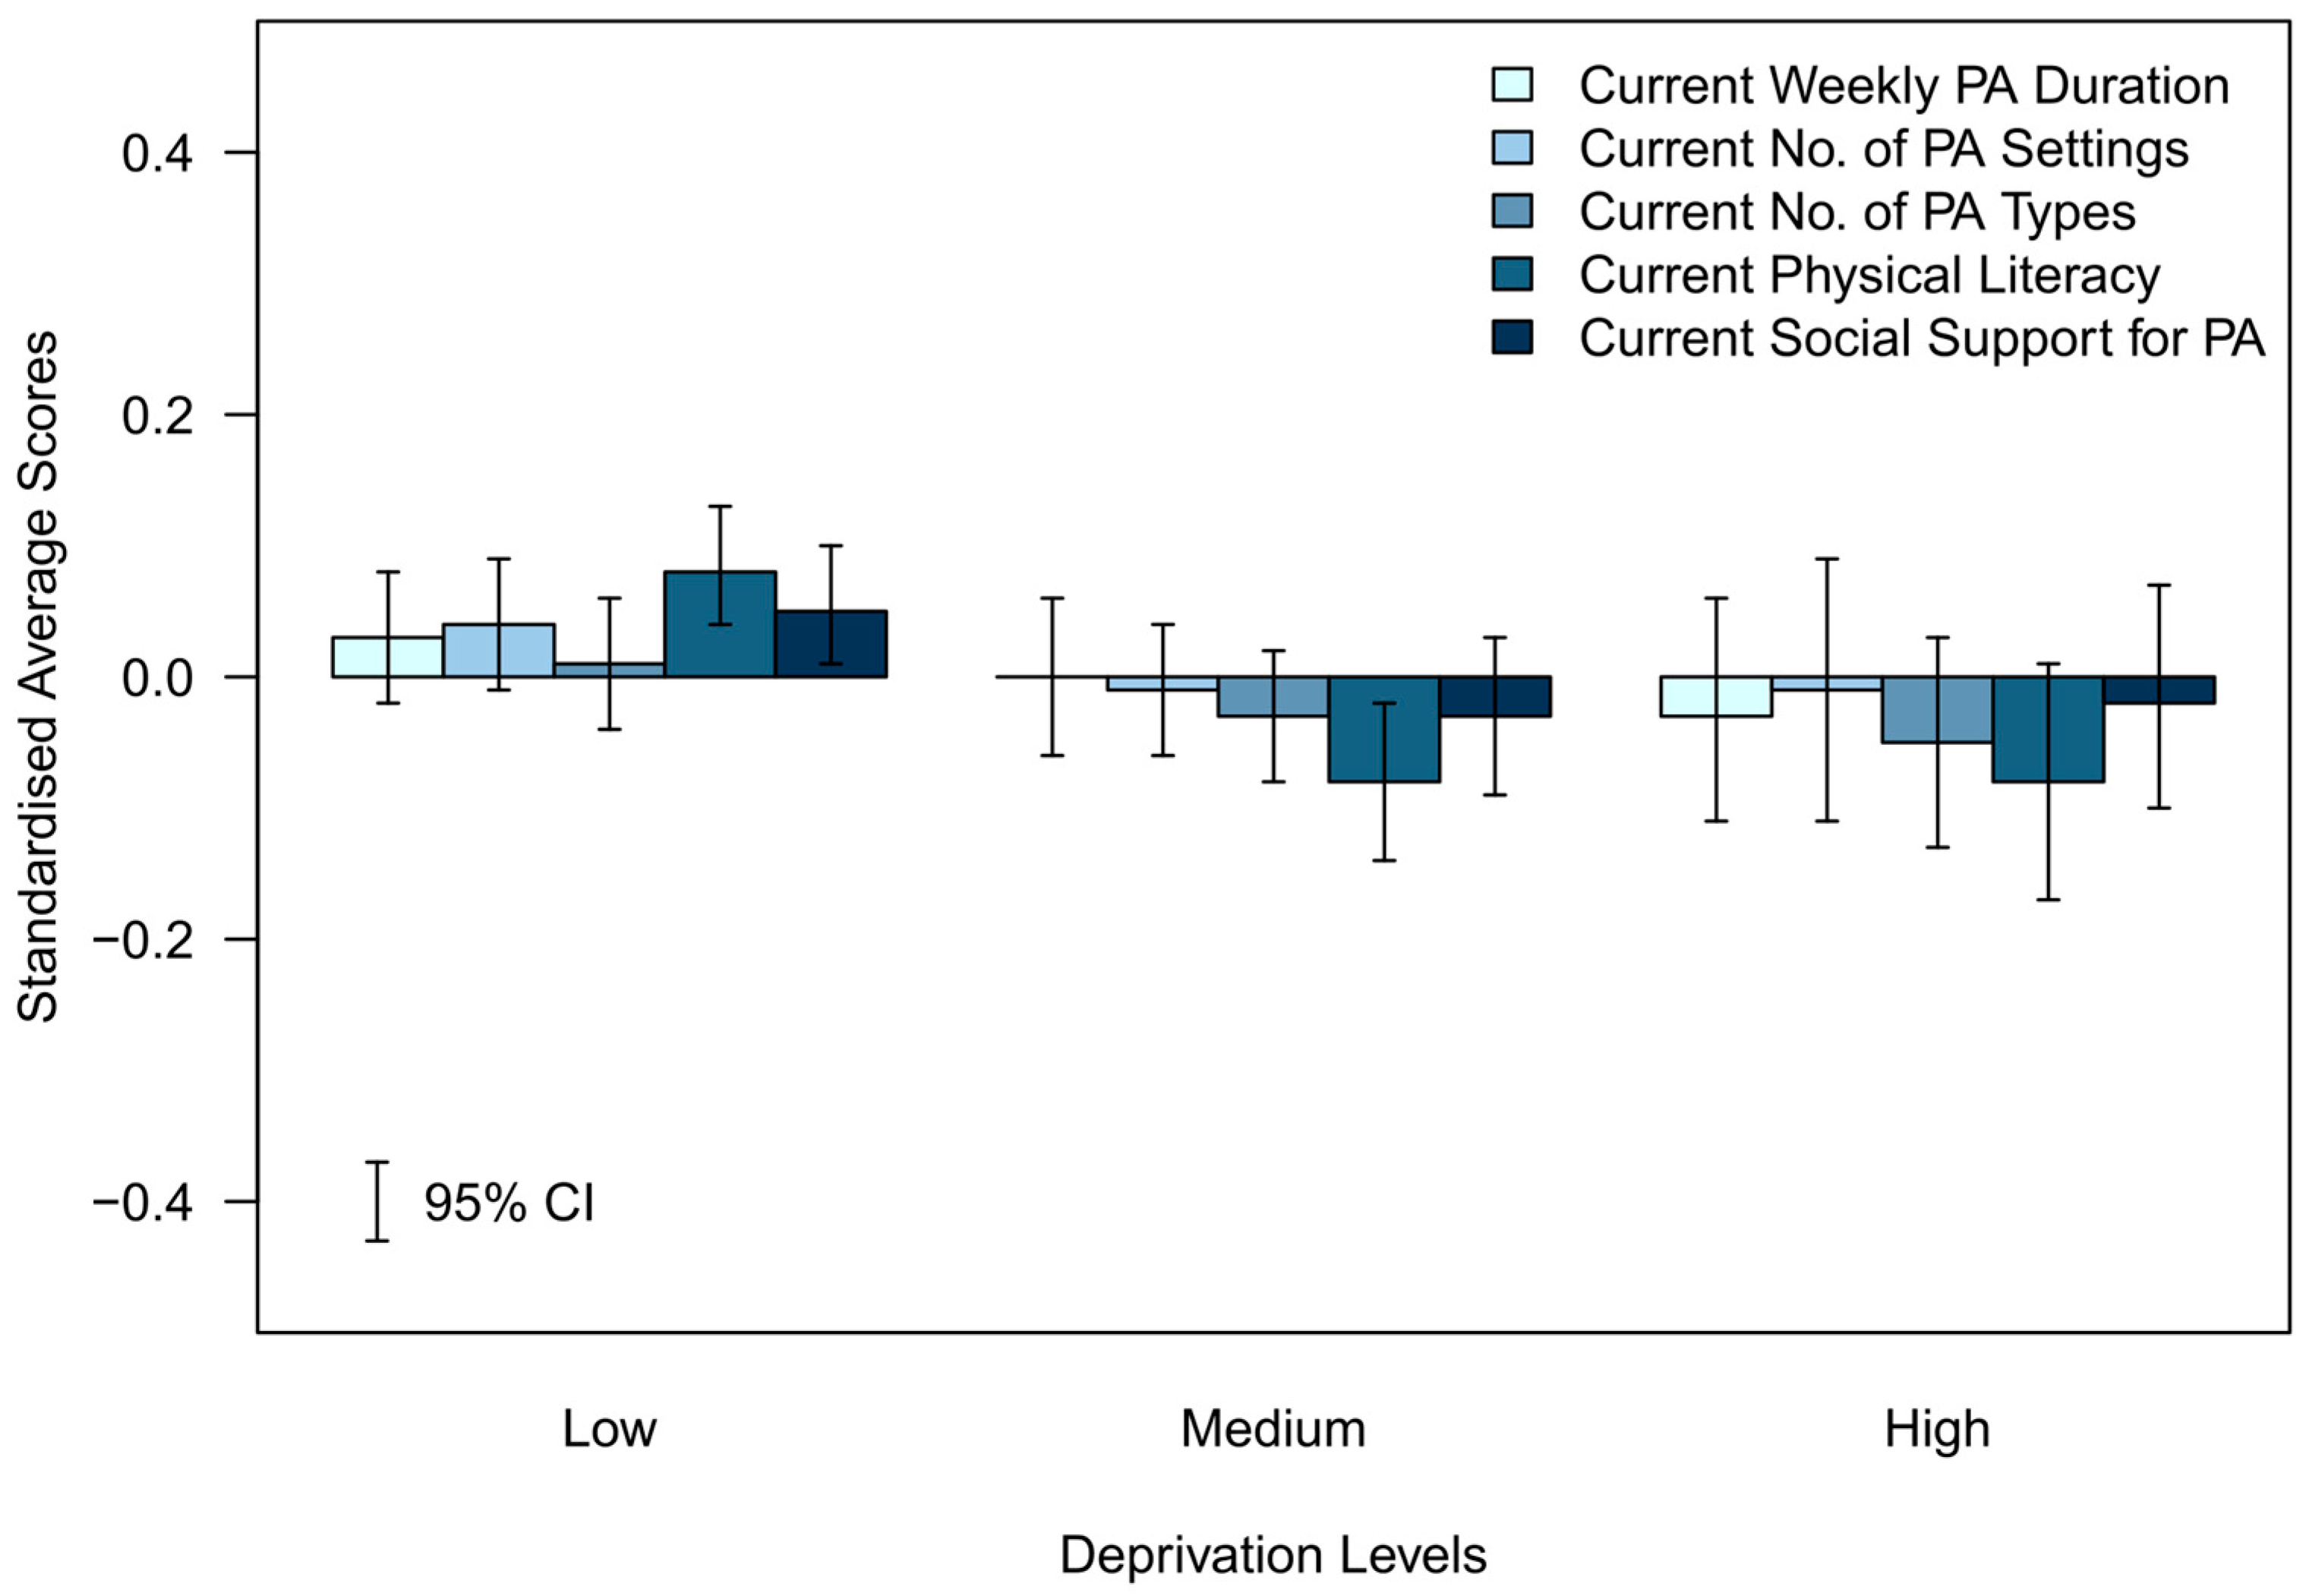
3.3.5. Deprivation (Standardised)—Figure 5

4. Discussion
4.1. Implications
4.2. Limitations
5. Conclusions
Author Contributions
Funding
Institutional Review Board Statement
Informed Consent Statement
Data Availability Statement
Acknowledgments
Conflicts of Interest
Appendix A—Questions Used to Create Current Physical Literacy and Current Social Support Scores
- I am good at lots of different physical activities.
- I want to take part in physical activities.
- I understand why taking part in physical activity is good for me.
- I feel confident to take part in lots of different activities.
- Group 1—Family and peer barriers score: Made from 4 questions relating to respondent’s social support barriers that stem from family and peers.
- (Question 1): My family can’t afford it.
- (Question 2): My parents want me to focus on my schoolwork/other activities.
- (Question 3): My friends aren’t physically active.
- (Question 4): Can’t fit it in with other family member’s activities.
- Group 2—General social barriers score: Made from 4 questions relating to respondent’s social support barriers that stem from other, non-specific people.
- (Question 5): Other people discourage me from being physically active.
- (Question 6): I have no one to do it with.
- (Question 7): I don’t feel welcome.
- (Question 8): I don’t like other people seeing me being physically active.
- Group 3—Social encouragement score:
- (Question 9): People in my life encourage me to take part in physical activities
- Group 4—Social cohesion score:
- (Question 10): I like to do the physical activities that my friends do
- Group 5—Family enjoyment score:
- (Question 11): I like my parents/family to be involved in my sport and physical activities
References
- World Health Organisation. Global Action Plan 2018–2030. Available online: https://apps.who.int/iris/bitstream/handle/10665/272722/9789241514187-eng.pdf (accessed on 2 October 2022).
- Wilson, O.W.A.; Ikeda, E.; Hinckson, E.; Mandic, S.; Richards, J.; Duncan, S.; Kira, G.; Maddison, R.; Meredith-Jones, K.; Chisholm, L.; et al. Results from Aotearoa New Zealand’s 2022 Report Card on Physical Activity for Children and Youth: A Call to Address Inequities in Health-Promoting Activities. J. Exerc. Sci. Fit. 2022, 21, 58–66. [Google Scholar] [CrossRef]
- Viner, R.M.; Ozer, E.M.; Denny, S.; Marmot, M.; Resnick, M.; Fatusi, A.; Currie, C. Adolescence and the Social Determinants of Health. Lancet 2012, 379, 1641–1652. [Google Scholar] [CrossRef] [PubMed]
- Wilson, O.W.A.; Whatman, C.; Walters, S.; Keung, S.; Enari, D.; Rogers, A.; Millar, S.K.; Ferkins, L.; Hinckson, E.; Hapeta, J.; et al. The Value of Sport: Wellbeing Benefits of Sport Participation during Adolescence. Int. J. Environ. Res. Public Health 2022, 19, 8579. [Google Scholar] [CrossRef] [PubMed]
- Lee, J.E.; Pope, Z.; Gao, Z. The Role of Youth Sports in Promoting Children’s Physical Activity and Preventing Pediatric Obesity: A Systematic Review. Behav. Med. 2018, 44, 62–76. [Google Scholar] [CrossRef] [PubMed]
- Biddle, S.J.H.; Ciaccioni, S.; Thomas, G.; Vergeer, I. Physical Activity and Mental Health in Children and Adolescents: An Updated Review of Reviews and an Analysis of Causality. Psychol. Sport Exerc. 2019, 42, 146–155. [Google Scholar] [CrossRef]
- Dahlberg, E.E.; Hamilton, S.J.; Hamid, F.; Thompson, S.C. Indigenous Australians Perceptions’ of Physical Activity: A Qualitative Systematic Review. Int. J. Environ. Res. Public Health 2018, 15, 1492. [Google Scholar] [CrossRef]
- Clemente-Suárez, V.J.; Beltrán-Velasco, A.I.; Ramos-Campo, D.J.; Mielgo-Ayuso, J.; Nikolaidis, P.A.; Belando, N.; Tornero-Aguilera, J.F. Physical Activity and COVID-19. The Basis for an Efficient Intervention in Times of COVID-19 Pandemic. Physiol. Behav. 2022, 244, 113667. [Google Scholar] [CrossRef]
- Reis, R.S.; Salvo, D.; Ogilvie, D.; Lambert, E.V.; Goenka, S.; Brownson, R.C. Scaling up Physical Activity Interventions Worldwide: Stepping up to Larger and Smarter Approaches to Get People Moving. Lancet 2016, 388, 1337–1348. [Google Scholar] [CrossRef]
- Brown, H.E.; Corder, K.; Atkin, A.J.; van Sluijs, E.M.F. Childhood Predictors of Adolescent Behaviour: The Prospective Association of Familial Factors with Meeting Physical Activity Guidelines. Prev. Med. Rep. 2017, 6, 221–227. [Google Scholar] [CrossRef]
- Green, K.; Smith, A.; Roberts, K. Young People and Lifelong Participation in Sport and Physical Activity: A Sociological Perspective on Contemporary Physical Education Programmes in England and Wales. Leis. Stud. 2005, 24, 27–43. [Google Scholar] [CrossRef]
- Best, K.; Ball, K.; Zarnowiecki, D.; Stanley, R.; Dollman, J. In Search of Consistent Predictors of Children’s Physical Activity. Int. J. Environ. Res. Public Health 2017, 14, 1258. [Google Scholar] [CrossRef] [PubMed]
- Zhang, M.; Wang, X.-C.; Shao, B. Predictors of Persistent Participation in Youth Sport: A Systematic Review and Meta-Analysis. Front. Psychol. 2022, 13, 1–10. [Google Scholar] [CrossRef] [PubMed]
- Ikeda, E.; Guagliano, J.M.; Atkin, A.J.; Sherar, L.B.; Ekelund, U.; Hansen, B. Cross Sectional and Longitudinal Associations of Active Travel, Organised Sport and Physical Education with Accelerometer Assessed Moderate to Vigorous Physical Activity in Young People: The International Children ’s Accelerometry Database. Int. J. Behav. Nutr. Phys. Act. 2022, 19, 41. [Google Scholar] [CrossRef] [PubMed]
- Palomäki, S.; Hirvensalo, M.; Smith, K.; Raitakari, O.; Männistö, S.; Hutri-Kähönen, N.; Tammelin, T. Does Organized Sport Participation during Youth Predict Healthy Habits in Adulthood? A 28-Year Longitudinal Study. Scand. J. Med. Sci. Sport. 2018, 28, 1908–1915. [Google Scholar] [CrossRef]
- Kjønniksen, L.; Anderssen, N.; Wold, B. Organized Youth Sport as a Predictor of Physical Activity in Adulthood. Scand. J. Med. Sci. Sport. 2009, 19, 646–654. [Google Scholar] [CrossRef]
- Huotari, P.; Nupponen, H.; Mikkelsson, L.; Laakso, L.; Kujala, U. Adolescent Physical Fitness and Activity as Predictors of Adulthood Activity. J. Sports Sci. 2011, 29, 1135–1141. [Google Scholar] [CrossRef]
- Eime, R.M.; Harvey, J.T.; Sawyer, N.A.; Craike, M.J.; Symons, C.M.; Payne, W.R. Changes in Sport and Physical Activity Participation for Adolescent Females: A Longitudinal Study. BMC Public Health 2016, 16, 533. [Google Scholar] [CrossRef]
- Sylvester, B.D.; Gilchrist, J.D.; O’Loughlin, J.; Sabiston, C.M. Sampling Sports during Adolescence, Exercise Behaviour in Adulthood, and the Mediating Role of Perceived Variety in Exercise. Psychol. Health 2020, 35, 1368–1383. [Google Scholar] [CrossRef]
- Sallis, J.F.; Owen, N.; Fisher, E.B. Ecological Models of Health Behavior. In Health Behavior and Health Education: Theory, Research, and Practice, 4th ed.; Jossey-Bass: San Francisco, CA, USA, 2008; pp. 465–485. ISBN 978-0-7879-9614-7. (Hardcover). [Google Scholar]
- Bailey, R. Defining Physical Literacy: Making Sense of a Promiscuous Concept. Sport Soc. 2021, 25, 163–180. [Google Scholar] [CrossRef]
- Edwards, L.C.; Bryant, A.S.; Keegan, R.J.; Morgan, K.; Cooper, S.M.; Jones, A.M. ‘Measuring’ Physical Literacy and Related Constructs: A Systematic Review of Empirical Findings. Sport. Med. 2018, 48, 659–682. [Google Scholar] [CrossRef]
- Zook, K.R.; Saksvig, B.I.; Wu, T.T.; Young, D.R. Physical Activity Trajectories and Multilevel Factors among Adolescent Girls. J. Adolesc. Health 2014, 54, 74–80. [Google Scholar] [CrossRef] [PubMed]
- Weiss, M.R. Motivating Kids in Physical Activity. Pres. Counc. Phys. Fit. Sports Res. Dig. 2000. Available online: https://ess220.files.wordpress.com/2008/02/weiss-2000-motkids.pdf (accessed on 2 October 2022).
- Scott, M.M.; Evenson, K.R.; Cohen, D.A.; Cox, C.E. Comparing Perceived and Objectively Measured Access to Recreational Facilities as Predictors of Physical Activity in Adolescent Girls. J. Urban Health 2007, 84, 346–359. [Google Scholar] [CrossRef]
- Sport New Zealand Ihi Aotearoa. Active NZ and Active NZ Young People Technical Report for Data Collected in 2019. Available online: https://sportnz.org.nz/media/3587/201027-year-3-2019-technical-report.pdf (accessed on 2 October 2022).
- Sport New Zealand Ihi Aotearoa. Active NZ and Active NZ Young People Technical Report for Data Collected in 2018. Available online: https://sportnz.org.nz/media/1468/active-nz-technical-report-2018.pdf (accessed on 2 October 2022).
- Sport New Zealand Ihi Aotearoa. Active NZ and Active NZ Young People Technical Report for Data Collected in 2017. Available online: https://sportnz.org.nz/media/1512/active-nz-2017-technical-report.pdf (accessed on 2 October 2022).
- Atkinson, J.; Salmond, C.; Crampton, P. NZDep2018 Index of Deprivation, Final Research Report; University of Otago: Dunedin, New Zealand, 2019; Volume 5541. [Google Scholar]
- Lumley, T. Analysis of Complex Survey Samples. Available online: https://cran.r-project.org/web/packages/survey/survey.pdf (accessed on 15 January 2023).
- Bélanger, M.; Casey, M.; Cormier, M.; Laflamme Filion, A.; Martin, G.; Aubut, S.; Chouinard, P.; Savoie, S.P.; Beauchamp, J. Maintenance and Decline of Physical Activity during Adolescence: Insights from a Qualitative Study. Int. J. Behav. Nutr. Phys. Act. 2011, 8, 117. [Google Scholar] [CrossRef] [PubMed]
- Aaron, D.J.; Storti, K.L.; Robertson, R.J.; Kriska, A.M.; LaPorte, R.E. Longitudinal Study of the Number and Choice of Leisure Time Physical Activities from Mid to Late Adolescence: Implications for School Curricula and Community Recreation Programs. Arch. Pediatr. Adolesc. Med. 2002, 156, 1075–1080. [Google Scholar] [CrossRef]
- Christie, D.; Viner, R. Adolescent Development. BMJ 2005, 330, 2003–2006. [Google Scholar] [CrossRef]
- Mizdrak, A.; Shaw, C.; Lynch, B.; Richards, J. The Potential of School-Based Physical Education to Increase Physical Activity in Aotearoa New Zealand Children and Young People: A Modelling Study. N. Z. Med. J. 2021, 134, 23–35. [Google Scholar]
- Gísladóttir, T.L.; Matthíasdóttir, Á.; Kristjánsdóttir, H. The Effect of Adolescents’ Sports Clubs Participation on Self-Reported Mental and Physical Conditions and Future Expectations. J. Sports Sci. 2013, 31, 1139–1145. [Google Scholar] [CrossRef]
- Sport NZ Active NZ Survey. Available online: https://sportnz.org.nz/media/3639/active-nz-year-3-main-report-final.pdf (accessed on 2 October 2022).
- Sport NZ Women and Girls Strategy. Available online: https://sportnz.org.nz/media/1549/women-and-girls-govt-strategy.pdf (accessed on 2 October 2022).
- Storr, R.; Nicholas, L.; Robinson, K.; Davies, C. ‘Game to Play?’: Barriers and Facilitators to Sexuality and Gender Diverse Young People’s Participation in Sport and Physical Activity. Sport. Educ. Soc. 2022, 27, 604–617. [Google Scholar] [CrossRef]
- Symons, C.; Sbaraglia, M.; Hillier, L.; Mitchell, A. Come to Play. The Sports Experiences of Lesbian, Gay, Bisexual and Transgender (LGBT) People in Victoria; Victoria University: Footscray, Australia, 2010; ISBN 9781921377860. [Google Scholar]
- Ross, J.; Hamlin, M. Māori Physical Activity: A Review of an Indigenous Population’s Participation. Health Promot. J. Aust. 2007, 18, 73–76. [Google Scholar] [CrossRef]
- Littlewood, R.; Canfell, O.J.; Walker, J.L. Interventions to Prevent or Treat Childhood Obesity in Māori & Pacific Islanders: A Systematic Review. BMC Public Health 2020, 20, 725. [Google Scholar] [CrossRef]
- Look, M.A.; Batti-Trask, M.K.; Agres, R.; Mau, M.L.K.J. Assessment and Priorities for Health & Well-Being in Native Hawaiians & Other Pacific Peoples; University of Hawaii: Honolulu, HI, USA, 2013. [Google Scholar]
- Liu, T.; Liu, L.S. Transnational Physical Activity and Sport Engagement of New Asian Migrants in Aotearoa/New Zealand. Asia Pac. Viewp. 2022, 63, 306–312. [Google Scholar] [CrossRef]
- Zhu, X.; Haegele, J.A.; Liu, H.; Yu, F. Academic Stress, Physical Activity, Sleep, and Mental Health among Chinese Adolescents. Int. J. Environ. Res. Public Health 2021, 18, 7257. [Google Scholar] [CrossRef] [PubMed]
- Dogra, S.; Meisner, B.A.; Ardern, C.I. Variation in Mode of Physical Activity by Ethnicity and Time since Immigration: A Cross-Sectional Analysis. Int. J. Behav. Nutr. Phys. Act. 2010, 7, 75. [Google Scholar] [CrossRef] [PubMed]
- Powell, L.M.; Slater, S.; Chaloupka, F.J. The Relationship between Community Physical Activity Settings and Race, Ethnicity and Socioeconomic Status. Evid. Based Prev. Med. 2004, 1, 135–144. [Google Scholar]
- Anastasiou, D.; Kauffman, J.M. The Social Model of Disability: Dichotomy between Impairment and Disability. J. Med. Philos. 2013, 38, 441–459. [Google Scholar] [CrossRef]
- Murray, S.; Loveless, R. Disability, the Living Standards Framework and Wellbeing. Policy Q. 2021, 17, 1. [Google Scholar] [CrossRef]
- Mulligan, H. Health and Well Being for People with Disability: The Role of Physiotherapists in Promoting Physical Activity. New Zealand J. Physiother. 2011, 39, 39–46. [Google Scholar]
- Rimmer, J.H.; Gray-Stanley, J.A. Physical Activity for People with a Disability. DeLisa’s Phys. Med. Rehabil. Princ. Pract. Fifth Ed. 2012, 2, 1435–1456. [Google Scholar] [CrossRef]
- Antshel, K.M.; Anderman, E.M. Social Influences on Sports Participation during Adolescence. J. Res. Dev. Educ. 2000, 33, 85–94. [Google Scholar]
- Mandic, S.; Leon de la Barra, S.; García Bengoechea, E.; Stevens, E.; Flaherty, C.; Moore, A.; Middlemiss, M.; Williams, J.; Skidmore, P. Personal, Social and Environmental Correlates of Active Transport to School among Adolescents in Otago, New Zealand. J. Sci. Med. Sport 2015, 18, 432–437. [Google Scholar] [CrossRef] [PubMed]
- Young, L.; O’Connor, J.; Alfrey, L. Physical Literacy: A Concept Analysis. Sport. Educ. Soc. 2020, 25, 946–959. [Google Scholar] [CrossRef]
- Hankonen, N.; Heino, M.T.J.; Kujala, E.; Hynynen, S.T.; Absetz, P.; Araújo-Soares, V.; Borodulin, K.; Haukkala, A. What Explains the Socioeconomic Status Gap in Activity? Educational Differences in Determinants of Physical Activity and Screentime. BMC Public Health 2017, 17, 144. [Google Scholar] [CrossRef] [PubMed]
- Stalsberg, R.; Pedersen, A.V. Effects of Socioeconomic Status on the Physical Activity in Adolescents: A Systematic Review of the Evidence. Scand. J. Med. Sci. Sport. 2010, 20, 368–383. [Google Scholar] [CrossRef] [PubMed]
- McGowan, V.J.; Buckner, S.; Mead, R.; McGill, E.; Ronzi, S.; Beyer, F.; Bambra, C. Examining the Effectiveness of Place-Based Interventions to Improve Public Health and Reduce Health Inequalities: An Umbrella Review. BMC Public Health 2021, 21, 1888. [Google Scholar] [CrossRef] [PubMed]
- Heath, G.W.; Parra, D.C.; Sarmiento, O.L.; Andersen, L.B.; Owen, N.; Goenka, S.; Montes, F.; Brownson, R.C.; Alkandari, J.R.; Bauman, A.E.; et al. Evidence-Based Intervention in Physical Activity: Lessons from around the World. Lancet 2012, 380, 272–281. [Google Scholar] [CrossRef]
- Ministry of Health New Zealand Health Survey Key Results. Available online: https://www.health.govt.nz/publication/annual-update-key-results-2020-21-new-zealand-health-survey (accessed on 2 October 2022).
- Moewaka Barnes, H.; McCreanor, T. Colonisation, Hauora and Whenua in Aotearoa. J. R. Soc. New Zealand 2019, 49, 19–33. [Google Scholar] [CrossRef]
- Rangi, T.M. Tūpuna Kori Tinana: An Ancestral Māori Approach to Physical Activity. Ph.D. Thesis, Auckland University of Technology, Auckland, New Zealand, 2021. [Google Scholar]
- Hearst, M.O.; Patnode, C.D.; Sirard, J.R.; Farbakhsh, K.; Lytle, L.A. Multilevel Predictors of Adolescent Physical Activity: A Longitudinal Analysis. Int. J. Behav. Nutr. Phys. Act. 2012, 9, 8. [Google Scholar] [CrossRef]
- Burns, R.D.; Fu, Y.; Podlog, L.W. School-Based Physical Activity Interventions and Physical Activity Enjoyment: A Meta-Analysis. Prev. Med. 2017, 103, 84–90. [Google Scholar] [CrossRef]
- Hale, G.E.; Colquhoun, L.; Lancastle, D.; Lewis, N.; Tyson, P.J. Physical Activity Interventions for the Mental Health and Well-being of Adolescents–a Systematic Review. Child Adolesc. Ment. Health 2021, 26, 357–368. [Google Scholar] [CrossRef]
- Sport NZ Sport New Zealand Outcomes Framework. Available online: https://sportnz.org.nz/media/1144/sport-nz-outcomes-framework2.pdf (accessed on 2 October 2022).
- Van Woudenberg, T.J.; Bevelander, K.E.; Burk, W.J.; Buijzen, M. The Reciprocal Effects of Physical Activity and Happiness in Adolescents. Int. J. Behav. Nutr. Phys. Act. 2020, 17, 147. [Google Scholar] [CrossRef] [PubMed]
Disclaimer/Publisher’s Note: The statements, opinions and data contained in all publications are solely those of the individual author(s) and contributor(s) and not of MDPI and/or the editor(s). MDPI and/or the editor(s) disclaim responsibility for any injury to people or property resulting from any ideas, methods, instructions or products referred to in the content. |
© 2023 by the authors. Licensee MDPI, Basel, Switzerland. This article is an open access article distributed under the terms and conditions of the Creative Commons Attribution (CC BY) license (https://creativecommons.org/licenses/by/4.0/).
Share and Cite
Bergen, T.; Kim, A.H.M.; Mizdrak, A.; Signal, L.; Kira, G.; Richards, J. Determinants of Future Physical Activity Participation in New Zealand Adolescents across Sociodemographic Groups: A Descriptive Study. Int. J. Environ. Res. Public Health 2023, 20, 6001. https://0-doi-org.brum.beds.ac.uk/10.3390/ijerph20116001
Bergen T, Kim AHM, Mizdrak A, Signal L, Kira G, Richards J. Determinants of Future Physical Activity Participation in New Zealand Adolescents across Sociodemographic Groups: A Descriptive Study. International Journal of Environmental Research and Public Health. 2023; 20(11):6001. https://0-doi-org.brum.beds.ac.uk/10.3390/ijerph20116001
Chicago/Turabian StyleBergen, Tom, Alice Hyun Min Kim, Anja Mizdrak, Louise Signal, Geoff Kira, and Justin Richards. 2023. "Determinants of Future Physical Activity Participation in New Zealand Adolescents across Sociodemographic Groups: A Descriptive Study" International Journal of Environmental Research and Public Health 20, no. 11: 6001. https://0-doi-org.brum.beds.ac.uk/10.3390/ijerph20116001