

Investor Sentiment Index: A Systematic Review

1
Department of Finance and Accounting, Indian Institute of Management Bodh Gaya, Bodh Gaya 824234, India
2
Amrut Mody School of Management, Ahmedabad University, Ahmedabad 380009, India
3
Goa Institute of Management, Goa 403505, India
*
Author to whom correspondence should be addressed.
Int. J. Financial Stud. 2023, 11(1), 6; https://0-doi-org.brum.beds.ac.uk/10.3390/ijfs11010006
Submission received: 4 November 2022
/
Revised: 6 December 2022
/
Accepted: 13 December 2022
/
Published: 23 December 2022
(This article belongs to the Special Issue Financial Contagion)
Abstract
:The Investor Sentiment Index (ISI) is widely regarded as a useful measure to gauge the overall mood of the market. Investor panic may result in contagion, causing failure in financial markets. Market participants widely use the ISI indicator to understand price fluctuations and related opportunities. As a result, it is imperative to systematically review the compiled literature on the subject. In addition to reviewing past studies on the ISI, this paper attempts a bibliometric analysis (BA) to understand any related publications. We systematically review over 100 articles and carry out a BA on a set of information based on the publication year, the journal, the countries/territories, the deployed statistical tools and techniques, a citation analysis, and a content analysis. This analysis further strengthens the study by establishing interesting findings. Most articles use the Baker and Wurgler index and text-based sentiment analysis. However, an Internet-search-based ISI was also used in a few of the studies. The results reveal the lack of direct measures or a robust qualitative approach in constructing the ISI. The findings further indicate a vast research gap in emerging economies, such as India’s. This study had no limit on the period for inclusion and exclusion. We believe that our current work is a seminal study, jointly involving a systematic literature review and BA, that will enormously facilitate academicians and practitioners working on the ISI.
1. Introduction
Over the past two decades, sentiment analysis in finance has been studied. Researchers have used sentiment analysis to develop an investor sentiment index (ISI) that reveals the market’s mood. The sentiment may take a high or low value. Many studies have constructed ISIs in the past, but most have taken an empirical approach to examine the validity of the ISIs with different proxies in the context of different countries/territories. One widely used ISI is the Baker and Wurgler composite investor sentiment index (BW index), which is based on quantitative market data. In addition, Internet searches and social media posts have been analyzed to construct ISIs (Goel and Dash 2022; Obaid and Pukthuanthong 2022; Y. Sun et al. 2021). Although there are several methods for constructing an ISI, they are only valid in some countries/territories.
As indicated by Internet searches and online social media posts, the ISI has become more relevant in recent times due to growing access to the Internet, which allows expression of opinions and leads to discussions. The current pandemic has impacted the stock market, which was also influenced by people’s sentiments (as revealed by Internet searches) (Smales 2021). Many studies have focused on constructing an ISI in different contexts. These studies have provided the scope to display the different ISI construction methodologies in one place.
Investor sentiment is the overall attitude of investors toward a particular event or information. The investors’ feelings or tone influence market activity and prices. Usually, an increase in prices is called a bullish sentiment and a decreasing trend in prices is known as a bearish sentiment. Moreover, in terms of sentiment, low sentiment refers to the time when prices decrease and high sentiment refers to the time when prices increase.
Research on the ISI started after the work of Baker and Wurgler during the first decade of the 21st century. Subsequently, finance researchers, including Da et al. (2015), Huang et al. (2015), and Tetlock (2007), constructed ISIs following different methodologies. An ISI can be measured in two ways: direct and indirect (for further sentiment classification techniques, see Ghallab et al. 2020; and Bhardwaj et al. 2015). In the direct measurement of an ISI, the primary data are mainly collected from investors through a questionnaire. Market-specific, firm-specific, and investor-specific data in the indirect sentiment index are used to proxy the ISI. In contrast, Baker and Wurgler used an indirect measurement of an ISI to construct a composite ISI for investors in the US.
The extensive literature on ISIs is long-standing. Recent review studies on investor sentiment indices focused on specific areas of the literature and were not exhaustive. Ghallab et al. (2020) attempted to review the studies on Arabic investor sentiment. Garg and Tiwari (2021) summarized the studies on investor sentiment, which looked at stock market predictions based on social media sentiment. To date, no studies have reviewed the investor sentiment indices in depth. Therefore, there is a research gap, which we have attempted to fill by conducting a systematic literature review.
In this study, we attempted to conduct a systematic literature review (SLR) and a bibliometric analysis (BA) on ISIs to establish an exhaustive review of the past literature on the development of ISIs. In addition, this study identifies the findings of past studies and reveals future research gaps. However, this study does not consider the previous studies on sentiment analysis conducted in any specific domain. The study attempts to answer several research questions: What methodologies, tools, and techniques are used to construct an ISI? What areas have been well researched using ISIs? What are the most influential research studies? What are the issues and potential gaps in ISI research?
We found that in the literature on investor sentiment indices, the US and China are the dominating countries in terms of publishing research results. There is a lack of studies in developing countries (except China). We found that several investor sentiment indices, such as the composite investor sentiment index developed by Baker and Wurgler in 2006 and the FEARS sentiment index developed by Da et al. in 2015, are highly used in finance research and dominate the literature. In addition, almost all the literature is based on quantitative research and, therefore, there is a lack of research based on qualitative methods.
To the best of our knowledge, no specific review of ISIs exists. This is the first study to survey the past literature on ISIs. Using the SLR method, we conducted an in-depth review and captured the majority of relevant studies. A recent study by Garg and Tiwari (2021) provided a BA on stock market prediction through social media sentiment but failed to cover a large part of investor sentiment measures, because investor sentiment is widely used in different areas. Our review differs from existing studies in many ways. First, unlike past studies, where only one method was used for review (see Table 1), this is the first study to use both SLR and BA for reviewing purposes. Second, this study covers all the topics and domains within which investor sentiment indices have been used. Third, unlike past reviewers, we used manual forward-and-backward searches to collect all relevant papers. Fourth, we summarized the findings of the earlier studies and clustered them based on their characteristics. Finally, this study covers all studies of ISIs.
The remainder of the paper is organized as follows: We discuss some of the past review studies in Section 2. Section 3 briefly explains the methodological approach to conducting the study, followed by the results and discussion in Section 4. Section 5 summarizes and concludes the paper, followed by suggestions on the potential research gaps.
2. Literature Review
Sentiment analysis is used in broad areas, such as consumer reviews (Liang et al. 2015), financial markets (Baker and Wurgler 2006; Burggraf et al. 2020; Da et al. 2015), and election results (Budiharto and Meiliana 2018). Although there is considerable literature on sentiment analysis (a search of “sentiment analysis” in the Web of Science Core Collection gives 9445 results), only a few review studies on sentiment analysis exist in the area of finance. Studies such as Garg and Tiwari (2021) and Qazi et al. (2017) focused on BA, and Chen and Xie (2020), Hussein (2018), and Ravi and Ravi (2015) on meta-analysis. Moreover, Ghallab et al. (2020) and Hajiali (2020) conducted an SLR on Arabic Sentiment analysis and extensive data methodologies for sentiment analysis, respectively. As noted earlier, Table 1 summarizes some review studies on sentiment analysis. In this context, Medhat et al. (2014) showed a comprehensive review of studies on sentiment analysis based on algorithm methodologies and the wide application of such algorithms in different areas.
It is evident that pessimistic investor sentiment enhances systemic risk. Studies have been conducted to examine systemic risk among cryptocurrencies (Akhtaruzzaman et al. 2022). Bank excess competition and illiquidity can spur investors into initiating a negative sentiment, resulting in abnormal returns. Bank competition has been studied by Rahman and Misra (2021), and the relationship between liquidity, regulatory capital, and profitability by Roy et al. (2019), whereas the concept of abnormal returns was discussed by Boubaker et al. (2022). During the COVID-19 crisis, there was widespread panic among investors in search of a safe haven asset, which has been well discussed by Akhtaruzzaman et al. (2021), who examined the safe haven characteristics of the gold asset during the pandemic.
According to Qazi et al. (2017), there are mainly nine types of review, eight machine learning (ML) techniques for classification, and seven methods for concept learning computing techniques. Chen and Xie (2020) revealed that sentiment lexicons and knowledge bases, aspect-based sentiment analysis, and social network analysis were highly discussed in past studies. In their recent review, Garg and Tiwari (2021), using the BA technique, showed that ‘Lecture notes in Computer Science’ contained the most significant number of documents. Recent papers on sentiment have increased significantly, and the highly cited papers used the Twitter sentiment methodology.
Other studies on sentiment analysis reviewed relevant methodologies, region-specific sentiment, and subject-area-specific sentiment analysis. However, no study has reviewed the ISI techniques along with their applications. This study attempts to fill this research gap by briefly summarizing the studies.. We considered two methods for review (i.e., SLR and BA). The SLR method provides objective summaries of past studies, and BA provides the publication trends. SLR, in particular, is a better choice for literature review if the research area is vast and many publications exist in the area, which would help in focusing on a narrow area of the field (Brereton et al. 2007). While SLR is executed systematically to avoid ignoring any study and providing a holistic view of extant literature by which the findings could be achieved, traditional review studies focus on position papers and choose papers based on convenience to construct a viewpoint (Rousseau et al. 2008).
3. Data Collection and Methodology
3.1. Selection of Search Term
Many studies have already been conducted to study investors’ sentiments in the long term. It is evident that investors’ pessimistic opinions cause market distress, which may result in the enhancement of the prominence of contagion channels, subsequently failing multiple financial institutions. The focus of this study is to review past studies on ISI techniques. To specify the boundary for selecting the keyword for search, only one keyword, “Investor Sentiment Index”, was used.
3.2. Search Method
There are three widely used scholarly databases that provide article metadata: Scopus, Web of Science (WoS), and Google Scholar. Unlike other databases, Google Scholar at times provides irrelevant and inappropriate data related to an article. In addition, it is a very cumbersome process to collect bibliographic data from Google Scholar. Scopus, on the other hand, contains extensive coverage of journals, articles, books, and scholarly readings, with approximately forty thousand journal articles (Singh et al. 2021). While Scopus covers 99.11 percent of the journal entries of WoS, WoS covers only 33.93 percent of the journal entries of Scopus. Thus, choosing Scopus over WoS is reasonable due to the comprehensive article coverage of Scopus (66.07 percent more unique journals than WoS) (Singh et al. 2021). We used Scopus to collect relevant data for the study, keeping in mind the range and coverage of the databases.
The search for finding the relevant studies was carried out in April 2022 using the predefined search string “Investor Sentiment Index” in all search areas, resulting in 235 documents. Since the results gave a very low number of documents, no filter was applied.
3.3. Study Method
We used a combination of two methods (SLR and BA) to review the selected papers. Both methods assisted in reviewing the current research in the area. We followed the methodology recommended by Sureka et al. (2022) to conduct the review. The use of two methods in reviewing the research literature is more efficient than using each method individually. SLR is a method of literature review wherein the researchers determine the specific area of literature review and then systematically perform the inclusion and exclusion of articles as per the article’s relevance. Conducting an SLR is a great advantage because no relevant study or papers are left behind or ignored, as the author performs the selection criteria by themselves. In addition, conducting SLR can increase the reviews’ replicability, reliability, quality, and validity (Xiao and Watson 2019). We followed all the steps of SLR (planning, conducting, and reporting) as per past studies (Brereton et al. 2007).
BA, on the other hand, is a quantitative analysis of the extant literature. As the name suggests, BA is based on bibliographic data from past studies. In the case of bibliographic analysis, statistical techniques are applied. BA has become popular recently (Donthu et al. 2021). It provides insights into country/territory-specific studies, citations, publications, collaborations, and more. Moreover, BA enables the analysis of a publication’s influence and resonance among specialists and proves the authors’ reputation. In this study, BA was conducted using two software packages: VOSviewer and the “Biblioshiny” package in R-programming.
The BA method, in combination with other methods, can be a tool for foresight in itself, as it helps to identify trends. Moreover, Sureka et al. (2022) are in favor of selecting the triangulation method. The authors justified the use of the triangulation of two methods (SLR and BA) rather than individually selecting traditional literature reviews or SLR or BA.1 Keeping in mind the advantages and rigor of both methods, the triangulation of both methods was selected.
3.4. Selection Procedure
The initial search of documents resulted in 235 documents. The documents were then excluded with criteria such as non-English (n = 13), non-articles (n = 28), non-ABDC (ABDC stands for Australian Business Deans Council)-listed journals (n = 87), and irrelevant (n = 8). The filtering process reduced the total to 99 articles. Moreover, as per Xiao and Watson (2019), 23 articles were included through forward-and-backward searches. The final sample containing 122 articles was reviewed. Figure 1 depicts the process of article selection for review.
4. Results and Discussion
4.1. Content Analysis
The sample studies were reviewed in depth, and several key themes were identified based on the characteristics of the studies. These themes are explained below.
4.1.1. Sentiment and Stock Market
Table 2 summarizes the findings on the influence of investor sentiment on the stock market. We classify the results into two categories: stock market return and market price crash risk and volatility.
We identified the significant work of Baker and Wurgler, which forms the basis of several studies on the stock market. In their study, Baker and Stein (2004) used stock market liquidity (proxied by the price impact of trade, bid-ask spread, and turnover) to measure investor sentiment. In their later studies in 2006, the authors used stock market returns to verify the validity of newly constructed ISI based on six proxies. In their subsequent studies in 2007 and 2012, they used a similar methodology to construct the local ISIs of six developed countries and the global sentiment index. Following the same methodology and nonparametric (nonlinear) causality of Diks and Panchenko (2006), Dash and Maitra (2018) showed that, in the Indian scenario, stocks with higher returns (small-cap and mid-cap) were impacted more by investor sentiment than lower return stocks. They also revealed that proxies, such as the put-call ratio, turnover, and the VIX, are good sentiment measures and predictors of stock returns during the study period. In addition, VIX performed better than the sentiment index. There was a significant two-way causality between investor sentiment and returns of small- and mid-cap stocks. In the context of the US, following Baker and Wurgler (2006) and Huang et al. (2015), Ma et al. (2018) used the quantile regression approach to measure the predictive power of investor sentiment indexes on the stock returns (collected from Guofu Zhou’s website).
4.1.2. Sentiment and Cryptocurrency
Table 3 shows the empirical findings of studies involving investor sentiment and cryptocurrency. The results of the studies are divided into two parts: all cryptocurrencies and Bitcoin.
4.1.3. Sentiment and COVID-19
The empirical findings of studies involved in studying investor sentiment and stock markets regarding the COVID-19 pandemic are summarized in Table 4. The results are divided into the stock market, crypto, and mutual fund market.
4.1.4. Sentiment and Mutual Fund Market
Table 5 sheds light on the empirical findings of studies conducted considering the mutual fund market. The results are divided into three parts: dividend, fund strategy and herd behavior.
4.1.5. Investor Sentiment Index Methodologies
Table 6 summarizes the findings of different methodologies used in past studies to construct the investor sentiment index.
Composite Investor Sentiment Index
One of the seminal works in ISIs is the BW index, wherein the authors constructed a sentiment index based on market data. This BW sentiment is an indirect measure of sentiment on the basis of six market variables: close-ended fund discount, New York Stock Exchange (NYSE) stock turnover, dividend premium, the number of IPOs, average first-day returns in IPOs, and equity share in new issues. Using the first component (with the highest explaining power) from principal component analysis (PCA), they constructed investor sentiment. Further, regression analysis showed that initially, proxies for the sentiment were low, and the later returns were relatively high for small, unprofitable, high-volatility, distressed, zero-pay-out, young, and excessive-return-growth stocks. However, during high sentiment, these stocks had comparatively low subsequent returns. Following this methodology, many studies constructed ISIs in the context of different countries/territories with some modifications based on suitability and data availability (Aissia 2016; Bekiros et al. 2016; Bissoondoyal-Bheenick et al. 2022; Fu et al. 2021; Hong et al. 2011; Hsu and Chen 2018; J. S. Kim et al. 2017; Li 2021; Ma et al. 2018; Niu et al. 2021; Reis and Pinho 2020; Ur Rehman et al. 2022). While some studies collected data from the official website of Baker and Wurgler, others constructed the same sentiment index based on different proxies.
In their subsequent work, Baker et al. (2012) used the same index to develop both a global ISI and local ISIs for six countries (Canada, France, Germany, Japan, the UK, and the US), and showed that the relative sentiment was associated with the same prices of dual-listed companies. However, Çepni et al. (2020) constructed two sentiment indexes using almost similar proxies and a partial least-square method instead of PCA. Moreover, many studies took BW sentiment data from the website, and used it in a raw form (Bekiros et al. 2016). Bissoondoyal-Bheenick et al. (2022) revealed a negative association between investor sentiment and stock market connectedness (return and volatility) during the US–China trade war. Moreover, the sentiment exerted a stronger influence on volatility connectedness in the low market than its counterpart.
Internet Search-Based Sentiment
Several studies used internet search data to construct an ISI (Boudabbous et al. 2021; Da et al. 2011; Dash and Maitra 2018; Khan et al. 2020; Mathur and Rastogi 2018). Da et al. (2015), in their ISI (this sentiment index measure is commonly known as FEARS), collected financial and economic terms from Harvard IV psychological dictionary. Based on the dictionary terms, the study used Google trend data to construct ISI. Following the same methodology, Goel and Dash (2022) constructed a positive ISI (GREEDS) (GREEDS stands for “Geographically Revealed Economic Expectations disclosed by search Index.”). The index was positively related to global stock returns and had an asymmetric impact on stock returns (stronger significance in developed countries). A global sentiment index spillover effect on country/territory-specific indexes was also found.
Similarly, Koo et al. (2019) used NAVER internet search data to construct an ISI (SENT), as NAVER was used the most in Korea. Herein, ISI was negatively correlated to market returns in the first two weeks, and then reversed (stronger in higher CAPM beta) in the third week. Reversals for small stocks appeared later. The sentiment had a more substantial effect on high-volatility stocks. Moreover, when sentiment was high, investors shifted investments from capital to the money market (“flight to safety”).
Online Post-Based Sentiment
Some studies used Twitter data to analyze investor sentiment. At the same time, some researchers used the Twitter happiness index (Bonato et al. 2021; Naeem et al. 2021), and others used Twitter data for sentiment analysis using text analysis (Aharon et al. 2022; French 2021).
Other Sentiment Measures
A recent study by He et al. (2022) used text analysis on financial newspapers to construct an ISI. Using predictive regression, the study showed that sentiment was positively (negatively) related to the stock returns over a short (long) period. After fifteen months (one month), the stock prices reversed in the developing (developed) market. Sun et al. (2021) also used text analysis along with a sentiment dictionary (GubaSenti) based on data collected from online posts on Eastmoney Guba for ISI construction.
4.1.6. Statistical Techniques and Methods
The regression technique in various forms is the most commonly used methodology for investigating the relationship between ISI and counterpart variables. Some studies used predictive regression (Çepni et al. 2020; Gong et al. 2022; He et al. 2022; Koo et al. 2019), quantile regression (Aharon et al. 2022; Apergis et al. 2018; Ma et al. 2018; Naeem et al. 2021; Ni et al. 2015), and rolling regression (Khan et al. 2020). In addition, linear and nonlinear causality tests were conducted in some studies (Khan et al. 2020).
Regression: Table 7 shows the empirical findings of studies that used regression as a statistical technique. The results are divided into three parts: quantile regression, backward-rolling regression, and predictive regression.
Causality: Table 8 shows the empirical findings of studies that used causality tests (linear or nonlinear or a combination of both) as a statistical technique.
4.2. Research Trends
4.2.1. Countries/Territories, Year, and Publication
Number of documents: Figure 2 depicts the publication trends in different countries based on the year of publication. It can be seen that the studies published in China were higher in number and China was the most influential country/territory in the literature. Studies relating to China and the teal cluster were published around 2019. Recent studies have been conducted in countries such as New Zealand, Russia, Vietnam, and Australia, but the number of studies is relatively small. Moreover, studies conducted before 2017 were mainly from the US, Taiwan, and Hong Kong, wherein the US significantly impacted the field. In 2020, Indian researchers contributed significantly to the area, but the number of researchers is still low compared to other emerging nations such as China. The results are in line with the results of past literature reviews (Garg and Tiwari 2021).
Collaboration: Figure 3 and Figure 4 depict the mapping of countries based on authors from different countries, along with the country/territory collaboration map. From Figure 3, it can be seen that China has the highest number of cited documents. Table A1; Refer Appendix A reports that although France has the highest total link strength—16 papers with 126 citations—it is nowhere near that of China (91 documents and 1122 citations). In addition, the US has the highest number of citations (1051) after China. Compared to other countries, China has produced many studies on ISIs. Researchers from New Zealand, Spain, Malaysia, Greece, Hong Kong, and Thailand have conducted very few studies in the ISI domain. Further analysis of Figure 2 shows that Vietnam, the Russian Federation, Australia, and Portugal have recently started collaborating for research in this area. Furthermore, countries/territories in the US, Hong Kong, and Taiwan are specific locations where research collaboration pertaining to this area was carried out on or before 2017. Similar results have been found in previous review studies (X. Chen and Xie 2020). In terms of the number of documents in our study, researchers from India did not publish good numbers compared to other countries. However, Chen and Xie (2020) found that India produced the second-highest number of studies on investor sentiment, followed by the US. These contrary findings might be due to the field of interest. While we focus on investor sentiment index and the area of finance literature in particular, they focus on the literature of sentiment analysis across fields.
4.2.2. Influential Studies
Figure 5 shows the co-citation analysis. One of the highly impactful papers in constructing an indirect measure of ISIs is Baker and Wurgler (2006), as mentioned in previous sections (see Figure 5). This paper has been cited the most by different researchers. Table 9 reports the five most influential studies in the area. Baker and Wurgler are two of the researchers who contributed extensively to the literature.
4.2.3. Journal of Publication
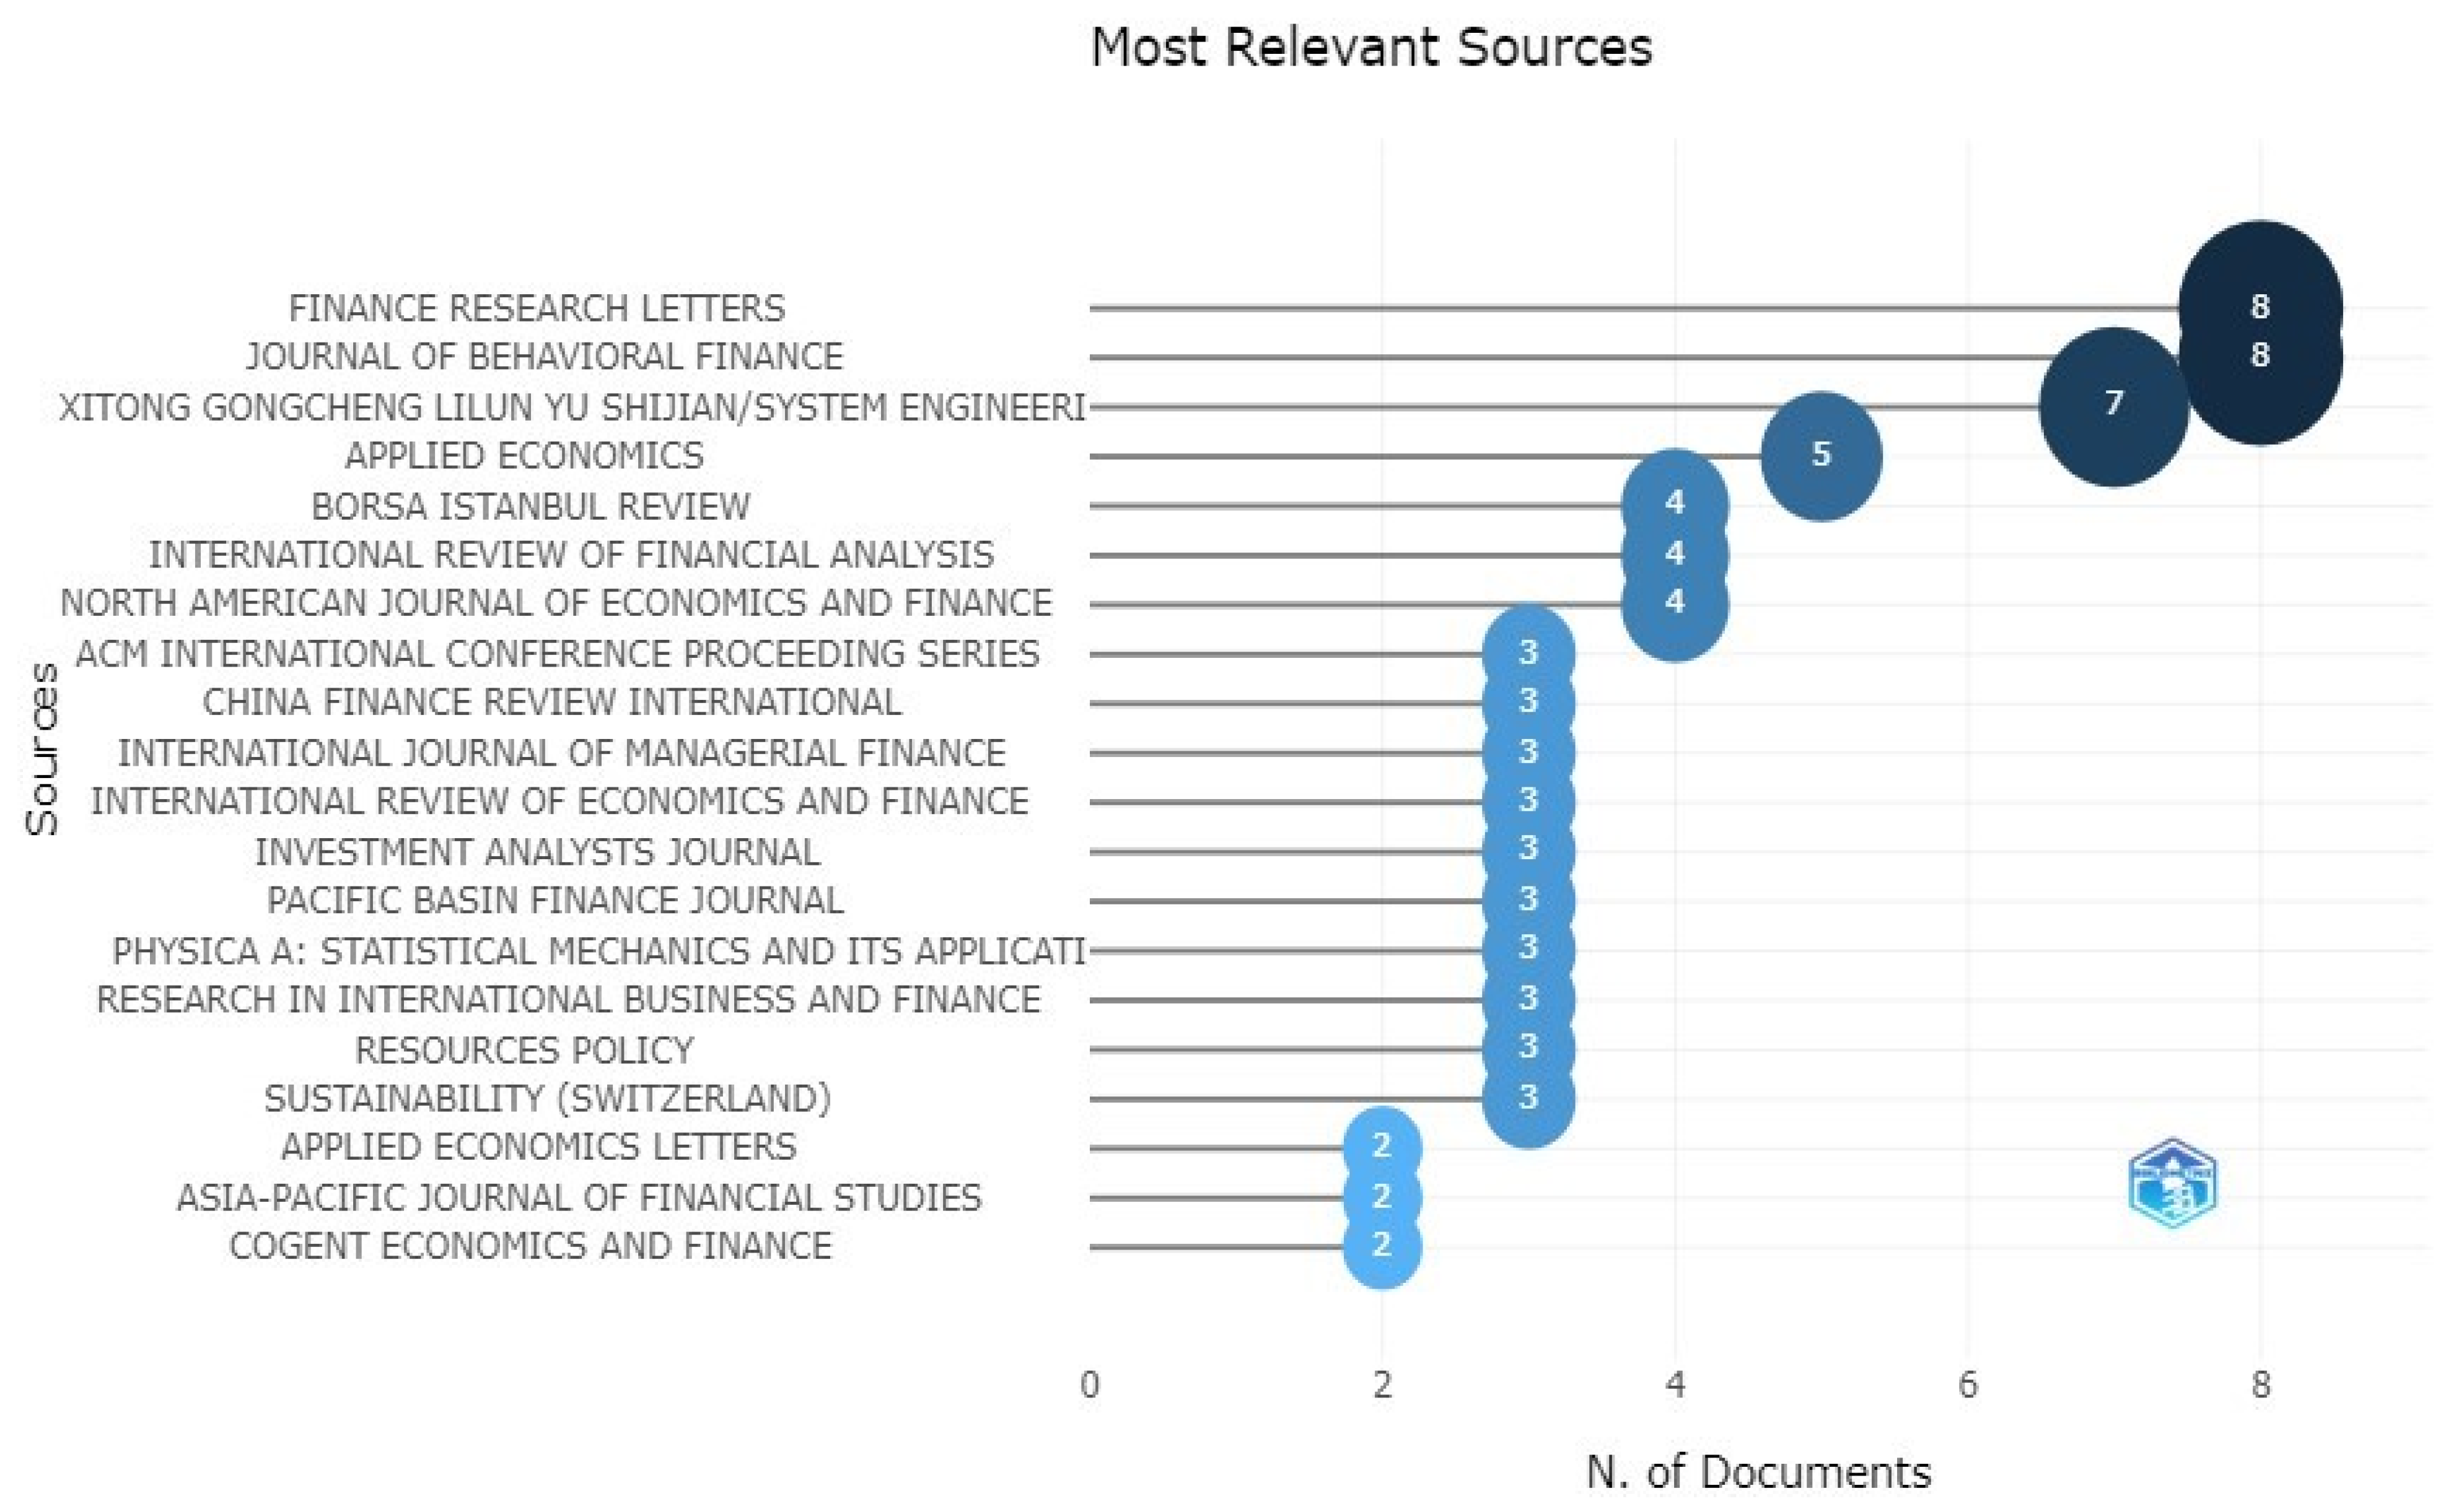
The most relevant sources, as depicted in Figure 6, are Finance Research Letters and the Journal of Behavioral Finance, which implies that most of the studies on ISI were published in these two journals. In Finance Research Letters, most studies showed the impact of the sentiment index on the stock market (Bonato et al. 2021; Dash and Maitra 2018; Fu et al. 2021; Khan et al. 2020). However, in the case of the Journal of Behavioral Finance, the studies focused on the housing market and monetary policy along with the stock market (Balcilar et al. 2021; Cepni et al. 2021). Figure 7 and Figure 8 also depict the sources (journals) most used in the area (based on bibliographic coupling and citation analysis based on sources, respectively).
4.2.4. Term Analysis
The keywords analysis reveals that the three most used words were investor, sentiment, and stock, as depicted in Figure 9. Moreover, Table 10 reports that “investor sentiment” had the highest frequency and “behavioral finance” had the second-highest frequency.
Figure 9 also shows that the most persistent strings of terms used in titles were “Measuring Investor Sentiment”, “Investor Sentiment Index”, and “Stock Market Investor”. This implies that studies in the past on investor sentiment were primarily conducted by measuring the sentiment index and the stock market. Based on the objective of this study, the results show that most of the studies were conducted by measuring investor sentiment with different methodologies and showing its impact on the market. Figure 10 shows a similar result, based on keywords used by earlier authors.
4.2.5. Trend of Topics
Figure 11 shows that a long-term trending topic is return predictability. Many studies have been conducted to show the return predictability of ISIs in the stock market (Baker et al. 2012; Bonato et al. 2021; Çepni et al. 2020; Obaid and Pukthuanthong 2022). Moreover, Table A5, Refer Appendix A shows that in recent times just after the pandemic’s beginning, studies on investor sentiment during the pandemic were conducted (H. Liu et al. 2020).
4.2.6. Citation Analysis
The citation analysis, as shown in Table 11, reveals that the highest number of globally cited studies were Baker et al. (2012) and Huang et al. (2015). However, in terms of normalized total citation, Liu et al. (2020) had the highest value of all these studies.
However, the study of Liu et al. (2020) does not appear in the list of most cited local documents (Table 12). An in-depth analysis of the table below (Table 12) shows that the most cited local documents were those that have adopted different ISI construction methodologies. The study by Huang et al. (2015), for instance, introduced a new methodology to construct ISI in the case of the Chinese countries/territories. However, the study by Zhou (2018) is only a review study, and it still appears on the list.
5. Conclusions
We know that research on behavioral finance has boomed in the last three decades. Research on the investor sentiment index has increased significantly in recent years. In this paper, we reviewed all the relevant papers on the investor sentiment index. We used both a systematic literature review (SLR) and bibliometric analysis (BA) to conduct an in-depth review study. We considered all relevant papers following a backward-and-forward search. We found that studies on investor sentiment index were greater in number in developed nations compared to emerging nations (except China, where many studies have been conducted). We also found that studies were more prominent in terms of quantitative-based research and the stock market. In addition, the growing literature on the investor sentiment index focused more on text-based, image-based, and social-media-post-based investor sentiment indexes. However, the market-based composite investor sentiment index is one of the most used sentiment indexes (Baker and Wurgler 2006). Malcolm Baker was noted to be one of the most cited authors in the literature (Baker and Wurgler 2006). Trend analysis on the topics revealed that stock-market-predictability-related investor sentiment index studies have increased during the pandemic period. Authors from China engaged the most in co-authorship. We contribute to the literature in multiple ways. First, unlike existing review studies, we used SLR and BA for review. This is the first study to use a combination of two methods to review the literature related to investor sentiment indexes. Secondly, this study includes articles identified using manual forward-and-backward searches to collect all relevant papers. Finally, this paper covers all the topics and domains wherein investor sentiment indexes are used. The findings of the study can be used by future researchers to have an overview of the literature on investor sentiment index. In addition, researchers could frame questions for future research. Finally, this study would help in identifying the appropriate investor sentiment index for future research. The future research directions are as follows.
5.1. Direction for Future Research
The objective of this study was to review the findings of past studies related to ISI and the different methodologies used to construct ISI. The systematic and bibliometric analysis of the related studies has raised several research gaps and potential future research questions. Table 13 summarizes the suggestions from the reviewed studies for future research directions.
5.1.1. Lack of Research in Developing Nations
The domain of behavioral finance is relatively new. As a result, most studies have been performed in the context of developed countries, especially the US (Baker and Wurgler 2006; Blasco et al. 2018; Da et al. 2015; R. Gupta et al. 2021a; Massa and Yadav 2015; Obaid and Pukthuanthong 2022; Tetlock 2007). This could be because markets are emerging in developing countries, and the dynamic nature of emerging markets may give different non-generalizable results. However, China is an exception in this case. As mentioned above in Section 4, research from China has been significant. Notably, over the past decade, researchers in emerging nations (especially China) have been making efforts to work in this area (Eachempati and Srivastava 2021; Gong et al. 2022; He et al. 2022; Y. Sun et al. 2021; Xiong et al. 2020). However, there is very little empirical evidence on ISIs in an Indian setting (Dash and Maitra 2018; Eachempati and Srivastava 2021; Goel and Dash 2021). This creates a research gap for future studies.
5.1.2. The Predominance of Secondary Data-Based Empirical Research
Most of the studies have been empirical in nature and used secondary datasets. However, some studies did use primary survey data to construct investor sentiment (S. Jiang and Jin 2021). Thus, studies based on preliminary data are encouraged to be conducted by researchers. Moreover, based on a survey (such as AAII of the US), ISIs can be developed for different countries/territories (such as emerging markets).
5.1.3. Lack of Studies Using a Qualitative Approach
This exhaustive review of ISI literature also revealed that no study used a qualitative approach to understand the phenomena. Although the ISI is quantitative, a sentiment index may be constructed following a qualitative research method. In the future, researchers could conduct studies based on expert interviews, focused group discussions, and other methods to collect data.
5.1.4. High Focus on Stock Return
This in-depth review revealed that the majority of the research studies are based on one area, i.e., the stock market (Baker and Wurgler 2006; T. Chen 2017; Goel and Dash 2022; Obaid and Pukthuanthong 2022). However, some studies also considered mutual fund markets (Mathur and Rastogi 2018).
Funding
This research received no external funding.
Conflicts of Interest
The authors declare no conflict of interest.
Appendix A

Table A1.
Country/territory-wise research documents and citations.
| Countries/Territories | Documents | Citations | Total Link Strength |
|---|---|---|---|
| China | 91 | 1122 | 28 |
| United States | 26 | 1051 | 19 |
| India | 18 | 89 | 7 |
| France | 16 | 126 | 29 |
| United Kingdom | 15 | 72 | 21 |
| South Africa | 15 | 16 | 20 |
| South Korea | 14 | 72 | 3 |
| Taiwan | 11 | 46 | 5 |
| Pakistan | 10 | 70 | 14 |
| Vietnam | 10 | 19 | 13 |
| Tunisia | 10 | 82 | 8 |
| Russian Federation | 9 | 24 | 21 |
| Portugal | 9 | 33 | 4 |
| Australia | 8 | 8 | 10 |
| Turkey | 7 | 40 | 9 |
| New Zealand | 6 | 27 | 18 |
| Spain | 6 | 29 | 3 |
| Malaysia | 6 | 22 | 2 |
| Greece | 5 | 37 | 11 |
| Hong Kong | 5 | 50 | 5 |
| Thailand | 5 | 8 | 4 |
Table A2.
Co-citation network.
| Node | Betweenness | Closeness | Page Rank |
|---|---|---|---|
| Cluster 1 | |||
| Baker and Wurgler (2006) | 219.527662 | 0.015625 | 0.06794045 |
| Baker and Wurgler (2007) | 104.969595 | 0.015625 | 0.05313294 |
| Stambaugh et al. (2012) | 13.0175666 | 0.01470588 | 0.02821573 |
| Da et al. (2015) | 20.7103689 | 0.01449275 | 0.02920612 |
| De Long et al. (1990) | 16.6890793 | 0.01449275 | 0.02847767 |
| Lee et al. (2002) | 14.9154615 | 0.01428571 | 0.02221078 |
| Tetlock (2007) | 5.14245998 | 0.01333333 | 0.01984227 |
| Antweiler and Frank (2004) | 2.04708981 | 0.01219512 | 0.01647175 |
| Shleifer and Vishny (1997) | 3.55202593 | 0.0125 | 0.01434914 |
| Yu and Yuan (2011) | 2.66153437 | 0.01265823 | 0.01212042 |
| Bekiros et al. (2016) | 0.48448461 | 0.01162791 | 0.00926938 |
| Da et al. (2011) | 0.28948147 | 0.01111111 | 0.01109502 |
| F. Jiang et al. (2019) | 0.14734679 | 0.01086957 | 0.01130509 |
| Hirshleifer et al. (2015) | 0.29120514 | 0.01123596 | 0.01023975 |
| Das and Chen (2007) | 0.26191219 | 0.01086957 | 0.00907961 |
| García (2013) | 0.11110769 | 0.01098901 | 0.01092196 |
| Cluster 2 | |||
| Baker et al. (2012) | 133.275032 | 0.01612903 | 0.03466891 |
| Huang et al. (2015) | 60.4277639 | 0.01538462 | 0.02913402 |
| Lee et al. (1991) | 0.91129218 | 0.01190476 | 0.00966337 |
| L. Sun et al. (2016) | 5.03801823 | 0.01298701 | 0.01526918 |
| Zhou (2018) | 2.91107578 | 0.01204819 | 0.01321668 |
| Smales (2017) | 3.17586941 | 0.01282051 | 0.01520091 |
| Yang and Zhou (2016) | 0.88054476 | 0.01219512 | 0.0159711 |
| Yang et al. (2015) | 1.10600412 | 0.01204819 | 0.01470128 |
| Benhabib et al. (2016) | 0.58930151 | 0.01149425 | 0.01197713 |
| Kumari and Mahakud (2015) | 0.47192681 | 0.01162791 | 0.01185564 |
| Zouaoui et al. (2011) | 1.72164751 | 0.0125 | 0.0135497 |
| Aboody et al. (2018) | 1.93355472 | 0.01176471 | 0.01007205 |
| Cluster 3 | |||
| Brown and Cliff (2004) | 35.355213 | 0.01351351 | 0.04593274 |
| Schmeling (2009) | 47.8490956 | 0.01408451 | 0.04240872 |
| Baker and Stein (2004) | 26.4708547 | 0.01388889 | 0.03499847 |
| Brown and Cliff (2005) | 13.9896384 | 0.0131579 | 0.03578223 |
| Lemmon and Portniaguina (2006) | 22.0861202 | 0.01333333 | 0.03157943 |
| Fisher and Statman (2000) | 16.4136195 | 0.0131579 | 0.03379941 |
| Black (1986) | 3.05404379 | 0.01190476 | 0.02359622 |
| Barberis et al. (1998) | 2.74820488 | 0.01190476 | 0.01924595 |
| Fama and French (1993) | 1.95957462 | 0.01204819 | 0.02076118 |
| Neal and Wheatley (1998) | 5.18809219 | 0.01265823 | 0.0205036 |
| Kumar and Lee (2006) | 3.04898806 | 0.01219512 | 0.01652273 |
| Ben-Rephael et al. (2012) | 0.61266555 | 0.01149425 | 0.01214606 |
| Lee et al. (1991) | 0.55018123 | 0.01162791 | 0.0120838 |
| Fama and French (1992) | 0.71136692 | 0.01123596 | 0.01226741 |
| Fisher and Statman (2003) | 0.73347916 | 0.01162791 | 0.01314629 |
| Kaplanski and Levy (2010) | 0.20524729 | 0.01111111 | 0.00884246 |
| Carhart (1997) | 0.77567473 | 0.01176471 | 0.01099706 |
| Lee et al. (1991) | 0.18835298 | 0.00980392 | 0.0114623 |
| Shleifer and Summers (1990) | 0.42133972 | 0.01098901 | 0.01130597 |
| Fama (1970) | 2.16838917 | 0.01176471 | 0.01205322 |
| Kahneman and Tversky (1979) | 0.05667317 | 0.0106383 | 0.01171225 |
| Baker and Stein (2004) | 0.15277281 | 0.01098901 | 0.00969449 |
Source: Biblioshiny.
Table A3.
Country/territory production.
| Region | Frequency |
|---|---|
| China | 288 |
| USA | 38 |
| India | 35 |
| South Korea | 30 |
| South Africa | 24 |
| Pakistan | 22 |
| UK | 21 |
| Tunisia | 18 |
| Australia | 15 |
| Portugal | 15 |
| Malaysia | 14 |
| France | 12 |
| Spain | 11 |
| Thailand | 9 |
| Turkey | 9 |
| Brazil | 6 |
| Greece | 6 |
| Czech Republic | 5 |
| Poland | 5 |
| Germany | 4 |
Source: VOSviewer.
Table A4.
Most local cited references.
| Cited References | Citations |
|---|---|
| Baker and Wurgler (2006) | 32 |
| Brown and Cliff (2004) | 30 |
| Baker et al. (2012) | 25 |
| Schmeling (2009) | 24 |
| Baker and Stein (2004) | 21 |
| Baker and Wurgler (2007) | 15 |
| Fisher and Statman (2000) | 15 |
| De Long et al. (1990) | 14 |
| Barberis et al. (1998) | 13 |
| Huang et al. (2015) | 13 |
| Lemmon and Portniaguina (2006) | 11 |
| Stambaugh et al. (2012) | 11 |
| Ben-Rephael et al. (2012) | 10 |
| Brown and Cliff (2005) | 9 |
| Black (1986) | 8 |
Source: Biblioshiny.
Table A5.
Trending topics.
| Item | Frequency | Year_Q1 | Year_Med | Year_Q3 |
|---|---|---|---|---|
| Return Predictability | 7 | 2014 | 2016 | 2020 |
| Stock Returns | 15 | 2018 | 2018 | 2020 |
| Sentiment | 11 | 2016 | 2018 | 2020 |
| Investor Sentiment Index | 10 | 2017 | 2018 | 2021 |
| Behavioral Finance | 18 | 2015 | 2019 | 2021 |
| Behavioral Finance | 5 | 2018 | 2019 | 2020 |
| Investor Sentiment | 86 | 2018 | 2020 | 2021 |
| Sentiment Index | 8 | 2019 | 2020 | 2021 |
| Volatility | 6 | 2020 | 2020 | 2021 |
| COVID-19 | 17 | 2021 | 2021 | 2021 |
| Stock Market | 10 | 2020 | 2021 | 2021 |
| Machine Learning | 8 | 2020 | 2021 | 2021 |
| Sentiment Analysis | 8 | 2019 | 2021 | 2021 |
| Forecasting | 5 | 2021 | 2021 | 2021 |
Source: Biblioshiny.
| 1 | See Sureka et al. (2022) for further justification on the benefits of use of the triangulation method over traditional SLR or BA techniques. |
References
- Aboody, D., O. Even-Tov, R. Lehavy, and B. Trueman. 2018. Overnight Returns and Firm-Specific Investor Sentiment. Journal of Financial and Quantitative Analysis 53: 485–505. [Google Scholar] [CrossRef] [Green Version]
- Aharon, D. Y., E. Demir, C. K. M. Lau, and A. Zaremba. 2022. Twitter-Based uncertainty and cryptocurrency returns. Research in International Business and Finance 59: 101546. [Google Scholar] [CrossRef]
- Aissia, D. Ben. 2016. Home and foreign investor sentiment and the stock returns. Quarterly Review of Economics and Finance 59: 71–77. [Google Scholar] [CrossRef]
- Akhtaruzzaman, M., S. Boubaker, B. M. Lucey, and A. Sensoy. 2021. Is gold a hedge or a safe-haven asset in the COVID–19 crisis? Economic Modelling 102: 105588. [Google Scholar] [CrossRef]
- Akhtaruzzaman, M., S. Boubaker, D. K. Nguyen, and M. R. Rahman. 2022. Systemic risk-sharing framework of cryptocurrencies in the COVID–19 crisis. Finance Research Letters 47: 102787. [Google Scholar] [CrossRef]
- Antweiler, W., and M. Z. Frank. 2004. Is all that talk just noise? The information content of Internet stock message boards. Journal of Finance 59: 1259–94. [Google Scholar] [CrossRef]
- Apergis, N., A. Cooray, and M. U. Rehman. 2018. Do Energy Prices Affect U.S. Investor Sentiment? Journal of Behavioral Finance 19: 125–40. [Google Scholar] [CrossRef]
- Baker, M., and J. C. Stein. 2004. Market liquidity as a sentiment indicator. Journal of Financial Markets 7: 271–99. [Google Scholar] [CrossRef] [Green Version]
- Baker, M., and J. Wurgler. 2006. Investor sentiment and the cross-section of stock returns. Journal of Finance 61: 1645–80. [Google Scholar] [CrossRef] [Green Version]
- Baker, M., and J. Wurgler. 2007. Investor sentiment in the stock market. Journal of Economic Perspectives 21: 129–51. [Google Scholar] [CrossRef]
- Baker, M., J. Wurgler, and Y. Yuan. 2012. Global, local, and contagious investor sentiment. Journal of Financial Economics 104: 272–87. [Google Scholar] [CrossRef] [Green Version]
- Balcilar, M., E. Bouri, R. Gupta, and C. K. Kyei. 2021. High-Frequency Predictability of Housing Market Movements of the United States: The Role of Economic Sentiment. Journal of Behavioral Finance 22: 490–98. [Google Scholar] [CrossRef]
- Balcilar, M., R. Gupta, and C. Kyei. 2018. Predicting Stock Returns and Volatility With Investor Sentiment Indices: A Reconsideration Using a Nonparametric Causality-in-Quantiles Test. Bulletin of Economic Research 70: 74–87. [Google Scholar] [CrossRef] [Green Version]
- Banerjee, A. K., M. Akhtaruzzaman, A. Dionisio, D. Almeida, and A. Sensoy. 2022. Nonlinear nexus between cryptocurrency returns and COVID–19 COVID-19 news sentiment. Journal of Behavioral and Experimental Finance 36: 100747. [Google Scholar] [CrossRef] [PubMed]
- Barberis, N., A. Shleifer, and R. Vishny. 1998. A model of investor sentiment. Journal of Financial Economics 49: 307–43. [Google Scholar] [CrossRef]
- Bekiros, S., R. Gupta, and C. Kyei. 2016. A non-linear approach for predicting stock returns and volatility with the use of investor sentiment indices. Applied Economics 48: 2895–98. [Google Scholar] [CrossRef]
- Ben-Rephael, A., S. Kandel, and A. Wohl. 2012. Measuring investor sentiment with mutual fund flows. Journal of Financial Economics 104: 363–82. [Google Scholar] [CrossRef]
- Benhabib, J., X. Liu, and P. Wang. 2016. Sentiments, financial markets, and macroeconomic fluctuations. Journal of Financial Economics 120: 420–43. [Google Scholar] [CrossRef] [Green Version]
- Bhardwaj, A., Y. Narayan, Vanraj, Pawan, and M. Dutta. 2015. Sentiment Analysis for Indian Stock Market Prediction Using Sensex and Nifty. Procedia Computer Science 70: 85–91. [Google Scholar] [CrossRef] [Green Version]
- Bissoondoyal-Bheenick, E., H. Do, X. Hu, and A. Zhong. 2022. Sentiment and stock market connectedness: Evidence from the U.S.–China trade war. International Review of Financial Analysis 80: 102031. [Google Scholar] [CrossRef]
- Black, F. 1986. Noise. The Journal of Finance 41: 528–43. [Google Scholar] [CrossRef]
- Blasco, N., P. Corredor, and E. Ferrer. 2018. Analysts herding: When does sentiment matter? Applied Economics 50: 5495–509. [Google Scholar] [CrossRef]
- Bonato, M., K. Gkillas, R. Gupta, and C. Pierdzioch. 2021. A note on investor happiness and the predictability of realized volatility of gold. Finance Research Letters 39: 101614. [Google Scholar] [CrossRef]
- Boubaker, S., Z. Liu, and Y. Zhan. 2022. Customer relationships, corporate social responsibility, and stock price reaction: Lessons from China during health crisis times. Finance Research Letters 47: 102699. [Google Scholar] [CrossRef]
- Boudabbous, A., S. Boujelben, and M. Abdelhedi. 2021. The effect of the investors’ sentiment on the trade-off between earnings management strategies: The case of tunisian market. Asian Academy of Management Journal of Accounting and Finance 17: 225–59. [Google Scholar] [CrossRef]
- Brereton, P., B. A. Kitchenham, D. Budgen, M. Turner, and M. Khalil. 2007. Lessons from applying the systematic literature review process within the software engineering domain. Journal of Systems and Software 80: 571–83. [Google Scholar] [CrossRef] [Green Version]
- Brown, G. W., and M. T. Cliff. 2004. Investor sentiment and the near-term stock market. Journal of Empirical Finance 11: 1–27. [Google Scholar] [CrossRef]
- Brown, G. W., and M. T. Cliff. 2005. Investor sentiment and asset valuation. Journal of Business 78: 405–40. [Google Scholar] [CrossRef]
- Budiharto, W., and M. Meiliana. 2018. Prediction and analysis of Indonesia Presidential election from Twitter using sentiment analysis. Journal of Big Data 5: 1–10. [Google Scholar] [CrossRef] [Green Version]
- Burggraf, T., T. L. D. Huynh, M. Rudolf, and M. Wang. 2020. Do FEARS drive Bitcoin? Review of Behavioral Finance 13: 229–58. [Google Scholar] [CrossRef]
- Carhart, M. M. 1997. On Persistence in Mutual Fund Performance. The Journal of Finance 52: 57–82. [Google Scholar] [CrossRef]
- Çepni, O., I. E. Guney, R. Gupta, and M. E. Wohar. 2020. The role of an aligned investor sentiment index in predicting bond risk premia of the U.S. Journal of Financial Markets 51: 100541. [Google Scholar] [CrossRef]
- Cepni, O., R. Gupta, and Q. Ji. 2021. Sentiment Regimes and Reaction of Stock Markets to Conventional and Unconventional Monetary Policies: Evidence from OECD Countries. Journal of Behavioral Finance, 1–17. [Google Scholar] [CrossRef]
- Chen, H., T. T. L. Chong, and Y. She. 2014. A principal component approach to measuring investor sentiment in China. Quantitative Finance 14: 573–79. [Google Scholar] [CrossRef]
- Chen, R., J. Yu, C. Jin, and W. Bao. 2019. Internet finance investor sentiment and return comovement. Pacific Basin Finance Journal 56: 151–61. [Google Scholar] [CrossRef]
- Chen, T. 2017. Investor Attention and Global Stock Returns. Journal of Behavioral Finance 18: 358–72. [Google Scholar] [CrossRef]
- Chen, X., and H. Xie. 2020. A Structural Topic Modeling-Based Bibliometric Study of Sentiment Analysis Literature. Cognitive Computation 12: 1097–129. [Google Scholar] [CrossRef]
- Da, Z., J. Engelberg, and P. Gao. 2011. In Search of Attention. The Journal of Finance 66: 1461–99. [Google Scholar] [CrossRef]
- Da, Z., J. Engelberg, and P. Gao. 2015. The Sum of All FEARS Investor Sentiment and Asset Prices. Review of Financial Studies 28: 1–32. [Google Scholar] [CrossRef] [Green Version]
- Das, S. R., and M. Y. Chen. 2007. Yahoo! for Amazon: Sentiment Extraction from Small Talk on the Web. Management Science 53: 1375–88. [Google Scholar] [CrossRef]
- Dash, S. R., and D. Maitra. 2018. Does sentiment matter for stock returns? Evidence from Indian stock market using wavelet approach. Finance Research Letters 26: 32–39. [Google Scholar] [CrossRef]
- De Long, J. B., A. Shleifer, L. H. Summers, and R. J. Waldmann. 1990. Noise Trader Risk in Financial Markets. Journal of Political Economy 98: 28–52. [Google Scholar] [CrossRef]
- Debata, B., S. R. Dash, and J. Mahakud. 2021. Stock market liquidity: Implication of local and global investor sentiment. Journal of Public Affairs, 21. [Google Scholar] [CrossRef]
- Diks, C., and V. Panchenko. 2006. A new statistic and practical guidelines for nonparametric Granger causality testing. Journal of Economic Dynamics and Control 30: 1647–69. [Google Scholar] [CrossRef] [Green Version]
- Ding, Z., Z. Liu, Y. Zhang, and R. Long. 2017. The contagion effect of international crude oil price fluctuations on Chinese stock market investor sentiment. Applied Energy 187: 27–36. [Google Scholar] [CrossRef]
- Donthu, N., S. Kumar, D. Mukherjee, N. Pandey, and W. M. Lim. 2021. How to conduct a bibliometric analysis: An overview and guidelines. Journal of Business Research 133: 285–96. [Google Scholar] [CrossRef]
- Duan, Y., L. Liu, and Z. Wang. 2021. COVID-19 Sentiment and the Chinese Stock Market: Evidence from the Official News Media and Sina Weibo. Research in International Business and Finance 58: 101432. [Google Scholar] [CrossRef]
- Eachempati, P., and P. R. Srivastava. 2021. Accounting for unadjusted news sentiment for asset pricing. Qualitative Research in Financial Markets 13: 383–422. [Google Scholar] [CrossRef]
- Fama, E. F. 1970. Efficient Capital Markets: A Review of Theory and Empirical Work. The Journal of Finance 25: 383–417. [Google Scholar] [CrossRef]
- Fama, E. F., and K. R. French. 1992. The Cross-Section of Expected Stock Returns. The Journal of Finance 47: 427–65. [Google Scholar] [CrossRef]
- Fama, E. F., and K. R. French. 1993. Common risk factors in the returns on stocks and bonds. Journal of Financial Economics 33: 3–56. [Google Scholar] [CrossRef]
- Fisher, K. L., and M. Statman. 2000. Investor Sentiment and Stock Returns. Financial Analysts Journal 56: 16–23. [Google Scholar] [CrossRef]
- Fisher, K. L., and M. Statman. 2003. Consumer Confidence and Stock Returns. The Journal of Portfolio Management 30: 115–27. [Google Scholar] [CrossRef]
- French, J. J. 2021. #Bitcoin, #COVID-19: Twitter-based uncertainty and bitcoin before and during the pandemic. International Journal of Financial Studies 9: 28. [Google Scholar] [CrossRef]
- Ftiti, Z., and S. Hadhri. 2019. Can economic policy uncertainty, oil prices, and investor sentiment predict Islamic stock returns? A multi-scale perspective. Pacific-Basin Finance Journal 53: 40–55. [Google Scholar] [CrossRef]
- Fu, J., X. Wu, Y. Liu, and R. Chen. 2021. Firm-specific investor sentiment and stock price crash risk. Finance Research Letters 38: 101442. [Google Scholar] [CrossRef]
- García, D. 2013. Sentiment during Recessions. Journal of Finance 68: 1267–300. [Google Scholar] [CrossRef]
- García Petit, Juan Jose, Vaquero E. Lafuente, and Rúa A. Vieites. 2019. How information technologies shape investor sentiment: A web-based investor sentiment index. Borsa Istanbul Review 19: 95–105. [Google Scholar] [CrossRef]
- Garg, D., and P. Tiwari. 2021. Impact of social media sentiments in stock market predictions: A bibliometric analysis. Business Information Review 38: 170–82. [Google Scholar] [CrossRef]
- Ghallab, A., A. Mohsen, and Y. Ali. 2020. Arabic Sentiment Analysis: A Systematic Literature Review. Applied Computational Intelligence and Soft Computing 2020: 7403128. [Google Scholar] [CrossRef]
- Goel, G., and S. R. Dash. 2021. Investor sentiment and government policy interventions: Evidence from COVID-19 spread. Journal of Financial Economic Policy. [Google Scholar] [CrossRef]
- Goel, G., and S. R. Dash. 2022. GREEDS and Stock Returns: Evidence from Global Stock Markets. Journal of Behavioral Finance, 1–16. [Google Scholar] [CrossRef]
- Gong, X., W. Zhang, J. Wang, and C. Wang. 2022. Investor sentiment and stock volatility: New evidence. International Review of Financial Analysis 80: 102028. [Google Scholar] [CrossRef]
- Gupta, R., J. Nel, and C. Pierdzioch. 2021a. Investor Confidence and Forecastability of US Stock Market Realized Volatility: Evidence from Machine Learning. Journal of Behavioral Finance, 1–12. [Google Scholar] [CrossRef]
- Gupta, V., S. Singh, and S. S. Yadav. 2021b. The impact of media sentiments on IPO underpricing. Journal of Asia Business Studies. [Google Scholar] [CrossRef]
- Hajiali, M. 2020. Big data and sentiment analysis: A comprehensive and systematic literature review. Concurrency and Computation: Practice and Experience 32: 1–15. [Google Scholar] [CrossRef]
- He, Y., L. Qu, R. Wei, and X. Zhao. 2022. Media-based investor sentiment and stock returns: A textual analysis based on newspapers. Applied Economics 54: 774–92. [Google Scholar] [CrossRef]
- Hirshleifer, D., J. Li, and J. Yu. 2015. Asset pricing in production economies with extrapolative expectations. Journal of Monetary Economics 76: 87–106. [Google Scholar] [CrossRef] [Green Version]
- Hong, Y.-G., S.-H. Kim, and H. G. Kang. 2011. Tactical Asset Allocation Using Korean Investors’ Sentiment. SSRN Electronic Journal 56: 177–95. [Google Scholar] [CrossRef] [Green Version]
- Hsu, C. C., and M. L. Chen. 2018. Timing of advertising and the MAX effect. Journal of Behavioral and Experimental Finance 20: 105–14. [Google Scholar] [CrossRef]
- Hu, M., D. Zhang, Q. Ji, and L. Wei. 2020. Macro factors and the realized volatility of commodities: A dynamic network analysis. Resources Policy 68: 101813. [Google Scholar] [CrossRef]
- Huang, D., F. Jiang, J. Tu, and G. Zhou. 2015. Investor sentiment aligned: A powerful predictor of stock returns. Review of Financial Studies 28: 791–837. [Google Scholar] [CrossRef]
- Hudson, Y., M. Yan, and D. Zhang. 2020. Herd behaviour and investor sentiment: Evidence from UK mutual funds. International Review of Financial Analysis, 71. [Google Scholar] [CrossRef]
- Hussein, D. M. E. D. M. 2018. A survey on sentiment analysis challenges. Journal of King Saud University-Engineering Sciences 30: 330–38. [Google Scholar] [CrossRef]
- Ji, Q., J. Li, and X. Sun. 2019. Measuring the interdependence between investor sentiment and crude oil returns: New evidence from the CFTC’s disaggregated reports. Finance Research Letters 30: 420–25. [Google Scholar] [CrossRef]
- Jiang, F., J. Lee, X. Martin, and G. Zhou. 2019. Manager sentiment and stock returns. Journal of Financial Economics 132: 126–49. [Google Scholar] [CrossRef]
- Jiang, S., and X. Jin. 2021. Effects of investor sentiment on stock return volatility: A spatio-temporal dynamic panel model. Economic Modelling 97: 298–306. [Google Scholar] [CrossRef]
- Jiang, Y., B. Mo, and H. Nie. 2018. Does investor sentiment dynamically impact stock returns from different investor horizons? Evidence from the US stock market using a multi-scale method. Applied Economics Letters 25: 472–76. [Google Scholar] [CrossRef]
- Kahneman, D., and A. Tversky. 1979. On the interpretation of intuitive probability: A reply to Jonathan Cohen. Cognition 7: 409–11. [Google Scholar] [CrossRef]
- Kaplanski, G., and H. Levy. 2010. Sentiment and stock prices: The case of aviation disasters. Journal of Financial Economics 95: 174–201. [Google Scholar] [CrossRef]
- Khan, M. A., J. A. Hernandez, and S. J. H. Shahzad. 2020. Time and frequency relationship between household investors’ sentiment index and US industry stock returns. Finance Research Letters 36: 101318. [Google Scholar] [CrossRef]
- Kim, J. S., D. H. Kim, and S. W. Seo. 2017. Investor Sentiment and Return Predictability of the Option to Stock Volume Ratio. Financial Management 46: 767–96. [Google Scholar] [CrossRef]
- Kim, K., and J. Byun. 2010. Effect of investor sentiment on market response to stock split announcement. Asia-Pacific Journal of Financial Studies 39: 687–719. [Google Scholar] [CrossRef]
- Kim, K., D. Ryu, and H. Yang. 2019. Investor sentiment, stock returns, and analyst recommendation changes: The KOSPI stock market. Investment Analysts Journal 48: 89–101. [Google Scholar] [CrossRef]
- Koo, B., J. Chae, and H. Kim. 2019. Does Internet Search Volume Predict Market Returns and Investors’ Trading Behavior? Journal of Behavioral Finance 20: 316–38. [Google Scholar] [CrossRef]
- Kumar, A., and C. M. C. Lee. 2006. Retail investor sentiment and return comovements. Journal of Finance 61: 2451–86. [Google Scholar] [CrossRef]
- Kumar, P., and M. Firoz. 2022. Does Accounting-based Financial Performance Value Environmental, Social and Governance (ESG) Disclosures? A detailed note on a corporate sustainability perspective. Australasian Business, Accounting and Finance Journal 16: 41–72. [Google Scholar] [CrossRef]
- Kumari, J., and J. Mahakud. 2015. Does investor sentiment predict the asset volatility? Evidence from emerging stock market India. Journal of Behavioral and Experimental Finance 8: 25–39. [Google Scholar] [CrossRef]
- Lee, C. M. C., A. Shleifer, and R. H. Thaler. 1991. Investor Sentiment and the Closed-End Fund Puzzle. The Journal of Finance 46: 75–109. [Google Scholar] [CrossRef]
- Lee, W. Y., C. X. Jiang, and D. C. Indro. 2002. Stock market volatility, excess returns, and the role of investor sentiment. Journal of Banking & Finance 26: 2277–99. [Google Scholar] [CrossRef]
- Lemmon, M., and E. Portniaguina. 2006. Consumer confidence and asset prices: Some empirical evidence. Review of Financial Studies 19: 1499–529. [Google Scholar] [CrossRef]
- Li, X. 2021. Does Chinese investor sentiment predict Asia-pacific stock markets? Evidence from a nonparametric causality-in-quantiles test. Finance Research Letters 38: 101395. [Google Scholar] [CrossRef]
- Liang, T. P., X. Li, C. T. Yang, and M. Wang. 2015. What in Consumer Reviews Affects the Sales of Mobile Apps: A Multifacet Sentiment Analysis Approach. International Journal of Electronic Commerce 20: 236–60. [Google Scholar] [CrossRef]
- Liu, H., Y. Wang, D. He, and C. Wang. 2020. Short term response of Chinese stock markets to the outbreak of COVID-19. Applied Economics 52: 5859–72. [Google Scholar] [CrossRef]
- Liu, S. 2015. Investor Sentiment and Stock Market Liquidity. Journal of Behavioral Finance 16: 51–67. [Google Scholar] [CrossRef]
- Lu, X., K. K. Lai, and L. Liang. 2012. Dependence between stock returns and investor sentiment in Chinese markets: A copula approach. Journal of Systems Science and Complexity 25: 529–48. [Google Scholar] [CrossRef]
- Ma, C., S. Xiao, and Z. Ma. 2018. Investor sentiment and the prediction of stock returns: A quantile regression approach. Applied Economics 50: 5401–15. [Google Scholar] [CrossRef]
- Maheu, J.M., and T. H. McCurdy. 2000. Identifying Bull and Bear Markets in Stock Returns. Journal of Business & Economic Statistics 18: 100–12. [Google Scholar] [CrossRef]
- Massa, M., and V. Yadav. 2015. Investor sentiment and mutual fund strategies. Journal of Financial and Quantitative Analysis 50: 699–727. [Google Scholar] [CrossRef]
- Mathur, S., and A. Rastogi. 2018. Investor sentiment and asset returns: The case of Indian stock market. Afro-Asian Journal of Finance and Accounting 8: 48–64. [Google Scholar] [CrossRef]
- Medhat, W., A. Hassan, and H. Korashy. 2014. Sentiment analysis algorithms and applications: A survey. Ain Shams Engineering Journal 5: 1093–113. [Google Scholar] [CrossRef] [Green Version]
- Mezghani, T., M. Boujelbène, and M. Elbayar. 2021. Impact of COVID-19 pandemic on risk transmission between googling investor’s sentiment, the Chinese stock and bond markets. China Finance Review International 11: 322–48. [Google Scholar] [CrossRef]
- Mohsin, M., S. Naseem, L. Ivașcu, L. I. Cioca, M. Sarfraz, and N. C. Stănică. 2021. Gauging The Effect of Investor Sentiment on Cryptocurrency Maker: An Analysis of Bitcoin Currency. Romanian Journal of Economic Forecasting 24: 87–102. [Google Scholar]
- Naeem, M. A., I. Mbarki, M. T. Suleman, X. V. Vo, and S. J. H. Shahzad. 2021. Does Twitter Happiness Sentiment predict cryptocurrency? International Review of Finance 21: 1529–38. [Google Scholar] [CrossRef]
- Neal, R., and S. M. Wheatley. 1998. Do Measures of Investor Sentiment Predict Returns? The Journal of Financial and Quantitative Analysis 33: 523. [Google Scholar] [CrossRef]
- Ni, Z. X., D. Z. Wang, and W. J. Xue. 2015. Investor sentiment and its nonlinear effect on stock returns-New evidence from the Chinese stock market based on panel quantile regression model. Economic Modelling 50: 266–74. [Google Scholar] [CrossRef]
- Niu, H., Y. Lu, and W. Wang. 2021. Does investor sentiment differently affect stocks in different sectors? Evidence from China. International Journal of Emerging Markets 18. [Google Scholar] [CrossRef]
- Obaid, K., and K. Pukthuanthong. 2022. A picture is worth a thousand words: Measuring investor sentiment by combining machine learning and photos from news. Journal of Financial Economics 144: 273–97. [Google Scholar] [CrossRef]
- Qazi, A., R. G. Raj, G. Hardaker, and C. Standing. 2017. A systematic literature review on opinion types and sentiment analysis techniques: Tasks and challenges. Internet Research 27: 608–30. [Google Scholar] [CrossRef]
- Rahman, M. R., and A. K. Misra. 2021. Bank Competition Using Networks: A Study on an Emerging Economy. Journal of Risk and Financial Management 14: 402. [Google Scholar] [CrossRef]
- Ravi, K., and V. Ravi. 2015. A survey on opinion mining and sentiment analysis: Tasks, approaches and applications. Knowledge-Based Systems 89: 14–46. [Google Scholar] [CrossRef]
- Reis, P. M. N., and C. Pinho. 2020. A new European investor sentiment index (EURsent) and its return and volatility predictability. Journal of Behavioral and Experimental Finance 27: 100373. [Google Scholar] [CrossRef]
- Reis, P. M. N., and C. Pinho. 2021. A dynamic factor model applied to investor sentiment in the European context. Investment Management and Financial Innovations 18: 299–314. [Google Scholar] [CrossRef]
- Rousseau, D. M., J. Manning, and D. Denyer. 2008. 11 Evidence in Management and Organizational Science: Assembling the Field’s Full Weight of Scientific Knowledge Through Syntheses. The Academy of Management Annals 2: 475–515. [Google Scholar] [CrossRef]
- Roy, S., A. K. Misra, P. C. Padhan, and M. R. Rahman. 2019. Interrelationship among Liquidity, Regulatory Capital and Profitability- A Study on Indian Banks. Cogent Economics & Finance 7: 1664845. [Google Scholar] [CrossRef]
- Schmeling, M. 2009. Investor sentiment and stock returns: Some international evidence. Journal of Empirical Finance 16: 394–408. [Google Scholar] [CrossRef] [Green Version]
- Shleifer, A., and L. H. Summers. 1990. The Noise Trader Approach to Finance. Journal of Economic Perspectives 4: 19–33. [Google Scholar] [CrossRef] [Green Version]
- Shleifer, A., and R. W. Vishny. 1997. The Limits of Arbitrage. The Journal of Finance 52: 35–55. [Google Scholar] [CrossRef]
- Sibley, S. E., Y. Wang, Y. Xing, and X. Zhang. 2016. The information content of the sentiment index. Journal of Banking & Finance 62: 164–79. [Google Scholar] [CrossRef]
- Singh, V. K., P. Singh, M. Karmakar, J. Leta, and P. Mayr. 2021. The journal coverage of Web of Science, Scopus and Dimensions: A comparative analysis. Scientometrics 126: 5113–42. [Google Scholar] [CrossRef]
- Smales, L. A. 2017. The importance of fear: Investor sentiment and stock market returns. Applied Economics 49: 3395–421. [Google Scholar] [CrossRef]
- Smales, L. A. 2021. Investor attention and global market returns during the COVID-19 crisis. International Review of Financial Analysis 73: 101616. [Google Scholar] [CrossRef]
- Stambaugh, R. F., J. Yu, and Y. Yuan. 2012. The short of it: Investor sentiment and anomalies. Journal of Financial Economics 104: 288–302. [Google Scholar] [CrossRef] [Green Version]
- Sun, L., M. Najand, and J. Shen. 2016. Stock return predictability and investor sentiment: A high-frequency perspective. Journal of Banking & Finance 73: 147–64. [Google Scholar] [CrossRef]
- Sun, Y., X. Zeng, S. Zhou, H. Zhao, P. Thomas, and H. Hu. 2021. What investors say is what the market says: Measuring China’s real investor sentiment. Personal and Ubiquitous Computing 25: 587–99. [Google Scholar] [CrossRef] [PubMed]
- Sureka, R., S. Kumar, S. Colombage, and M. Z. Abedin. 2022. Five decades of research on capital budgeting–A systematic review and future research agenda. Research in International Business and Finance 60: 101609. [Google Scholar] [CrossRef]
- Tetlock, P. C. 2007. Giving content to investor sentiment: The role of media in the stock market. Journal of Finance 62: 1139–68. [Google Scholar] [CrossRef]
- Tiwari, A. K., E. J. A. Abakah, C. O. Bonsu, N. K. Karikari, and S. Hammoudeh. 2022. The effects of public sentiments and feelings on stock market behavior: Evidence from Australia. Journal of Economic Behavior and Organization 193: 443–72. [Google Scholar] [CrossRef]
- Ur Rehman, M., I. D. Raheem, A. R. Al Rababa’a, N. Ahmad, and X. V. Vo. 2022. Reassessing the Predictability of the Investor Sentiments on US Stocks: The Role of Uncertainty and Risks. Journal of Behavioral Finance, 1–16. [Google Scholar] [CrossRef]
- Valencia, F., Gómez-A. Espinosa, and Valdés-B. Aguirre. 2019. Price Movement Prediction of Cryptocurrencies Using Sentiment Analysis and Machine Learning. Entropy 21: 589. [Google Scholar] [CrossRef] [Green Version]
- Văn, L., and N. K. Q. Bảo. 2022. The relationship between global stock and precious metals under COVID-19 and happiness perspectives. Resources Policy 77: 102634. [Google Scholar] [CrossRef]
- Xiao, Y., and M. Watson. 2019. Guidance on Conducting a Systematic Literature Review. Journal of Planning Education and Research 39: 93–112. [Google Scholar] [CrossRef]
- Xiong, X., Y. Meng, X. Li, and D. Shen. 2020. Can overnight return really serve as a proxy for firm-specific investor sentiment? Cross-country evidence. Journal of International Financial Markets, Institutions and Money 64: 101173. [Google Scholar] [CrossRef]
- Yang, C., and L. Zhou. 2016. Individual stock crowded trades, individual stock investor sentiment and excess returns. The North American Journal of Economics and Finance 38: 39–53. [Google Scholar] [CrossRef]
- Yang, S. Y., S. Y. K. Mo, and A. Liu. 2015. Twitter financial community sentiment and its predictive relationship to stock market movement. Quantitative Finance 15: 1637–56. [Google Scholar] [CrossRef] [Green Version]
- Yu, J., and Y. Yuan. 2011. Investor sentiment and the mean–variance relation☆. Journal of Financial Economics 100: 367–81. [Google Scholar] [CrossRef] [Green Version]
- Zhou, G. 2018. Measuring investor sentiment. Annual Review of Financial Economics 10: 239–59. [Google Scholar] [CrossRef]
- Zouaoui, M., G. Nouyrigat, and F. Beer. 2011. How Does Investor Sentiment Affect Stock Market Crises? Evidence from Panel Data. Financial Review 46: 723–47. [Google Scholar] [CrossRef]
Figure 1.
Flowchart depicting the process of selection of articles.

Figure 2.
Countries/territories–year-wise publications.

Figure 3.
Mapping based on authors from different countries.

Figure 4.
Country/territory collaboration map.

Figure 5.
Co-citation analysis based on cited authors.

Figure 6.
Most relevant sources.

Figure 7.
Bibliographic coupling.

Figure 8.
Citations based on sources.

Figure 9.
Most used terms used in titles.

Figure 10.
Mapping based on the keywords used by authors.

Figure 11.
Topic trends.

Table 1.
Summary of the recent reviews on sentiment analysis.
| Study | Methodology | Articles | Research Objective |
|---|---|---|---|
| Medhat et al. (2014) | MA | 54 | A comprehensive review of studies of sentiment analysis algorithms and applications |
| Ravi and Ravi (2015) | MA | Over 100 | Tasks, approaches, and applications of sentiment analysis. |
| Qazi et al. (2017) | MA | 24 | Challenges and types faced in classification techniques. How does adopting improved methods address the issue of traditional classification techniques? |
| Hussein (2018) | MA | 47 | How do sentiment analysis challenges affect sentiment evaluation? |
| X. Chen and Xie (2020) | BA | 4373 | Evolution of research topics with time. Coverage of research topics in sentiment analysis. Collaboration of significant contributors and their topic distributions. |
| Ghallab et al. (2020) | SLR | 108 | Review of studies based on Arabic sentiment analysis (ASA). What techniques are the most effective used for ASA? |
| Hajiali (2020) | SLR | 23 | What are the different big data methodologies used to construct investor sentiment? |
| Garg and Tiwari (2021) | BA | 1450 | Research trends in studies showing stock market prediction using social media sentiment. |
| This study | SLR + BA | 122 | In-depth review of studies on ISI. |
Note: SLR = systematic literature review, MA = meta-analysis, BA = bibliometric analysis. Source: authors’ own presentation.
Table 2.
Investor sentiment and stock market return.
| Effect | Empirical Findings |
|---|---|
| Stock market return | Baker and Wurgler (2006) showed that, for stocks without pay-out or profitability, and stocks with small size, high volatility, extreme growth, distress, and young age, the sentiment was low initially, but later returns were comparatively high. When sentiment was strong, these equities’ subsequent returns were low. Dash and Maitra (2018), using the nonlinear, nonparametric causality of Diks and Panchenko (2006), showed that Indian stocks with higher returns (small-cap and mid-cap) were more influenced by investor sentiment. A strong bidirectional causality existed between sentiment and returns of small-cap and mid-cap stocks. Tiwari et al. (2022) showed that the predictability between sentiments and industry stock returns was high in the normal market state but dropped during extreme bearish and bullish states. Reis and Pinho (2020) showed that volatility index (VIX) and VSTOXX, put and call ratios, gold, government bond yield spreads, mispricing, and economic and confidence sentiment indicators predicted stock returns after controlling fundamentals, macroeconomic, market, and technical analysis variables. |
| Stock price crash risk, volatility | Fu et al. (2021) showed the same directional association between stock price crash risk and firm-specific investor sentiment. S. Jiang and Jin (2021) revealed that stock return volatility was affected positively by sentiment. |
Source: Authors’ own presentation.
Table 3.
Sentiment and cryptocurrency.
| Effect | Empirical Findings |
|---|---|
| All cryptocurrencies | Naeem et al. (2021) showed a nonlinear relationship between cryptocurrencies and Twitter Happiness Sentiment (Ethereum, Ripple, Dash, Monero, Bitcoin, and Litecoin). Moreover, extreme sentiment predicted cryptocurrency returns (except Dash). Banerjee et al. (2022), based on thirty cryptocurrencies, showed a causality in cryptocurrency returns from news sentiment. |
| Bitcoin | Aharon et al. (2022) depicted a strong causality between cryptocurrency returns and the uncertainty shown in social media (especially for bitcoins). Mohsin et al. (2021) showed that investor sentiment significantly positively influenced Bitcoin returns. |
Source: Authors’ own presentation.
Table 4.
Sentiment and COVID-19.
| Effect | Empirical Findings |
|---|---|
| Stock Market | Văn and Bảo (2022) found that before the pandemic, precious metals positively influenced stock markets. Mezghani et al. (2021) observed two-way causality between the financial market and investor sentiment, which was at a peak during the Chinese recession and the pandemic. Pessimistic investors’ sentiment negatively impacted the banking, healthcare, and utility sectors. Duan et al. (2021) showed that sentiment on COVID-19 positively predicts stock returns and turnover rates. In addition, growth in sentiment also resulted in short-selling and high-margin trading. Goel and Dash (2021) found a moderating role of government policies on sentiment and stock return relationship. FEARS (“Financial and Economic Attitudes Revealed by Search Index”) significantly adversely affected the stock returns because of an increase in COVID-19 spread. |
| Crypto and Mutual Fund Market | French (2021) revealed that the Twitter-based Market Uncertainty (TMU) index had a high predictive power for Bitcoin returns, especially during the pandemic. The impact of information on Twitter on cryptocurrency markets intensified post-pandemic. Kumar and Firoz (2022) found that internet searches were at peak volume during the pandemic. During the high sentiment period, the mutual fund companies paid high dividends and received more cashflows. |
Source: Authors’ own presentation.
Table 5.
Sentiment and mutual fund market.
| Effect | Empirical Findings |
|---|---|
| Dividend | Kumar and Firoz (2022) showed that corporate policies and asset prices were influenced by dividend sentiment. Moreover, shifts in dividend sentiment predicted higher returns for stocks paying high dividends to their shareholders. In addition, the mutual funds had the intention to pay out and receive more cash inflows during strong dividend sentiment. |
| Fund Strategy | Massa and Yadav (2015) found that low Fund Sentiment Beta (FSB) funds performed better than high FSB funds, even if they controlled for the fund characteristics and standard risk factors. Moreover, relatively high exposure to stocks with low sentiment beta leads to disproportionate inflows. |
| Herd Behavior | Based on the UK market-wide ISI, Hudson et al. (2020) observed that the mutual fund managers were suffering from herd behavior. There was a causality from investor sentiment to the herd behavior of fund managers. Moreover, the sentiment factors affecting managers’ herd behavior were different and subject to fund structure. The herd behavior for open-end fund managers was initially negatively influenced by sentiment, which later sharply reversed to positive and then gradually returned to normal. On the contrary, investors’ sentiment positively affected the herd behavior of closed-end fund managers. |
Source: Authors’ presentation.
Table 6.
Investor sentiment index methodology.
| Study | Empirical Findings |
|---|---|
| Market proxy-based | Baker and Wurgler (2006) showed that initially sentiment was low, and then subsequent returns were comparatively high, for high-return stocks. On the contrary, high-return stocks earned comparatively low following returns when sentiment was high. |
| Search-Based | Da et al. (2015), using a Google-search-based ISI (FEARS), showed that the index could predict aggregate market return. The index was strongly related to VIX future returns. There was evidence of noise trading. Similarly, by building a positive sentiment index, Goel and Dash (2022) showed a positive correlation between the index and global stock returns, and the index had a non-symmetric impact on stock returns (especially for developed nations). However, Koo et al. (2019), following the same methodology but using NAVER search results, showed that the index (NAVER SVI) was negatively associated with market returns in the initial two weeks and then reversed in the later week. |
| Text Analysis | Gupta et al. (2021b), with the help of text analysis, showed that the computed sentiment score had a positive relationship with traditional underpricing (significant for pre-market underpricing but not for post-market underpricing). However, no evidence of the influence of the number of media articles on IPO underpricing was found to be significant. Similarly, He et al. (2022), conducting text analysis on newspapers, showed that sentiment was positively (negatively) associated with stock returns over the short (long) term. Firms with cleaner audit opinions, more analyst coverage, and non-state ownership had fewer chances of being overvalued in the short run. |
| Twitter Happiness Index | Bonato et al. (2021), with the help of Twitter’s daily happiness sentiment index, showed that RV was negatively related to the index. Moreover, the out-of-sample analysis revealed that extending the HAR-RV (Heterogeneous Autoregressive–Realized Volatility) model to include investor happiness improved the power of forecasts of volatility in the short and medium-term forecasts. Later, Văn and Bảo (2022), with the same Twitter index, found that prior to the pandemic, precious metals influenced stock markets in a positive manner, implying a demand for precious metals during crisis periods. |
| Picture Analysis | A recent study by Obaid and Pukthuanthong (2022), with the help of an analysis of pictures in financial newspapers, constructed an ISI (Photo Pessimism). Photo Pessimism can predict market trading volume and return reversals. The association was strongest in high fear periods and especially for the stocks withhigh limits to arbitrage. |
Source: Authors’ own presentation.
Table 7.
Regression techniques.
| Method | Empirical Findings |
|---|---|
| Quantile | Goel and Dash (2022) showed that the GREEDS index has a positive relation with global stock returns. Moreover, the index had an asymmetric effect on stock returns (stronger for developed countries). There was a spillover effect of the global index on the country/territory-specific indexes. |
| Backward Rolling | Khan et al. (2020) revealed the existence of one-way causality from the FEARS index to short- and medium-term stock returns. No evidence of all sector stock returns causing FEARS was found. |
| Predictive | Gong et al. (2022) observed that only NISI (New ISI) was effective and had robust predictability (even after controlling for the leverage effect) even in the crisis period. In addition, the NISI was superior in longer horizons forecasting. |
Source: Authors’ own presentation.
Table 8.
Causality technique.
| Effect | Empirical Findings |
|---|---|
| Linear | Debata et al. (2021) showed that one-way sentiment causes stock market liquidity (with different liquidity measures). The results still held after controlling for local sentiments. Ding et al. (2017) showed that oil price volatility caused a negative influence on investor sentiment in China (specifically in the long term). The influence was stronger and more significant, with an average delay of eight months. S. Liu (2015) found that the market had high liquidity in the high sentiment period, even after controlling for market trading activity. In addition, investor sentiment causes stock market liquidity. The sentiment positively influenced market trading activity. |
| Non-linear non-parametric | Balcilar et al. (2021) detected that economic sentiment has predictive power for housing returns and volatility. Dash and Maitra (2018), following Diks and Panchenko’s (2006) causality test, showed that sentiment influenced higher-return stocks (small-cap and mid-cap) significantly more than the stocks with lower returns (large-cap). Fear (VIX) performed better as a measure of sentiment. There was a solid two-way causality between sentiment and small- and mid-cap stock returns. |
| Linear and nonlinear integrated | Y. Jiang et al. (2018) opined that there was solid bilateral causality (both linear and nonlinear) between stock returns and investor sentiment in the long term but not in the short term. |
Source: Authors’ own presentation.
Table 9.
Five most influential studies.
| Author | Study | Journal | Citation | TLS |
|---|---|---|---|---|
| Baker and Wurgler (2006) | Investor Sentiment and The Cross-Section of Stock Returns | Journal of Finance | 5753 | 45 |
| Brown and Cliff (2004) | Investor Sentiment and The Near-Term Stock Market | Journal of Empirical Finance | 1699 | 43 |
| Baker and Stein (2004) | Market Liquidity as A Sentiment Indicator | Journal of Financial Markets | 1655 | 37 |
| Baker et al. (2012) | Global, Local, and Contagious Investor Sentiment | Journal of Financial Economics | 1011 | 45 |
| Schmeling (2009) | Investor Sentiment and Stock Return | Journal of Empirical Finance | 866 | 46 |
Note: TLS = total link strength, citation collected from Google Scholar as on 2 May 2022. Source: VOS viewer
Table 10.
Ten most frequent words.
| Terms | Frequency |
|---|---|
| Investor Sentiment | 86 |
| Behavioral Finance | 18 |
| COVID-19 | 17 |
| Stock Returns | 15 |
| Sentiment | 11 |
| Investor Sentiment Index | 10 |
| Stock Market | 10 |
| Machine Learning | 8 |
| Sentiment Analysis | 8 |
| Sentiment Index | 8 |
Source: VOSviewer.
Table 11.
Most globally cited documents.
| Studies | TC | TC per Year | Normalized TC |
|---|---|---|---|
| Baker et al. (2012) | 448 | 40.7273 | 7.7688 |
| Huang et al. (2015) | 311 | 38.875 | 3.9202 |
| H. Liu et al. (2020) | 204 | 68 | 18.5455 |
| Ding et al. (2017) | 89 | 14.8333 | 7.4685 |
| Ni et al. (2015) | 75 | 9.375 | 0.9454 |
| S. Liu (2015) | 57 | 7.125 | 0.7185 |
| Ji et al. (2019) | 48 | 12 | 4.6154 |
| Hu et al. (2020) | 40 | 13.3333 | 3.6364 |
| Ftiti and Hadhri (2019) | 39 | 9.75 | 3.75 |
| Sibley et al. (2016) | 38 | 5.4286 | 3.093 |
| Zhou (2018) | 35 | 7 | 3.8636 |
| H. Y. Liu et al. (2020) | 30 | 10 | 2.7273 |
| Valencia et al. (2019) | 30 | 7.5 | 2.8846 |
| H. Chen et al. (2014) | 29 | 3.2222 | 4.1429 |
| Apergis et al. (2018) | 22 | 4.4 | 2.4286 |
| Massa and Yadav (2015) | 22 | 2.75 | 0.2773 |
| K. Kim and Byun (2010) | 22 | 1.6923 | 1 |
| R. Chen et al. (2019) | 21 | 5.25 | 2.0192 |
| K. Kim et al. (2019) | 20 | 5 | 1.9231 |
| Balcilar et al. (2018) | 20 | 4 | 2.2078 |
Note: TC = total citations. Source: Biblioshiny.
Table 12.
Most locally cited documents.
| Study | Year | LC | GC | LC/GC Ratio (%) | NLC | NGC |
|---|---|---|---|---|---|---|
| Baker et al. (2012) | 2012 | 57 | 448 | 12.72 | 6.66 | 7.77 |
| Huang et al. (2015) | 2015 | 39 | 311 | 12.54 | 4.42 | 3.92 |
| Balcilar et al. (2018) | 2018 | 17 | 20 | 85 | 6.42 | 2.21 |
| Bekiros et al. (2016) | 2016 | 14 | 19 | 73.68 | 3.27 | 1.55 |
| Lu et al. (2012) | 2012 | 14 | 16 | 87.5 | 1.64 | 0.28 |
| Zhou (2018) | 2018 | 13 | 35 | 37.14 | 4.91 | 3.86 |
| Çepni et al. (2020) | 2020 | 10 | 10 | 100 | 10 | 0.91 |
| García Petit et al. (2019) | 2019 | 10 | 11 | 90.91 | 8.62 | 1.06 |
| Sibley et al. (2016) | 2016 | 10 | 38 | 26.32 | 2.33 | 3.09 |
| Reis and Pinho (2021) | 2020 | 7 | 7 | 100 | 7 | 0.64 |
Note: LC = local citations; GC = global citations; NLC = normalized local citations; NGC = normalized global citations. Source: Biblioshiny.
Table 13.
Suggestions from past studies.
| Study | Suggestions |
|---|---|
| He et al. (2022) | Researchers can use the Word2Vec technique that researchers can use to construct a sentiment dictionary for their purpose. |
| Khan et al. (2020) | Investigation of time-varying asymmetric impact on stocks. |
| Dash and Maitra (2018) | VIX was a better measure than the sentiment index. Is this true now? Why was the AD ratio insignificant in measuring investor sentiment? |
| Bekiros et al. (2016) | Validation of results using frequency-domain-based causality to detect causality at different time horizons. In addition, the robustness of the results can be verified with nonlinear models. |
| Cepni et al. (2021) | A comparative cross-country/territory analysis in emerging markets showing the impact of fiscal policy shocks contingent on sentiment levels. |
| Gupta et al. (2021b) | Extension of the study to other countries/territories. |
| Hudson et al. (2020) | A further extension may include market factors to examine institutional herding from different perspectives wherein a wider and deeper perspective is required. |
| Ni et al. (2015) | Because of the unique legal environment, the Chinese market needs more academic attention. Factors such as policies, regulations, culture, and psychological factors of individuals can be considered in future studies. |
| H. Chen et al. (2014) | The multiple-threshold variable model can be used instead of the single-threshold variable model. In addition, a duration-dependent Markov switching model (Maheu and McCurdy 2000) with the transition probabilities for classifying different market states can be used. |
| Tiwari et al. (2022) | The effects of public sentiments on other markets can be extended. The influence of factors such as liquidity variations, EPU, and geopolitical risk can be examined in different markets. |
| Baker et al. (2012) | Extension of the contagion effect of investor sentiment within and across international markets. |
Source: Authors’ own presentation.
Disclaimer/Publisher’s Note: The statements, opinions and data contained in all publications are solely those of the individual author(s) and contributor(s) and not of MDPI and/or the editor(s). MDPI and/or the editor(s) disclaim responsibility for any injury to people or property resulting from any ideas, methods, instructions or products referred to in the content. |
© 2022 by the authors. Licensee MDPI, Basel, Switzerland. This article is an open access article distributed under the terms and conditions of the Creative Commons Attribution (CC BY) license (https://creativecommons.org/licenses/by/4.0/).
Share and Cite
MDPI and ACS Style
Prasad, S.; Mohapatra, S.; Rahman, M.R.; Puniyani, A. Investor Sentiment Index: A Systematic Review. Int. J. Financial Stud. 2023, 11, 6. https://0-doi-org.brum.beds.ac.uk/10.3390/ijfs11010006
AMA Style
Prasad S, Mohapatra S, Rahman MR, Puniyani A. Investor Sentiment Index: A Systematic Review. International Journal of Financial Studies. 2023; 11(1):6. https://0-doi-org.brum.beds.ac.uk/10.3390/ijfs11010006
Chicago/Turabian StylePrasad, Sourav, Sabyasachi Mohapatra, Molla Ramizur Rahman, and Amit Puniyani. 2023. "Investor Sentiment Index: A Systematic Review" International Journal of Financial Studies 11, no. 1: 6. https://0-doi-org.brum.beds.ac.uk/10.3390/ijfs11010006
Note that from the first issue of 2016, this journal uses article numbers instead of page numbers. See further details here.