Article

Spatiotemporal Evolution and Determinant Factors of the Intra-Regional Trade Community Structures of the Indian Ocean Region

1
Center for Geodata and Analysis, Faculty of Geographical Science, Beijing Normal University, Beijing 100875, China
2
School of Geographic Science, Harbin Normal University, Harbin 150025, China
*
Author to whom correspondence should be addressed.
ISPRS Int. J. Geo-Inf. 2021, 10(4), 214; https://0-doi-org.brum.beds.ac.uk/10.3390/ijgi10040214
Submission received: 29 December 2020 / Revised: 25 February 2021 / Accepted: 22 March 2021 / Published: 1 April 2021
(This article belongs to the Special Issue Geographic Complexity: Concepts, Theories, and Practices)

Abstract

:
The Indian Ocean Region (IOR) has become one of the main economic forces globally, and countries within the IOR have attempted to promote their intra-regional trade. This study investigates the spatiotemporal evolution of the community structures of the intra-regional trade and the impact of determinant factors on the formation of trade community structures of the IOR from 1996 to 2017 using the methods of social network analysis. Trade communities are groups of countries with measurably denser intra-trade ties but with extra-trade ties that are measurably sparser among different communities. The results show that the extent of trade integration and the trade community structures of the IOR changed from strengthening between 1996 and 2014 to weakening between 2015 and 2017. The largest explanatory power of the formation of the IOR trade community structures was the IOR countries’ economic size, indicating that market remained the strongest driver. The second-largest explanatory power was geographical proximity, suggesting that countries within the IOR engaged in intra-regional trade still tended to select geographically proximate trading partners. The third- and the fourth-largest were common civilization and regional organizational memberships, respectively. This indicates that sharing a common civilization and constructing intra-regional institutional arrangements (especially open trade policies) helped the countries within the IOR strengthen their trade communities.

1. Introduction

The Indian Ocean Region (IOR) has become one of the dominant geopolitical and economic forces globally [1,2,3,4,5]. Along with seeing a steady increase in the economy in general, the IOR has a number of trade and investment opportunities, including those of an intra-regional nature [6]. Countries in the region have attempted to promote intra-regional trade through several regional organizations and trade agreements (for example, the Indian Ocean Rim Association for Regional Cooperation and the South Asian Association for Regional Cooperation) [7]. Along with the development of its intra-regional trade, investigating the nature of the intra-regional trade flows is crucial to improve the understanding of the evolution of the extent of trade integration and the structure of trade flows within the IOR.
Trade is not only one of the main pillars of national economic structure [8,9] but also one of the most important interactions among countries [10,11,12,13]. Consequently, trade flows among countries have always been a particular focus of policymakers and scholars from multidisciplinary backgrounds, including economy [12,13,14,15,16,17,18,19], geography [20,21,22,23,24,25], social science [26,27,28,29,30], and political science [31,32,33,34]. Trade flows among countries can be represented as a network where trading countries are represented as nodes and trade flows from any one country to another are represented as dyad links between nodes.
A powerful tool to investigate the characteristics and the complex structure of trade flows between countries is social network analysis [8,17,18]. Social network analysis is defined as “a comprehensive paradigmatic way of taking social structure seriously by studying directly how patterns of ties allocate resources in a social system” [19]. Understanding the spatiotemporal evolution of trade structures from the perspective of networks helps improve our knowledge regarding the variations in regional or global trade integration, distribution of national wealth, and international crises [15,16,17,18,35].
Network study of international trade was first introduced by sociologists inspired by the theory of the world system. Snyder and Kick [36], first in 1979, applied the block model method, which is a method based on social network analysis and used to describe the roles of the actors (i.e., nodes) in a network, to partition the world countries into a core–periphery structure based on trade flows, diplomatic relations, military interventions, and treaty membership. Other studies have also identified a core, semi-periphery, and periphery world economic structure using social network analysis and trade flows at different times [26,27,28,29,30,37].
With the development of statistical indicators for social network analysis (such as, network density, clustering coefficient, and centralization index), some studies used a number of statistical measures related to complex networks to investigate whether the world trade network has the topological properties of a complex network [16,38,39,40,41,42,43,44,45]. For example, Serrano and Boguña confirmed that the world trade network in 2000 displayed scale-free degree distribution, small-world property, high clustering coefficient, and degree correlation between countries’ complex network characteristics [38]. Other studies applied several statistical measures to examine the extent of integration of world or regional trade networks. For example, Kali and Reyes [15] and De Benedictis and Tajoli [17] used network density to study global trade integration and found that the world trade network became more integrated over time but was far from being fully integrated.
With the development of network structure methods, several studies have introduced community detection or the minimum spanning tree (MST) technique to investigate the structure of trade networks. Community detection is a method of partitioning countries into different trading communities, that is, groups of countries with denser intra-trade ties but with extra-trade ties that are sparser among different communities. Barigozzi et al. [46] analyzed community structures of aggregated and commodity-specific trade networks using the community detection technique. They found that the community structures of commodity-specific trade networks were heterogeneous and much more fragmented than those of the aggregated-trade network over the period 1992–2000. Liu et al. [47] studied the world trade network based on the top trade relations using community detection, and they revealed a hierarchical structure mainly organized around the United States (the U.S.), China, and Germany. MST is an illuminating method for investigating the hierarchical structure of a network by extracting a subset of ties with the minimum strength (i.e., shortest distances) and connecting all the nodes. Maeng et al. [48] extracted a backbone network from the international trade network using the MST and identified the U.S. as a dominant hub. Moreover, using the MST method, Cepeda-López et al. [13] found that the structures of global trade networks were transformed from two groups led by the U.S. and Germany to three groups dominated by the U.S., Germany, and China during the 2008 global financial crisis. Additionally, some studies investigated regional trade networks, such as the European Union, the Association of Southeast Asian Nations, the Southern African Development Community, the South Asian Free Trade Area, and the Belt and Road Region [22,23,24,49,50,51].
Overall, the existing literature that explores the trade flows by applying social network analysis yields some interesting insights into the complex structures of the global or regional trade networks, as well as the positions of countries in the trade networks. However, two gaps exist: First, there is a lack of investigation into the extent of trade integration and into the IOR intra-regional trade network structure. As countries within the IOR have attempted to promote intra-regional trade by several regional organizations, investigating the extent of trade integration and the trade community structures (i.e., clusters of trading countries within a trade network) within the IOR is crucial. Second, to the best of our knowledge, there is still a lack of research that evaluates the correlation of potential determinant factors (especially cultural factors and regional organizations) between the IOR trade community structures. Considering the diverse civilization, and regional organizations within the IOR, it is noteworthy to explore how these factors affect the formation of the community structures of the IOR intra-regional trade network.
Based on these issues, we aim to address the following questions: What is the extent of integration of the IOR intra-regional trade? What are the community structures of its intra-regional trade networks? How do the IOR trade community structures correlate with the communities based on several potential determinant factors, including geographical proximity factors, cultural proximity factors, regional organization membership, and economic size (described in Section 2.2)? Specifically, we construct directed and weighted intra-regional trade networks of the IOR from 1996 to 2017 and employ statistical indicators and the community detection method, based on social network analysis, to investigate the extent of intra-regional trade integration and trade community structures within the IOR, respectively. Furthermore, we evaluate the factors that determine the formation of the IOR trade community using normalized mutual information entropy.
The remainder of this article is organized as follows. Section 2 describes trade flows data of the IOR and the measures of trade integration, community detection method of social network analysis, and normalized mutual information entropy. Section 3 analyzes the extent of trade integration within the IOR, the evolution of the IOR trade community structures, and the impact of determinant factors on the formation of the trade community structures within the IOR. Finally, Section 4 concludes, discusses the results, and presents future research directions.

2. Data and Methods

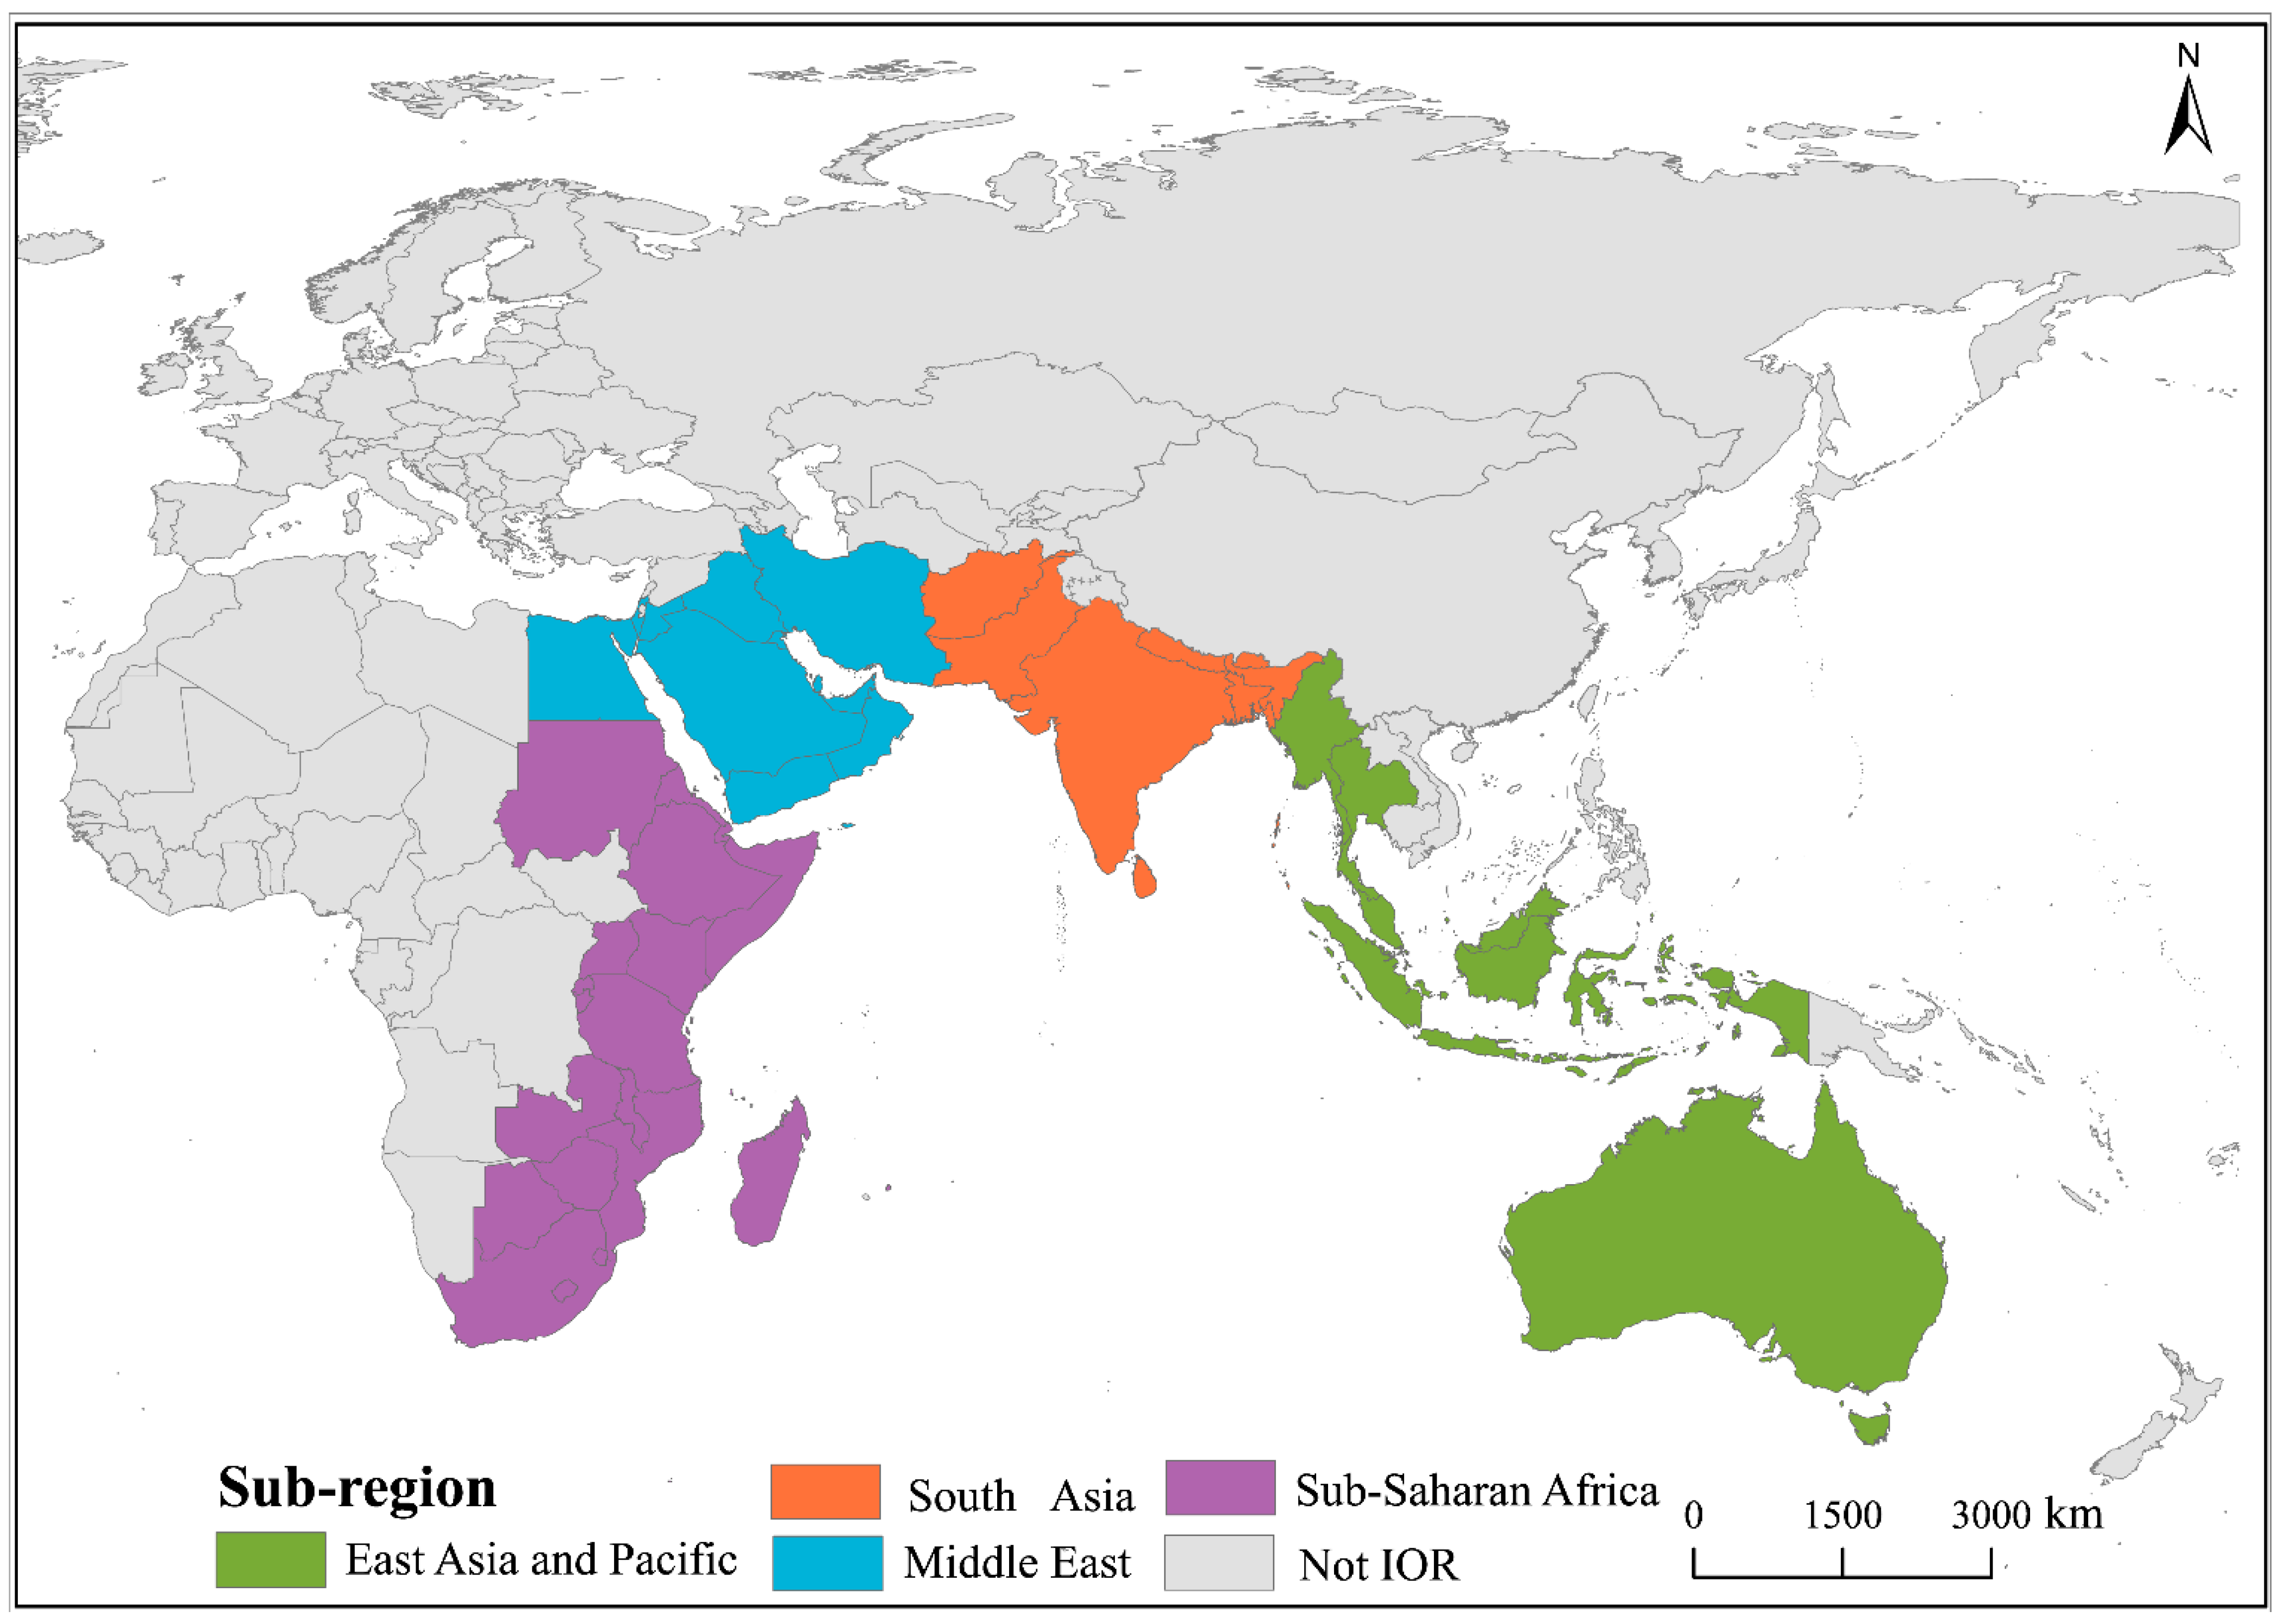
2.1. Study Area of the Indian Ocean Region

To investigate the intra-regional trade within the IOR, we need to determine which countries belong to this region. According to the broad definition of the IOR, proposed by Bouchard and Crumplin [1], the ocean itself is a fundamental element of the IOR, which then consists of the Indian Ocean and all its tributary waters (the Persian Gulf, Red Sea, Andaman Sea, Malacca Strait, etc.), all the coastal countries, and the land-locked countries whose main transit routes to the sea are through the Indian Ocean [1].
By this definition, the countries in the IOR include 38 coastal and 13 land-locked countries, a total of 51 countries [1], of which 25 are Asian and 23 are African, as well as Australia, France, and the UK, as the latter two countries’ territories are distributed in the IOR [1]. Considering that the main bodies of France and the UK are located in Europe and ensuring the spatial continuity of this region, the IOR countries in this analysis include 49 countries (excluding France and the UK), located in four sub-regions: East Asia and the Pacific, South Asia, the Middle East, and sub-Saharan Africa (Figure 1). Table 1 lists the specific names of the 49 countries.
The IOR covers 68.556 million sq. km of sea and 31.695 million sq. km of national territories, accounting for approximately one-fifth of the world’s oceans and one-quarter of the global land area [1]. In 2017, the population of the IOR was 2.952 billion, accounting for approximately 39% of the world population. The IOR’s gross domestic product (GDP) reached USD 10,410 billion and accounted for 13% of the world GDP. Additionally, 20% of the IOR countries are high-income countries, 30% are low-income, and 50% are middle-income. Economic growth in this region is not saturated, and there is considerable potential for trade growth.

2.2. Data

2.2.1. Data of the IOR Intra-Regional Trade Flows

Trade flows between the 49 countries in the IOR over the period 1996–2017 were collected from the Atlas of Economic Complexity hosted by the Growth Lab at the Center for International Development, Harvard University. A sequence of intra-regional trade networks G (N,E,W,T) for the year t (t = 1996, ⋯, 2017, T = 22) based on exports between countries in the IOR was constructed. Here, N and E denote the nodes and the export links between the nodes, respectively, and W denotes the adjacency matrix, with element wij,t representing the export flow (i.e., export trade value, measured in the current value of the USD) from country i to country j in the year t. Further, G contains both the direction and the strength of trade flows, that is, G is a sequence of directed and weighted networks.
The statistics were implemented in R software using packages of igraph, SNA, and NMI. Community detection and visualization of graphs were performed using Gephi software. Choropleth maps were performed using ArcGIS.

2.2.2. Data of the Determinant Factors

To investigate the extent to which the formation the IOR trade community structures is related to the determinant variables, several main variables were selected and collected based on existing studies on the trade-related community structure [6,9,52,53,54,55] and data availability. These variables are classified into four types and several sub-types, including macro-area geographical partitions, inverse capital distances between countries, contiguity between countries, civilization groups, common official language, regional organization membership, and economic size (Table 2).
Geographical proximity factors, commonly used as a proxy of lower trade friction (e.g., trade fees) [9,16,46,52,56,57], facilitate the increase in dyad trade flows, and thus the formation of trade community. Based on several existing studies, geographical proximity factors were measured in three ways [9,16,46,52,56,57]. (1) The distance closeness matrix, the original data for which were obtained from Thurner et al. [58], was calculated as the inverse of geographical distance dij (measured in kilometers) between capitals to represent geographical closeness between pairs of countries [46,52,56]. (2) Macro-area geographical partitions of the 49 countries in the IOR were collected from the World Development Indicator (WDI) database of the World Bank, and each country was classified into a continent or a macro-area, as shown in Figure 1. (3) A binary matrix of contiguity, extracted from the Correlates of War Project (COW) mainly built by Stinnett et al. [59], was defined by whether any two countries are neighbors separated by a land boundary, by a river, or by waters within a 150-mile distance of each other.
Table 2. Data of the determinant variables.
Variable TypesSub-TypesNetwork TiesData Source
Geographical factorMacro-area geographical partitions-WDI
Distance closenessInverse of the capital distances dijThurner et al. [58]
ContiguityBinary value of 0,1COW [59]
Cultural factorCivilization groups-Huntington [60]
Common official languageBinary value of 0,1CEPII [61]
Regional organization membershipRegional organization membershipNumbers of major regional organizations any two countries joinCOW [59]
Economic condition Economic size (GDP)GDPi × GDPj/dijWDI
Note: The denotation of - implies that the variables of macro-area geographical partitions and civilization groups are already partitions and there is no need to construct networks. The five variables related to geographical and cultural factors were time-independent, while regional organization membership and economic size variables were both time-varying.
The most frequently used cultural proximity proxies are civilization types, common official language, and former colonial ties [56,57]. However, almost no colonial ties exist between the countries within the IOR given that the UK and France are not considered, and thus we only select the former two measures to proxy cultural factors. (1) Civilization groups of the IOR’s countries was based on the each country’s civilization types classified by Huntington [60], composed of Western, Orthodox, Islamic, African, Latin American, Sinic, Hindu, Buddhist, and “Lone” States. No country within the IOR belongs to the civilization types of Orthodox, Latin American, or Sinic. (2) The common official language matrix obtained from GeoDist CEPII [61] was assigned 1 when any two countries within the IOR shared a common official language and 0 otherwise. Trade is facilitated by the ease of communication when sharing a common language [58,59] and similar lifestyles and tastes between countries within the same civilization groups [60].
Regional organization membership obtained from the COW [59] was constructed as an undirected and weighted network defined by the numbers of major regional organizations joined by any two countries in the IOR. The underlying premise is that the expected trade flows between dyad counties would increase when the number of regional organizations they join increase. Major regional organizations related to the IOR countries are listed in Table A1 of Appendix A. Economic size, proxied as the demand size, was processed as a matrix whose elements are obtained by a gravity model according to existing literature [52,53], namely wij = GDPi × GDPj/dij, where GDPi and GDPj are the GDP of countries i and j, respectively.

2.3. Methods

2.3.1. Measures of Intra-Regional Trade Integration

Network density and clustering coefficient methods of social network analysis and intra-regional trade share, which is defined as the share of the total intra-regional trade value of the IOR to its total trade value, were used to address the extent of trade integration of the based on the IOR intra-regional trade networks from 1996 to 2017.
(1) Network density: One method for examining the extent of regional integration of the IOR trade network is network density [15,17,62]. Network density measures the proportion of the number of links (i.e., trade ties) present in the network to the maximum possible number of links. The density D for a directed and weighted trade network is given by
D = l / g ( g 1 ) ,
where l and n denote the number of actual trade links and the number of countries, respectively, wherein this measure ranges from 0 to 1; the density of a completely linked network is equal to 1, whereas the density of no ties is 0.
(2) Clustering coefficient: Considering the regional trade institutions and agreements constructed in the IOR, we are interested in the extent of its intra-regional multilateral trade relationships (i.e., multilateralism), which can be measured by the clustering coefficient [15]. In terms of trade networks, it represents the average probability that two given countries linked to the same third trading partner also have trade relationships. The clustering coefficient C is defined as the ratio of triangles formed by triples to all the triples in a network [63], as expressed in Equation (2).
C = 3 × N u m b e r   o f t r i a n g l e s N u m b e r   o f   a l l   t h e   t r i p l e s ,
Here, C ranges from 0 to 1. The extent of the intra-regional multilateral trade ties (i.e., multilateralism) is higher when the value of C is higher. In our study, the clustering coefficient was calculated for the directed trade network of the IOR.
(3) Intra-regional trade share (dependency): As a widely used method to measure economic integration [15,64], intra-regional trade share refers to the share of total intra-regional trade of one specific region to its total trade and thus reflects its dependence on intra-regional trade. In this study, the intra-regional trade share TD is defined as
T D = i j 49 m i j i = 1 49 m i × 100 % ,
where mij is the trade value (i.e., sum of weights or strengths) between countries i and j within the IOR and mi is the total trade value of country i in this region.

2.3.2. Community Structure Method

Community detection is an extensively used method to identify the communities (i.e., clusters or subgroups of nodes) of a wide range of network types [65,66]. It divides nodes in a network into several communities, which are groups of countries with denser intra-connections but where the extra connections among different communities are sparser [67]. Although many methods are available to perform community detection, the most promising and most commonly used method in trade network study is the modularity maximization technique [28,46,67].
To determine the trade community structures of the IOR and the communities based on the five determinant factors (except for macro-area geographical partitions and civilization groups, we used the Louvain algorithm of modularity optimization introduced by Blondel et al. [68]. This method has been shown to have good performance in a wide range of applications [69] and is the most widely used method to partition trade communities [22,24,28,47]. The brief procedure of the Louvain algorithm is to run iteratively by constantly moving the nodes in the communities and computing the modularity of the newly generated community until the modularity no longer increases and reaches its maximum value.
The modularity coefficient Q is a quantitative measure to assess how well separated are the communities of a network. In terms of a weighted network, Q is given by
Q = 1 2 m i , j ( w i j k i k j 2 m ) δ ( C i , C j )
where ki and kj denote the strength centrality of nodes i and j, respectively, and ci and cj denote the communities that nodes i and j belong to. Expression of δ ( C i , C j ) is equal to 1 when the nodes i and j belong to the same community and 0 otherwise. m = 1 2 i j w i j . Q ranges from 0 to 1, and a larger value indicates a better partition of a network [68].
Community division of the IOR trade network was repeatedly implemented a hundred times using the community detection function in Gephi software, and thus the trade community partition with the highest modularity coefficient was selected. Communities were constructed not only for the IOR intra-regional trade network but also for the networks based on the determinant variables, including geographical distance, contiguity, common official language, regional organization membership, and GDP, using the same community-detection algorithm of Louvain.

2.3.3. Community Comparison Method

Normalized mutual information entropy (NMI) proposed by Danon et al. [70] is a quantitative measure of the extent to which two community structures are similar. Scholars have used it to compare the community structures of trade networks and community structures based on determinant variables, such as geographical distance [46,52,53,54,55,71]. In this study, to evaluate whether the community structures of the IOR intra-regional trade can be explained by the determinant variables described in Section 2.2.2, we used the NMI to compare the trade community partitions with the community partitions based on the determinant factors within the IOR.
To clearly explain the NMI method, we define PA and PB as two community partitions and N as a confusion matrix, with the element Nij representing the number of nodes that appear both in the community i of PA and in the community j of PB. The formula for the NMI is given by
N M I ( P A , P B ) = 2 i = 1 C A j = 1 C B N i j log ( N i j N N i . N . j ) i = 1 C A N i . log ( N i . N ) + j = 1 C B N . j log ( N . j N )
where CA and CB denote the numbers of communities in partitions PA and PB, respectively, Ni. = ∑j Nij, N.j = ∑i Nij, and N=∑ij Nij. Values of the NMI range from 0, indicating that partitions PA and PB are dissimilar, to 1, indicating that partitions PA and PB are completely identical.

3. Results

In this study, we mainly focused on investigating the extent of integration of the IOR intra-regional trade network, identifying and analyzing the evolution of the trade community structures, and then evaluating the impact of the determinant factors on the formation of trade community structures of the IOR.

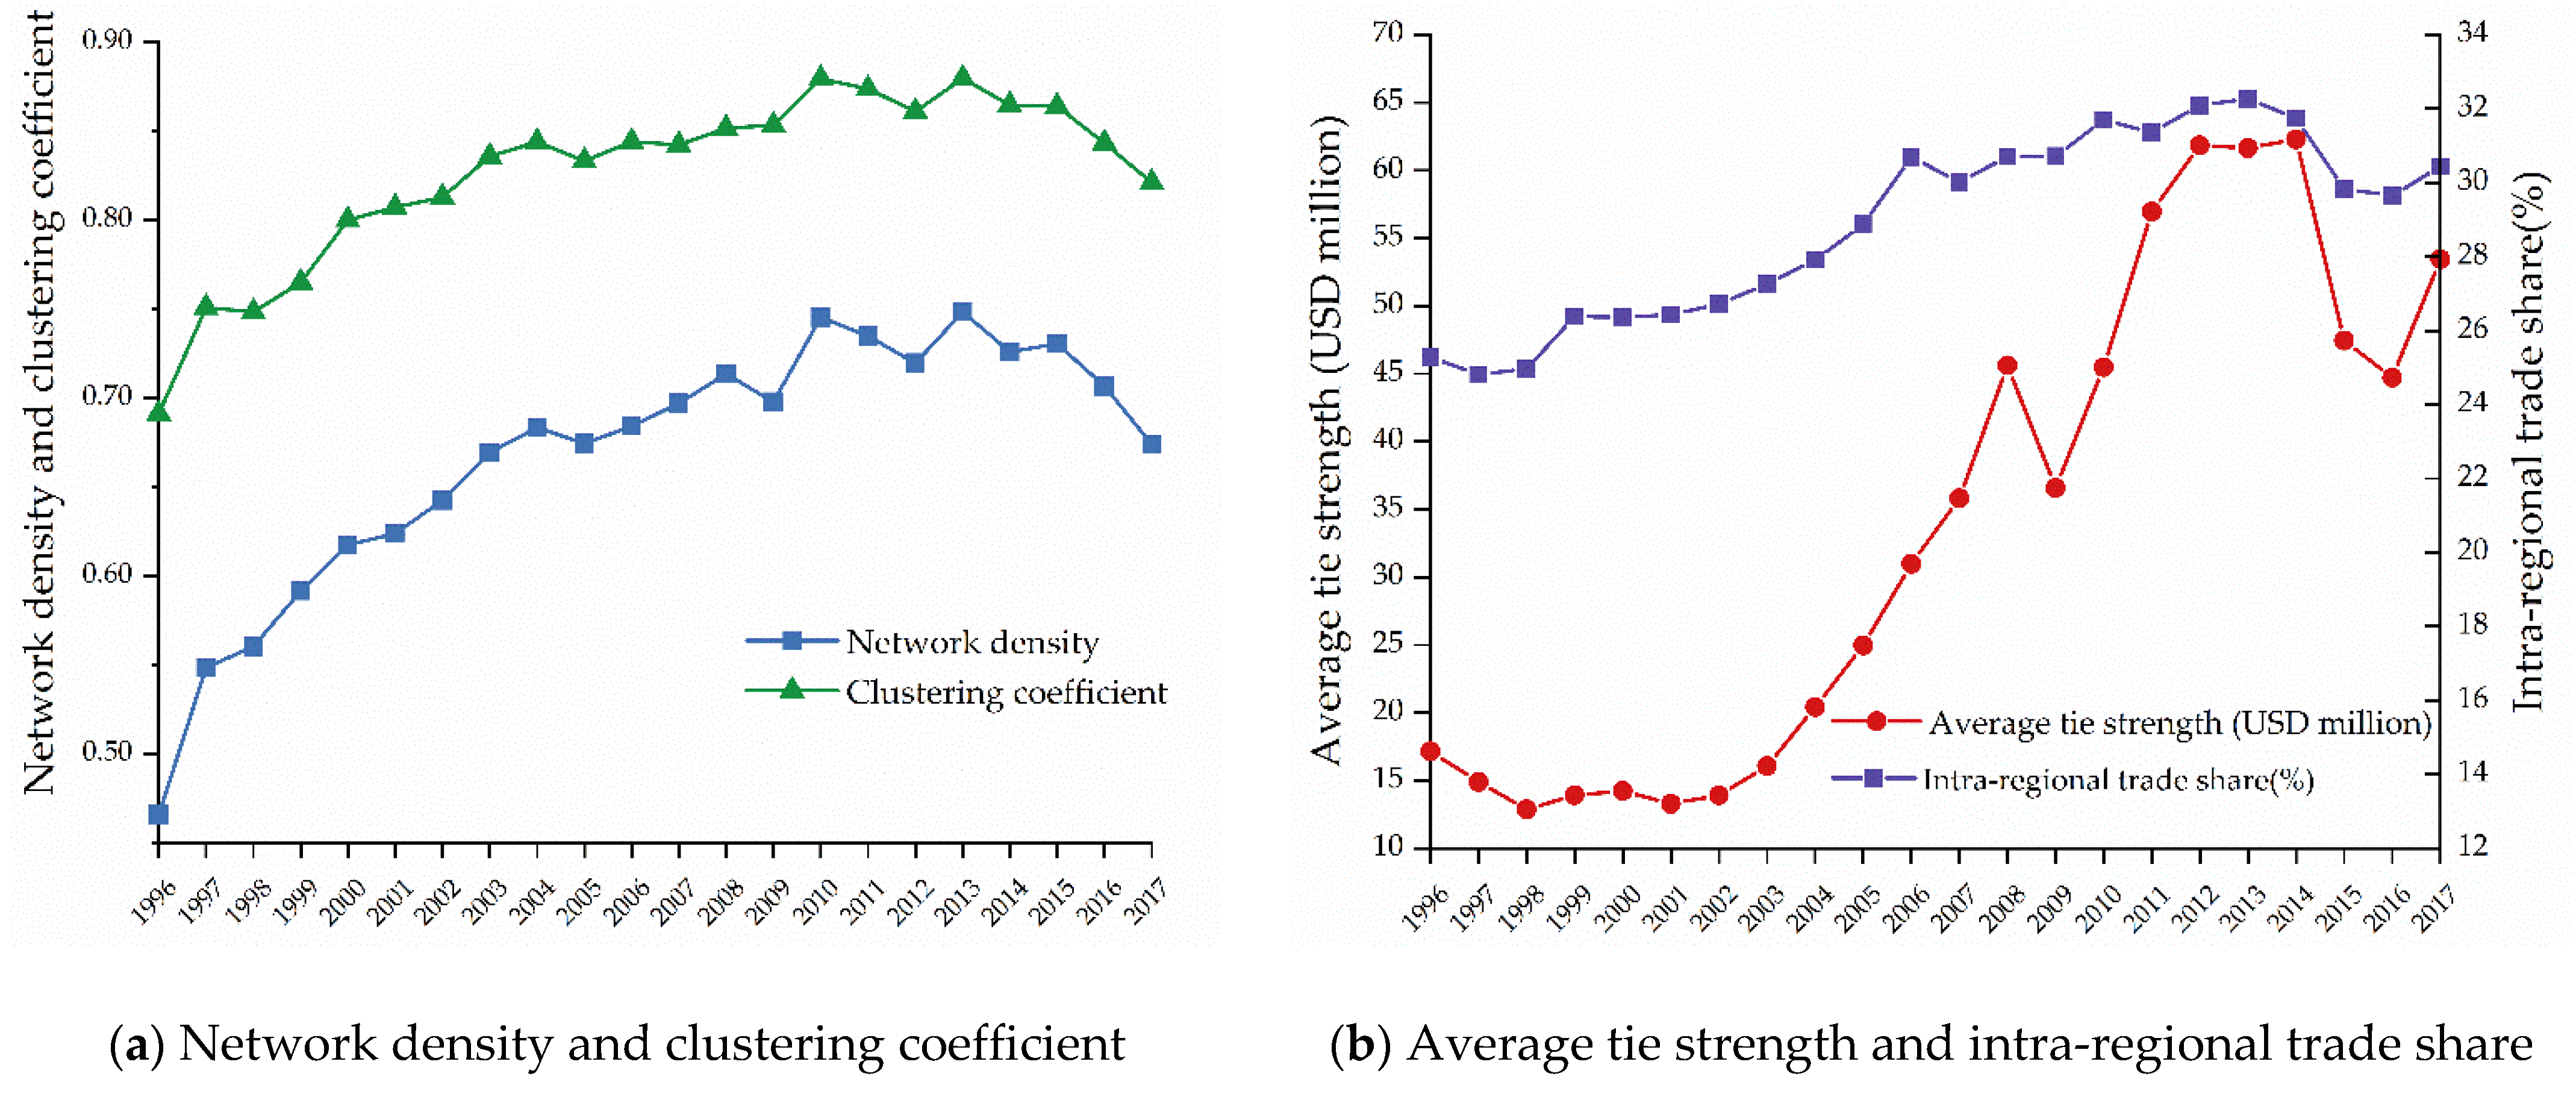
3.1. Extent of Integration of the IOR Intra-Regional Trade

We begin by investigating the evolution of the extent of trade integration within the IOR, based on its intra-regional trade networks from 1996 to 2017. The results of network density, clustering coefficient, average tie strength (i.e., average amount of trade flows), and trade share from 1996 to 2017 are presented in Figure 2. For each year, the number of edges (i.e., the number of trade links), the average degree (i.e., the average number of trade partners, including the sum of exports and imports), and the intra-regional trade value are also reported in Table 3.
The IOR intra-regional trade network grew rapidly, and the extent of trade integration improved markedly from 1996 to 2014. First, the IOR trade network became denser during this period as the number of trade flows grew from 926 in 1996 to 1707 in 2014. As a result, each country’s average number of trade partners increased from 41 to 70. Thus, the trade network density rose from 0.466 to 0.726. Second, the average amount of trade flows intensified, as indicated by the fact that the average tie strength rose from USD 17.14 million to USD 45.62 million. Third, the extent of multilateralism was fairly high and depicted an increasing trend, as suggested by the growth in the clustering coefficient (Figure 2b). Finally, the IOR’s intra-regional trade dependency also increased, as shown by the upward trend in the intra-regional trade share in Figure 2b. These results confirm that the extent of integration of the IOR intra-regional trade increased over this period.
In contrast, from 2015 to 2017, the IOR trade network shrank and the extent of regional trade integration generally declined. Due to the shrinking IOR trade network, the number of ties, the network density, the average tie strength, and the clustering coefficient decreased, which may be related to the decline in global bulk commodity prices, especially the sharp drop in global energy prices. Furthermore, the IOR intra-regional trade share generally showed a decreasing trend. These results indicate that, in general, the extent of IOR trade integration declined in this period.
It should also be noted that although the intra-regional trade network of the IOR shrank dramatically in 2009, along with the recession in the global trade network hit by the 2008 global financial crisis, it recovered robustly and almost all the statistics shown in Table 2 returned to the pre-crisis levels rapidly. These increasing trends indicated impressive resilience in the intra-regional trade in the IOR when affected by the global crisis in 2008. Although we can observe that the total trade value increased in 2017, it had not yet recovered to the 2014 level.
In general, the extent of the IOR intra-regional trade integration thus showed a strengthening trend during 1996–2017. This strengthening trend is combined with an in-crease in the number of ties, network density, average tie strength, clustering coefficient, and intra-regional trade share (Figure 2).
By this point, we have already acquired an understanding of the evolution of the extent of trade integration and the general characteristics of the intra-regional trade flows within the IOR. We have found that the IOR intra-regional trade network changed dramatically over the period 1996–2017. However, how these changes in the IOR intra-regional trade networks translated into the dynamics of its trade community structures remains unclear. Therefore, in the next section, we investigate the evolution of the community structures of the intra-regional trade network within the IOR.

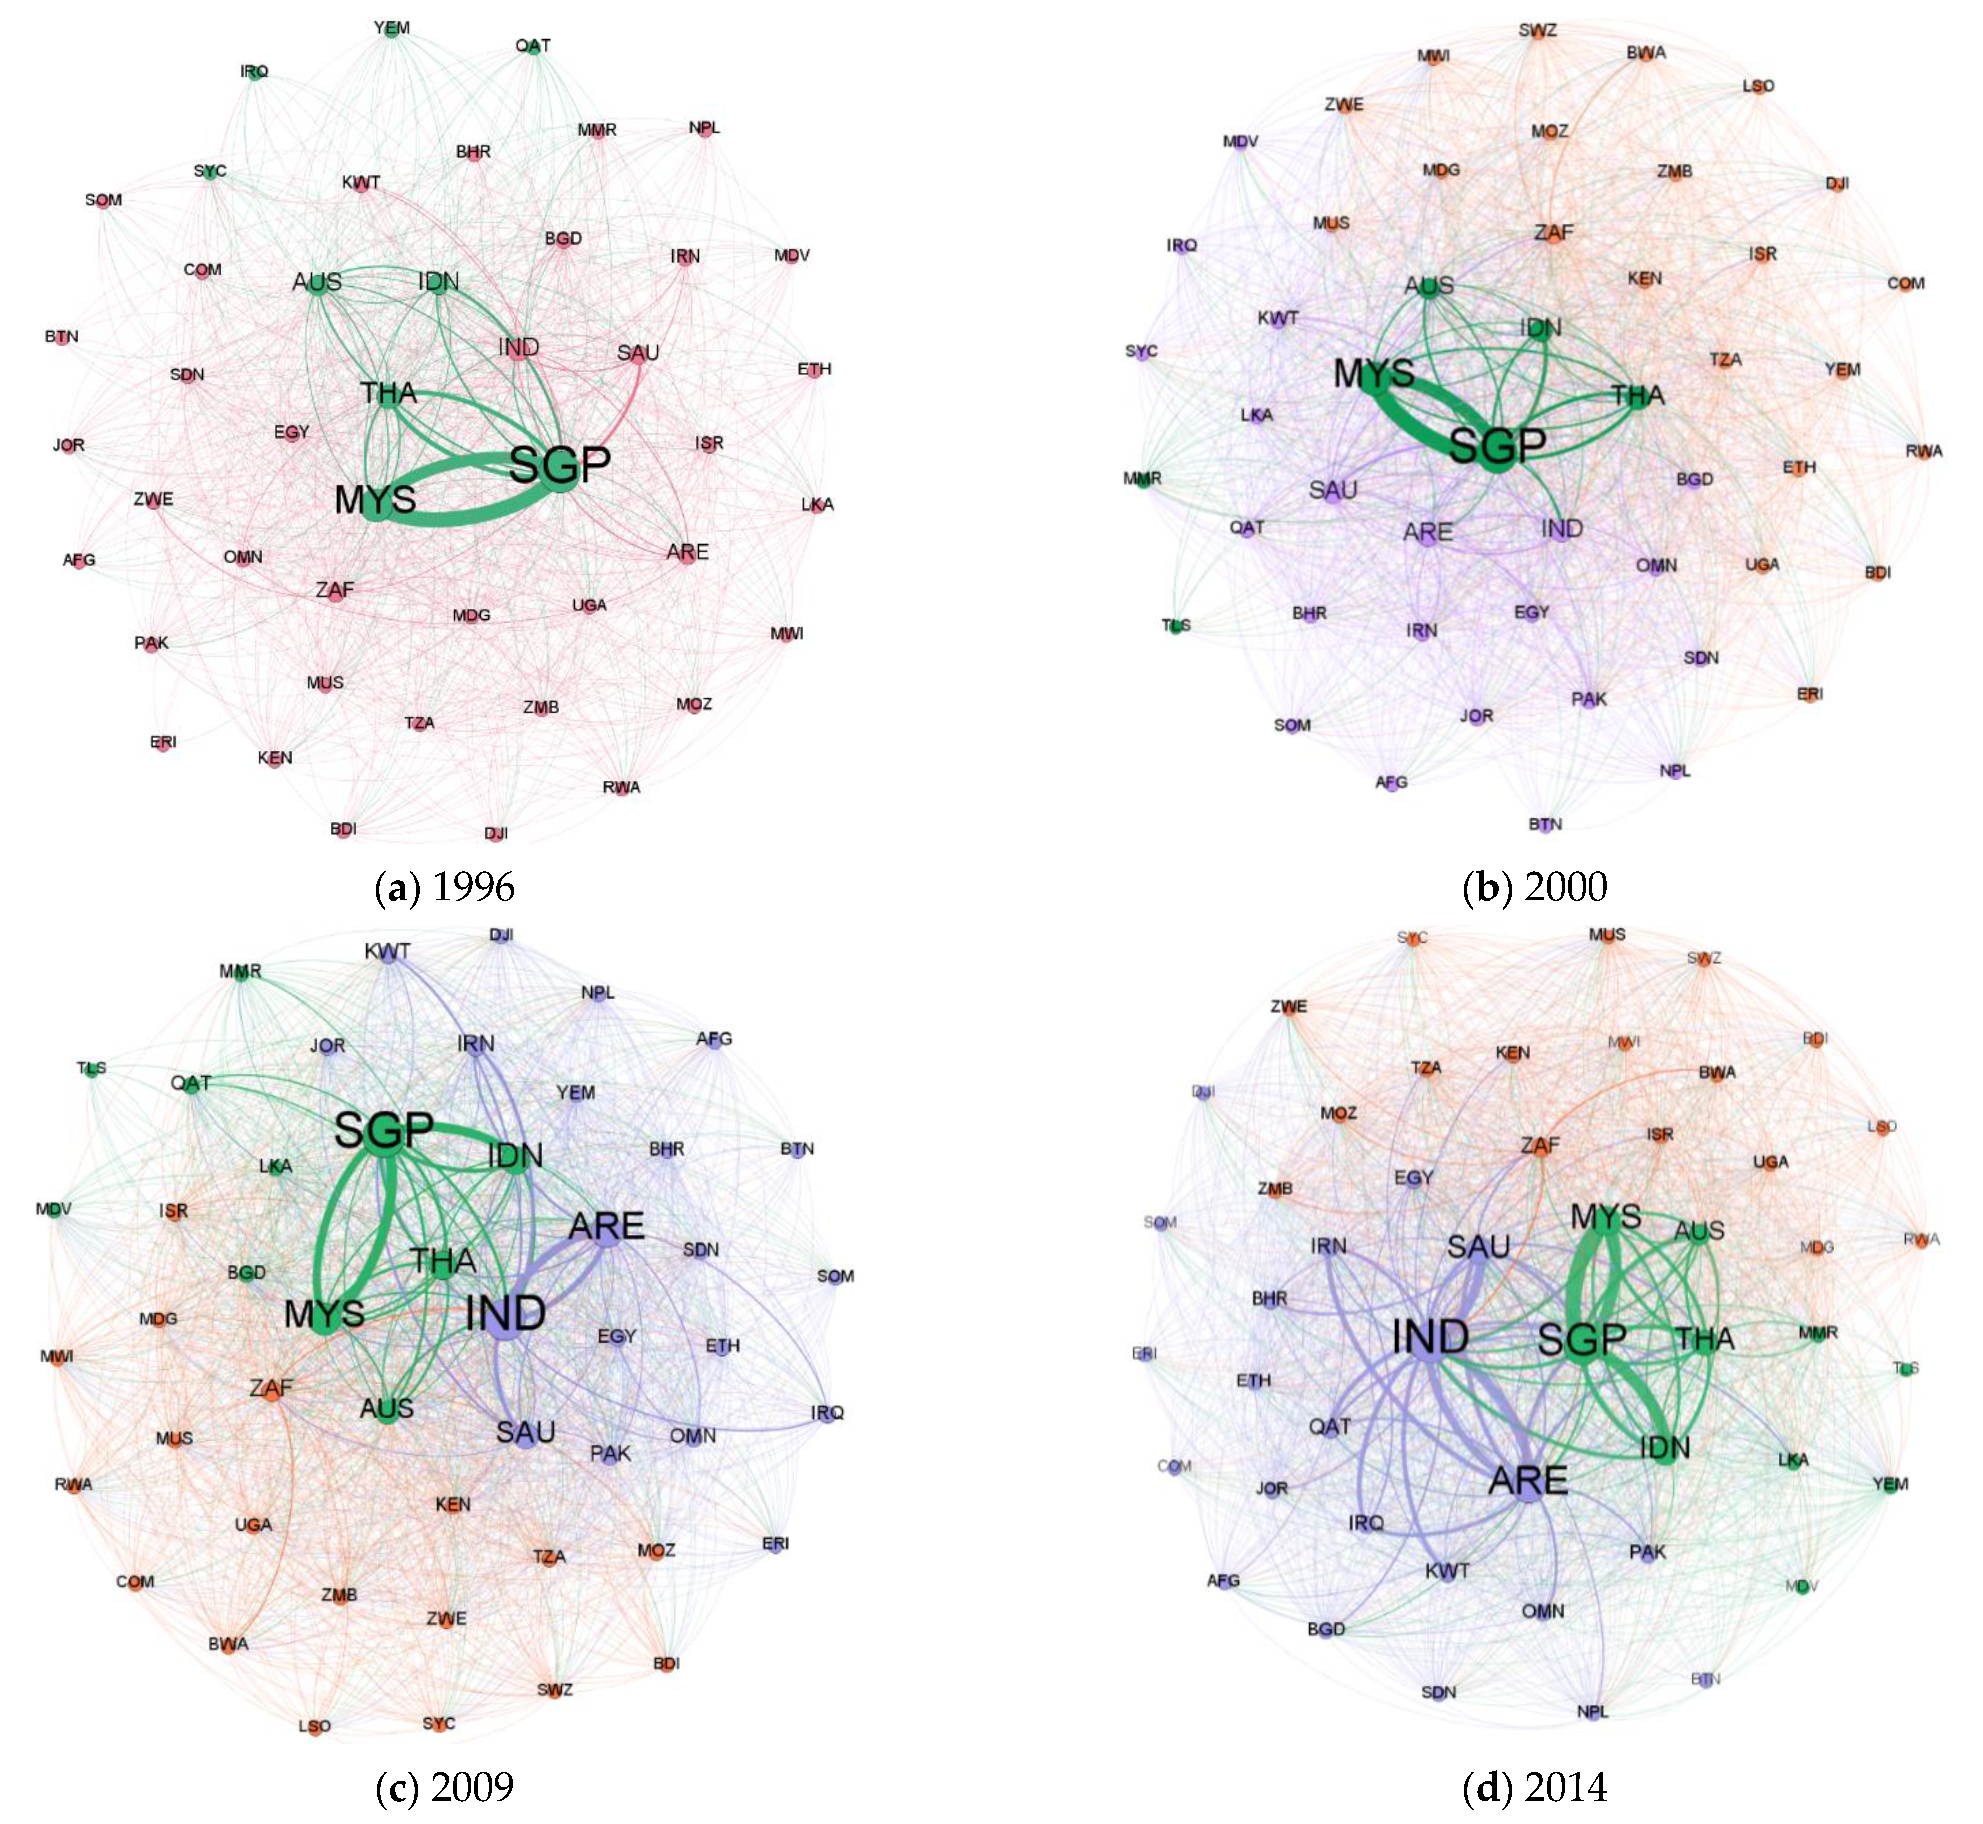
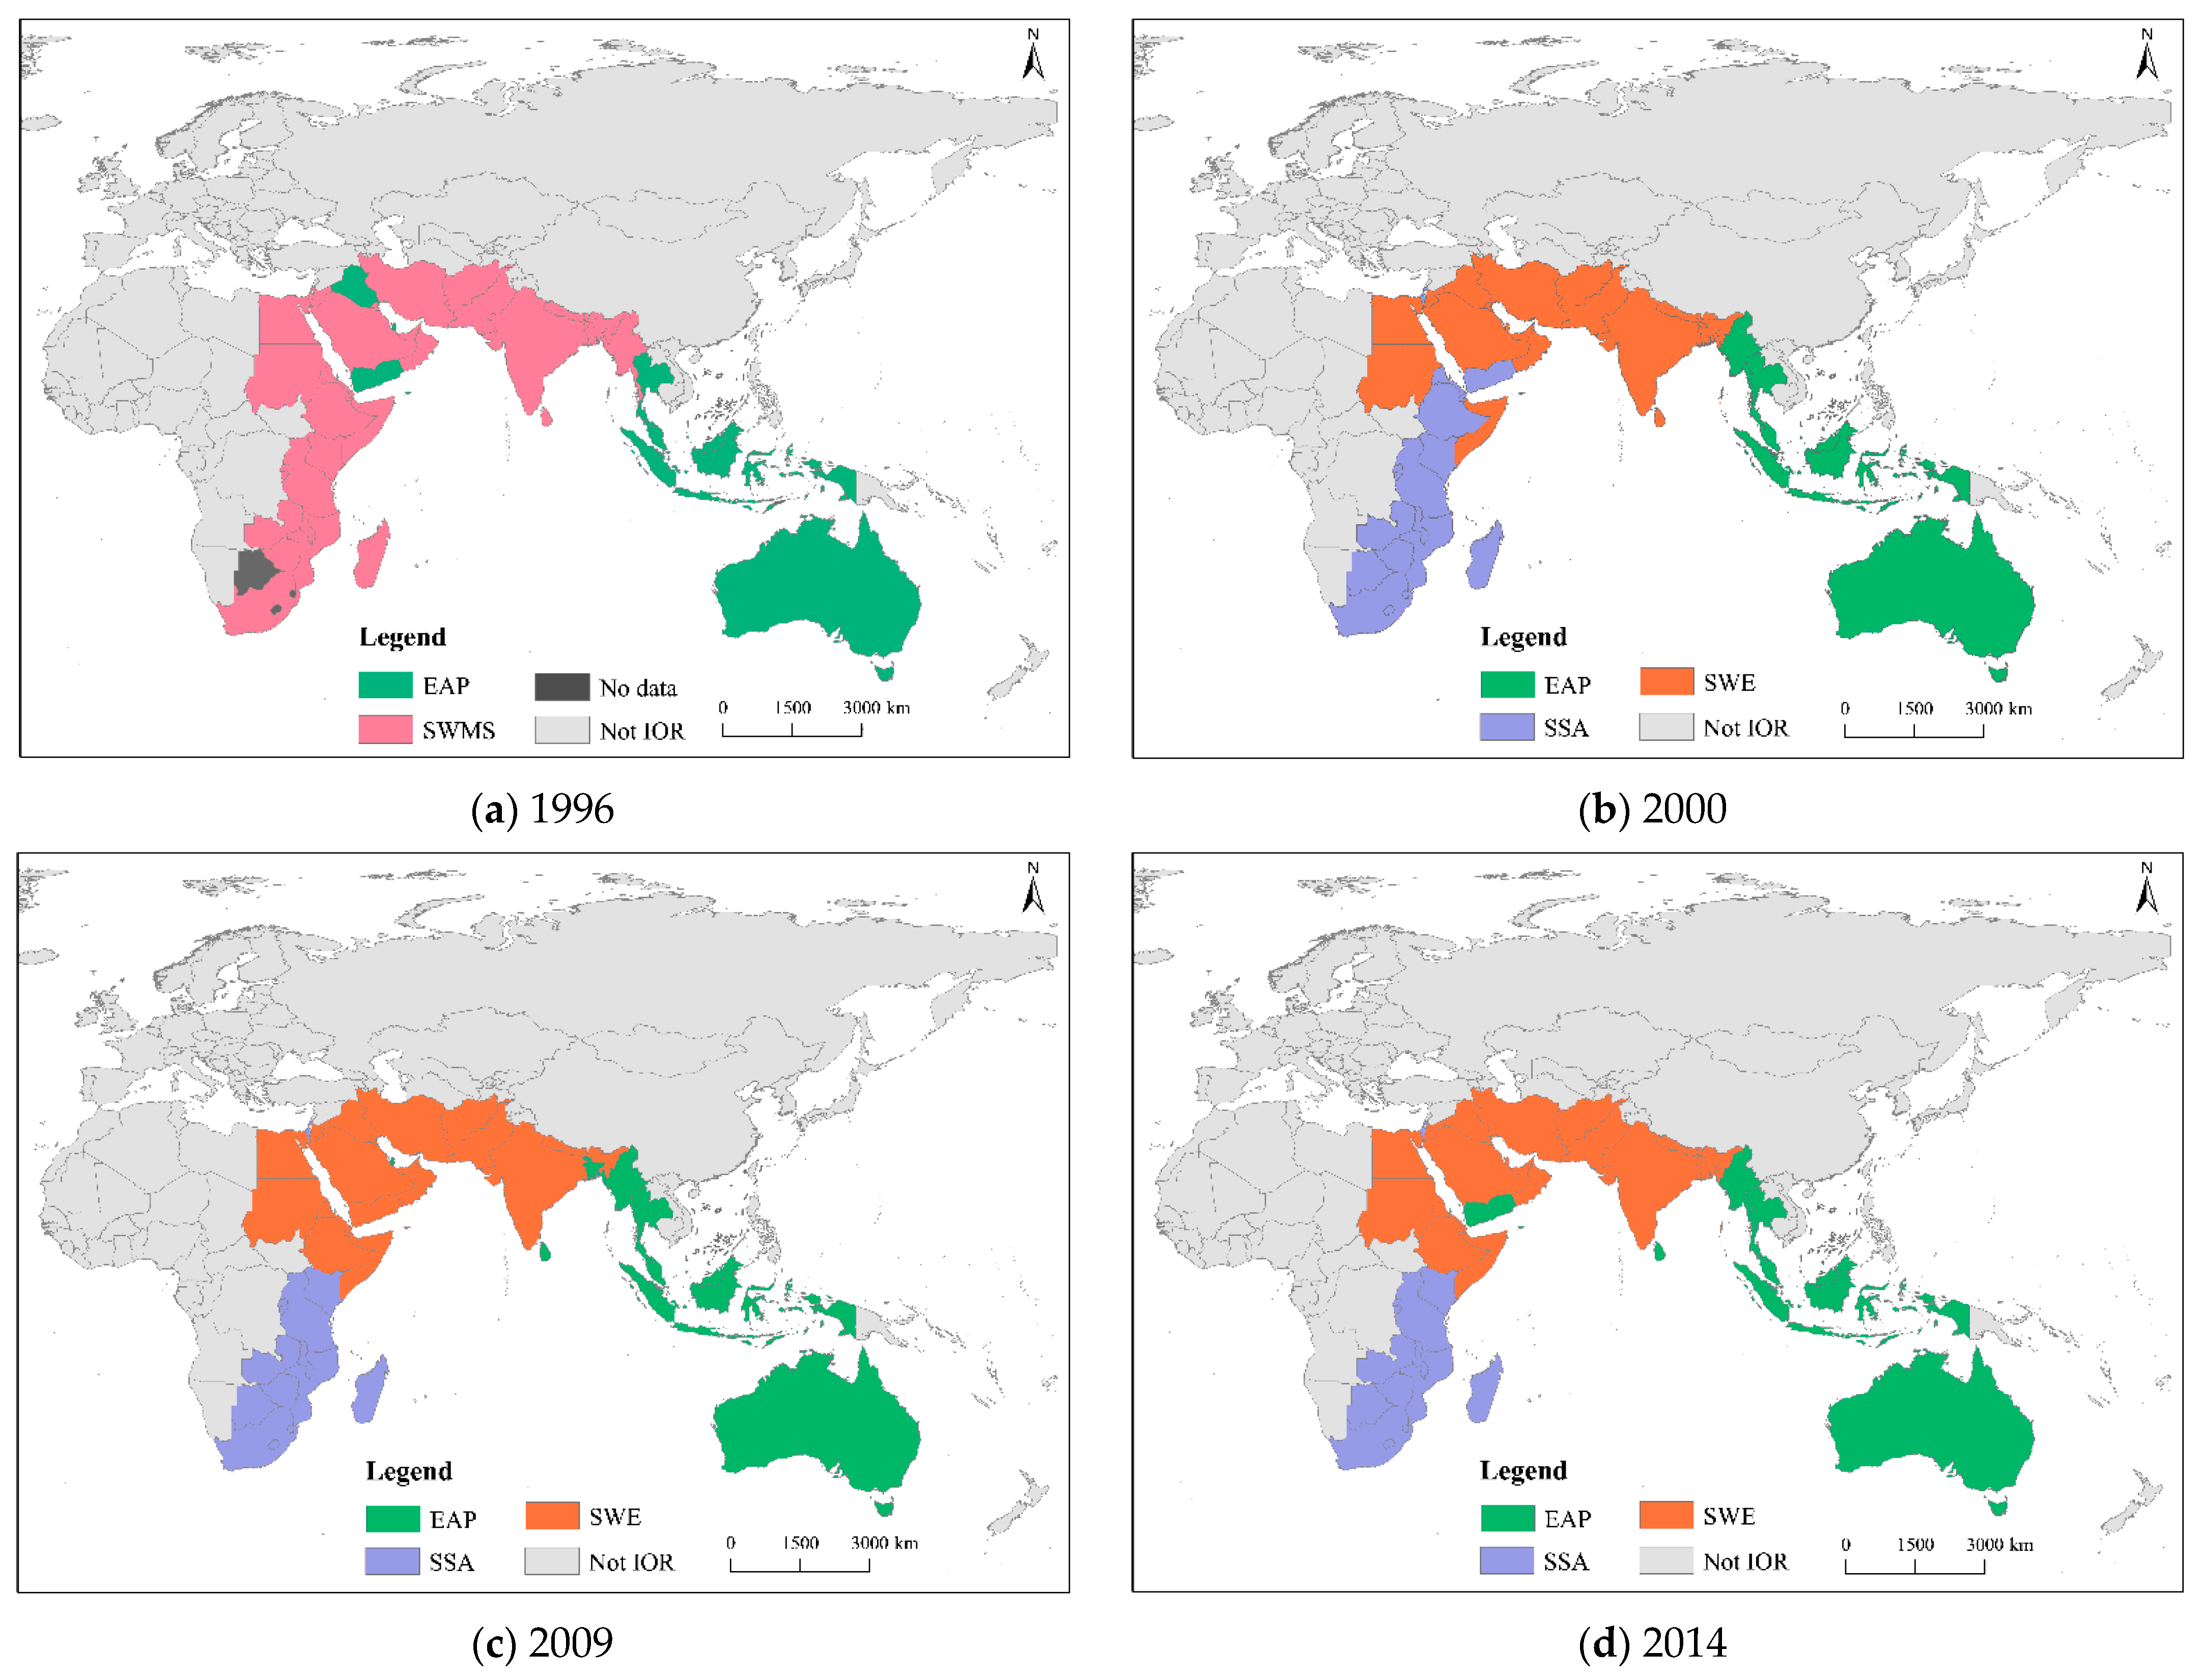
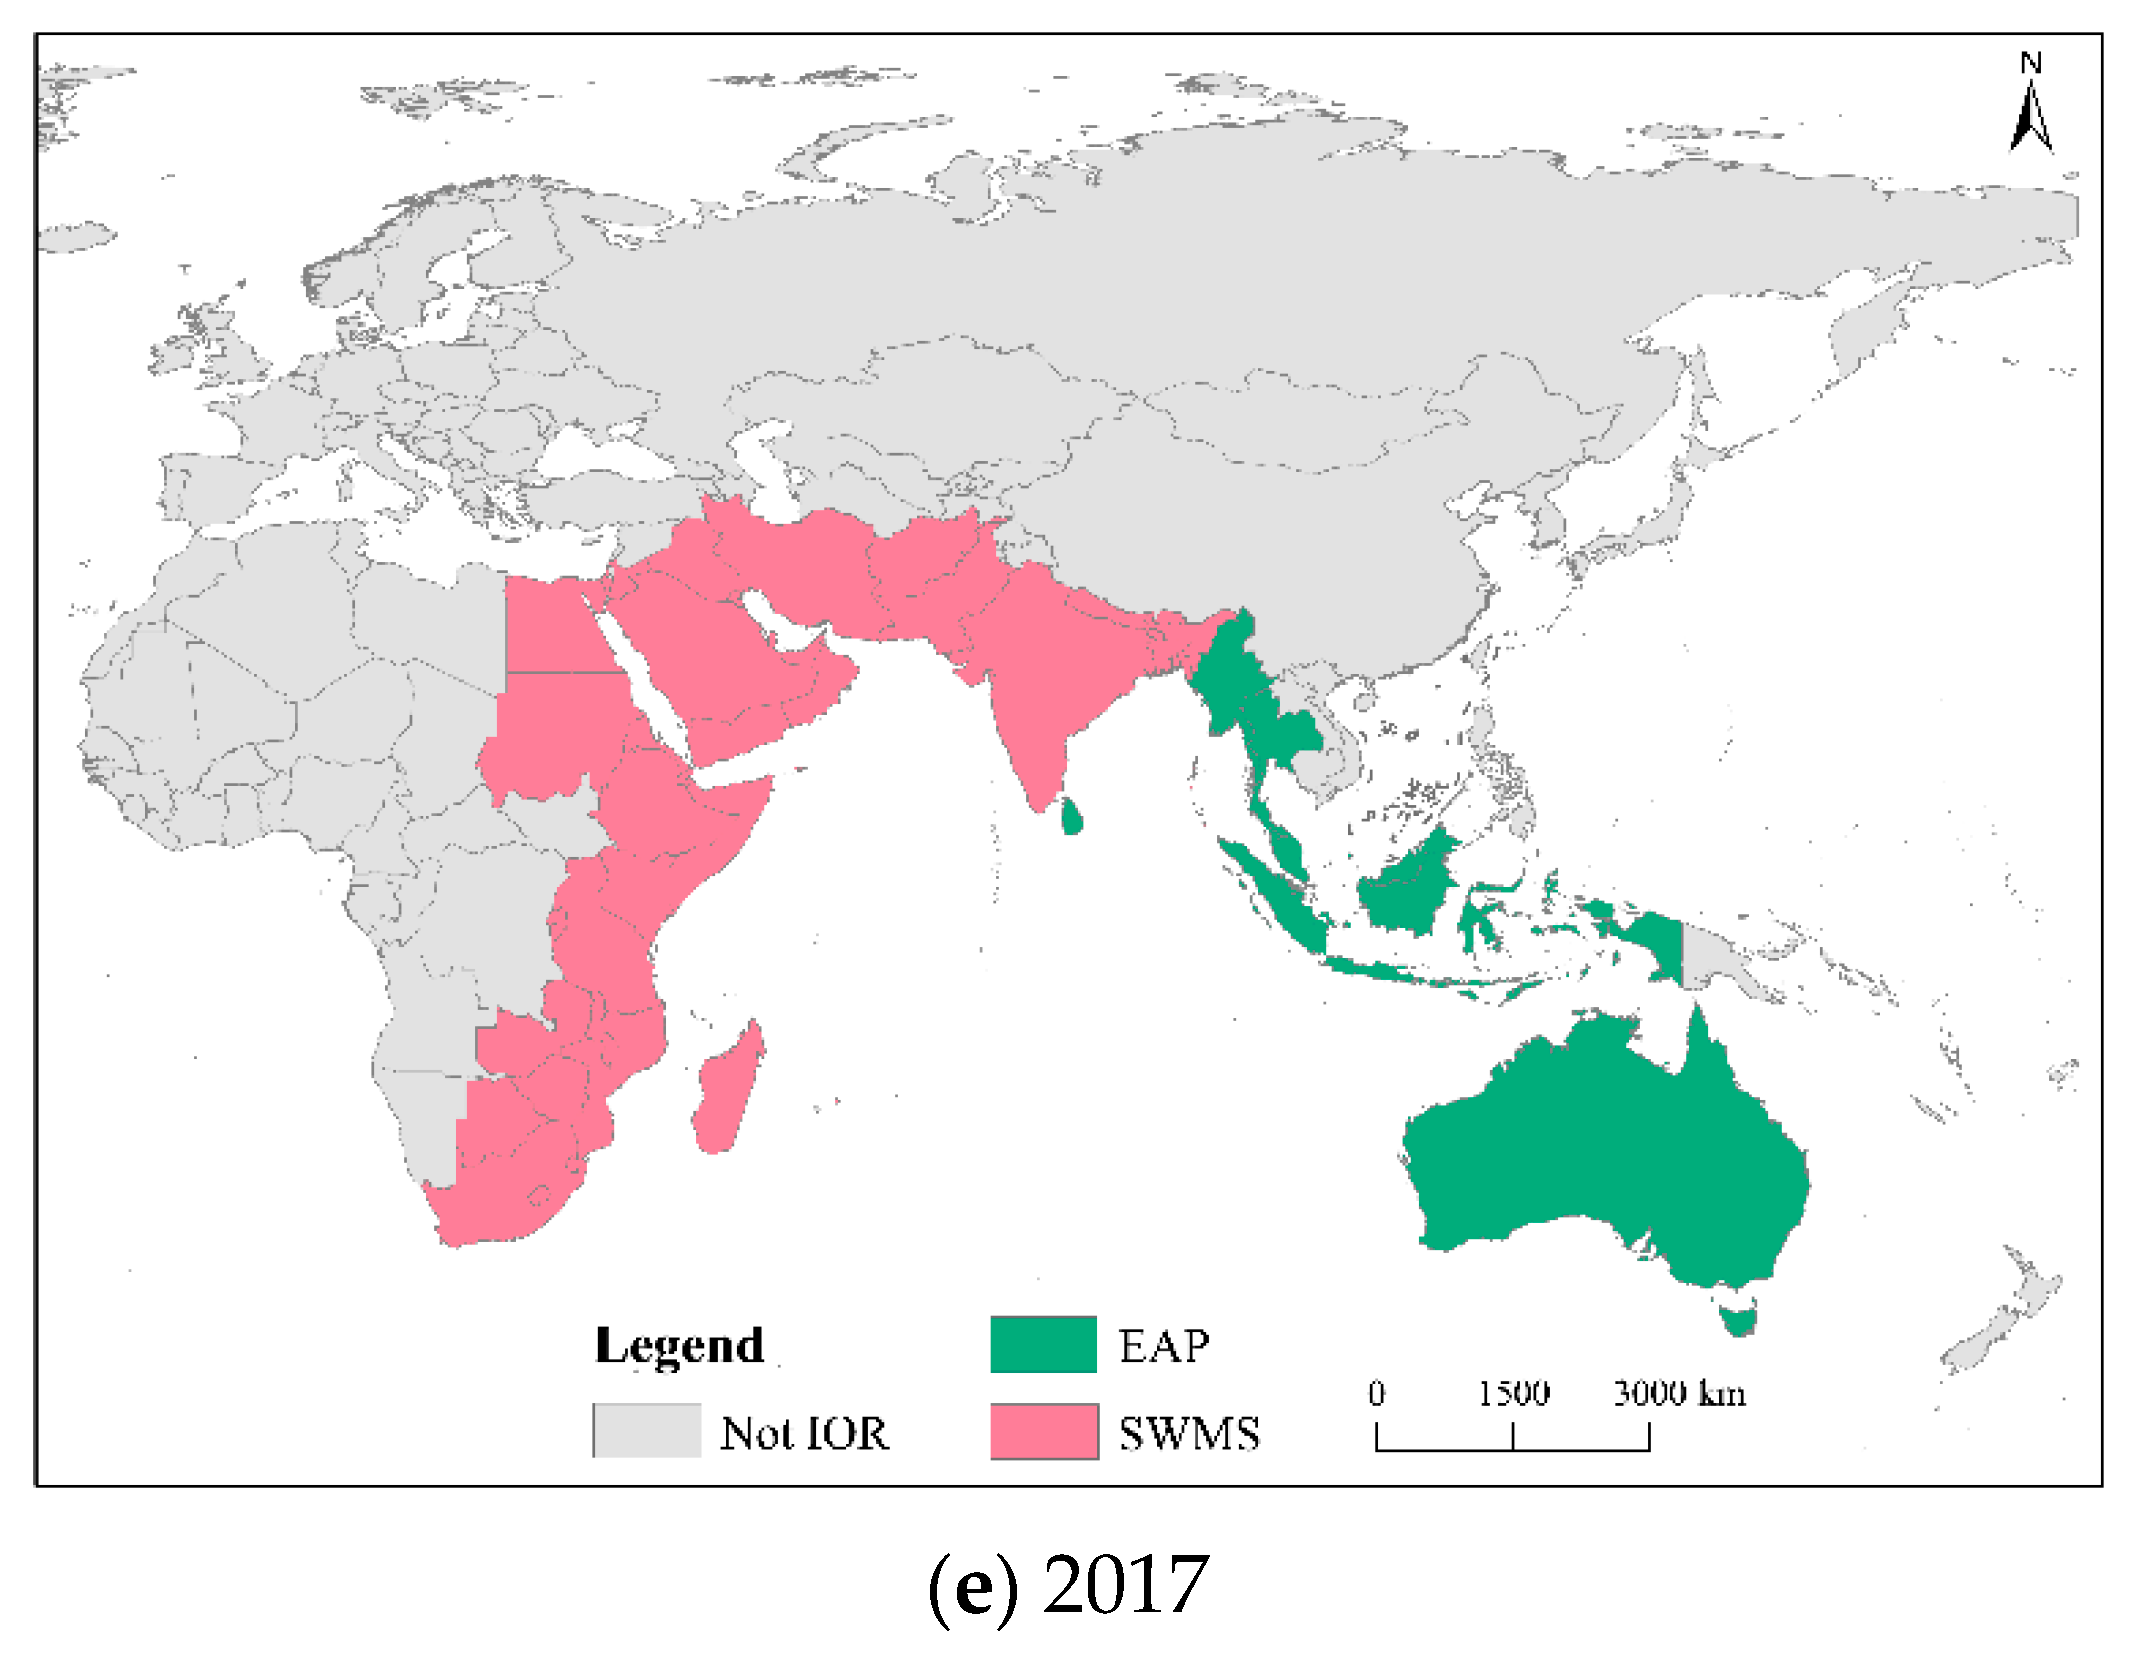
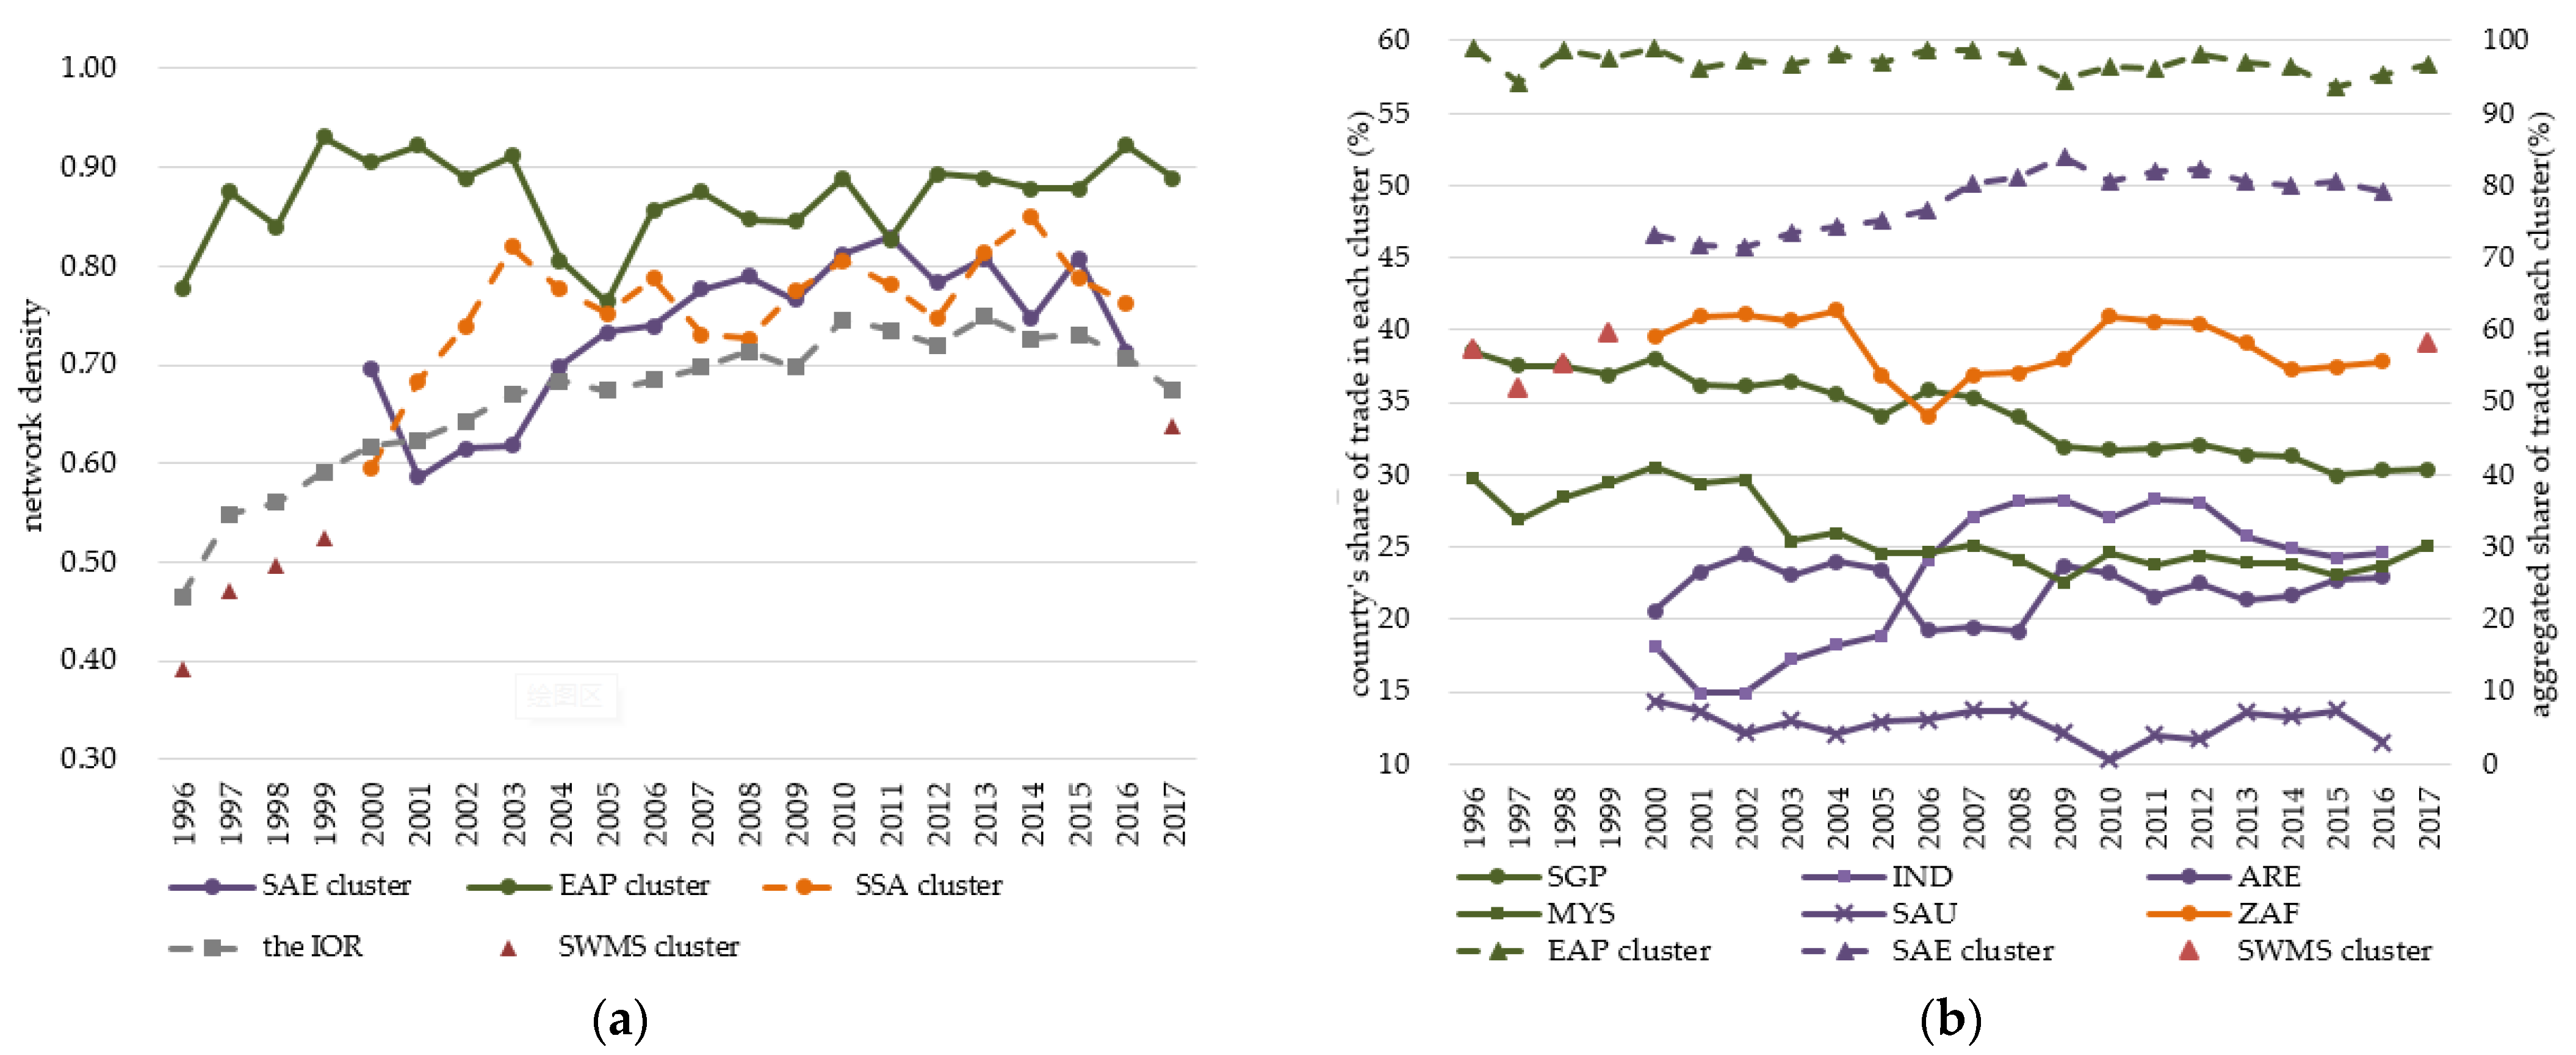
3.2. Spatiotemporal Evolution of the Community Structures of the IOR Intra-Regional Trade

This section investigates the community structures of the IOR intra-regional trade networks produced by the Louvain algorithm of the community detection method described in Section 2.3.2. An efficient way to address the trade community structures is to adopt the visualization approach of the trade network, wherein countries within the same community are assigned the same color, the number of trade flows is depicted by lines with different thicknesses, and the size of the ISO3 code for each country represents the strength centrality (i.e., the sum of the value of exports and imports). This type of visualization with all elements helps identify the most prominent countries in the trade network and the most valuable bilateral trade flows and illustrates the trade pattern and depicts country clusters, providing us with insights into the community structures of the IOR intra-regional trade networks. Furthermore, we plot choropleth maps to visualize more intuitively and vividly the trade community structures of the IOR.
The number of annual trade networks is 22, but analyzing each network is somewhat redundant. To address this problem, we selected trade networks that can capture the main changes and main trends during the period 1996–2017. First, we selected the first and the last year (i.e., 1996 and 2017). Second, we selected 2009, the year wherein the IOR trade network shrank substantially, given the sharp drop in average tie strength shown in Figure 2b. Third, we selected 2014, which was approximately the end year of the upward trend of the number of ties, network density, clustering coefficient, and value of intra-regional trade shown in Figure 2 and the modularity coefficient shown in Figure 3f. Finally, we selected 2000, as the IOR intra-regional trade fluctuated prior to this year. Thus, we selected the trade networks for the years of 1996, 2000, 2009, 2014, and 2017, which capture the main changes and trends in the IOR intra-regional trade networks during the entire period. The trade community structures of the IOR and the statistics of each community for each corresponding year are depicted in Figure 3, Figure 4 and Figure 5.
At the beginning of the time series, the trade network of the IOR was dominated by the three largest trading countries, namely Singapore, Malaysia, and Thailand, characterized by the trade flows between Singapore and Malaysia and those between Singapore and Thailand. As shown in Figure 3a and Figure 4a, the trade network was partitioned into two clusters. One cluster comprised five major traders in East Asia and the Pacific region (i.e., Singapore, Malaysia, Thailand, Indonesia, and Australia) and four countries with relatively lower trade values belonging to other areas (Figure 3a and Figure 4a). Thus, we called this cluster the East Asia and Pacific cluster (the EAP cluster). Although there were only nine countries in the EAP cluster, it accounted for 55% of the IOR intra-regional trade (Figure 5a), owing to the large value of trade flows, especially those between the five major traders within this cluster (Figure 3a). Another cluster, called the large cluster (hereinafter the SWMS cluster), was composed of a large number of countries located in South Asia, the Middle East, and sub-Saharan Africa. These included India, United Arab Emirates (ARE was used for simplicity and consistency with the IOS3 code listed in Table 2), Saudi Arabia (SAU), and South Africa as four leading countries (Figure 3a and Figure 5b). However, this large cluster’s total trade value accounted for only 16.78% of the IOR intra-regional trade due to the cluster’s relatively less connected trade network density(see Figure 5a) and low value of trade flows (Figure 3a).
By 2000, the trade network had produced three trade communities (Figure 3b and Figure 4b) due to the rapid increase in the intra-regional trade links of the IOR. Two newly produced clusters, (1) the South Asia and the Middle East cluster (i.e., the SAE cluster), centered in India, ARE, and SAU (Figure 3b and Figure 4b), and (2) the sub-Saharan Africa cluster (i.e., the SSA cluster), centered in South Africa (Figure 3b and Figure 4b), were roughly split from the SWMS cluster in 1996. The EAP cluster, dominated by Singapore, Malaysia, Thailand, Indonesia, and Australia, still existed. However, the composition of countries changed, with Iran, Yemen, and Qatar leaving this cluster and Myanmar joining it (see Figure 3b and Figure 4b).
In 2009 and 2014, although the IOR intra-regional trade networks still formed three trade communities that were generally similar to those in 2000 on a simple visual inspection (Figure 3c,d), the positions of several countries showed some impressive changes. In 2009, India and ARE rose to be the second- and third-largest traders, respectively, with their more intensive trade links to trading partners (Figure 3c). Furthermore, although Singapore remained the largest trading country within this region, the trade gap between India and Singapore was extremely low. In 2014, India rose to be the largest trader in the entire trade network, while Singapore fell to being the second-largest (Figure 3d). Although ARE was still the third-largest, it became the largest exporter in the IOR intra-regional trade network. During this process, the rise in the positions of India and ARE was quite impressive. Additionally, we observe that the connectivity of trade links, and the dominant country’s trade share in each cluster, changed drastically (Figure 5). The SAE cluster’s trade network density and trade value and the three dominant countries’ trade share showed an increasing trend. The SAE cluster’s trade share in the IOR intra-regional trade increased from 15.6% in 2000 to 37.02% in 2014 and exceeded that of the EAP cluster in 2014, suggesting the rising strength of the SAE cluster in the IOR intra-regional trade. In contrast, the EAP cluster’s trade share declined from 46.82% in 2000 to 28.75% in 2014. Although the SSF cluster’s trade network density and trade value increased, the SSF cluster constantly maintained a fairly low share, between 2.91% and 4.45%, which was probably related to the lack of more dominant trading countries with strong economic forces.
Despite the apparent complexity, there was an enhancement in the community structures of the IOR intra-regional trade networks from 1996 to 2014, as indicated by the upward trend in the modularity coefficient shown in Figure 3f. Thus, the trade flows within each community of the IOR trade networks were becoming increasingly organized with the increasing trend in the network density (Figure 5a). Each community in each year was determined by the dominant trading countries, whose strength centrality (i.e., the total value of imports and exports within each cluster) accounted for a high share of each community’s total trade (Figure 5b).
By 2017, the IOR trade network was reduced to two communities, along with a decline in trade links (Figure 3e). The EAP community centered in Singapore, Malaysia, Thailand, Indonesia, and Australia existed robustly due to its denser and stronger trade ties within this community, which varied between 0.76 and 0.92 (Figure 3e and Figure 5a). In contrast, as shown in Figure 3e and Figure 5b, the SAE and SSA communities disappeared because of a decline in trade links within each cluster, and they were regrouped into a large cluster. The decreasing trend in the modularity coefficient from 2015 to 2017 (Figure 3f) also indicated a weakening trend in the trade community structures within the IOR.
The community divisions in the IOR trade networks showed that the trade communities corresponded to geographical regions to some extent (Figure 4). This indicates that geographical factors played an essential role in explaining the formation of the IOR trade community structures. However, almost all communities also consisted of countries located in different sub-regions of the IOR. Therefore, the formation of communities may not solely rely on geographical factors but may also rely on other economic conditions, cultural factors, and institutional factors. In the next section, the IOR’s trade community structures and community structures produced from several determinant variables will be compared to determine whether and how the formation of the IOR’s trade community structures is linked to these variables.
Finally, we applied the one-year NMI between the community structures of the IOR intra-regional trade in two consecutive years (Figure 6) to measure the degree of dependence in the trade community structures. Although the one-year NMI varied between the lowest value of 0.35 and the highest value of 0.93, it generally remained relatively high, with an average value of 0.68 over the study period. This suggests that changes in the community structures of the IOR intra-regional trade networks occurred over more than one year.

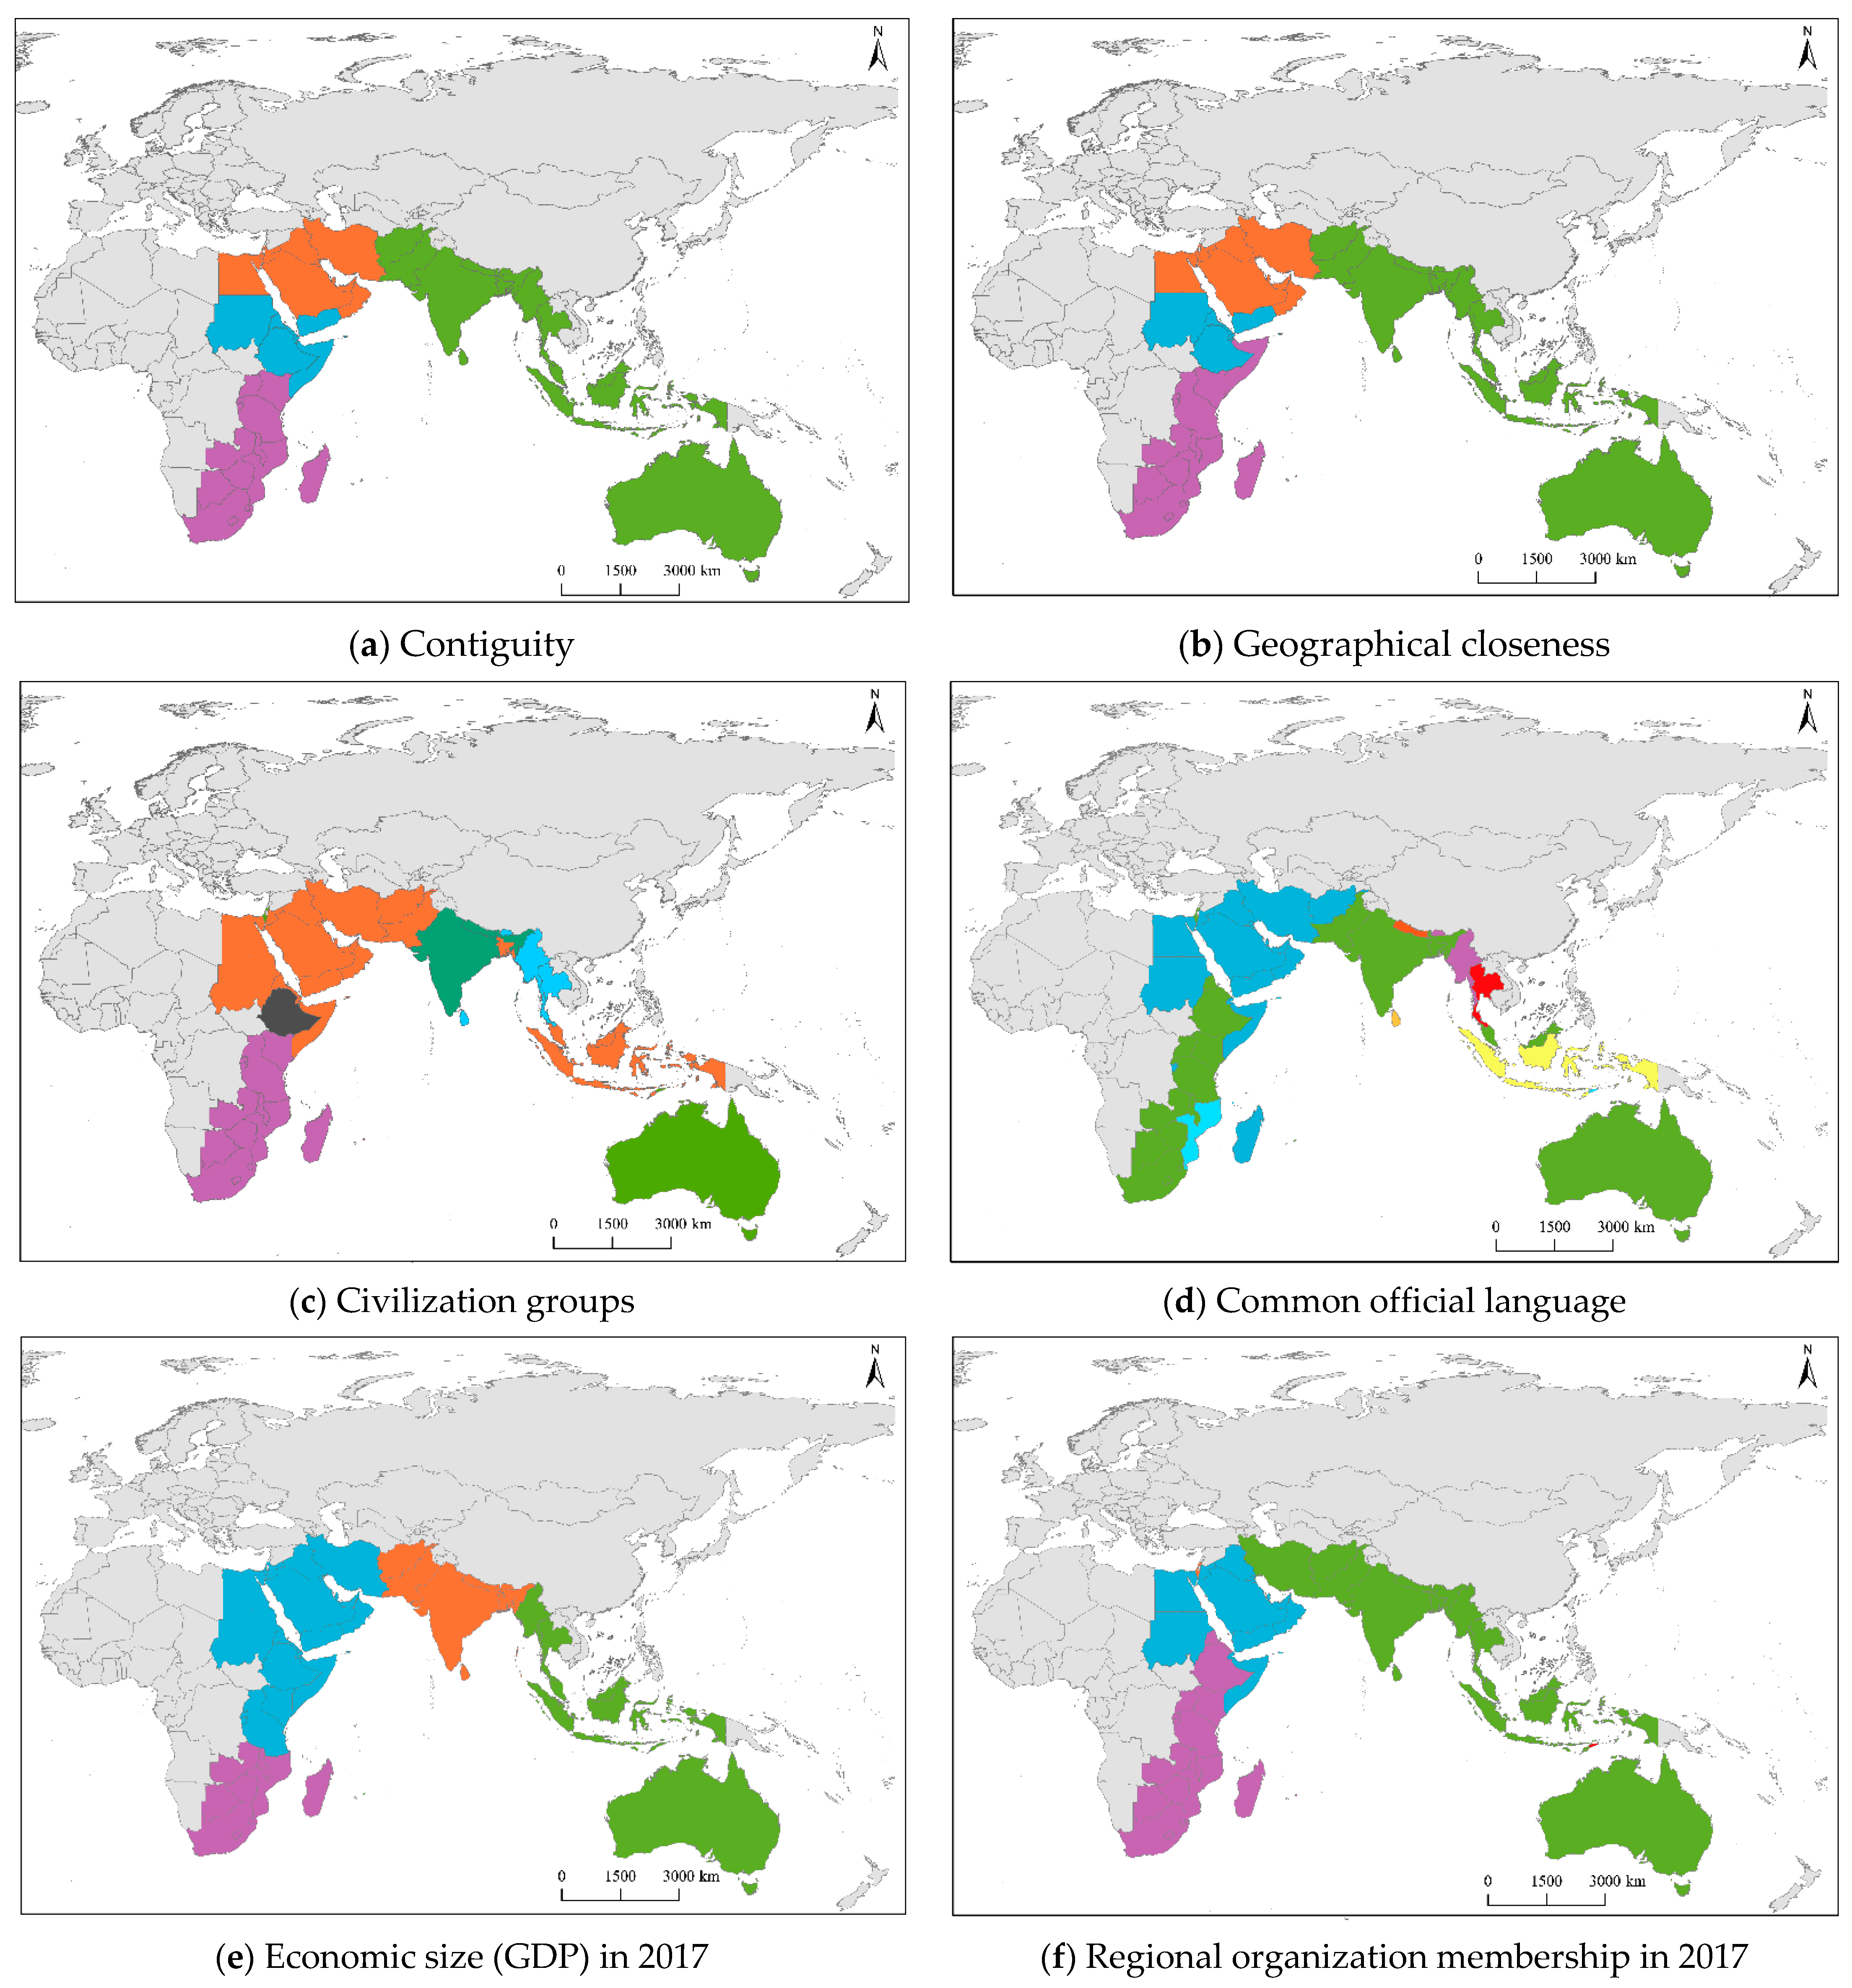
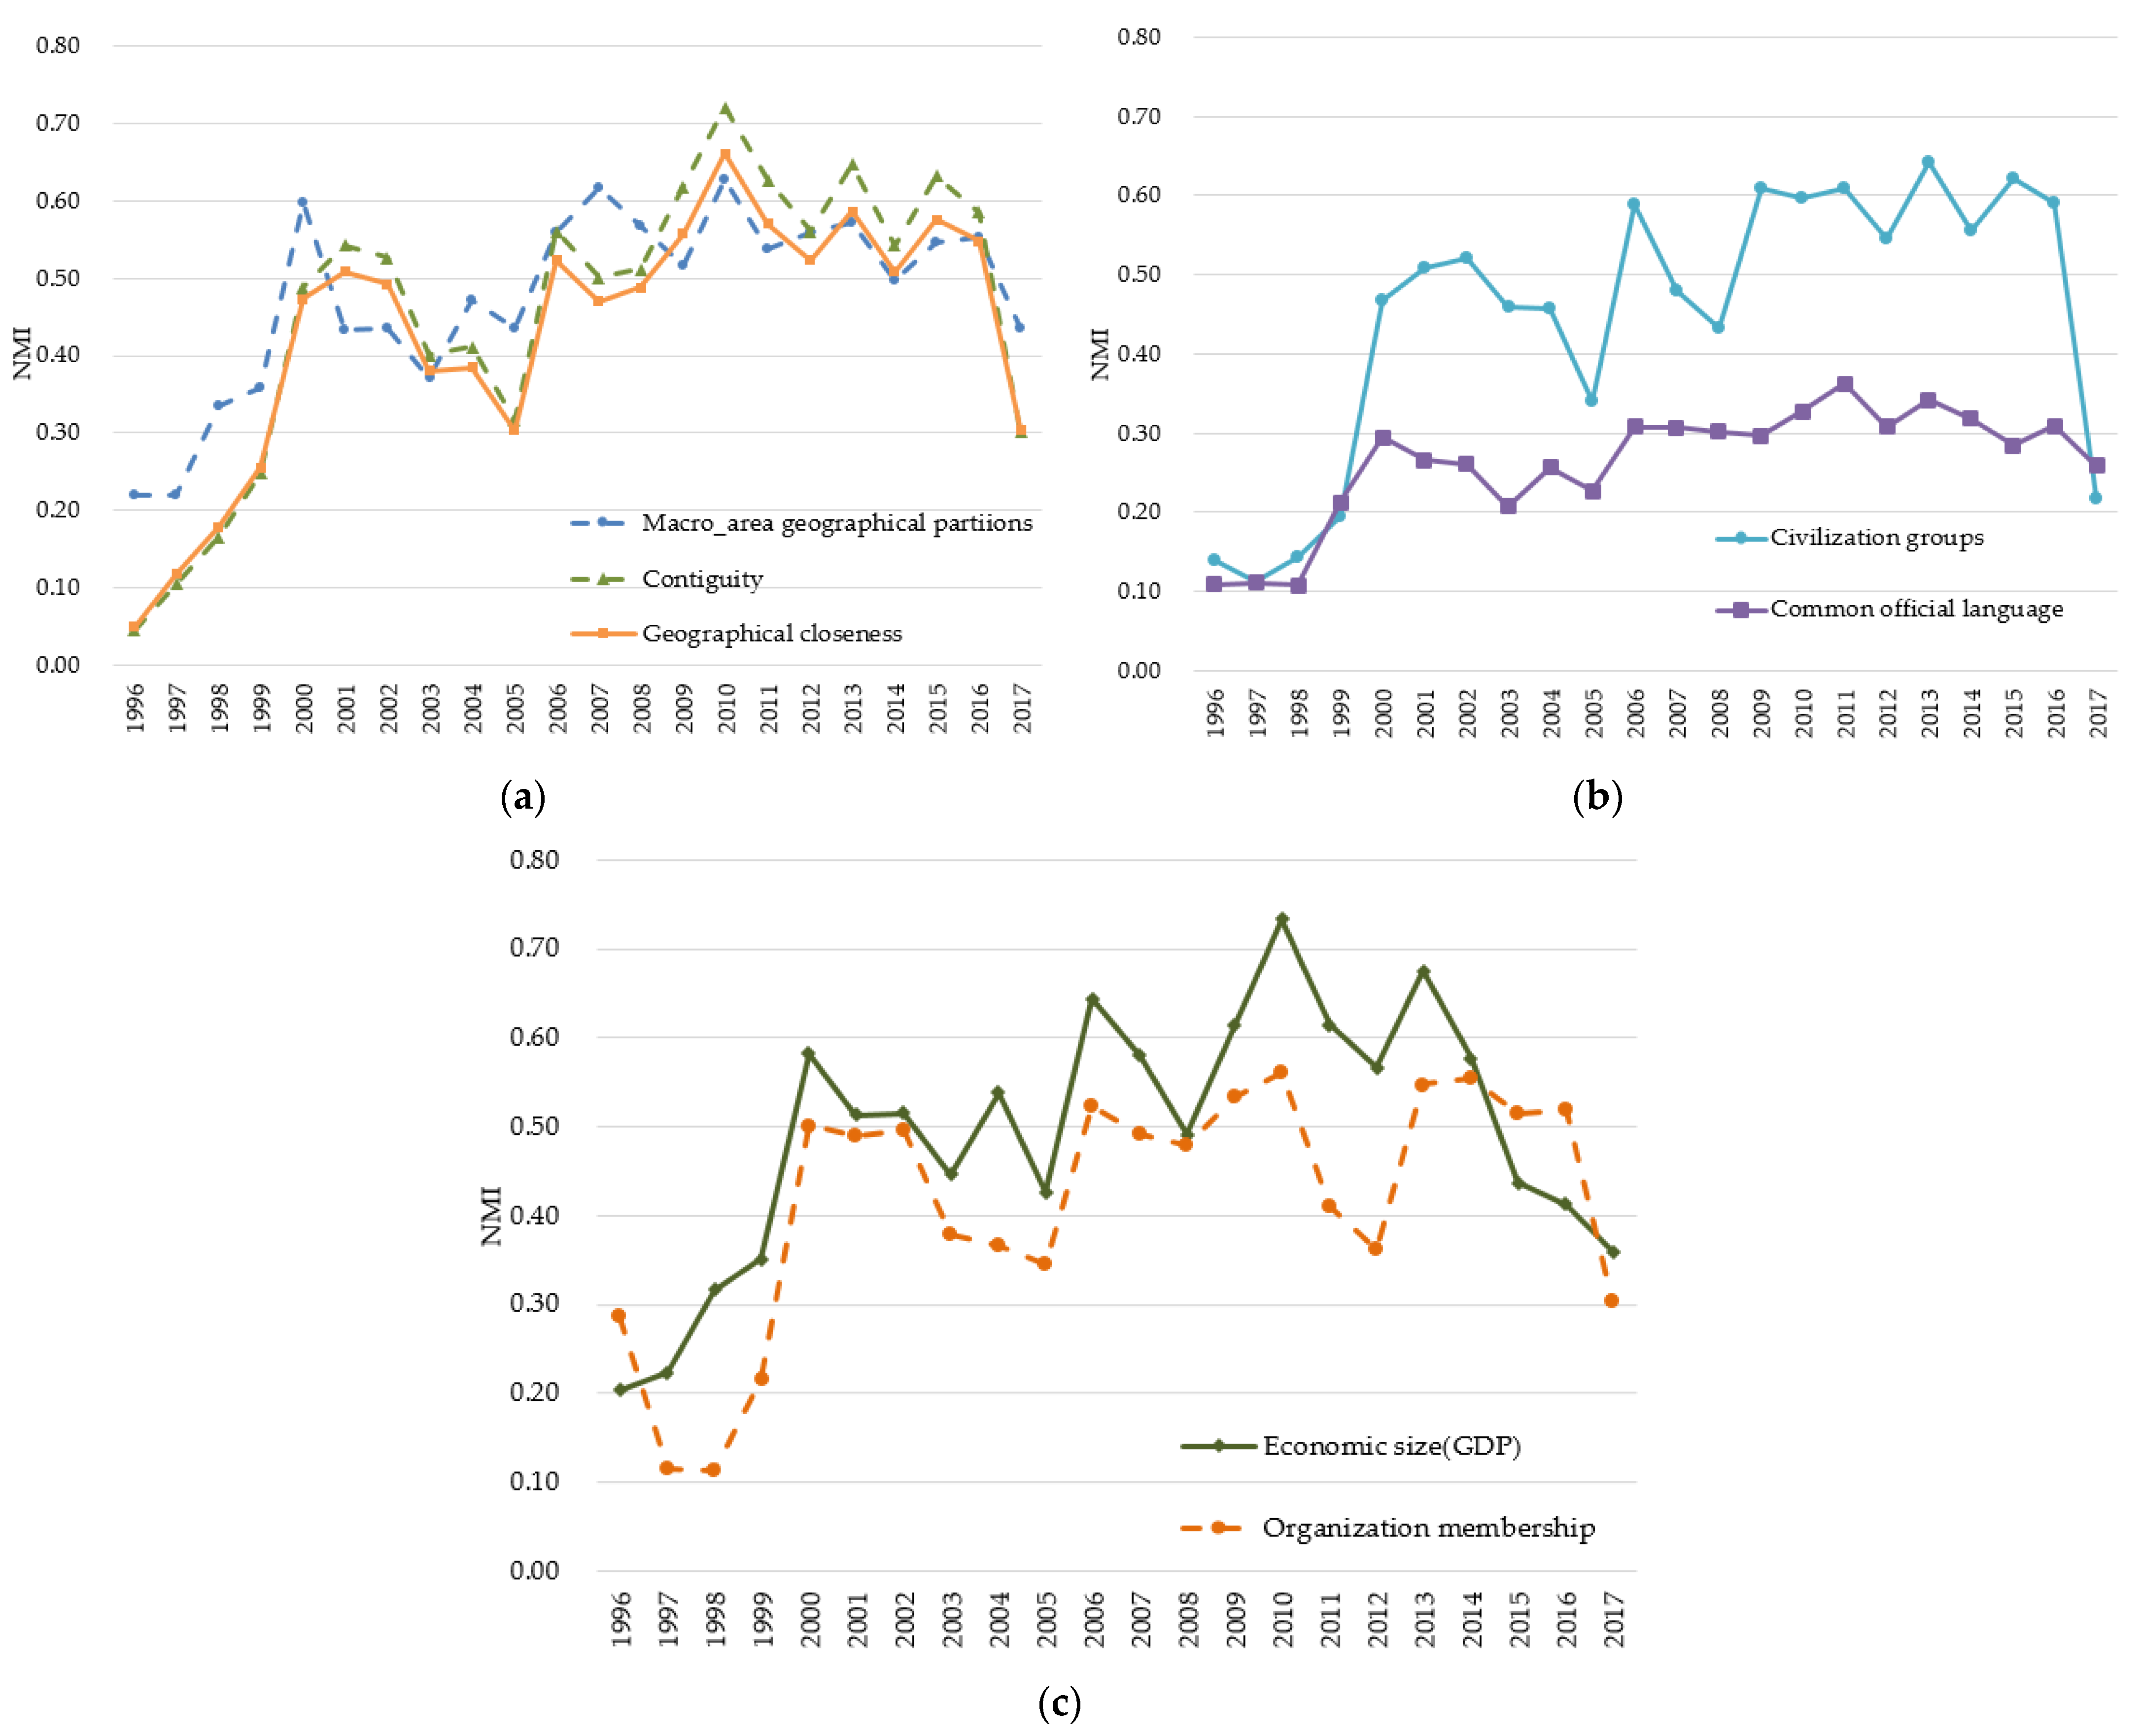
3.3. Impact of the Determinant Factors on the Community Structures of the IOR Intra-Regional Trade

In this section, we employ the NMI to quantitatively evaluate the extent to which the IOR trade communities correlate with communities based on several determinant variables. The macro-area geographical partitions are shown in Figure 1, and the corresponding community divisions of the other six variables are visualized in the choropleth maps in Figure 7. The values of the NMI between the IOR trade communities and the communities produced by these determinant variables are depicted in Figure 8.
The NMI values for comparison of communities produced by the three types of geographical proximity factors with the IOR trade communities are relatively close to each other, especially the curves of distance closeness and contiguity across all years, as shown in Figure 7a. On average, the NMI value of macro-area geographical partitions and the IOR trade communities was the largest, and close to 0.48. In contrast, the NMI values for comparing contiguity network communities and distance closeness network communities with the corresponding trade communities were relatively lower, with 0.43 and 0.46, respectively, as average values. These results suggest that, despite the advances and development in transportation and communication technology, geography remained a friction in the IOR intra-regional trade, which may be largely due to the impediment of the Indian Ocean. Thus, countries within the IOR engaged in the intra-regional trade still tended to select geographically proximate trading partners. Thus, geographical proximity remains a concern in determining the formation of the trade communities of the IOR.
The average value of NMI between the IOR trade communities and common civilization communities was 0.45 and approached approximately that between communities of the IOR trade networks and geography-based communities. However, compared with partitions based on geographical proximity factors and common civilization, the average NMI value for comparing communities based on the common official language network and the IOR trade communities was relatively lower, merely 0.26. These results suggest that countries within the IOR were more likely to transact commodities with traders sharing a common civilization and a common official language; this is because they have similar lifestyles and tastes, generated by their similar social values [60] as well as the ease of communication in a common language [56,57]. Thus, cultural proximity factors play an important role in explaining the formation of the IOR trade community structures.
Comparing the IOR trade communities with the communities of regional organization membership using the NMI, the average value of NMI (0.42) indicates that countries’ decision on joining a common regional organization or not affected their decision to participate in the IOR intra-regional trade to some extent. This is because the regional organization provides the institutional foundation for more effective cooperation among members in specific areas, especially in trade promotion and investment. Therefore, more intra-regional institutional arrangements and cooperation (especially open trade policies and regional trade agreements) among members help the countries within the IOR advance their intra-regional trade and form more intensely connected trade communities.
Compared with average NMI values of the other six determinant variables, the average NMI value of 0.49 between the IOR trade communities and the communities of economic size obtained using a gravity model when controlling the distance effect was the largest among all the determinant variables, illustrating that the driver of the economic market size explains the formation of the IOR trade community structures more than the other six variables. Therefore, driven by the economic growth of the countries within the IOR, the possibility of a natural enhancement in the trade community structures of the IOR countries is feasible.
Overall, the general rising trend in the NMI values between 1996 and 2014 (Figure 8) indicates that the IOR intra-regional trade increasingly relied on geographical proximity, cultural proximity, regional organization membership between trade partners, and their economic forces. However, the explanatory power of these variables dropped, as indicated by the declining trend in the NMI values from 2015 to 2017. A possible explanation might be the decline in imports and exports in all regions of the world due to the decrease in bulk commodity prices, especially the energy price. Thus, this result may suggest that the community structures of the IOR’s intra-regional trade were affected not only by the internal determinant factors but also, to some extent, by the external international market.

4. Conclusions and Discussion

4.1. Conclusions

This study analyzed the IOR intra-regional trade networks between 1996 and 2017 using social network analysis methods. In this paper, we revealed the evolution of the extent of trade integration and the evolution of the IOR trade community structures. Further, we provided better understanding on the extent to which the formation of the trade community structures in the IOR is related to community structures based on the determinant factors. The results can be summarized as follows:
First, the extent of integration of the IOR intra-regional trade generally increased from 1996 to 2014, but it declined from 2015 to 2017. From 1996 to 2014, the intra-regional trade network grew rapidly and became more intensely connected and increasingly integrated. From 2015 to 2017, the trade network of the IOR shrank and became less intensely connected, indicating a decline in the extent of trade integration, which was still higher than that at the beginning of the period. Generally, the extent of trade integration within the IOR showed a strengthening trend during the period 1996–2017.
Second, the nature of the trade community structures of the IOR changed from strengthening during the period 1996–2014 to weakening during the period 2015–2017. The East Asia and Pacific community, led by Singapore, Malaysia, Thailand, Indonesia, and Australia, existed robustly due to its denser and stronger tradelinks. In contrast, the South Asia and Middle East community, centered on India, ARE, and SAU, and the sub-Saharan Africa community, centered on South Africa, appeared in 2000, 2009, and 2014 due to the increase in trade links within each cluster. However, the two communities disappeared and regrouped into a large cluster in 2017 due to the decline in their intra-community trade links. During the study period, the rise in positions of India and ARE in the IOR intra-regional trade network was quite impressive.
Finally, the driver of economic market size showed the strongest explanatory power of the formation of the trade community structures of the IOR, as indicated by the largest average value of the NMI between the economic size obtained from a gravity model and the IOR trade communities. In general, geographical proximity factors remained the second-largest explanatory power over the entire period, despite advances in transportation, communication, and information technology. Interestingly, we found that common civilization played an important role in explaining the formation of the community structures of the IOR, while regional organization memberships showed the fourth-largest explanatory power of the formation of the IOR trade community structures.

4.2. Discussion

Following the objectives of this study, we analyzed the intra-regional trade networks of the IOR between 1996 and 2017 using social network analysis methods to provide insights into the evolution of the trade community structures of the intra-regional trade. In this section, we discuss the interpretation of some results, compare the results based on the NMI with those of existing studies, and present limitations and further extensions of this study.
The positive trend of the extent of trade integration of the IOR was promising. However, the IOR’s intra-regional trade dependency remained relatively low (i.e., 25.28%–30.43%). This result indicates that the development of trade in the IOR still rely on the extra-regional market highly.
Overall, the correlation between trade communities of the IOR and communities produced by five determinant variables (except for civilization groups and common official language) using the NMI method are in line with trade-related community structure studies [46,52,53,54,55], as they show that geographical factors, regional organization memberships, and economic size play relatively important roles in affecting country co-presence in the same trade community. We also found that common civilization exerts an important role in determining the formation of the community structures of the IOR. This result both reinforces the important role of cultural proximity in determining trade flows between countries, which has been concluded based on gravity models on the modeling of trade flows [56,57,72], and enriches previous findings related to the formation of trade community structures [46,52,53,54,55].
Our paper contributes to the literature on intra-regional trade within the IOR and the determinants of the trade community structure in two ways. First, to the best of our knowledge, this is the first paper that reveals the evolution of intra-regional trade networks within the IOR, as well as the extent of its trade integration. We further revealed the trade community structures of the IOR using two approaches of visualization (i.e., traditional visualizations of networks and trade communities using graphs) and the corresponding visualization of trade communities using choropleth maps. These two approaches reveal how the trade community structures of the IOR intra-regional trade evolved as well as allows us to preliminarily correlate the trade community structures with the community structures of the external factors. Second, we found that common civilization played an important role in explaining the formation of the trade community structures of the IOR based on the NMI method, hence contributing to existing research on the factors affecting the formation of trade community structures.
Some limitations and further extensions of this study need to be mentioned. First, in this study, we only assessed the effect of the intra-regional economic market size on the formation of the trade community structures of the IOR but did not assess the impact of external economic conditions on the trade community formation. Therefore, we will attempt to qualitatively measure the impact of external economic conditions based on the proxy of the remoteness index used in reference [16] and evaluate the impact of this factor on the formation of the trade communities of the IOR in our future study. The results will help identify whether intra-regional or external economic conditions have a more significant impact on the formation of the IOR trade community.
Second, this study mainly analyzed the aggregated-trade community structures of the IOR in five specific years (i.e., 1996, 2000, 2009, 2014, and 2017). However, the difference between 2009 and 2010 deserves further investigation to determine the impact of economic crises on the trade community structures of the IOR. Furthermore, the methods used in this study enable us not only to identify the complex community structures of the intra-regional aggregated-trade networks of the IOR but also to investigate the community structures of industry-specific trade networks of the IOR. In ongoing research, we will study how intra-regional industry-specific trade community structures within the IOR evolve, how these structures contribute to shaping the IOR countries’ aggregated-trade community structures, and how they correlate with the community structures based on external factors.
Third, according to existing studies [27,29], bilateral relations affect trade flows between countries to some extent and consequently affect the formation of regional trade community structures. Considering the complex bilateral relations between the countries within the IOR, our further analysis will analyze the extent to which the community structures of relations among the IOR countries affect trade community structures based on the data on bilateral relations within this region obtained from the open-access database of Global Database of Events, Language, and Tone [73], which has been successfully applied to measure cooperation and conflicts between countries [29,74,75,76,77]. In particular, this exploration will also provide insights into the formation of the IOR community structures.
Finally, we mainly used the statistical method of normalized mutual information to assess the correlations between the determining factors and the formation of the trade communities of the IOR in this study. To better address this issue, we will employ the probit or logit model to capture the probability that any two countries are within the same trade community.

Author Contributions

Conceptualization, Lihua Yuan, Xiaoqiang Chen and Changqing Song; methodology, Lihua Yuan, Xiaoqiang Chen and Danping Cao; software, Lihua Yuan, Danping Cao and Hong Yi; validation, Lihua Yuan; formal analysis, Lihua Yuan; investigation, Lihua Yuan and Xiaoqiang Chen; data curation, Lihua Yuan; writing—original draft preparation, Lihua Yuan; writing—review and editing, Lihua Yuan, Xiaoqiang Chen and Changqing Song; visualization, Lihua Yuan, Danping Cao and Hong Yi; project administration, Changqing Song; funding acquisition, Changqing Song. All authors have read and agreed to the published version of the manuscript.

Funding

This research was supported by the Second Tibetan Plateau Scientific Expedition and Research Program (STEP), Grant No. 2019QZKK0608.

Acknowledgments

We would like to thank for high-performance computing support from the Center for Geodata and Analysis, Faculty of Geographical Science, Beijing Normal University (https://gda.bnu.edu.cn/) (accessed on 7 September 2020).

Conflicts of Interest

The authors declare no conflict of interest.

Appendix A

Table A1. Major regional organizations that joined the IOR countries.
NumberRegional Organization NameCountries’ Names
1Association of South-East Asian Nations (ASEAN) Brunei, Cambodia, Indonesia, Laos, Malaysia, Myanmar, the Philippines, Singapore, Thailand, and Vietnam
2South Asian Association for Regional Cooperation (SAARC) Bangladesh, Bhutan, India, Maldives, Nepal, Pakistan, and Sri Lanka
3Indian Ocean Rim Association for Regional Cooperation (IOR-ARC) Australia, Bangladesh, India, Indonesia, Iran, Kenya, Madagascar, Malaysia, Mauritius, Mozambique, Oman, Reunion, Singapore, Sri Lanka, South Africa, Tanzania, Thailand, and United Arab Emirates
4Gulf Cooperation Council (GCC)Bahrain, Kuwait, Oman, Qatar, Saudi Arabia, United Arab Emirates, and Yemen
5League of Arab States (LAS)Algeria, Bahrain, Egypt, Iraq, Lebanon, Sudan, Syria, Tunisia, and United Arab Emirates
6Common Market for Eastern and Southern Africa (COMESA) Angola, Burundi, Comoros, the Democratic Republic of Congo, Djibouti, Egypt, Eritrea, Ethiopia, Kenya, Madagascar, Malawi, Mauritius, Namibia, Rwanda, Seychelles, Sudan, Swaziland, Uganda, Tanzania, Zambia, and Zimbabwe
7Southern African Development Community (SADC) Angola, Botswana, the Democratic Republic of Congo, Lesotho, Malawi, Mauritius, Mozambique, Namibia, Seychelles, South Africa, Swaziland, Tanzania, Zambia, and Zimbabwe
8Economic Cooperation Organization (ECO)Afghanistan, Azerbaijan, Iran, Kazakhstan, Kyrgyzstan, Pakistan, Tajikistan, Turkey, Turkmenistan, and Uzbekistan

References

  1. Boucharda, C.; Crumplina, W. Neglected no longer: The Indian Ocean at the forefront of world geopolitics and global geo-strategy. J. Indian Ocean. Reg. 2010, 6, 26–51. [Google Scholar] [CrossRef]
  2. Llewellyn, L.E.; English, S.; Barnwell, S. A roadmap to a sustainable Indian Ocean blue economy. J. Indian Ocean. Reg. 2016, 12, 52–66. [Google Scholar] [CrossRef]
  3. Yang, Y. The economic rationale behind the concept of “Indo-Pacific”. Glob. Rev. 2019, 11, 88–109. [Google Scholar] [CrossRef]
  4. Xia, L. Indo-Pacific strategy: Geopolitical and geo-economic perspectives. Am. Stud. Q. 2015, 29, 31–53. [Google Scholar]
  5. Li, Y.; Zhi, T. Economic development and evolution of geo-economic pattern of the “Indo-Pacific” region. AP. Econ. Rev. 2019, 5–13. [Google Scholar] [CrossRef]
  6. Van Rensburg, S.J.J.; Viviers, W.; Cameron, M.; Parry, A. Identifying export opportunities between IORA member states using the TRADE-DSM® methodology: A case study involving South Africa and Thailand. J. Indian Ocean. Reg. 2018, 15, 78–96. [Google Scholar] [CrossRef]
  7. Peron, O.; Rey, S. Trade and convergence of per capita income in the Indian Ocean Zone, 1950–2008. Ann. Reg. Sci. 2012, 49, 657–683. [Google Scholar] [CrossRef]
  8. O’Loughlin, J.; Anselin, L. Geo-Economic Competition and Trade Bloc Formation: United States, German, and Japanese Exports, 1968–1992. Econ. Geogr. 1996, 72, 131. [Google Scholar] [CrossRef]
  9. Marco, D.; Fagiolo, G. Modeling the international trade network: A gravity approach. J. Econ. Interact. Coord. 2013, 8, 155–178. [Google Scholar]
  10. Krugman, P. Growing world trade: Causes and consequences. Brook. Pap. Econ. Act. 1995, 26, 327–377. [Google Scholar] [CrossRef] [Green Version]
  11. Forbes, K. Are trade linkages important determinants of country vulnerability to crises? In Preventing Currency Crises in Emerging Markets; Sebastian, E., Jeffrey, F., Eds.; University of Chicago Press: Chicago, IL, USA, 2002. [Google Scholar]
  12. Artis, M.; Galvão, A.B.; Marcellino, M. The transmission mechanism in a changing world. J. Appl. Econ. 2007, 22, 39–61. [Google Scholar] [CrossRef] [Green Version]
  13. Cepeda-López, F.; Gamboa-Estrada, F.; León, C.; Rincon-Castro, H. The evolution of world trade from 1995 to 2014: A network approach. J. Int. Trade Econ. Dev. 2018, 4, 452–484. [Google Scholar]
  14. Wilhite, A. Blateral trade and ’small-world’ networks. Comput. Econ. 2001, 18, 49–64. [Google Scholar] [CrossRef]
  15. Kali, R.; Reyes, J. The architecture of globalization: A network approach to international economic integration. J. Int. Bus. Stud. 2007, 38, 595–620. [Google Scholar] [CrossRef]
  16. Fagiolo, G. The international-trade network: Gravity equations and topological properties. J. Econ. Interact. Coord. 2010, 5, 1–25. [Google Scholar] [CrossRef] [Green Version]
  17. De Benedictis, L.D.; Tajoli, L. The World Trade Network. World Econ. 2011, 34, 1417–1454. [Google Scholar] [CrossRef]
  18. Lovrić, M.; Da Re, R.; Vidale, E.; Pettenella, D.; Mavsar, R. Social network analysis as a tool for the analysis of international trade of wood and non-wood forest products. For. Policy Econ. 2018, 86, 45–66. [Google Scholar] [CrossRef]
  19. Wellman, B. Structural analysis: From method and metaphor to theory and substance. 19–61. In Social Structures a Network Approach; Wellman, B., Berkowitz, S.D., Eds.; Cambridge University Press: Cambridge, UK, 1988. [Google Scholar]
  20. Berentsen, W.H. The Change in European Foreign Trade from 1960 to 2010: A Geography of Leading Merchandise Exporting Partners. Eurasian Geogr. Econ. 2012, 53, 380–399. [Google Scholar] [CrossRef]
  21. Calatayud, A.; Mangan, J.; Palacin, R. Connectivity to international markets: A multi-layered network approach. J. Transp. Geogr. 2017, 61, 61–71. [Google Scholar] [CrossRef] [Green Version]
  22. Song, Z.; Che, S.; Yang, Y. The trade network of the Belt and Road Initiative and its topological relationship to the global trade network. J. Geogr. Sci. 2018, 28, 1249–1262. [Google Scholar] [CrossRef] [Green Version]
  23. Liu, C.; Xu, J.; Zhang, H. Competitiveness or Complementarity? A Dynamic Network Analysis of International Agri-Trade along the Belt and Road. Appl. Spat. Anal. Policy 2019, 13, 349–374. [Google Scholar] [CrossRef]
  24. Wang, Y.; Song, C.; Sigley, G.; Chen, X.; Yuan, L. Using Social Networks to Analyze the Spatiotemporal Patterns of the Rolling Stock Manufacturing Industry for Countries in the Belt and Road Initiative. ISPRS Int. J. Geo-Inf. 2020, 9, 431. [Google Scholar] [CrossRef]
  25. Ye, S.; Song, C.; Cheng, C.; Shen, S.; Gao, P.; Zhang, T.; Chen, X.; Wang, Y.; Wan, C. Digital Trade Feature Map: A New Method for Visualization and Analysis of Spatial Patterns in Bilateral Trade. ISPRS Int. J. Geo-Inf. 2020, 9, 363. [Google Scholar] [CrossRef]
  26. Kastner, S.L. When Do Conflicting Political Relations Affect International Trade? J. Confl. Resolut. 2007, 51, 664–688. [Google Scholar] [CrossRef]
  27. Ward, M.D.; Hoff, P.D. Analyzing dependencies in geo-economics and geo-politics. Confl. Manag. Peace 2012, 6, 133–160. [Google Scholar]
  28. Lupu, Y.; Traag, V.A. Trading Communities, the Networked Structure of International Relations and the Kantian Peace. SSRN Electron. J. 2011, 57, 1011–1042. [Google Scholar] [CrossRef] [Green Version]
  29. Abb, P.; Strüver, G. Regional linkages and global policy alignment: The case of China-Southeast Asia relations. In German Institute of Global and Area Studies; GIGA Working Papers, No. 268; German Institute of Global and Area Studies (GIGA): Hamburg, Germany, 2015. [Google Scholar]
  30. Smith, D.A.; White, D.R. Structure and dynamics of the global economy: Network analysis of international trade 1965–1980. Soc. Forces 1992, 70, 857–893. [Google Scholar] [CrossRef]
  31. Van, R.R. The world system paradigm as general theory of development: A cross-national test. Am. Sociol. Rev. 1996, 61, 508–527. [Google Scholar]
  32. Mahutga, C. The persistence of structural inequality? A network analysis of international trade, 1965–2000. Soc. Forces 2006, 84, 1863–1889. [Google Scholar] [CrossRef]
  33. Clark, R.; Beckfield, J. A New Trichotomous Measure of World-system Position Using the International Trade Network. Int. J. Comp. Sociol. 2009, 50, 5–38. [Google Scholar] [CrossRef] [Green Version]
  34. Zhou, M.; Wu, G.; Xu, H. Structure and formation of top networks in international trade, 2001–2010. Soc. Netw. 2016, 44, 9–21. [Google Scholar] [CrossRef]
  35. Baracuhy, B. The evolving geo-economics of world trade. Adelphi Ser. 2014, 54, 121–138. [Google Scholar] [CrossRef]
  36. Snyder, D.; Kick, E.L. Structural Position in the World System and Economic Growth, 1955–1970: A Multiple-Network Analysis of Transnational Interactions. Am. J. Sociol. 1979, 84, 1096–1126. [Google Scholar] [CrossRef]
  37. Magerman, G.; De Bruyne, K.; Van Hove, J. Pecking order and core-periphery in international trade. Rev. Int. Econ. 2020, 28, 1113–1141. [Google Scholar] [CrossRef]
  38. Serrano, M.Á.; Boguñá, M. Topology of the world trade web. Phys. Rev. E 2003, 68, 015101. [Google Scholar] [CrossRef] [PubMed] [Green Version]
  39. Garlaschelli, D.; Loffredo, M.I. Fitness-Dependent Topological Properties of the World Trade Web. Phys. Rev. Lett. 2004, 93, 188701. [Google Scholar] [CrossRef] [Green Version]
  40. Bhattacharya, K.; Mukherjee, G.; Manna, S. The international trade network. In Econophysics of Markets and Business Networks; Chatterjee, A., Chakrabarti, B., Eds.; Springer: Milan, Italy, 2003. [Google Scholar]
  41. Garlaschelli, D.; Di Matteo, T.; Aste, T.; Caldarelli, G.; Loffredo, M.I. Interplay between topology and dynamics in the World Trade Web. Eur. Phys. J. B 2007, 57, 159–164. [Google Scholar] [CrossRef]
  42. Bhattacharya, K.; Mukherjee, G.; Saramaki, J.; Kaski, K.; Manna, S.S. The International Trade Network: Weighted network analysis and modelling. J. Stat. Mech. Theory Exp. 2008, 2008, P02002. [Google Scholar] [CrossRef]
  43. Fagiolo, G.; Reyes, J.; Schiavo, S. On the topological properties of the world trade web: A weighted network analysis. Phys. A 2008, 387, 3868–3873. [Google Scholar] [CrossRef] [Green Version]
  44. Fagiolo, G.; Reyes, J.; Schiavo, S. World-trade web: Topological properties, dynamics, and evolution. Phys. Rev. E 2009, 79, 036115. [Google Scholar] [CrossRef] [Green Version]
  45. Mao, M.; Cheng, X. Evolution analysis of foreign trade network structure based on complex network. In EBIMCS. Proceedings of the 2019 2nd International Conference on E-Business, Information Management and Computer Science, Kuala Lumpur, Malaysia; ACM: New York, NY, USA, 2019; Volume 26, pp. 1–5. [Google Scholar] [CrossRef]
  46. Barigozzi, M.; Fagiolo, G.; Mangioni, G. Identifying the community structure of the international-trade multi-network. Phys. A 2011, 390, 2051–2066. [Google Scholar] [CrossRef] [Green Version]
  47. Liu, Z.; Wang, T.; Chen, W. The rise of China and change of the global trade network during 1980–2018. Prog. Geogr. 2019, 38, 1596–1606. [Google Scholar] [CrossRef]
  48. Maeng, S.E.; Choi, H.W.; Lee, J.W. Complex Networks and Minimal Spanning Trees in International Trade Network. Int. J. Mod. Phys. Conf. 2012, 16, 51–60. [Google Scholar] [CrossRef]
  49. Krapohl, S.; Fink, S. Different Paths of Regional Integration: Trade Networks and Regional Institution-Building in Europe, Southeast Asia and Southern Africa. JCMS J. Common Mark. Stud. 2013, 51, 472–488. [Google Scholar] [CrossRef]
  50. Alatriste-Contreras, M.G. The relationship between the key sectors in the European Union economy and the intra-European Union trade. J. Econ. Struct. 2015, 4, 1170. [Google Scholar] [CrossRef] [Green Version]
  51. Yang, W.; Du, D.; Liu, C.; Ma, Y. Study on the spatial-temporal evolution and internal mechanism of geo-economic connections of China. Acta Geogr. Sin. 2016, 71, 956–969. [Google Scholar]
  52. D’Odorico, P.; Carr, J.; Laio, F.; Ridolfi, L. Spatial organization and drivers of the virtual water trade: A community-structure analysis. Environ. Res. Lett. 2012, 7, 034007. [Google Scholar] [CrossRef] [Green Version]
  53. Reyes, J.; Wooster, R.; Shirrell, S. Regional trade agreements and the pattern of trade: A networks approach. World Econ. 2014, 37, 1128–1151. [Google Scholar] [CrossRef] [Green Version]
  54. Torreggiani, S.; Mangioni, G.; Puma, M.J.; Fagiolo, G. Identifying the community structure of the food-trade international multi-network. Environ. Res. Lett. 2018, 13, 054026. [Google Scholar] [CrossRef]
  55. Petridis, N.E.; Petridis, K.; Stiakakis, E. Global e-waste trade network analysis. Resour. Conserv. Recycl. 2020, 158, 104742. [Google Scholar] [CrossRef]
  56. Zhou, M. Multidimensionality and Gravity in Global Trade, 1950–2000. Soc. Forces 2010, 88, 1619–1643. [Google Scholar] [CrossRef]
  57. Zhou, M. Intensification of geo-cultural homophily in global trade: Evidence from the gravity model. Soc. Sci. Res. 2011, 40, 193–209. [Google Scholar] [CrossRef]
  58. Thurner, P.W.; Schmid, C.S.; Cranmer, S.J.; Kauermann, G. Network interdependencies and the evolution of the international arms trade. J. Confl. Resolut. 2018, 63, 1736–1764. [Google Scholar] [CrossRef]
  59. Stinnett, D.M.; Tir, J.; Diehl, P.F.; Schafer, P.; Gochman, C. The Correlates of War (Cow) Project Direct Contiguity Data, Version 3.0. Confl. Manag. Peace Sci. 2002, 19, 59–67. [Google Scholar] [CrossRef]
  60. Huntington, S.P. The Clash of Civilizations and the Remaking of the World Order; Simon & Schuster Ltd.: New York, NY, USA, 1996. [Google Scholar]
  61. Disdier, A.-C.; Mayer, T. Je t’aime, moi non plus: Bilateral opinions and international trade. Eur. J. Politics Econ. 2007, 23, 1140–1159. [Google Scholar] [CrossRef] [Green Version]
  62. Kim, S.; Shin, E.-H. A Longitudinal Analysis of Globalization and Regionalization in International Trade: A Social Network Approach. Soc. Forces 2002, 81, 445–468. [Google Scholar] [CrossRef]
  63. Watts, D.J.; Strogatz, S.H. Collective dynamics of ‘small-world’ networks. Nature 1998, 393, 440–442. [Google Scholar] [CrossRef] [PubMed]
  64. O’Loughlin, J. Geo-Economic Competition in the Pacific Rim: The Political Geography of Japanese and US Exports, 1966–1988. Trans. Inst. Br. Geogr. 1993, 18, 438. [Google Scholar] [CrossRef]
  65. Masuda, N.; Konno, N. Return times of random walk on generalized random graphs. Phys. Rev. E 2004, 69, 066113. [Google Scholar] [CrossRef] [PubMed] [Green Version]
  66. Newman, M.E.J. Analysis of weighted networks. Phys. Rev. E 2004, 70, 056131. [Google Scholar] [CrossRef] [Green Version]
  67. Newman, M.E.J. Fast algorithm for detecting community structure in networks. Phys. Rev. E 2004, 69, 066133. [Google Scholar] [CrossRef] [PubMed] [Green Version]
  68. Blondel, V.D.; Guillaume, J.-L.; Lambiotte, R.; Lefebvre, E. Fast unfolding of communities in large networks. J. Stat. Mech. Theory Exp. 2008, 2008, P10008. [Google Scholar] [CrossRef] [Green Version]
  69. Lancichinetti, A.; Fortunato, S. Community detection algorithms: A comparative analysis. Phys. Rev. E 2009, 80, 056117. [Google Scholar] [CrossRef] [PubMed] [Green Version]
  70. Danon, L.; Díaz-Guilera, A.; Duch, J.; Arenas, A. Comparing community structure identification. J. Stat. Mech. Theory Exp. 2005, 2005, P09008. [Google Scholar] [CrossRef]
  71. Mesa-Arango, R.; Narayanan, B.; Ukkusuri, S.V. The impact of international crises on maritime transportation based global value chains. Netw. Spat. Econ. 2019, 19, 381–408. [Google Scholar] [CrossRef] [Green Version]
  72. Gokmen, G. Clash of civilizations and the impact of cultural differences on trade. J. Dev. Econ. 2017, 127, 449–458. [Google Scholar] [CrossRef]
  73. Leetaru, K.; Schrodt, P.A. GDELT: Global data on events, location, and tone, 1979–2012. In Annual Conference of the International Studies Association; The International Studies Association: San Diego, CA, USA, 29 March 2013. [Google Scholar]
  74. Davis, C.L.; Fuchs, A.; Johnson, K. State control and the effects of foreign relations on bilateral trade. J. Confl. Resout. 2017, 63, 405–438. [Google Scholar] [CrossRef]
  75. Chen, X.; Yuan, L.; Shen, S.; Liang, X.; Wang, Y.; Wang, X.; Ye, S.; Cheng, C.; Song, C. The analysis of geo-relationships among China and its neighboring countries. Acta Geogr. Sin. 2019, 74, 1534–1547. [Google Scholar] [CrossRef]
  76. Pang, X.; Liu, Z. China-U.S. in massive machine-coded event data: Influence of reciprocity, policy inertia, and a third power. World Econ. Politics 2019, 5, 53–79. [Google Scholar]
  77. Yuan, L.; Song, C.; Cheng, C.; Shen, S.; Chen, X.; Wang, Y. The cooperative and conflictual interactions between the United States, Russia, and China: A quantitative analysis of event data. J. Geogr. Sci. 2020, 30, 1702–1720. [Google Scholar] [CrossRef]
Figure 1. Spatial distribution of the 49 countries in the Indian Ocean region (IOR).
Ijgi 10 00214 g001
Figure 2. Trend in the network density and clustering coefficient of the Indian Ocean Region (IOR) intra-regional trade network (a) and its average tie strength and intra-regional trade share (b) from 1996 to 2017.
Ijgi 10 00214 g002
Figure 3. IOR intra-regional trade networks in the years (a) 1996, (b) 2000, (c) 2009, (d) 2014, and (e) 2015 and (f) variations in the modularity coefficient of the IOR’s trade communities over the period 1996–2017. The name of each country, represented by the respective ISO3 code, is shown in Table 1.
Ijgi 10 00214 g003aIjgi 10 00214 g003b
Figure 4. Community detection of the IOR intra-regional trade networks in the years (a) 1996, (b) 2000, (c) 2009, (d) 2014, and (e) 2017. Each choropleth map displays the country membership of trade communities of the IOR intra-regional trade.
Ijgi 10 00214 g004aIjgi 10 00214 g004b
Figure 5. Changes in network density of each community (a) and trade share of each community in the IOR intra-regional trade (b). Note that, in Figure 2b, the y-axes on the left and right represent each dominant country’s share of trade in each community and the aggregated-trade share of the dominant countries in each community, respectively. The two dashed curves represent the aggregated-trade share of Singapore, Malaysia, Thailand, Indonesia, and Australia in the EAP cluster, and the aggregated-trade share of India, ARE and SAU in the SAE cluster.
Ijgi 10 00214 g005
Figure 6. Normalized mutual information entropy between the trade community structures for two consecutive years over the study period.
Ijgi 10 00214 g006
Figure 7. Community detection of the determinant variables of the IOR: (a) contiguity, (b) geographical closeness, (c) civilization groups, (d) common official language, (e) economic size (GDP) in 2017, and (f) regional organization membership in 2017. Each choropleth map depicts countries colored to display their membership of the corresponding communities.
Ijgi 10 00214 g007
Figure 8. Changes in the NMI values between trade communities and the communities based on (a) geographical proximity factors, (b) cultural proximity factors, and (c) organization membership and economic size.
Ijgi 10 00214 g008
Table 1. The 49 countries of the sub-regions in the Indian Ocean Region.
Sub-RegionNumber of CountriesCountry Names
East Asia and the Pacific7Indonesia (IDN), Myanmar (MMR), Malaysia (MYS), Singapore (SGP), Thailand (THA), Timor-Leste (TLS), Australia (AUS)
South Asia8Afghanistan (AFG), Bangladesh (BGD), Bhutan (BTN), India (IND), Sri Lanka (LKA), Maldives (MDV), Nepal (NPL), Pakistan (PAK)
The Middle East 13Bahrain (BHR), United Arab Emirates (ARE), Iran (IRN), Iraq (IRQ), Israel (ISR), Jordan (JOR), Kuwait (KWT), Oman (OMN), Qatar (QAT), Saudi Arabia (SAU), Yemen (YEM), Egypt (EGY)
Sub-Saharan
Africa
21Burundi (BDI), Botswana (BWA), Comoros (COM), Djibouti (DJI), Eritrea (ERI), Ethiopia (ETH), Kenya (KEN), Lesotho (LSO), Madagascar (MDG), Malawi (MWI), Mauritius (MUS), Mozambique (MOZ), Rwanda (RWA), Seychelles (SYC), Swaziland (SWZ), Sudan (SDN), Somalia (SOM), Tanzania (TZA), Uganda (UGA), South Africa (ZAF), Zambia (ZMB), Zimbabwe (ZWE)
Table 3. Characteristics of the IOR intra-regional trade network from 1996 to 2017.
YearAverage Node DegreeNumber of TiesNetwork Density Clustering CoefficientAverage Tie Strength (USD Million)Total Intra-Regional Trade (USD Million)Intra-Regional Trade Share (%)
1996419260.470.6917.1431,751.8625.28
19974810920.550.7514.8932,527.8924.81
19984911140.560.7512.8728,677.7024.96
19995211730.590.7613.9132,642.7226.38
20005914520.620.8014.2341,315.5126.36
20016014670.620.8113.2838,960.2326.43
20026215110.640.8113.9142,032.2426.71
20036415740.670.8416.0750,579.8527.26
20046616070.680.8420.4165,604.0527.91
20056515860.670.8324.9779,195.3428.87
20066616090.680.8430.9799,656.7330.70
20076716390.700.8435.82117,402.6030.01
20086816780.710.8545.62153,093.2430.71
20096716410.700.8536.58120,048.8630.71
20107217530.750.8845.47159,414.4531.70
20117117280.730.8756.95196,821.0731.36
20126916920.720.8661.85209,294.4232.09
20137217600.750.8861.64216,986.7632.27
20147017070.730.8662.29212,673.9531.74
20157017180.730.8647.44163,009.2929.84
20166816620.710.8444.72148,637.4729.65
20176515850.670.8253.44169,391.2330.43
Publisher’s Note: MDPI stays neutral with regard to jurisdictional claims in published maps and institutional affiliations.

