1. Introduction
The value of spatial thinking is evident for all disciplines involving the study of phenomena distributed in space and time, e.g., [
1]. For example, an archaeological site description and a digital representation of topography are seemingly very different applications, but they share the need for geographic information (i.e., spatial data) systems that can construct, analyze and visualize spatial data [
2]. The degree to which spatiality, spatial data, maps, and geographic information systems are utilized varies widely from one scientific discipline to another and depends on the type of research. However, awareness of the spatiality and spatio-temporality of phenomena has increased across disciplines and has been called the “spatial turn” in science, e.g., [
3,
4,
5]. In addition to being an integral part of individual disciplines, spatial thinking and spatial technology are important components for integrating different disciplines [
5,
6], as is shown by recent multidisciplinary advances [
7,
8,
9].
Open science has changed the way spatial data are managed and shared [
10,
11]. Scientists are encouraged and enabled to share spatial data, increasing the amount of accessible data for everyone. This in turn improves the possibilities for data-intensive research. As geospatial technologies have become progressively more accessible for everyone, their value is increasingly recognized by researchers across disciplines [
12]. For geoinformatics, the general multidisciplinary turn in science and increase in collaborative research is reflected in the increasing demands for geospatial applications [
13].
Geographic information systems (GIS) are key to supporting spatial thinking and spatial data analysis [
6]. However, not all scientists and lay audiences can use spatial data and software to visualize and study such data. Easy access to spatial data has been provided by internet-based systems that make use of digital maps as the visual interface to geographic information. They are known by several names: (geo)spatial data platforms, GIS user interfaces [
14], digital gazetteers [
15], interactive maps [
16], web-based geographical information systems [
17], web GIS [
18], interactive atlases, geoportals [
19], spatial web portals [
20], web mapping applications [
21], geoportal interfaces [
22], cartographic interfaces [
23] or map services. In this paper, we call these systems “spatial data platforms”. They are web-based graphical user interfaces (GUIs) equipped with features for accessing spatial data for visual examination, analysis, and download [
19]. The logic of spatial data platforms helps to bring out new aspects of the individual datasets and their spatial relationship, e.g., in disaster risk management [
18], and make generalizations of a large amount of spatial data [
24].
Spatial data platforms enable the sharing and use of spatial data without high-level expertise in geoinformatics [
12]. The transition from desktop to online systems brings significant changes for end-users, scientific fields, and data sources [
13], through a more open and efficient exchange of spatial data. In recent years, the application of methods from the natural sciences (e.g., spatial analysis) to cultural data has opened up new possibilities for the systematic study of cultural evolution and diversity [
25,
26,
27]. However, most researchers from the cultural and humanistic sciences have limited interest and expertise as regards participation in the technical development of spatial data platforms, which is usually carried out by geoinformatics and/or IT experts. All parties are needed but the emphasis should be on the content experts [
28].
The design of a spatial data platform has a significant impact on its usefulness and usability, and thereby on the level of adoption for use. The Technology Acceptance Model by Davis and others (1989) [
29] states that technology acceptance depends on two variables: perceived usefulness and perceived ease of use [
29]. Perceived usefulness can be defined as “the degree to which a person believes that using a particular system would enhance his or her job” [
30]. Perceived ease of use is “the degree to which a person believes that using a particular system would be free from effort” [
30].
User-centered design (hereafter UCD) is a framework where the needs of the target group are put at the center of product design [
31]. It is broadly applied in the design of online user interfaces, and therefore readily applicable to the design of spatial data platforms. UCD is defined in the international standard ISO 9241-210:2019 but also interpreted in the scientific literature (e.g., [
32]). The ISO 9241-210:2019 standard defines the concept of UCD and describes its methodological framework [
33]. In summary, the UCD methodology is composed of activities that aim to develop a plan with a user-centered focus, to understand and determine the context of use, to specify the user and organizational requirements, to produce prototypes, and to evaluate designs using established requirements [
32].
This study aims at promoting the development and utilization of spatial data platforms to advance novel multidisciplinary research. More specifically, we aim at answering four research questions: (1) What kind of motivation and expertise is needed in organizing multidisciplinary spatial data sharing in human-history research? (2) Which types of data should the platforms be able to handle, and which criteria do the datasets need to meet to be shared in a spatial data platform? (3) What kinds of platform functionalities are desirable for the end-users to be able to fully utilize the potential of spatial data? (4) What kind of design process is needed to guarantee the acceptance, broad adoption, and continuity of such platforms? Throughout the paper, we focus on technology and design that have minimum implementation costs and allows international, collaborative use. Thus, national spatial data infrastructures are beyond the scope of this paper.
To answer the research questions, we present (1) a review of scientific literature on user-centered design of spatial data platforms (
Section 2) and (2) an examination of existing spatial data platforms within human-history themes (
Section 3 and
Section 4). Moreover, (3) we draw insights from a user-centered conceptual design and prototyping case study (
Section 3 and
Section 4). The case study is positioned in the context of multidisciplinary studies of the human past in North-Eastern Europe and Western Siberia, examining the spread of cultures, languages, and genetic inheritance (pooled under the umbrella of project URKO, Uralic triangulation, [
34]). We reflect the results of the literature and platform reviews to the user-centered design process of the spatial data platform URHIA (Uralic Historical Atlas), an open-access platform for multidisciplinary spatial datasets for scientific research of the human and cultural evolution in this area. This thematic context and the diverse spatial data necessitate open-data sharing utilizing user-friendly interphase and simultaneously provide a good test setup for examining the design process of a user-centered spatial data platform.
2. Spatial Data Platforms: Purpose, Content, Functions, and the User-Centred Design Process
Gregory and Healey [
35] noted in 2007 that most of the coordination of historical spatial data platforms was made at a national coordination level, and that the platforms contained data from the stage when most countries started to conduct modern-style statistical data collections (e.g., census data). As there have been rapid technological developments since then, new spatial data platform providers, new platforms, and new user groups have emerged in research, education, and commercial use [
19].
Datasets in the natural sciences such as biology and geography are widely available in a spatial format. These include e.g., satellite image time series, species observations, and digital elevation models. They are easily and precisely collected in spatial format or can be transformed into spatial data with low effort [
36]. Datasets in the natural sciences often utilize the two data models, i.e., the object model and the surface model, flexibly. They also represent information with a wide selection of data structures, including the raster data type and multiple vector data types (also called “Earth observation” and “geographical datasets” in [
19]). The “spatial turn” in the humanities takes advantage of digital approaches such as applying GIS to research [
37]. Within the digital humanities, collecting and organizing historical data into a spatial format has been evolving from desktop GIS towards web-based GIS systems [
38]. Incorporating historical texts and non-traditional data sources into a spatial format, so-called “spatialization”, is a thriving field in the humanities fields [
39]. In linguistics use cases, areas in which languages are spoken are typically expressed as points with coordinates (e.g., the WALS Online platform [
40]) but, although challenging, there have been attempts to present languages also as areas (e.g., the Ethnologue platform [
41]). Delineating exact historical settlement boundaries or areas in which languages are spoken is often challenging [
42,
43,
44].
Spatial data platforms usually integrate data from multiple sources, by respecting licensing terms set by original data providers [
45]. By doing so, researchers have direct access through a single platform to multiple data sources relevant to their study. For example, in a Finnish archaeological study [
46], elevation data were used from the National Register to investigate the spatial relationship between ancient settlements and coastline retreat. This is a good example of the need to bring together data on different themes, in this case, information on the physical environment and ancient settlement. Spatial data can be brought into the platforms either as files or via web interfaces, such as a WMS or WFS (following the international OGC standards). which saves maintenance and management efforts needed for large datasets [
47]. For example, elevation data by the National Land Survey of Finland [
48] is openly available via WMS and it is possible to integrate this data into spatial data platforms.
Basemaps are important in spatial data platforms for easy orientation, navigation, and readability of spatial data. The basemap selection depends on the purpose of the spatial data platform, level of user interaction, and applied tools [
45]. Historical platforms generally favor artistic basemaps, while platforms for many other purposes, e.g., tourist maps, use realistic, abstract, and symbolized basemaps [
45]. The use of orthophotos as basemaps weakens the user’s map-reading performance [
49]. Map comparison techniques for two overlaid images, such as adjusted transparency, help to overcome map interpretation challenges [
50].
The design and user-friendly layout of the historical spatial data platform are considered to be key to good usability and wide acceptance [
28]. Data visualization is considered to be an important enrichment in many studies, which emphasizes the importance of the map view when presenting spatial data [
10,
19,
45,
51]. This basic but easy-to-overlook requirement for a platform—to include a map view—is a prerequisite for the platform to become widely adopted. The usability of spatial data platforms depends on both the general elements of the spatial data platform and the elements of the map view [
52].
The data-browsing user experience is a vital part of modern web-based applications as their task is to help users to obtain the resources they need quickly and efficiently [
53]. Searching datasets based on indexes, i.e., keywords or tags attached to individual datasets, is quicker and more precise than a text search [
53]. Data catalog type platforms (a spatial data platform type with no map view) often use search tools that are based on text-only, for example, a keyword search tool [
54].
Perceived usefulness and ease of use dictate the acceptance of new technology among target end-users [
29,
30]. The UCD (user-centered design) process should therefore aim at considering the actual needs of the end-users and making the product as easy to use as possible [
16]. To attract at least the majority of an end-user group, the design should consider different types of technology adopters and variables like skills, personality, and communication behavior [
55].
The most frequently used methodologies within the UCD framework have included identification of stakeholders and end-users, user interviews and working with a focus group, prototyping, and asking end-users to evaluate the usability of existing products [
32]. Studies focusing specifically on the development of spatial data platforms highlight similar UCD methods, such as the early involvement of end-users, analysis of users’ needs, and prototyping, but also more specific methods such as participatory designing of the content of a spatial data platform, user testing of existing platforms or user testing of a prototype platform [
21,
56,
57].
The previous research indicates that innovations (such as new spatial data platforms) need to be compatible with the values, beliefs, and previously adopted ideas of the planned end-users and they need to be successful [
55,
58]. In addition, the naming of the technology and the use of mutually accepted concepts promote adoption [
55].
Human-history scientists and psychologists [
28] have argued that it is better to let people critically evaluate a functional suggestion or example, rather than ask for their suggestions without any references. Literature also highlights that a design process should be human-centered, meaning that the needs, desires, and limitations of the end-users need to be carefully considered [
59].
4. Results
4.1. Development and Coordination of Spatial Data Platforms
We found that today, the providers of historical spatial data platforms include universities, libraries, research centers, enthusiasts, or companies. Our review contained a diverse sample of spatial data platform providers, developers, and owners (
Table 2). For example, 7 out of 12 of the selected spatial data platforms were developed by universities, research centers, or research groups, but historical spatial data platforms have been provided also by academic institutions in collaboration with an information-communications technology company, non-governmental organizations, governmental organizations, and private individuals (
Table 2).
4.2. Data in Spatial Data Platforms
In our review of spatial data platforms, the most common theme (38%) was languages (
Table 3). Other common themes included historical maps and historical administrative data (23% each), ancient DNA (17%), and cultural heritage and archaeological sites (17% each;
Table 3). Themes such as religious history and environmental conditions, including e.g., climate and topography, were least represented (8% each;
Table 3).
Our review examined two spatial data platforms that were considered multidisciplinary since they contained at least three data themes. Of those platforms, Ancient Genomes [
63] integrated data on ancient DNA, languages, and cultures. D-Place [
64] brought together data on languages, cultures, and many aspects of the environment (
Table 3).
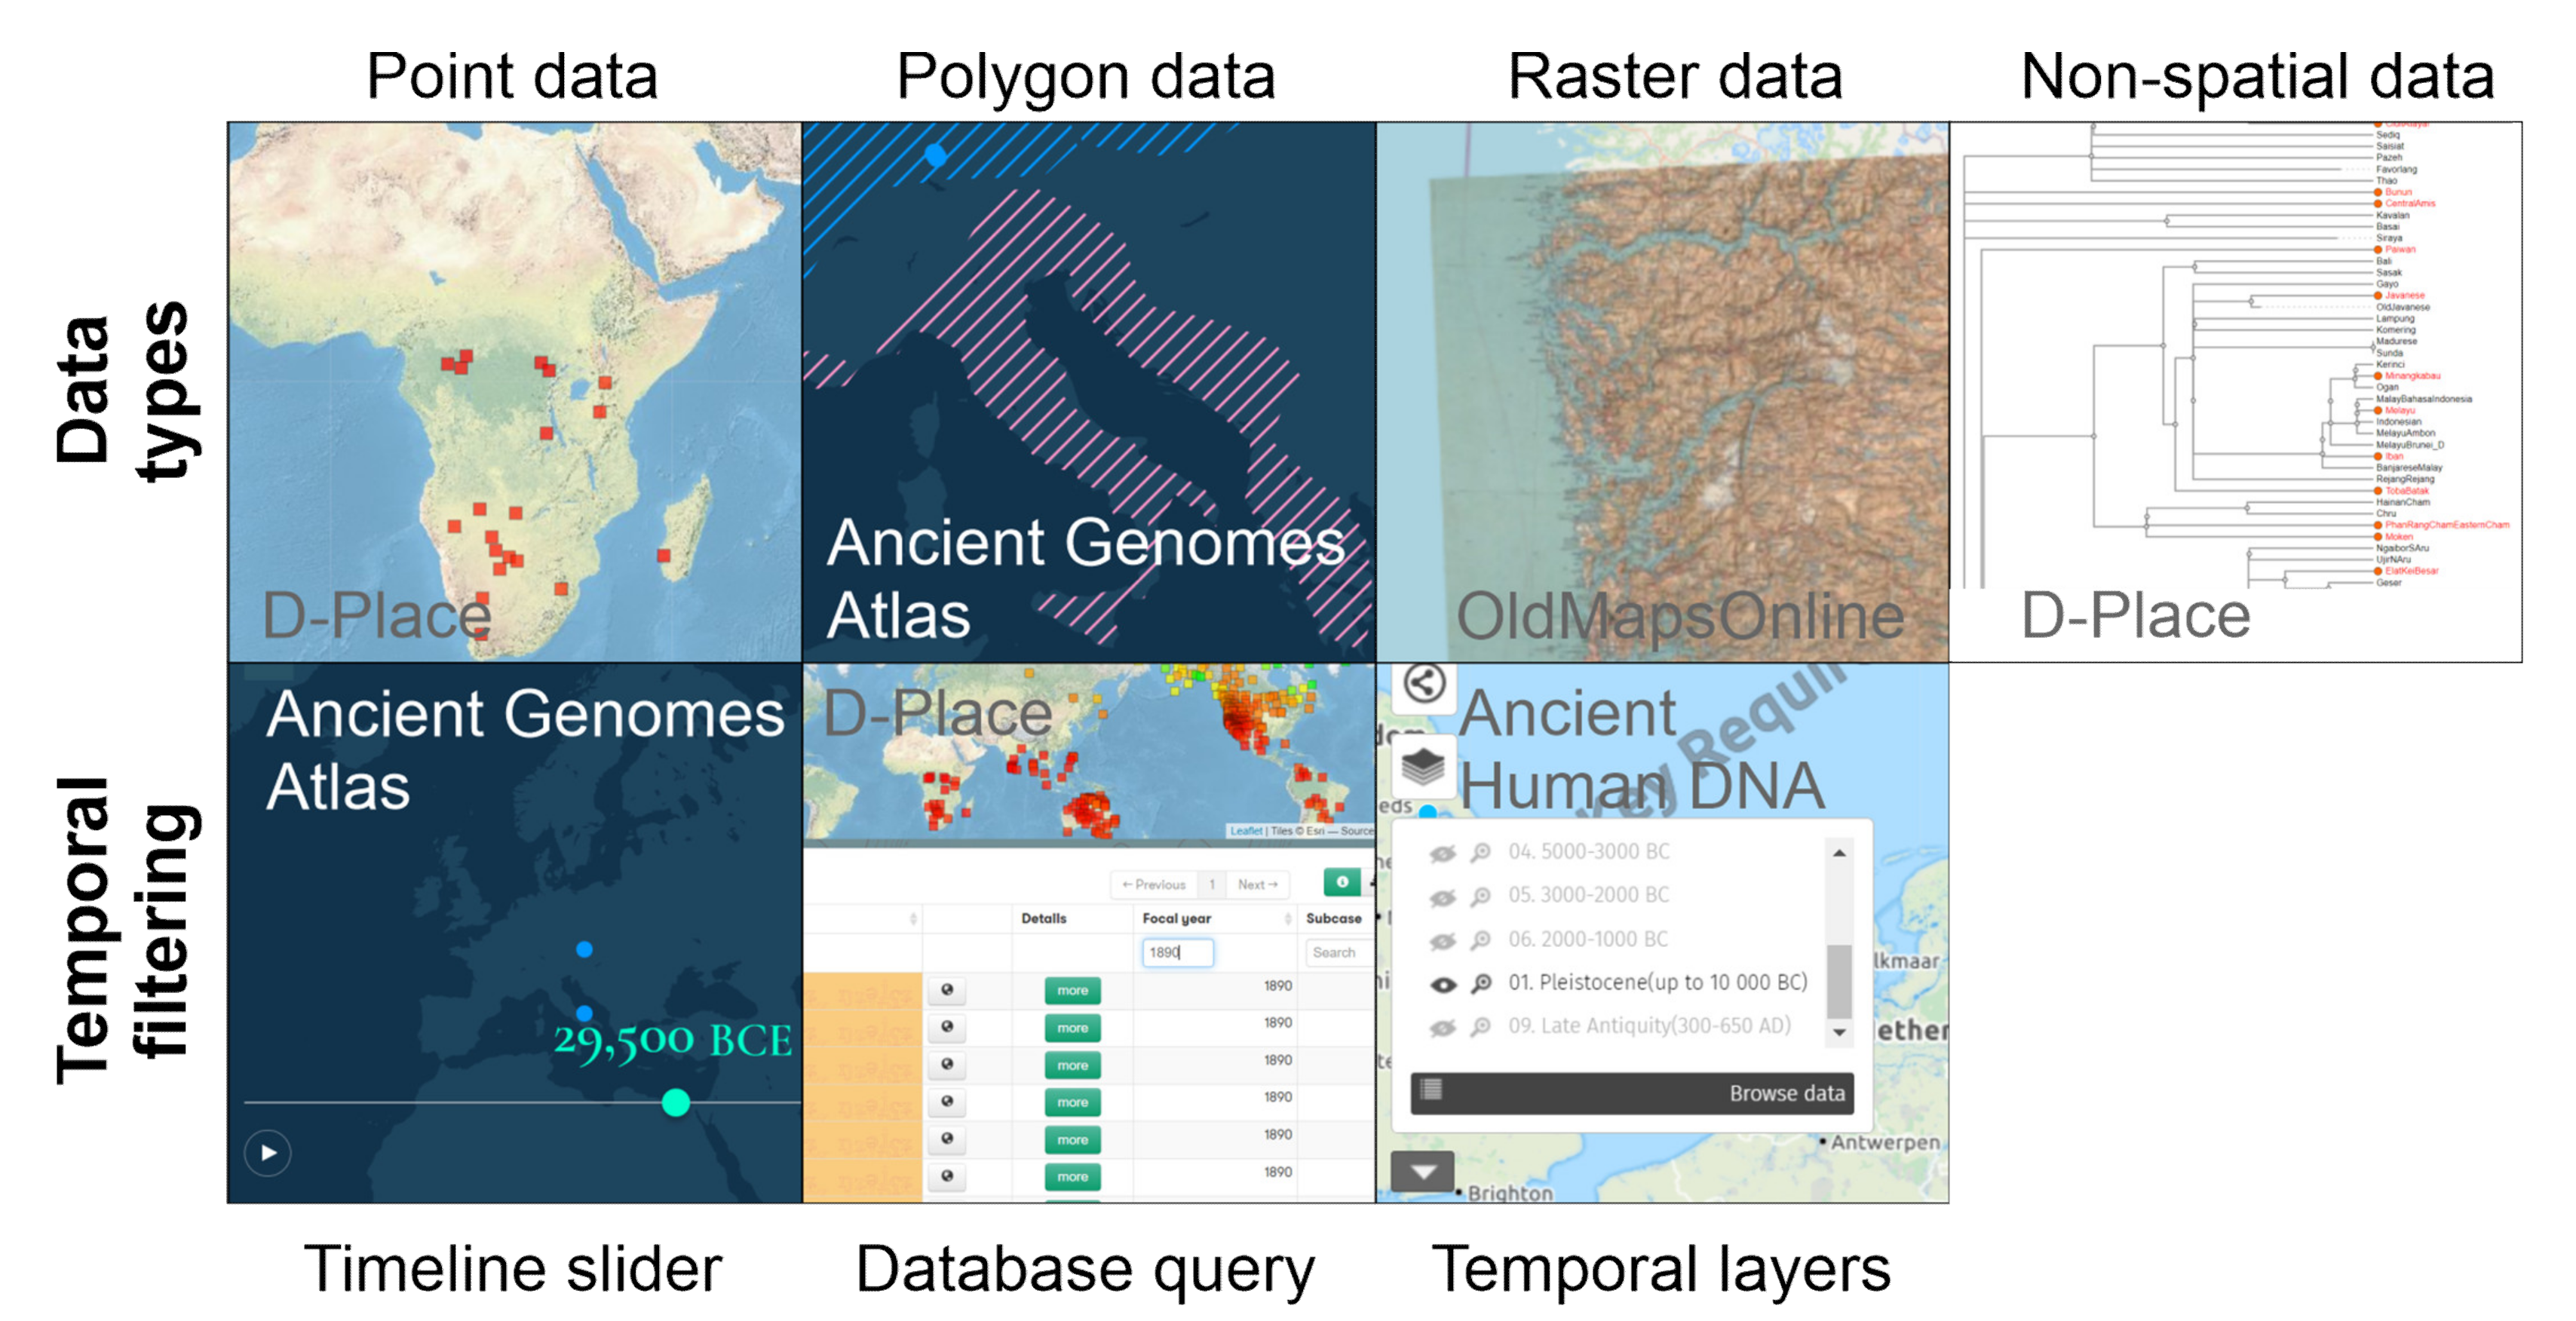
All examined spatial data platforms included vector data: point and polygon types were most common, included in 67% and 50% of platforms, respectively (
Table 3;
Figure 1). Raster data was included in only one of the examined platforms (this example, OldMapsOnline [
65], indexes and helps users search historical georeferenced maps based on their extent, but the raster data cannot be examined directly on the interactive map window, instead readers are directed to the source libraries). Non-spatial data, often links to data sources, references to journal articles, phylogenetic linguistic trees, and photographs, were used in 58% of the platforms (
Table 3;
Figure 1).
The incorporation of remote layers was not common in our review of historical spatial data platforms. Only OldMapsOnline provided remote information through their platform (
Table 3). Open Geospatial Consortium web-interface standards (WMS, WFS) was not applied in any platforms (
Table 3).
Most of the reviewed spatial data platforms (67%) included data describing at least the modern era, since circa 1500 CE, but the review covered prehistorical platforms as well (
Table 4). We examined how temporality and chronology had been expressed in the data and treated in the platform design. Sixty-six percent of the platforms included layers with time attributes or layer-specific time-related metadata (
Table 4). When time information was given, time was expressed in different ways: as a date (year, year and month, or even year, month and day), a date range with varying precisions, or as an archaeological or historical period (e.g., “Stone Age”; “medieval period”;
Table 4). In one case no true-time information existed, but language speaker areas had been given a vitality attribute describing whether the language is vital, endangered, or extinct (Ethnologue,
Table 4).
Dates were in all cases expressed following the Gregorian calendar, prehistorical dates as years before the Common Era (BCE) or before Christ (anno Domini; AD), and historical dates typically using simpler notation (e.g., “1900”;
Table 4). In some cases, time attributes were accompanied by an estimate of the accuracy of the time information (e.g., HistoGIS [
66]). Examples of time information found in our review included the radiocarbon dated time of an ancient genetic material sample (e.g., Ancient Genomes Atlas), the date of a historical map (e.g., HistoGIS), or a date range describing when a religious group existed (Database of Religious History [
67]).
The way temporality could be presented or data filtered based on time was solved mainly in three ways (
Table 4;
Figure 1): (1) using a graphical timeline slider, (2) providing a database query, or (3) supplying data layers, each presenting one time period (exemplary platforms listed in
Table 4). In our review, 23% of the spatial data platforms used a timeline slider, 25% a database query, and 8% temporal layers (
Table 4;
Figure 1). The participants of our user workshop (
Section 4.4) reported that the timeline slider functionality (e.g., OldMapsOnline) is interactive and easy to use. By contrast, they found that the database query (e.g., HistoGIS) requires greater skill, concentration, and knowledge of the database’s temporal extent. Participants of our design process considered that the option of using period-specific layers (e.g., Ancient Human DNA [
68]) is perhaps easiest to use and technically easiest to implement. However, the data management required for dividing a dataset into temporal layers and importing multiple layers instead of one into a spatial data platform is laborious. In addition, the choice of how the dataset is divided has a far-reaching influence on their appearance and further use.
The basemaps of historical spatial data platforms included in our review exhibited notable variation from single-choice and highly simplistic basemaps (e.g., Ancient Genomes Atlas with only land and water differentiated) to detailed, scalable, and customizable ones. A basemap-switcher functionality was used in most of the map views, i.e., the user could choose between multiple basemaps. The archaeological platforms (Ancient Locations [
69], Finnish Heritage Agency [
70]) were accompanied with the possibility to switch to Google 3D or elevation surface backgrounds. NameSampo [
71] provided both a modern global (Google Maps) basemap and a historical basemap for Finland. Linguistic databases (Glottolog [
72], WALS Online, Ethnologue) used basemaps derived from widely-used libraries, including Google Maps and OpenStreetMap, with multiple basemap choices. Platforms dedicated to historical maps only did not have a basemap-switcher functionality, rather they included one basemap option with only the most essential information, such as land, water bodies, and the main road network.
4.3. Design and Functionalities of Spatial Data Platforms
In our platform review, the spatial data platforms were broadly categorized into two categories based on the role of the map view and the browsing functionality. Interactive map-type platforms were centered on the map view and had many similarities to traditional desktop GIS software. In catalog-type platforms, the attribute information was accompanied by a map view, and not the other way around. We also identified a sub-type, an encyclopedia, and bibliography-catalog type. It differs from the catalog-type by the system architecture, that is, it features more diverse data types, sources, and is technically more complex. We had restricted our review to platforms that presented data layers in a map view. However, the use of the map view varied between platforms (
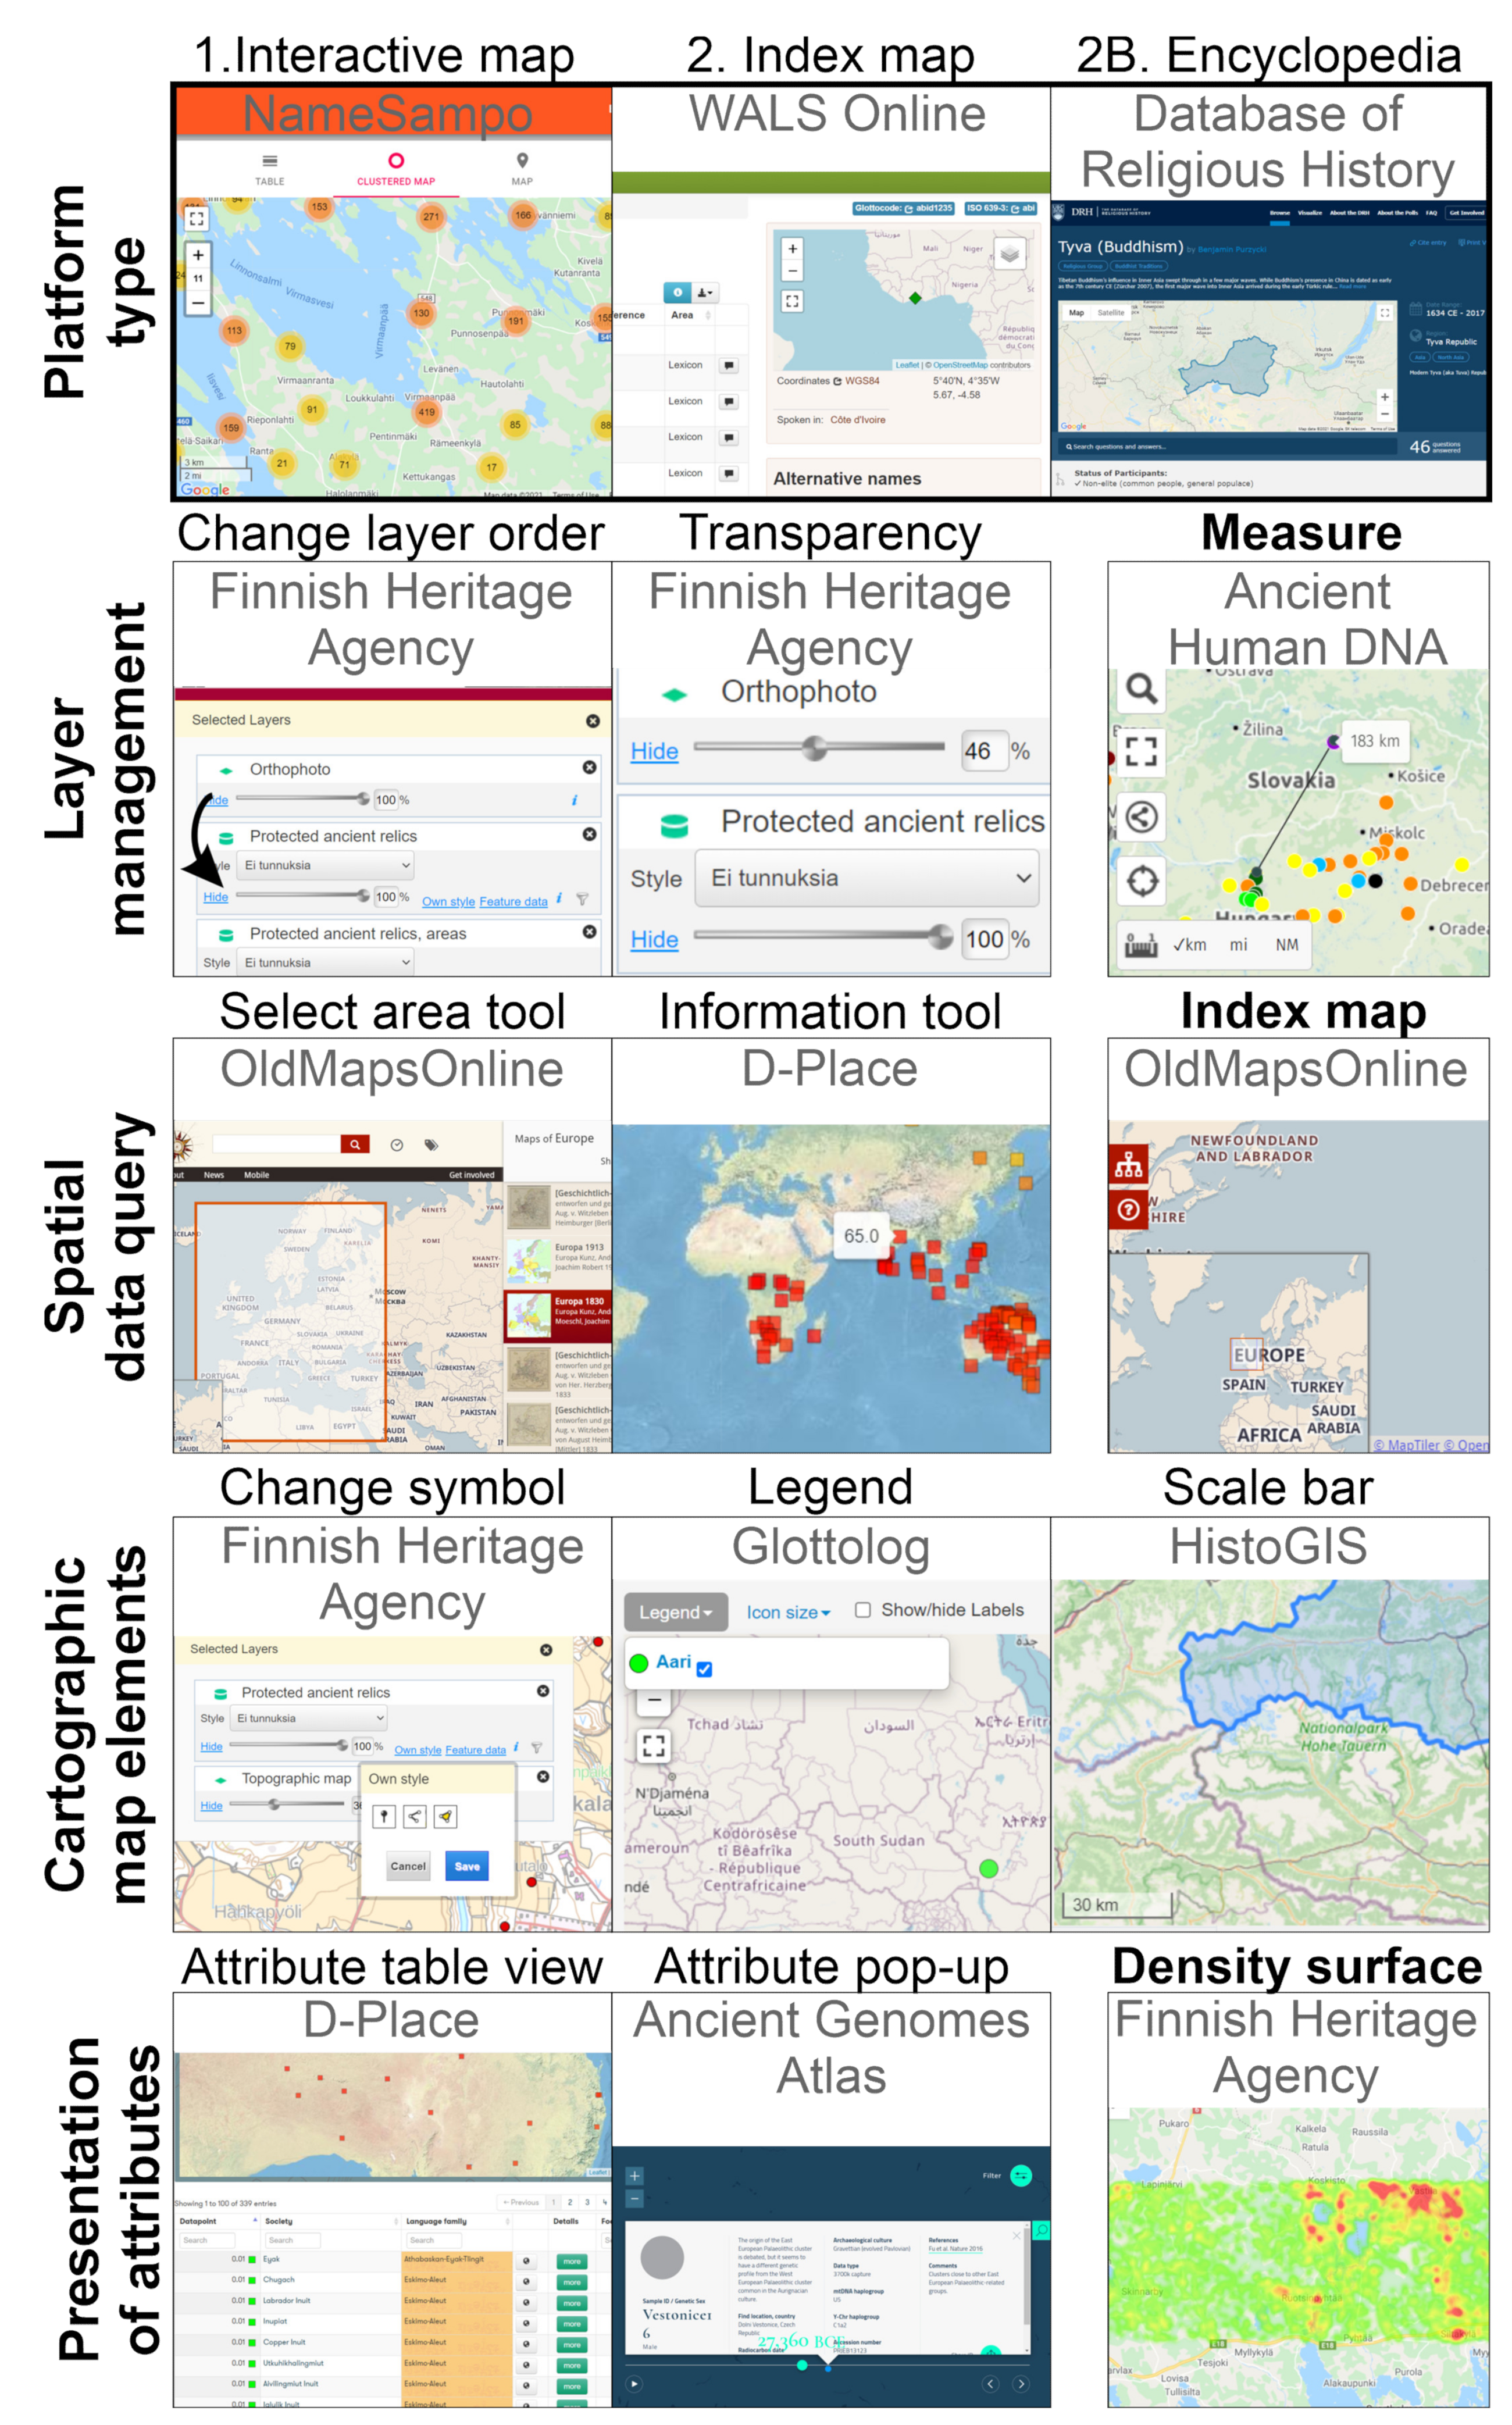
Table 5;
Figure 2); while six platforms operated with an interactive map view, six platforms acted as data catalogs with index maps and two platforms as combined encyclopedias/bibliographies with a map view.
The sampled platforms of the interactive map-view type are those where the entire functionality is centered on the map view, with various forms of GIS functionality (e.g., NameSampo and the Ancient Genomes Atlas;
Table 5;
Figure 2). We found that catalog-type platforms with database search and filtering options were mostly cultural-historical themed, such as ethnic and linguistic atlases. Catalog-type platforms are often improved with modules such as an index map, a graph viewer, a discussion forum/blog, e.g., D-Place, Glottolog, WALS Online, or Ethnologue (
Table 5).
Spatial data visualization often consists of several data layers arranged and visualized on top of one another. Layer management and opacity functionalities depend on the structure of the platform. Of the sampled platforms, 41% enabled changing the order of layers and/or setting the opacity (transparency) of the overlaid layers (
Table 5;
Figure 2). In contrast, the catalog-type platforms only provided an index map for individual data layers, and did not allow multiple layers to be compared on a map simultaneously, i.e., they lacked layer management tools completely (
Table 5).
Density surface functionality, a feature allowing the visualization of the density of the data on a map with color, was included in two (17%) platforms (
Table 5). Labeling map items and changing the map item symbol styles as possible in 23% of the platforms, and most common in catalog-type platforms (especially with language data, e.g., in D-Place and Glottolog;
Table 5). A legend panel was found in 50% of the platforms and was most common in the interactive-map type of platforms (
Table 5;
Figure 2).
We found that assignments related to searching and narrowing down data in the platforms were solved with a wide variety of options e.g., drop-down lists, checkboxes, text fields (search tool), toggle buttons (previous/next page arrow icons), pagination divisions (allows skipping between pages), tags (keywords) or a map carousel (linked map views). Querying data in the map view was done with a select area tool or information tool, which has its origin in the desktop GIS toolbox (
Table 5;
Figure 2). Technically speaking, selecting the area for the desired region was performed either by drawing a rectangle (polygon) over a map area to discover all spatial data available within this area (OldMapsOnline, Database of Religious History) or with the aid of a separate pop-up map view (NameSampo), where an area was framed by zooming and panning the map view (e.g., Database of Religious History;
Table 5). The information tool opened an additional information window for the selected object on the map, containing dataset attribute information and in some cases links to external data sources (e.g., to image bank, Wikipedia, multimedia files;
Table 5;
Figure 2).
Data in a spatial data platform is associated with attribute information—tabular information of properties of map items. In the sampled platforms, this information was presented in two ways, either directly as a catalog (data in table format; full or simplified), a list of fields (e.g., attribute table columns; full or simplified), and indirectly as a pop-up window (custom display of attribute information;
Table 5;
Figure 2). According to the participants of our user workshop (
Section 4.4), custom attribute displays, for example, pop-up windows, in some cases improve the map browsing experience. Attribute information was presented as a table or as a list of attribute columns in 83% of the platforms (
Table 5;
Figure 2). One platform presented attribute information content in a pop-up window (Ancient Genomes;
Table 5;
Figure 2) One spatial data platform had no attribute data because it contained raster data, i.e., a grid of single-cell values (such as georeferenced image files;
Table 5). Regardless of the data type, all spatial data can have metadata, i.e., information describing the dataset. For example, old historical maps are raster images and therefore they do not have attribute tables, but they can have many types of metadata (OldMapsOnline;
Table 5).
The option to download data, either in spatial data or tabular format (attribute table only) was possible in 58% of the platforms (
Table 5). Examples of common spatial data formats included GeoJSON (geographic features, similar to ESRI shapefile format) or GeoTIFF (raster file) and tabular formats, for example, JSON and CSV (spreadsheet).
Other common GIS features included in the reviewed platforms were map-frame-related functionalities such as zoom in and zoom out, pan map (grab hand icon), scale bar, and index map in the map frame corner (
Table 5). Map navigation tools like zooms and pan maps are core functions in all examined platforms, regardless of the platform type. In some cases, zooming operates as a scrolling mouse button, and in some cases, navigation was performed with + and – icons in the map view. The users involved in our case study (
Section 4.4) found that zooming with the scroll wheel was more intuitive. Scale bar is a map feature usually added to interactive map type of platforms, and it was applied in four of the reviewed platforms (
Table 5;
Figure 2).
Our review revealed, that using index maps to ease locating the shown map area in a wider geographical context was not widely adopted. The tendency of discarding this function was observed to be independent of the type of spatial data platform or historical scientific theme. Tools for measuring straight-line distances on the map were also requested by our participant users, to gain insight into the objects’ geospatial relationship.
4.4. User-Centred Design of Multidisciplinary Spatial Data Platforms
Our test case, the URHIA (Uralic Historical Atlas) spatial data platform, aims to meet the needs of a broad group of end-users, such as historians, linguists, and geographers from the area of North-Eastern Europe and Western Siberia. The philosophy of the platform was to serve multidisciplinary research by being inclusive, i.e., not excluding users based on scientific fields or other background factors. Based on the literature review, we chose to strive for this goal by adopting an inclusive participatory design process, familiar from the computer sciences [
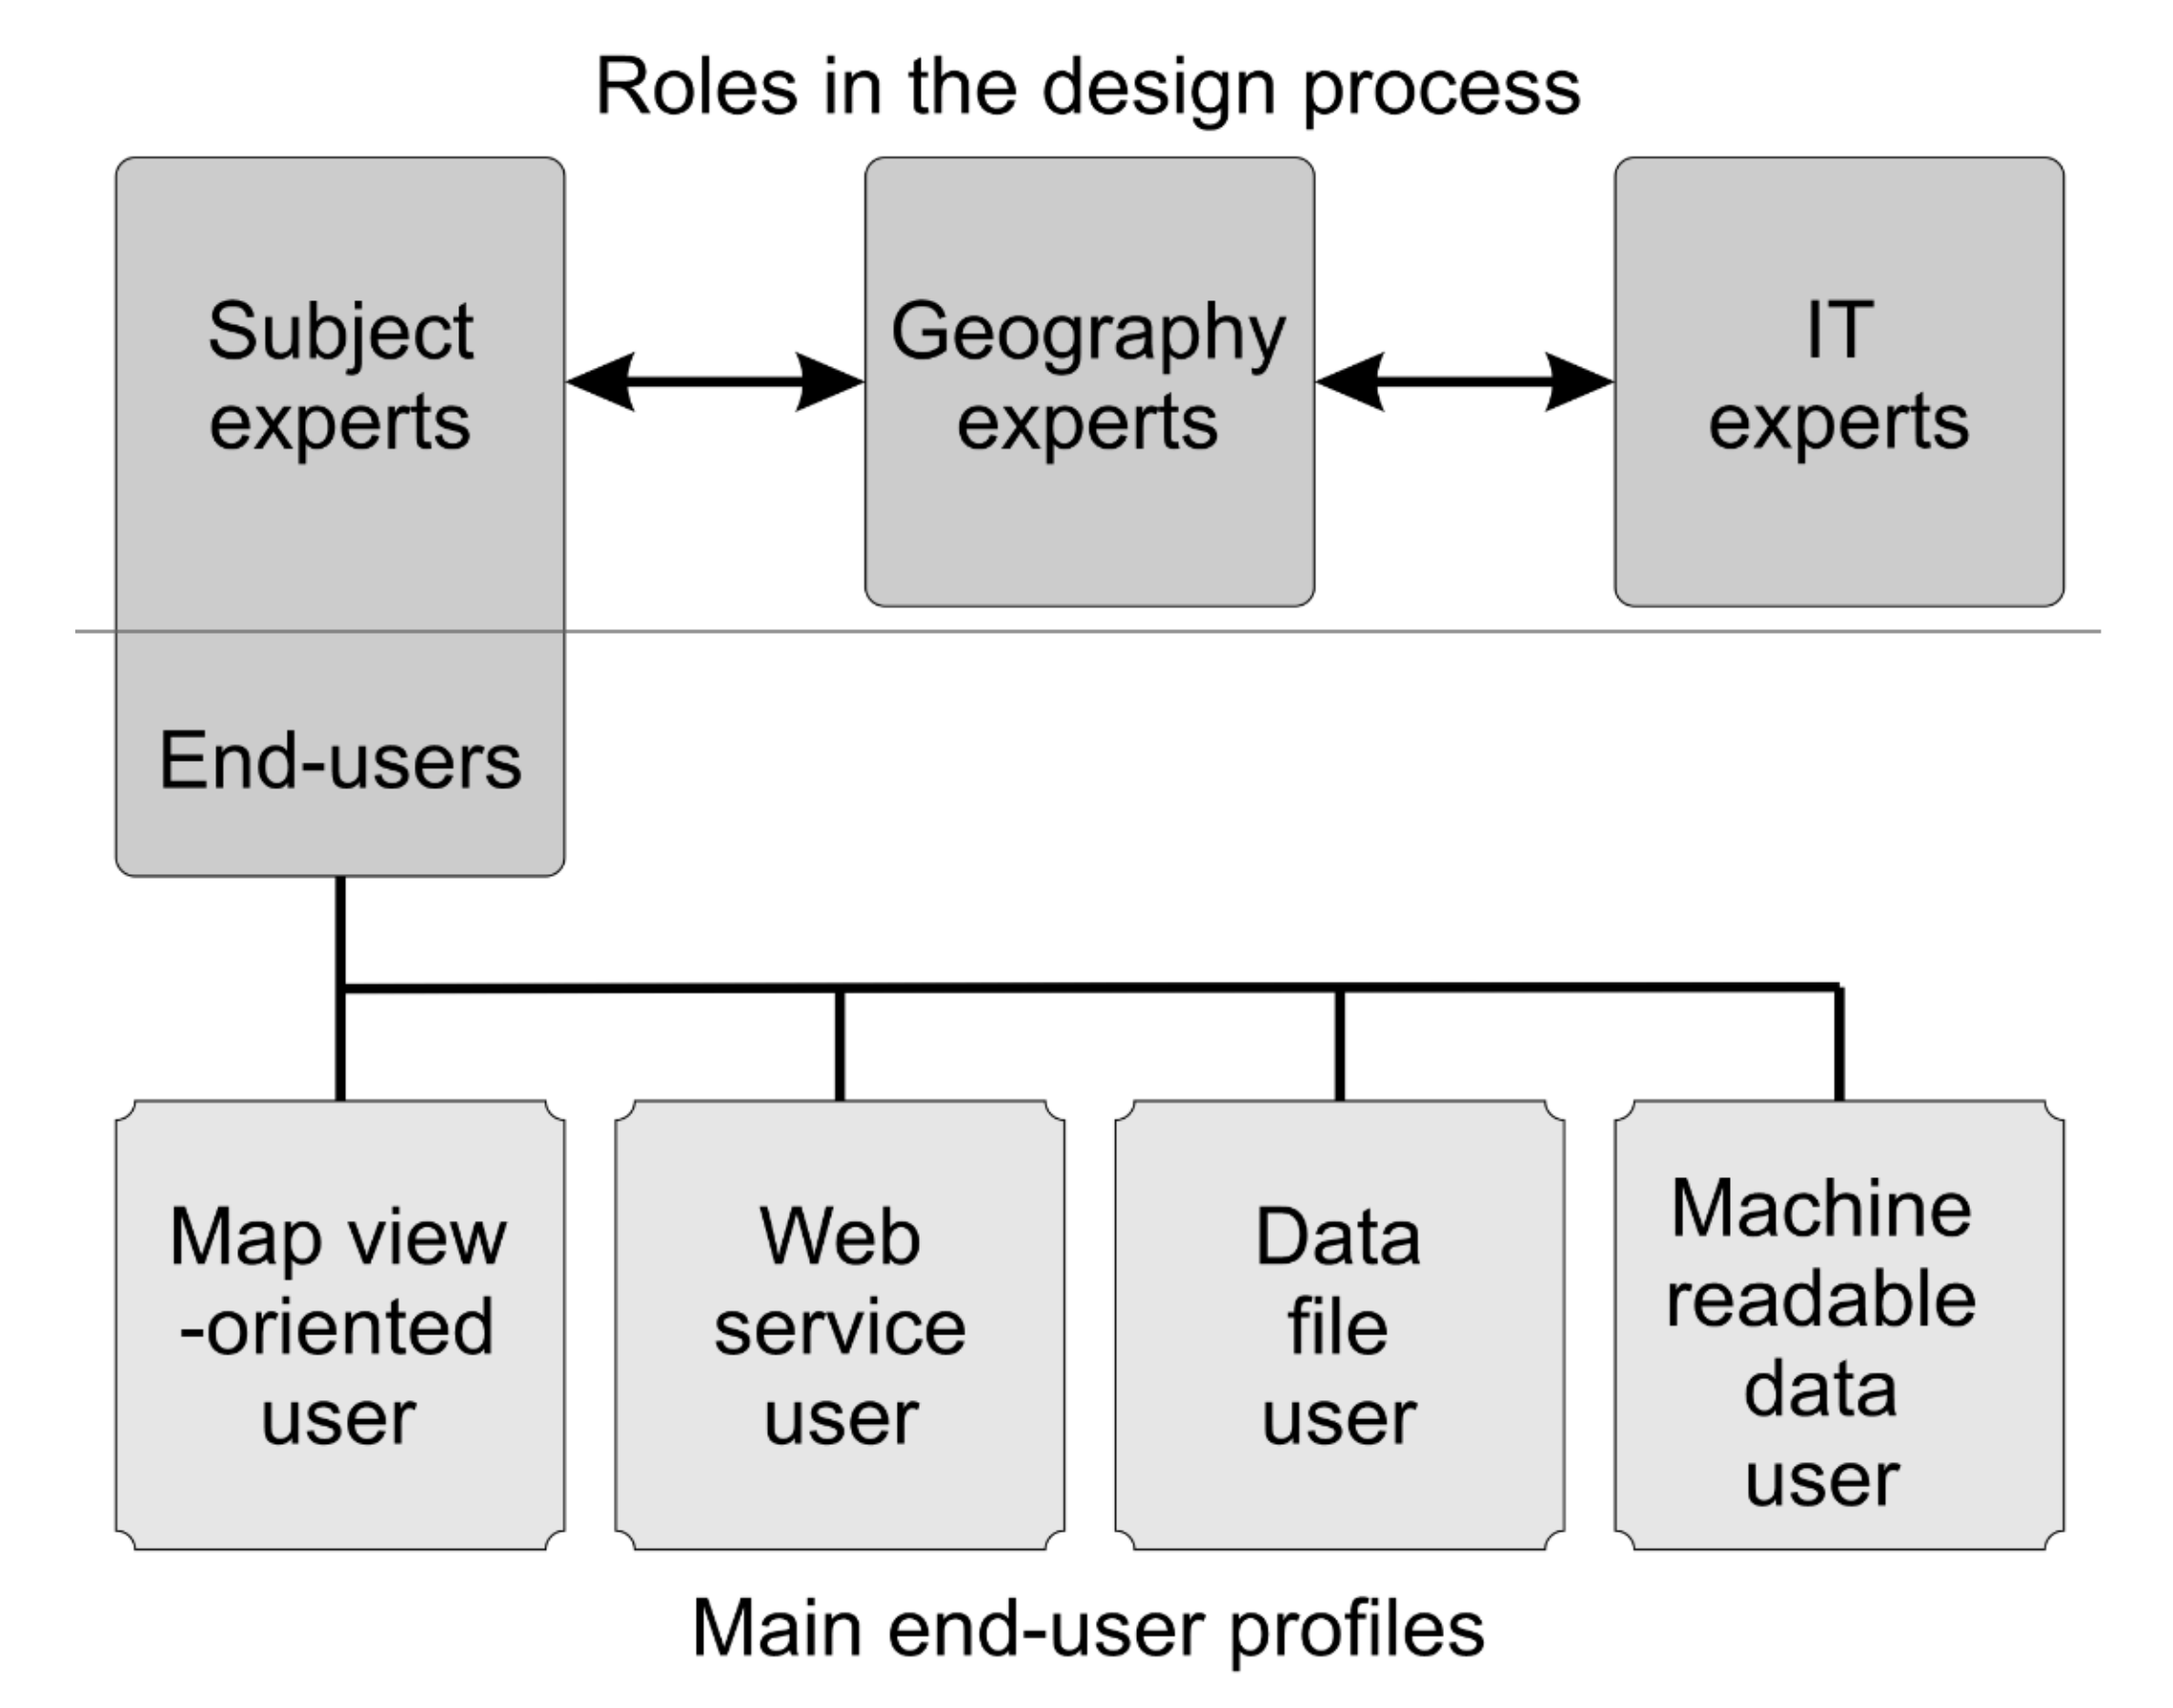
56]. Inclusive meant inviting representatives from relevant scientific fields (biology, linguistics, archaeology, geography) and IT support, as well as a team of four geoinformatics experts to sit around a common table (
Figure 3). In the process, we chose to apply the following UCD methods (cf. [
32]): identification of stakeholders and end-users, working with a focus group, asking end-users to evaluate existing technology and prototyping. These methods were applied and timed in such a way that end-users were involved early in the process, their needs were mapped and the content and functionalities of the spatial data platform were discussed with them (cf. [
21,
55,
56]).
Following the UCD guidelines, the URHIA design process was initiated with several core group meetings. These meetings dealt with the purpose of the platform, as well as key concepts, user groups, and content, i.e., the datasets to be included in the platform. The meetings were kept small to clarify participants’ roles and involved experts with varying profiles: from subject fields (e.g., linguistics), geography, and IT. These meetings were usually arranged between geographers and either subject experts or IT experts. These meetings produced preliminary, shared expectations, common terminology, a list of key stakeholders, and a working title for the spatial data platform.
This discussion continued and had a large role in the main design event for URHIA, and the preliminary plans were carefully evaluated and modified based on the discussions. The main user-centered design event, or a “design workshop” was arranged in May 2020, where identified key end-users and the involved geography experts were invited to participate. The invited end-users were selected from individuals interested in the human history of the Uralic area with the expectation that they would represent the highest expertise and maximum variation in thematic specialties and spatial data skills. IT experts were not invited to the workshop. A secondary, but also very important function of the workshop was to increase awareness of the URHIA platform.
We planned the URHIA design workshop based on the preceding core group meetings, introducing the target user group to different types of existing spatial data platforms, their different functionalities, branding, and designs. This helped the non-expert participants to fully participate by introducing key concepts in geoinformatics and different spatial data platform options. We then asked them to vote, rank, comment on and discuss different options, including the functionalities and the naming or branding of the platform. This part of the workshop had been prepared by conducting the inventory of historical spatial data platforms, as described in this paper. The platform comparison gave insight into the main differences in terms of functionality.
The workshop was successful based on the feedback and how much the design process subsequently leaped forward. Working remotely allowed equal participation from everywhere. In addition, this type of interactive and multimodal workshop gave equal opportunities for participants to express opinions. During the presentations and poll questionnaires, workshop chat was used actively. For example, during the multiple-choice questions, participants commented on and discussed the issues further. As the style of the chat messages was informal, people expressed themselves with a lower threshold, and insightful comments were documented from the chat.
Based on the case study, we found that there were three main expert roles in the communication of a successful design process (
Figure 3): namely so-called (1) subject experts (end-users), (2) geography experts, and (3) IT experts (including experts in web design). The first group was intentionally placed at the center of the design process, having a dual role as designers and users of the result. They represented both the users of the platform but also the data providers. IT and design experts evaluated plans at each step in terms of feasibility and cost and suggested options. Geography experts with a strong geoinformatics background, working at the edge of science and geospatial technology, had a major role in bridging the gap between subject and IT experts. Being experts in the data types and geospatial methods, they were able to translate subject-specific concepts and thus help reach a common understanding. We also found it most efficient to hold meetings with only two groups of experts present at a time: either subject and geography experts or IT and geography experts. Thus, communication was two-way and therefore straightforward in most of our design meetings (
Figure 3).
The UCD process raised a large variety of needs, working cultures, and skills among the target audience. Individuals from specific scientific fields shared many needs and working cultures and had some similarities in skills. However, they formed very heterogeneous sub-groups. Based on the participating individuals’ main type of use, we identified four main end-user profiles for a multidisciplinary spatial data platform (
Figure 3):
- (1)
Map-view-oriented user: uses the interface to understand and locate phenomena on a map.
- (2)
Web-service user: connects to the data from GIS software through a web map service (WMS) or a web features service (WFS).
- (3)
Data file user: downloads and reads in the data as original files.
- (4)
Machine-readable data user: pulls the datasets into data analysis software (in a machine-readable format).
This rough classification helped the design team to consider the most distinct user groups throughout the process.
Examination of existing historical spatial data platforms leads to valuable observations on how to select the basic architecture of the platform and select and implement individual functionalities for the multidisciplinary URHIA platform (
Table 6). However, owing to the participatory design or the UCD, the preliminary plans evolved considerably. The preliminary design had been prepared in the spring of 2020 by the geography and IT experts, based on an assignment from the project team. By gaining input from the end-users themselves, large changes were made particularly in the naming and acronym of the platform, the planned content, the list of desired functions and their order of importance, as well as planned support materials (
Table 6).
For example, the working title of the platform followed terminology specific to geoinformatics and concentrated on one scientific field, linguistics (“Map service for the Uralic languages”). The end-users raised several field-specific terms. They noted that the working title was too exclusive and that the geoinformatics vocabulary is not always self-explanatory or general enough. In addition, the subject experts were able to evaluate and correct the precise use and spelling of terms (such as “Uralic” and “historical”). With the help of the versatile participator group, we were able to select a name that was the best compromise: i.e., as descriptive, self-explanatory, and simple as possible. For example, the term “atlas” was selected instead of other variants, even though it is an imprecise term in the geoinformatics context. Similarly, the established common terminology helped focus and finalize all texts appearing in the spatial data platform.
As another example, the UCD process helped narrow down the number of functionalities and reorder them based on their importance to the end-users. Prior to the workshop, the geography and IT experts had a limited understanding of the skills, working culture, and needs of the end-users and how much variation there is between individual users (cf.
Figure 1). Without the participatory design, the platform would have become too complex for some users and much more suited to web service users than other types of users.
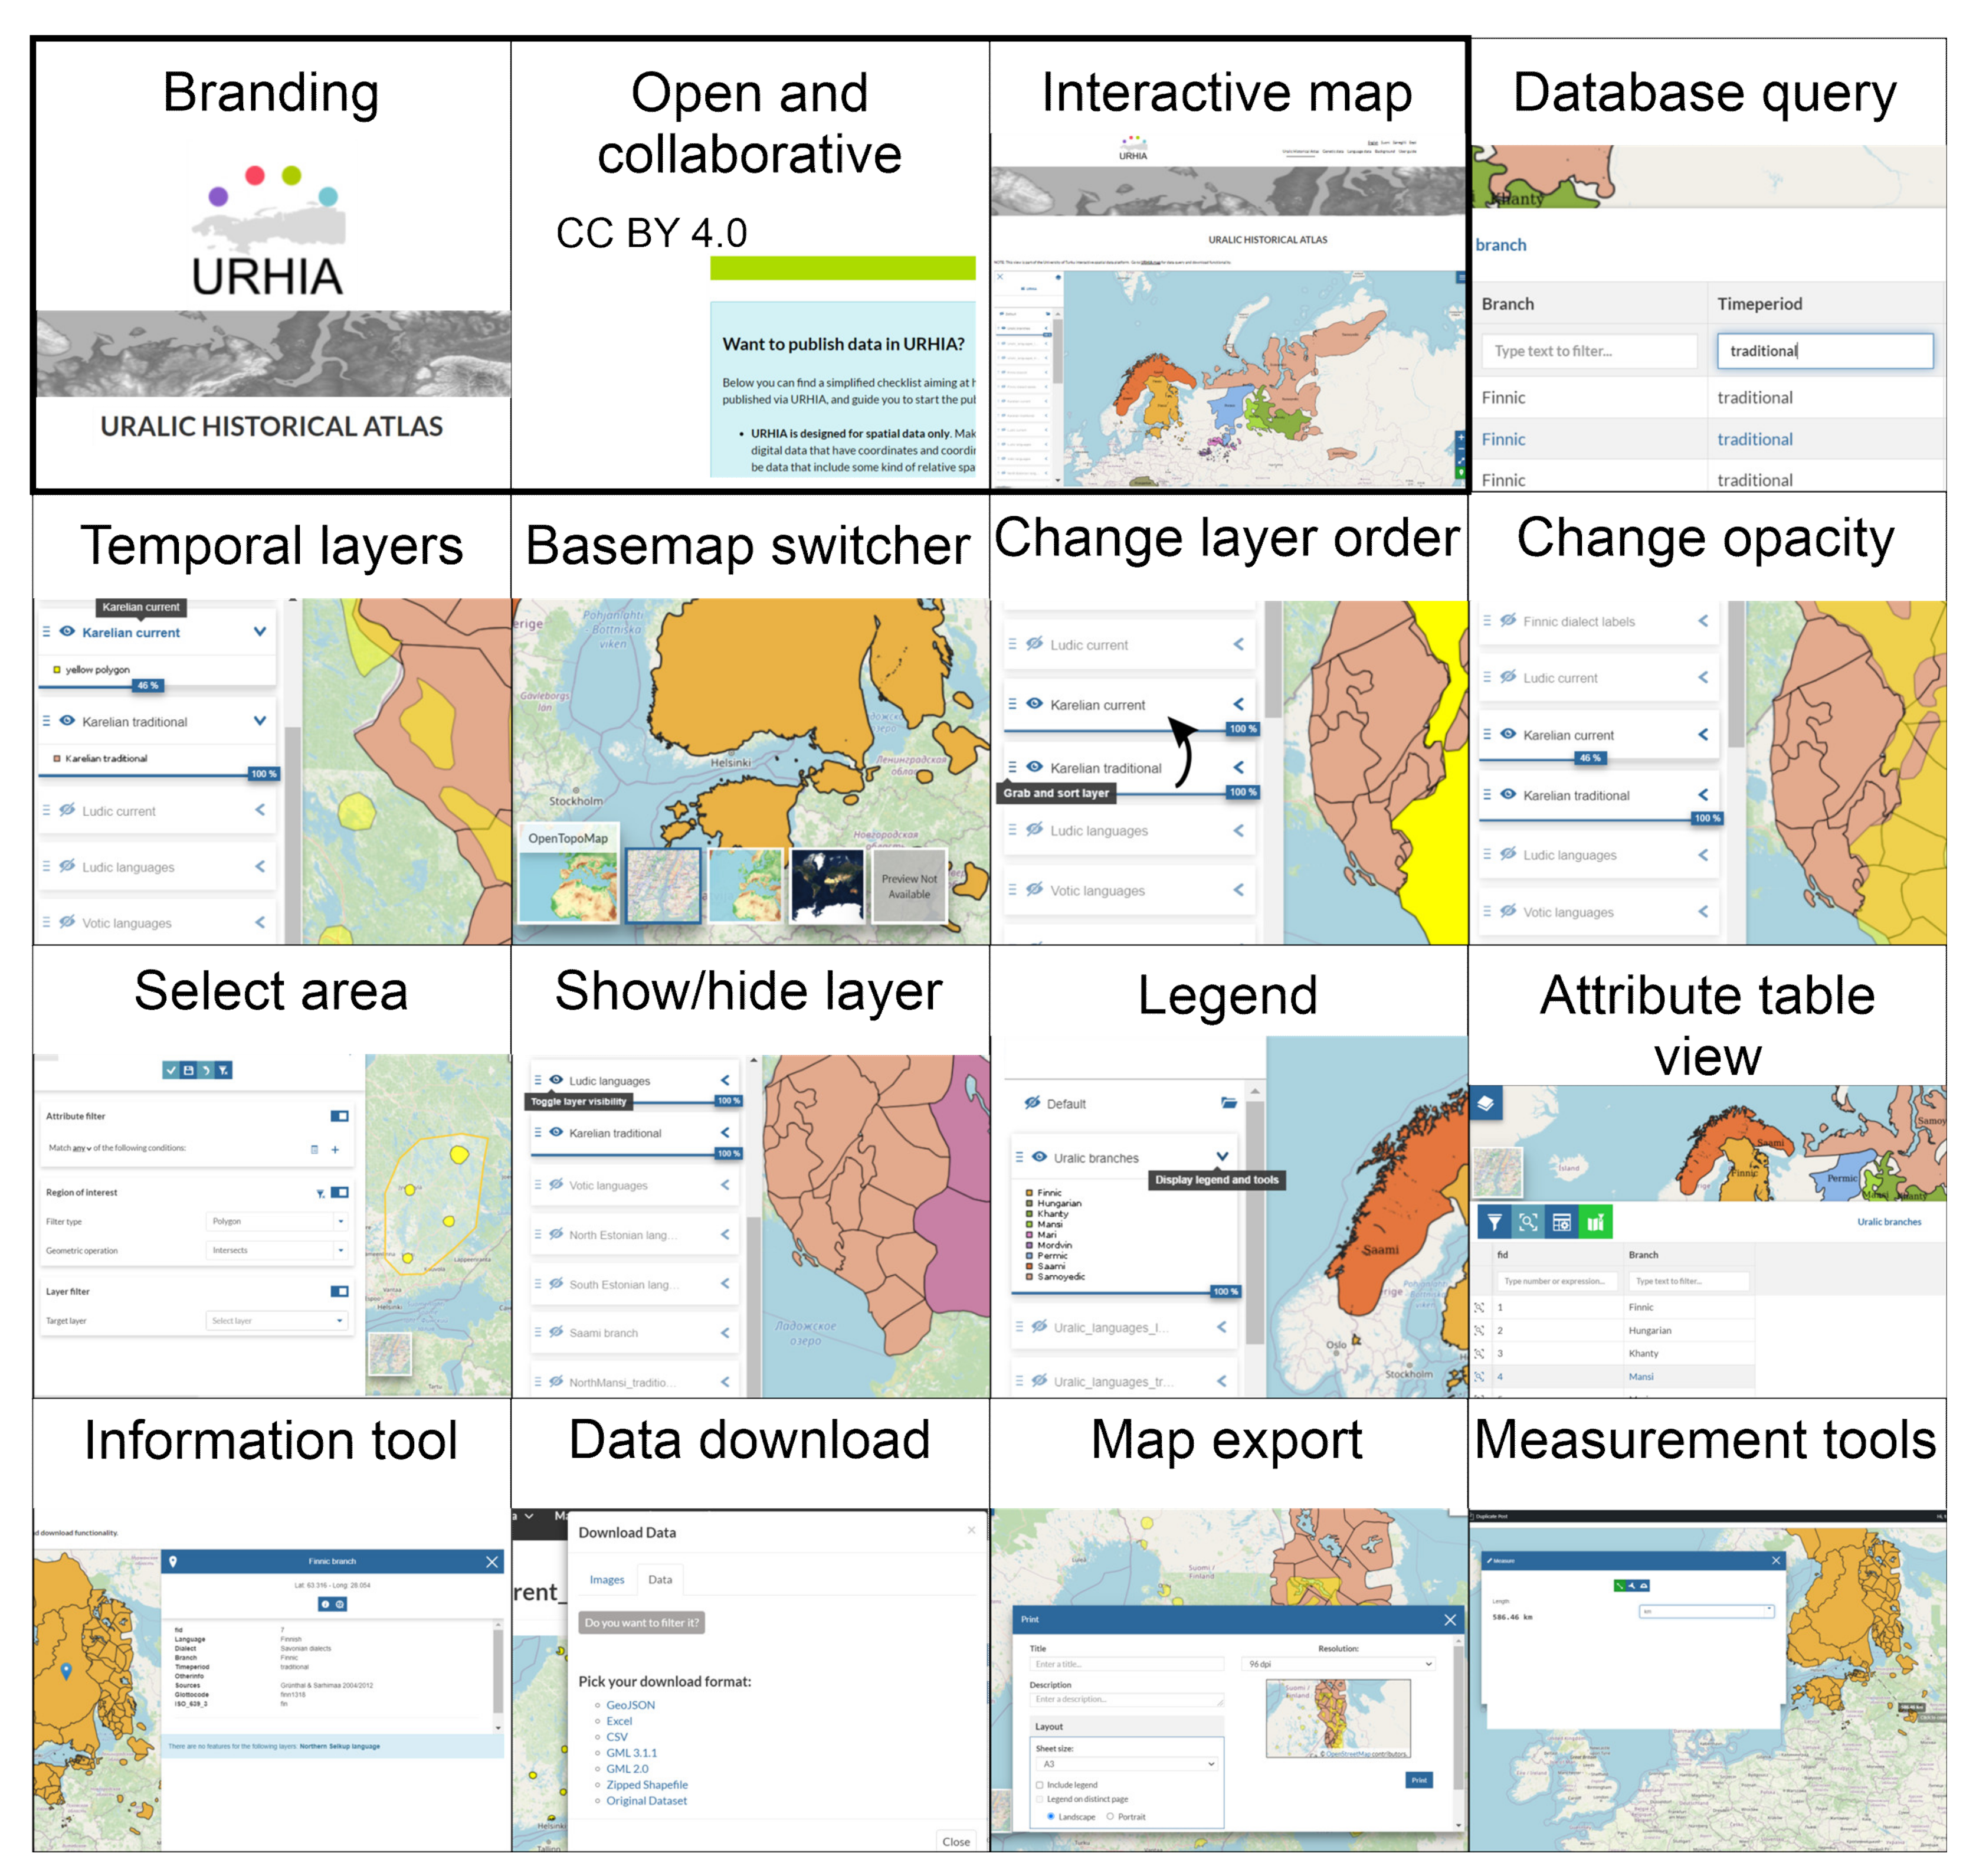
At the time of the initial submission of this paper, the URHIA platform was implemented on the GeoNode open-source technology (
https://geonode.org/, accessed 15 June 2021) and a GeoServer implementation at the University of Turku (
Table 6;
Figure 4). It was almost ready to be launched in June 2021 for the core user group involved in the participatory design process. Following the main ideology behind the service, URHIA was planned to be launched including a limited amount of datasets and to be supplemented in time in collaboration with the user community. Following the UCD principles, user evaluation was planned as a natural continuum of the process, followed by requested changes to the platform, utilizing the limited resources of the host (University of Turku) and the diverse research community.
5. Discussion
Spatial data platforms have the potential to greatly increase the amount of available data, introduce a new digital methodology to human-history research, and bridge gaps between scientific fields (e.g., [
5,
6,
7,
8,
9]). Platforms based on open-source technology with minimum implementation costs and allowing international, collaborative use, are at the center of community-driven spatial data sharing. This is also obvious when examining the diverse supply of existing spatial data platforms on human-history themes (in this study, meaning a variety of data related to biological and cultural evolution, including genetic information, language areas, archaeological findings, ancient settlements, old maps, (paleo)environmental data, and old placenames). However, our analyses reveal that most of the existing historical spatial data platforms are still restricted to one theme and one purpose. In addition, their technical implementation is usually heavily influenced by the traditions of the particular scientific field rather than by the recent advances in geoinformatics. This has a notable impact on which functionalities are available on the platforms.
The design of spatial data platforms can be divided into three components: data, general architecture, and individual functionalities. The available technology (determining the general architecture and selection of individual features) sets restrictions on the functionalities of the platforms, and their impact depends on the data and intended uses. Thus, the selection of the platform technology has a notable impact on how the platform can be used and the overall user experience. Often the selection of the technology is a compromise between desirable and undesirable features. The compromise depends on many aspects, but based on our analyses, we have made recommendations on which aspects to highlight most in the context of multidisciplinary historical research. When aiming for multidisciplinary spatial data platforms, it is advisable to design the platform for all possible data types and the most common uses. The technology should therefore be chosen from among true GIS platforms. Other platform archetypes, such as database platforms, that are commonly used in historical scientific fields, will not likely fit the demands of all types of spatial data, and they should therefore be critically examined.
One of the key features of geographic information systems, and spatial data platforms as one special case, is their ability to flexibly visualize datasets on top of each other (i.e., overlay). Thus, perhaps the greatest promise of spatial data and geoinformatics for multidisciplinary research would be the possibility to seamlessly combine and examine together datasets from different scientific fields (e.g., [
4,
6]). This has been noted in many scientific fields and the benefits boosted the “spatial turn” in science [
3,
4,
5] and the rise of the “digital humanities” paradigm [
73,
74,
75]. However, our analysis shows that most existing spatial data platforms within the historical sciences do not allow overlaying selected datasets on a map, let alone changing the order or appearance of the layers. The lack of such functionality greatly decreases the added value of the spatial data platforms. In practice, this means that datasets cannot be compared on a map. Thus, we suggest that, in order to enhance multidisciplinary research, the greatest effort should be aimed at enabling layer-management functionality in spatial data platforms.
Time is a central dimension in historical research. Thus, in historical spatial data platforms, the way temporality is presented is more crucial than in many other geographical information systems. Therefore, we suggest that particular attention should be paid to the choice of visualizing time. Time can be visualized on spatial data platforms in multiple ways that can be equally effective and user-friendly: the solution depends both on the technical characteristics of the platform and on the content and structure of the data itself. The minimum requirement of presenting time is that the data themselves include time attributes, which can then be utilized to arrange, filter or visualize data. In the simplest case, the data can be split into spatial data layers based on the time attributes. It is often desirable to build an additional, designated controller for filtering data on the interactive map view, that makes map items (e.g., the area in which a language is spoken, or the area of a historical culture) disappear, appear, change shape, and location with time.
The spatial data infrastructures of the public administration generally standardize and harmonize their spatial data already at the production stage or later at the publication stage. This harmonization removes data incompatibility issues among the provider’s datasets, and their spatial data platforms can be specifically tailored for these homogenous data. However, this is often not feasible for loose research communities of individual scientists, who practically volunteer to supplement a spatial data platform and who may not have sufficient GIS skills for the standardization. Management of the time attribute information becomes important when bringing together different kinds of data sets, each covering different time periods and with different levels of temporal precision. This data management is laborious and not all data can or should be harmonized. Therefore, multidisciplinary, collaborative, and international platforms should be able to handle time information flexibly. Similarly, data with different spatial data models and file formats would set demands on data management, but not all harmonization is possible or reasonable in the case of collaborative spatial data platforms. Preferably, these differences indicate that the platforms should be able to handle all possible spatial data types. In other words, the selected technology should support all types of vector and raster formats.
The remaining differences in the temporal and spatial information of spatial datasets mean, however, that subsequent spatial analyses and inference need to respect the fundamental differences in the original data. For example, genetic data from a precise point location and a narrow radiocarbon date range, and an approximate area of an ancient culture with a much wider temporal range can be compared but the structural differences of the datasets need to be respected. A natural prerequisite for this acknowledgment is that detailed metadata of the datasets are available through the spatial data platform.
In a multidisciplinary approach, research groups share scientific goals and work on the same problem but look at it from their own discipline’s perspective. Thus, the UCD (user-centered design) is important when trying to design research infrastructures that are useful and easy to use. When multidisciplinary spatial data infrastructures are being planned and implemented, we identified three key roles in the user-centered design process: subject matter expertise, geography expertise, and IT expertise. Scientists from the related subject fields are both data producers and data users and therefore carry the knowledge about the properties and content of the data, and the needs of the scientific community. Geographers and geoinformation scientists have a key role in designing a spatial data platform, where the location and time of the diverse data are used as their unifying factors. This also demands a firm understanding of the main concepts and terminology from the related fields—i.e., technical GIS skills might not be sufficient for designing user-friendly infrastructures. Collaboration with IT experts is crucial when the various functionalities of the service are being implemented.
Communication between the three expert groups is essential for a successful UCD process. Terminology use, working cultures, and expertise profiles play a considerable role in communication. Geographers use spatial and temporal concepts, data, and methods that overlap with both the expertise of subject experts and IT experts. Thus, we suggest that it may be sufficient and most efficient to arrange the participatory design process as separate two-way communications, where geographers distribute and translate information to other parties. Our study highlighted the role of terminology in the multidisciplinary context, as has been discussed in previous research (e.g., [
55]). As one might expect (cf. [
55]), it is highly important in the design process to reach a common understanding of terminology and to make a compromise on how it is used, in order for a research infrastructure to be successful.
Our experience shows that even though the target user group of a spatial data platform is diverse, it is useful for the design process to categorize the end-users into distinct “archetypes” based on their working culture and skills. This way the most relevant viewpoints can be systematically considered throughout the design process. We suggest a division into four main end-user groups that may be common to the target audience of multidisciplinary spatial data infrastructures: (1) a map-view-oriented user, (2) a web-service user, (3) a data file user, and (4) a machine-readable data user. Users with the least GIS and technical skills mainly benefit from a well-designed map view, but the map view is vital for all user types. These types of users have some similarities with Rogers’s ([
55]) adopter categories related to the diffusion of innovations; however, unlike Rogers’s categories, they do not form a sequence regarding the time of adoption but rather describe the variety of how the innovation will be used and with which types of skills.
Designing the basic architecture and functionalities of a multidisciplinary spatial data platform should begin by outlining the basic tasks that users will be able to carry out. Spatial data inherently involves a map interface, which has core functionalities, such as turning map layers on and off, panning and zooming, as well as querying data objects on the map. From there on, the involvement of data producers, end-users, and IT experts is beneficial to achieve solutions that serve all needs. Prioritizing certain functions that are known to be sought after by scientists of a certain discipline is one way to make platforms more appealing [
28]. The familiarity of the interface type may also have a significant impact on the willingness to adopt new technologies, in this case, data platforms.
Based on our experience, we suggest that inclusive workshops are an effective realization of a user-centered design process. Their success is dependent on the participants and how well they represent the end-user group. A virtual meeting with multimodal communication (presentations, “live” discussions, polling, and a chat) can be very effective. Moreover, a virtual meeting effectively reduces the inequality of participation opportunities. In user workshops, it is important to know what to ask and how to phrase it—especially when all four identified end-user groups are represented. In practice, people not familiar with GIS are not able to discuss platform design using GIS-specific terminology and not able to determine without support and examples, what kind of functionality they would benefit from.
Asking users what they want does not guarantee that the resulting spatial data platform will be easy to use [
76]. A natural continuum of the UCD process described in this paper is thus to carry out user testing and evaluation, followed by necessary revisions (e.g., [
32,
76]).
It is worth noting that our study did not deal with accessibility issues, as defined by the Web Content Accessibility Guidelines and the Directive on the accessibility of websites and mobile applications (EU Directive 2016/2102). This is because our focus was on building community-driven services for scientific use with minimum resources. In practical terms, we did not consider accessibility for users who are e.g., visually impaired or unable to use a mouse. However, pursuing spatial data platforms that fulfill the accessibility objectives, including “perceivable, operable, understandable and robust”, is a good goal for all spatial data platforms since these actions generally improve the adoption of the service among all users, and most apparent among users with disabilities.
While our study focused on spatial data platforms intended for international use, we want to highlight that most historical spatial data are distributed through national spatial data infrastructures (SDI). These are often understandably available in national languages only and their data may be confined to a single country. Still, they provide unique spatial datasets for skilled language speakers and provide the raw material for cross-border data harmonization in the future. Furthermore, technology that supports remote layers (WFS/WMS) allows interesting data from the national SDIs to be incorporated into spatial data platforms that are developed by the international research community.
User-friendly modern visualization solutions, such as Story Maps (commercial service by ESRI), provide further possibilities for researchers and research groups wanting to communicate their spatial datasets and analysis results to their colleagues and the general public (see e.g.,
https://storymaps.esri.com/stories/2017/oral-histories/index.html, accessed 18 June 2021). While these modern web-GIS technologies based on unique cartographically designed web maps are beyond the scope of this paper, we encourage researchers to utilize them for science dissemination.


