
Filming the Historical Geography: Story from the Realm of Maps in Regensburg

 ,
,  , and
, and 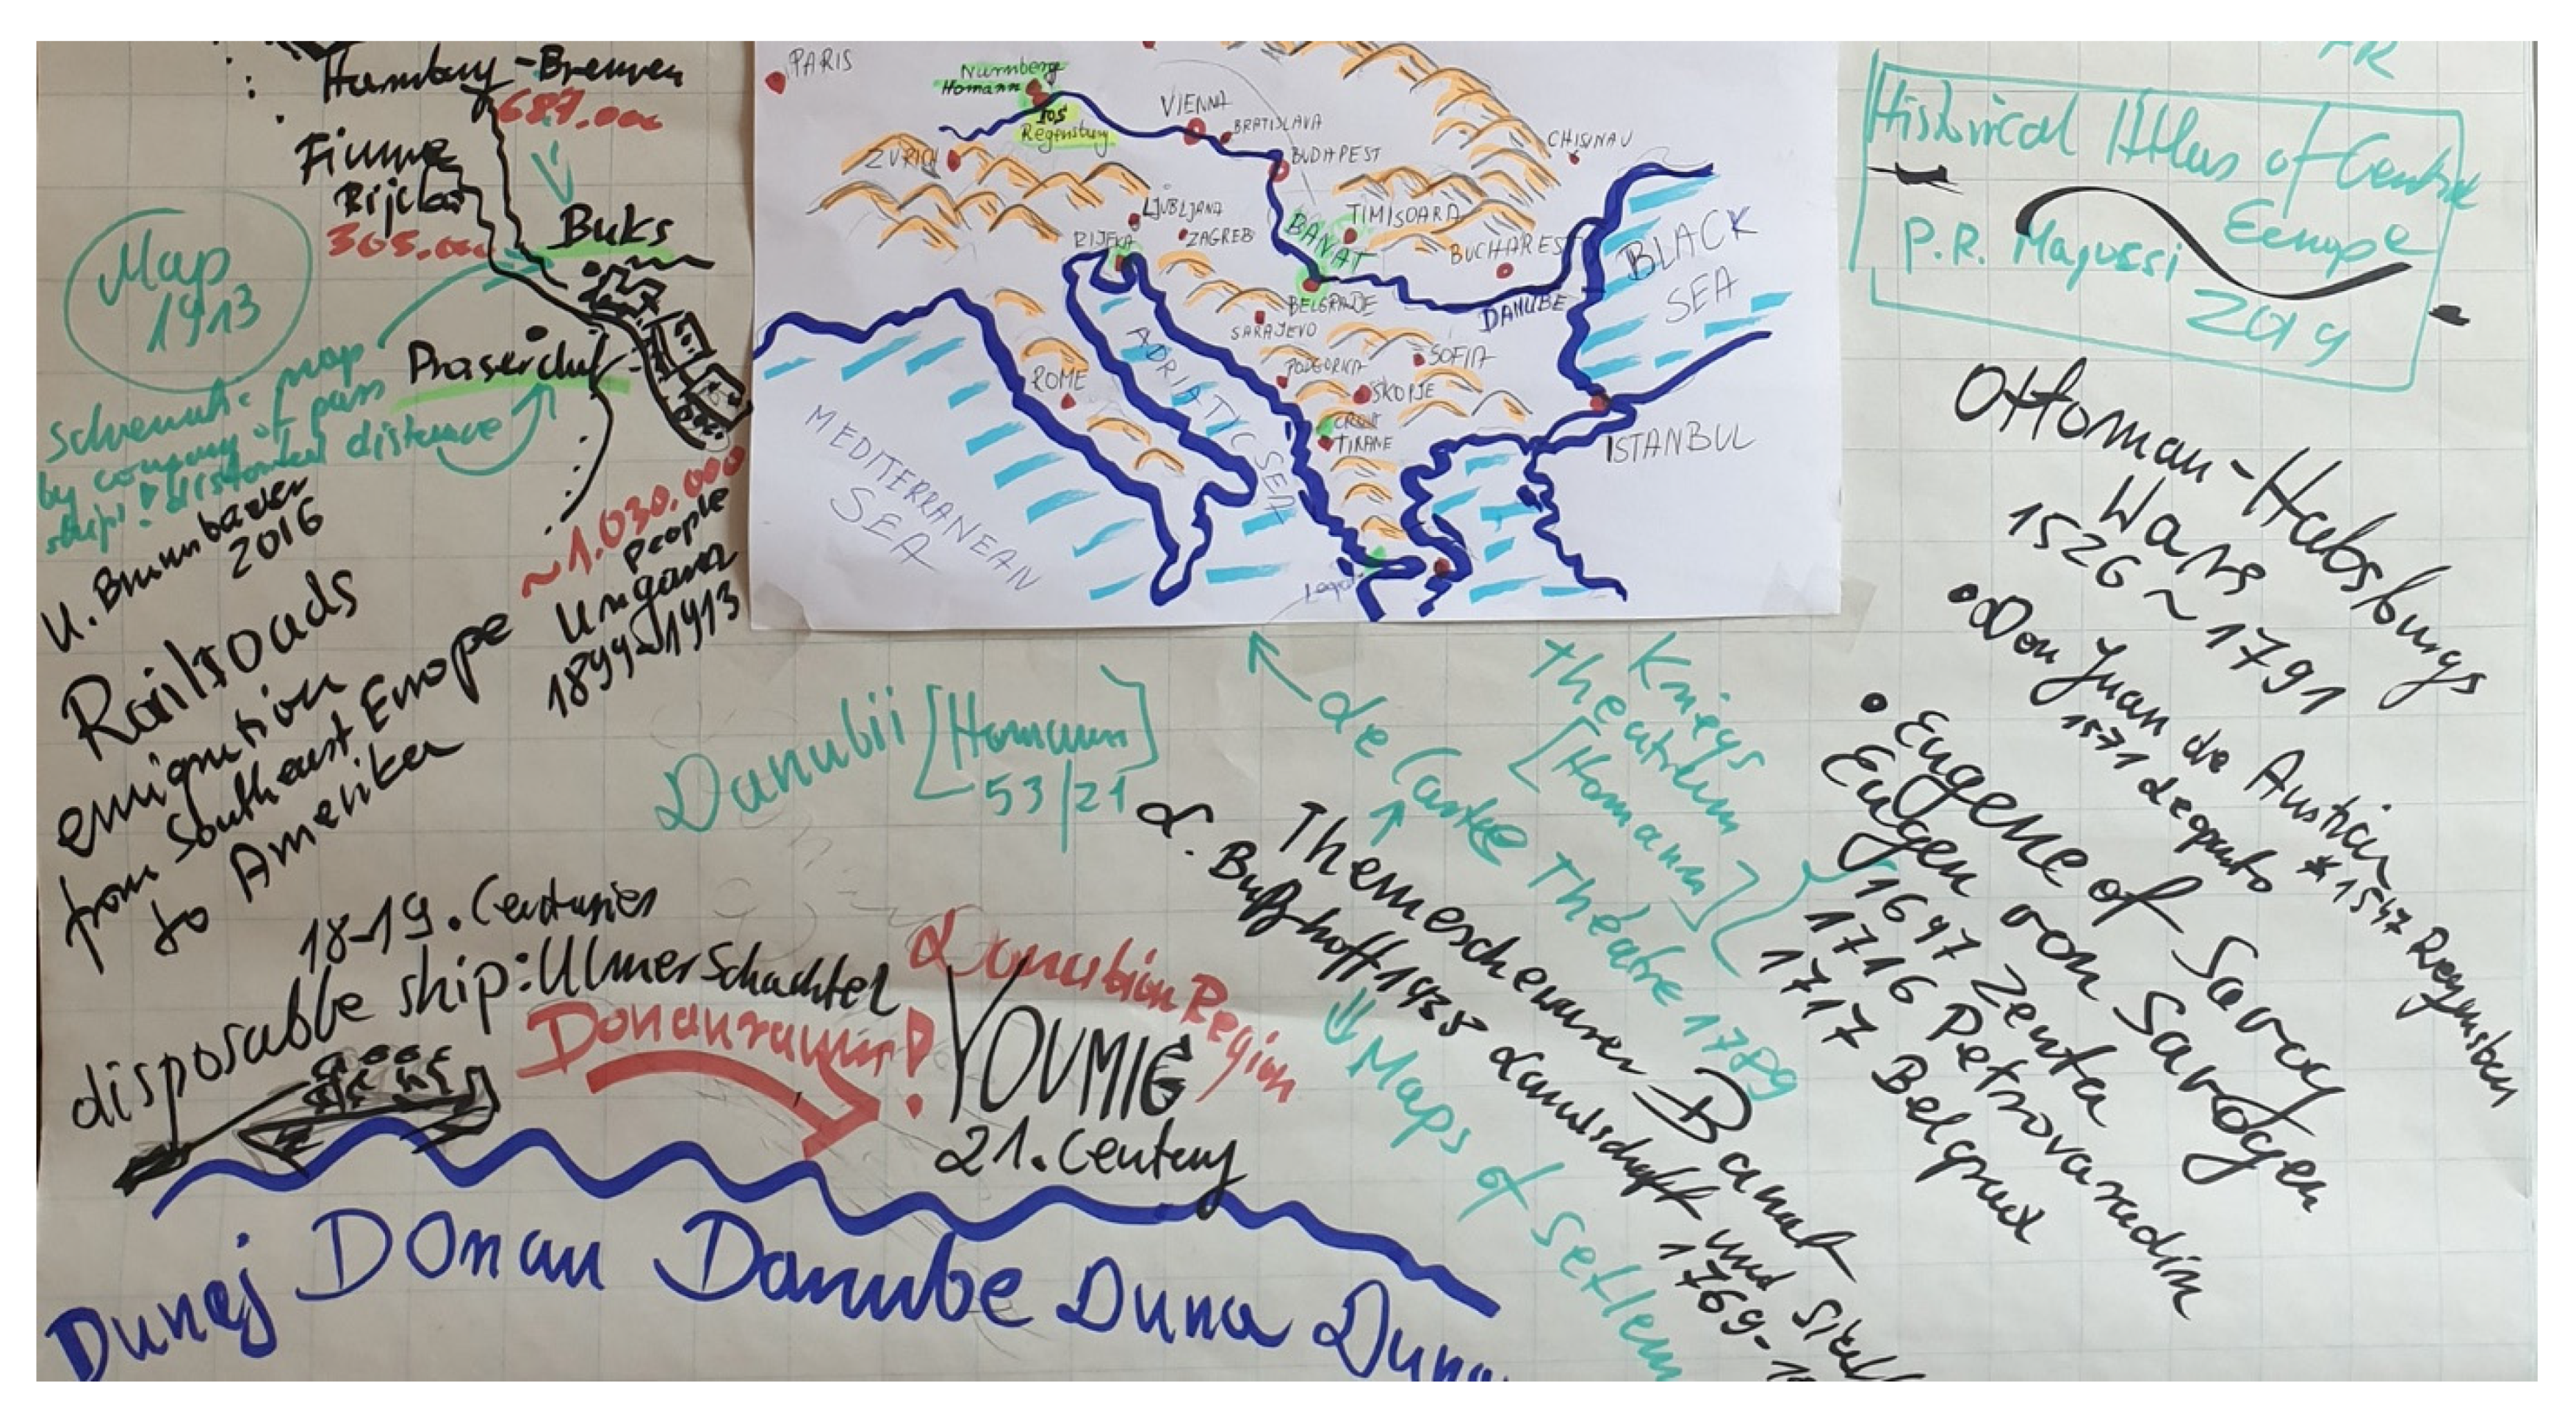
Abstract
:1. Introduction
2. Aims and Questions
- What are the conditions of building a map workroom to study historical events in a geographical space?
- What elements should a script to a short film for stories from realms of maps include?
- How many and what medium means can be used for representing cartographic forms in specific sequences and generally in the entire film?
- What map design principles can be adapted for cartographic visualizations in the short film?
3. Materials and Methods
- –
- Pinpointing concepts adopted by the following types of approach: cartographical, historical, organization of library sources, and geographical, as well as adaptation of classic map design principles (Section 3.1.);
- –
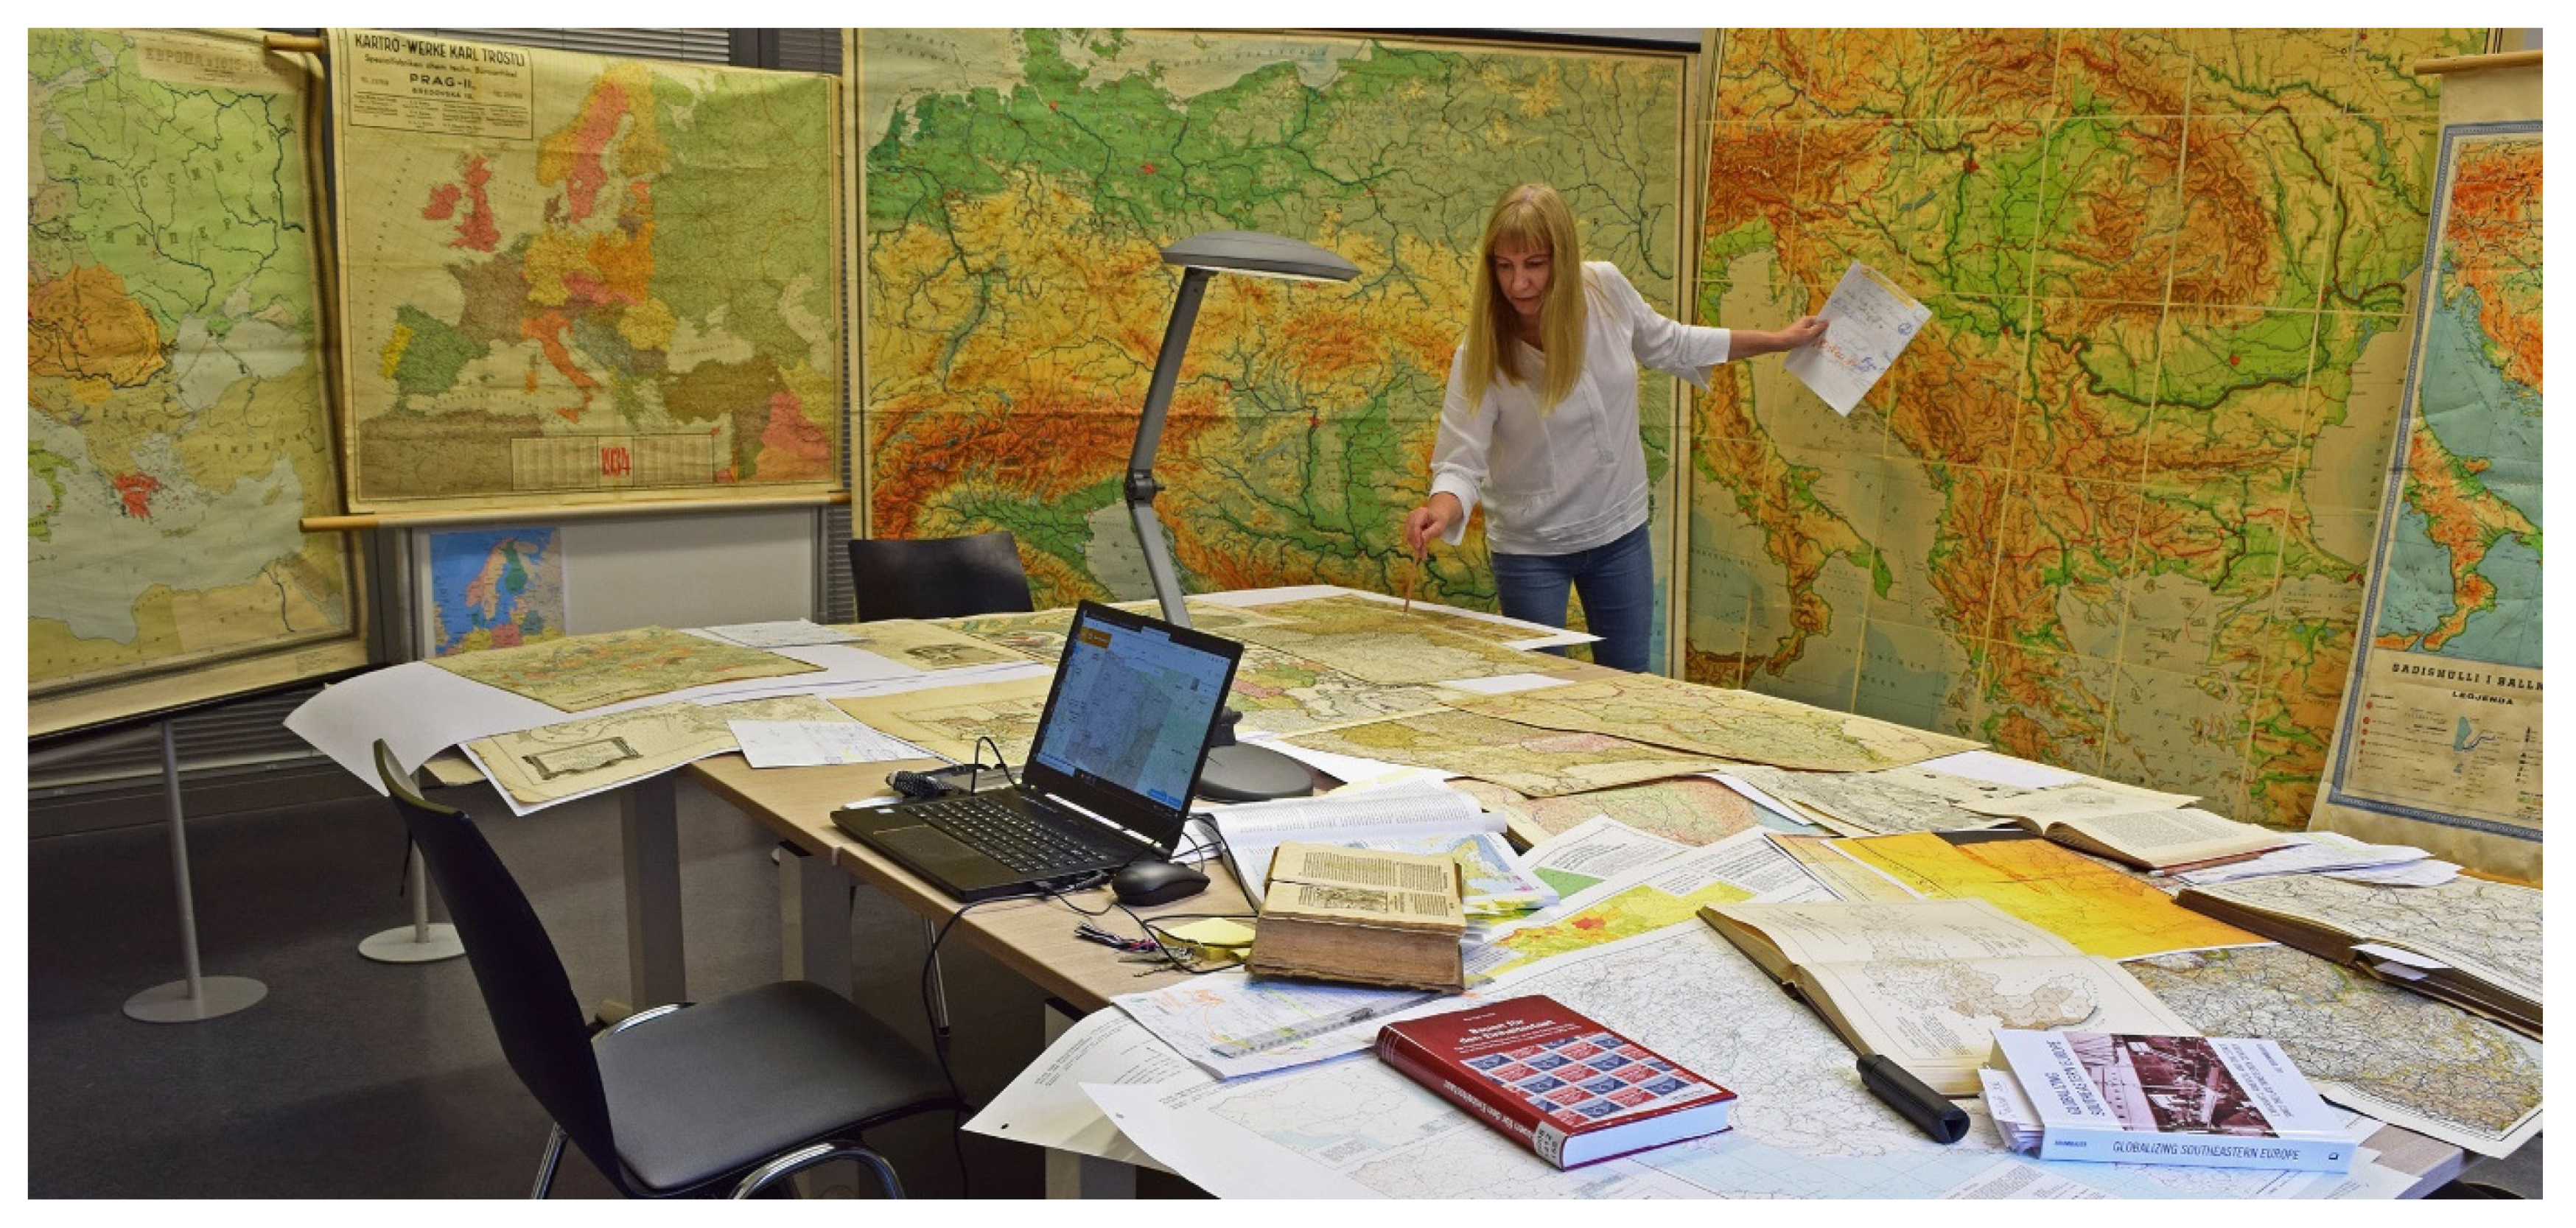
- Constructing the physical part of the Story from the Realm of Maps in Regensburg—a studio workroom according to the layout based on knowledge obtained from maps and publications in the Leibniz Institute for East and Southeast European Studies—IOS-Regensburg (Section 3.2, Figure 1 and Figure 2);
- –
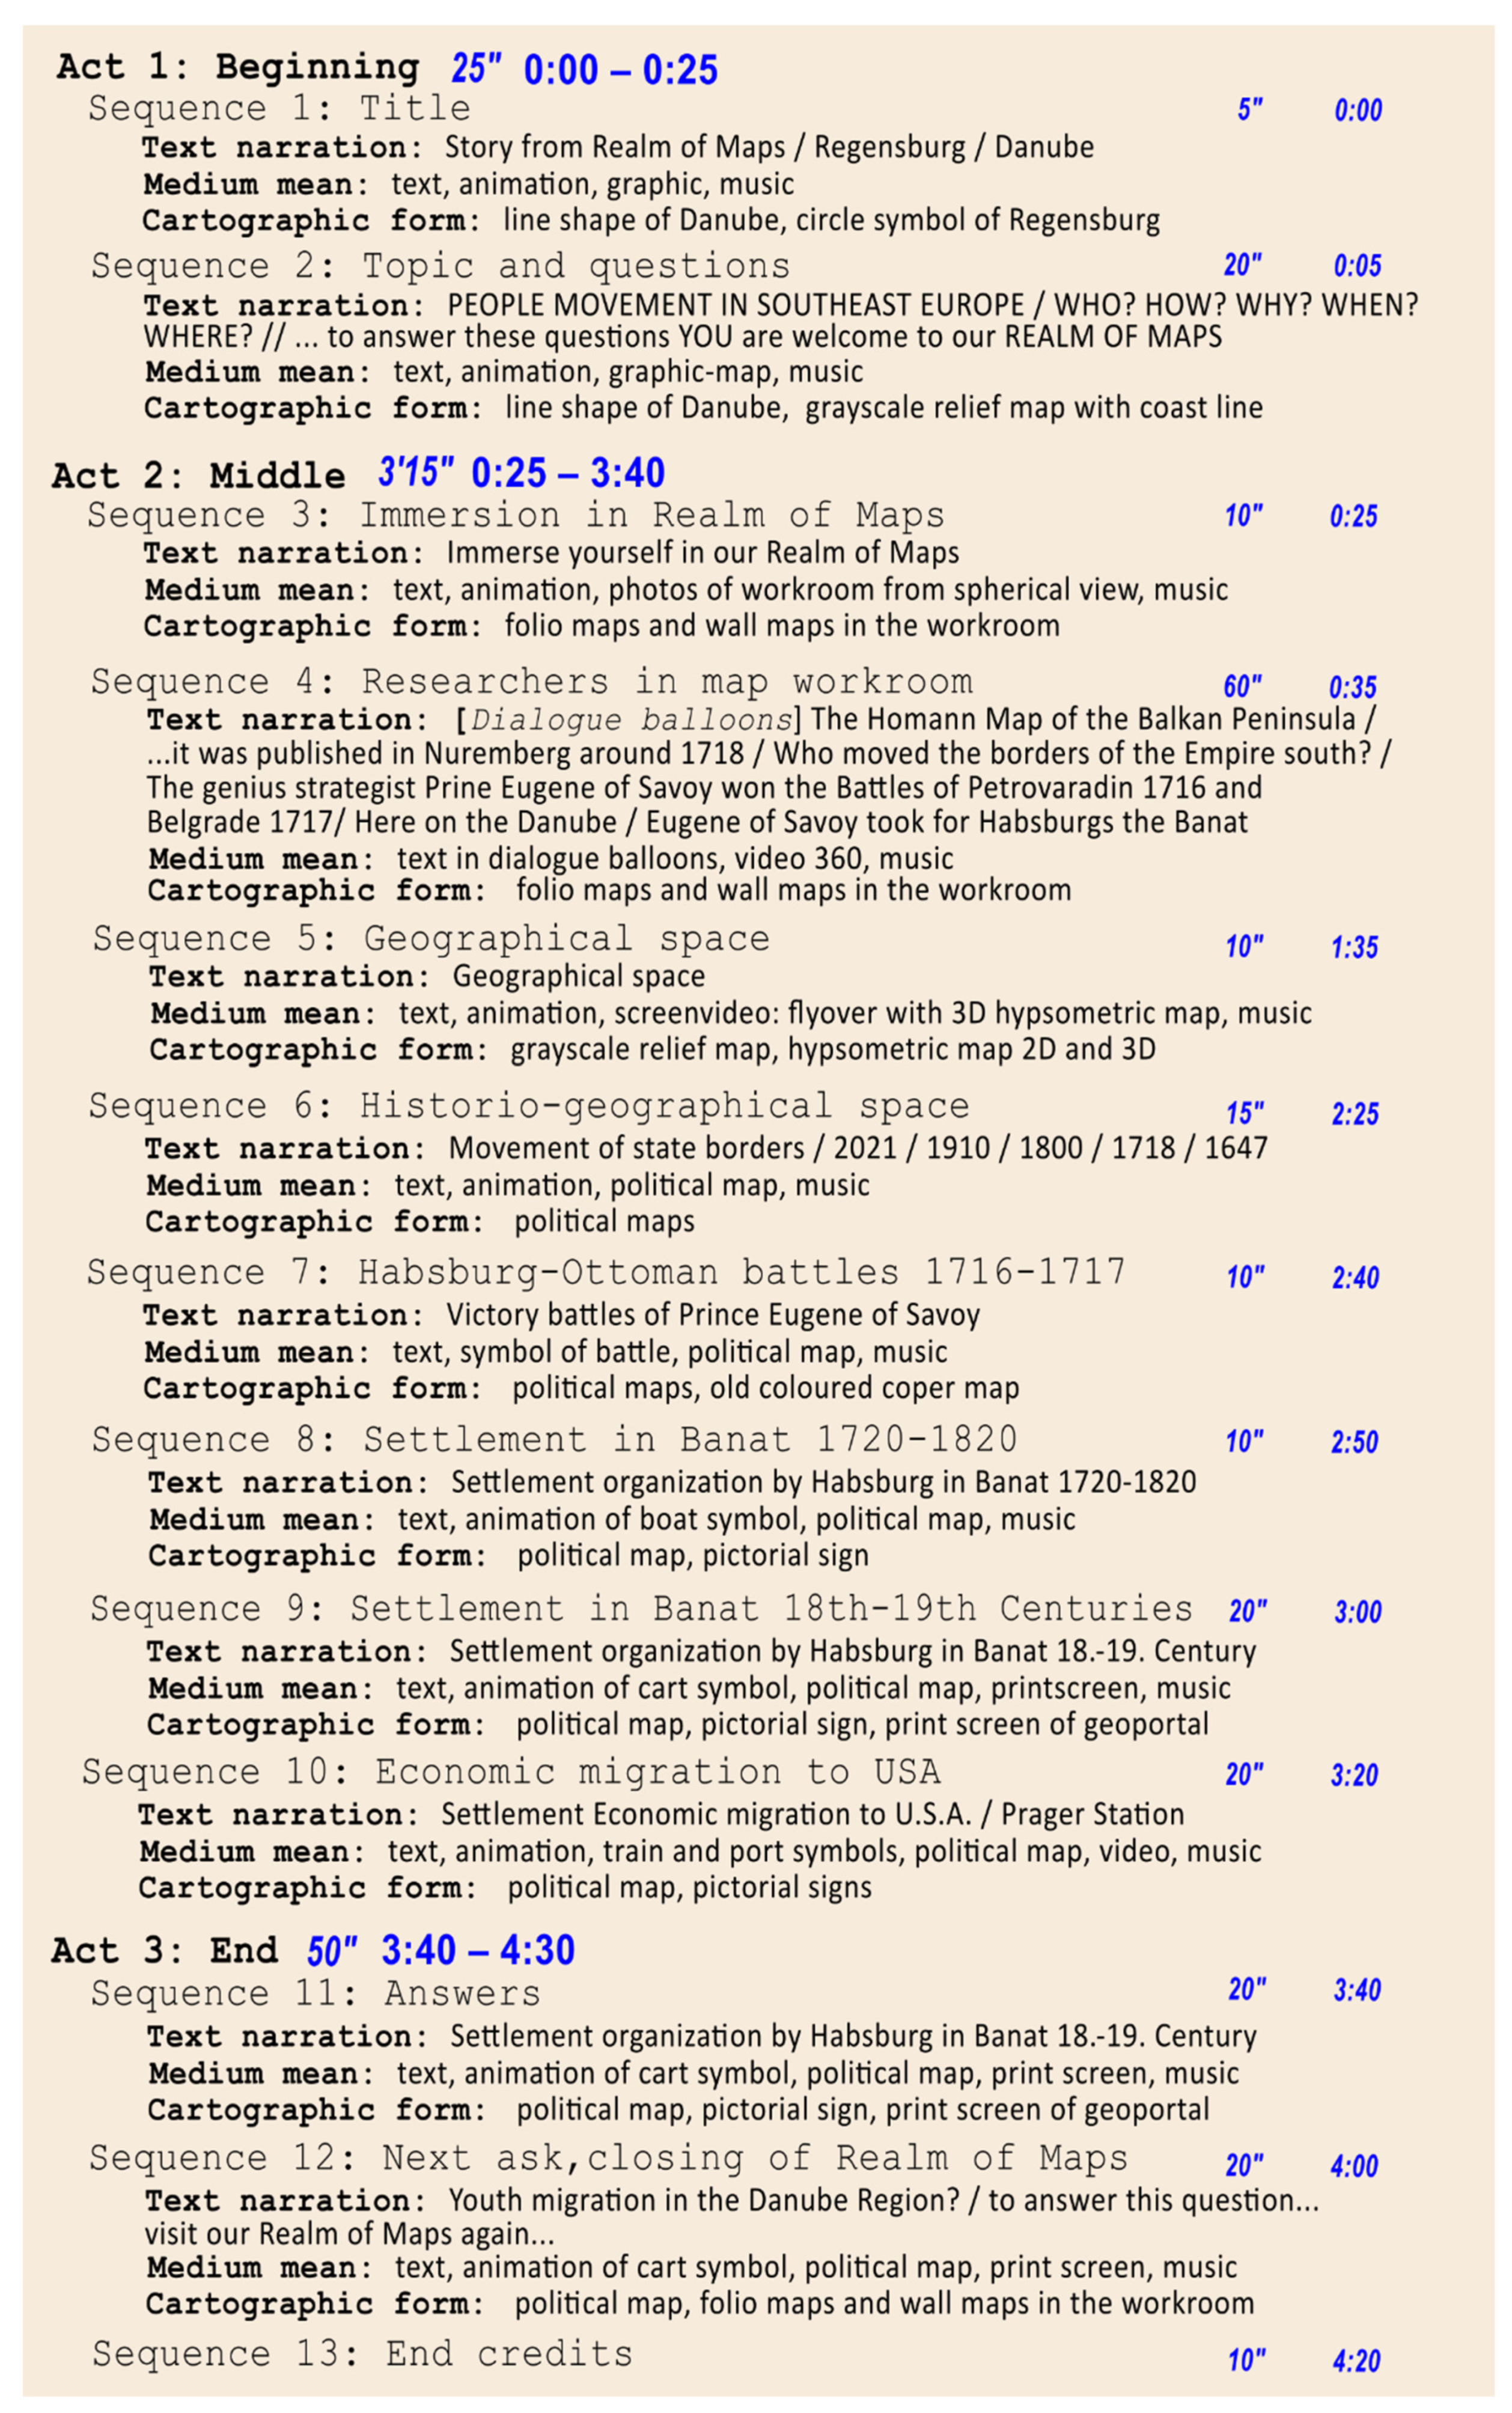
- Creating the draft of the script for the Story from the Realm of Maps in Regensburg: ‘People Movement in Southeast Europe’ (Section 3.3, Figure 3);
- –
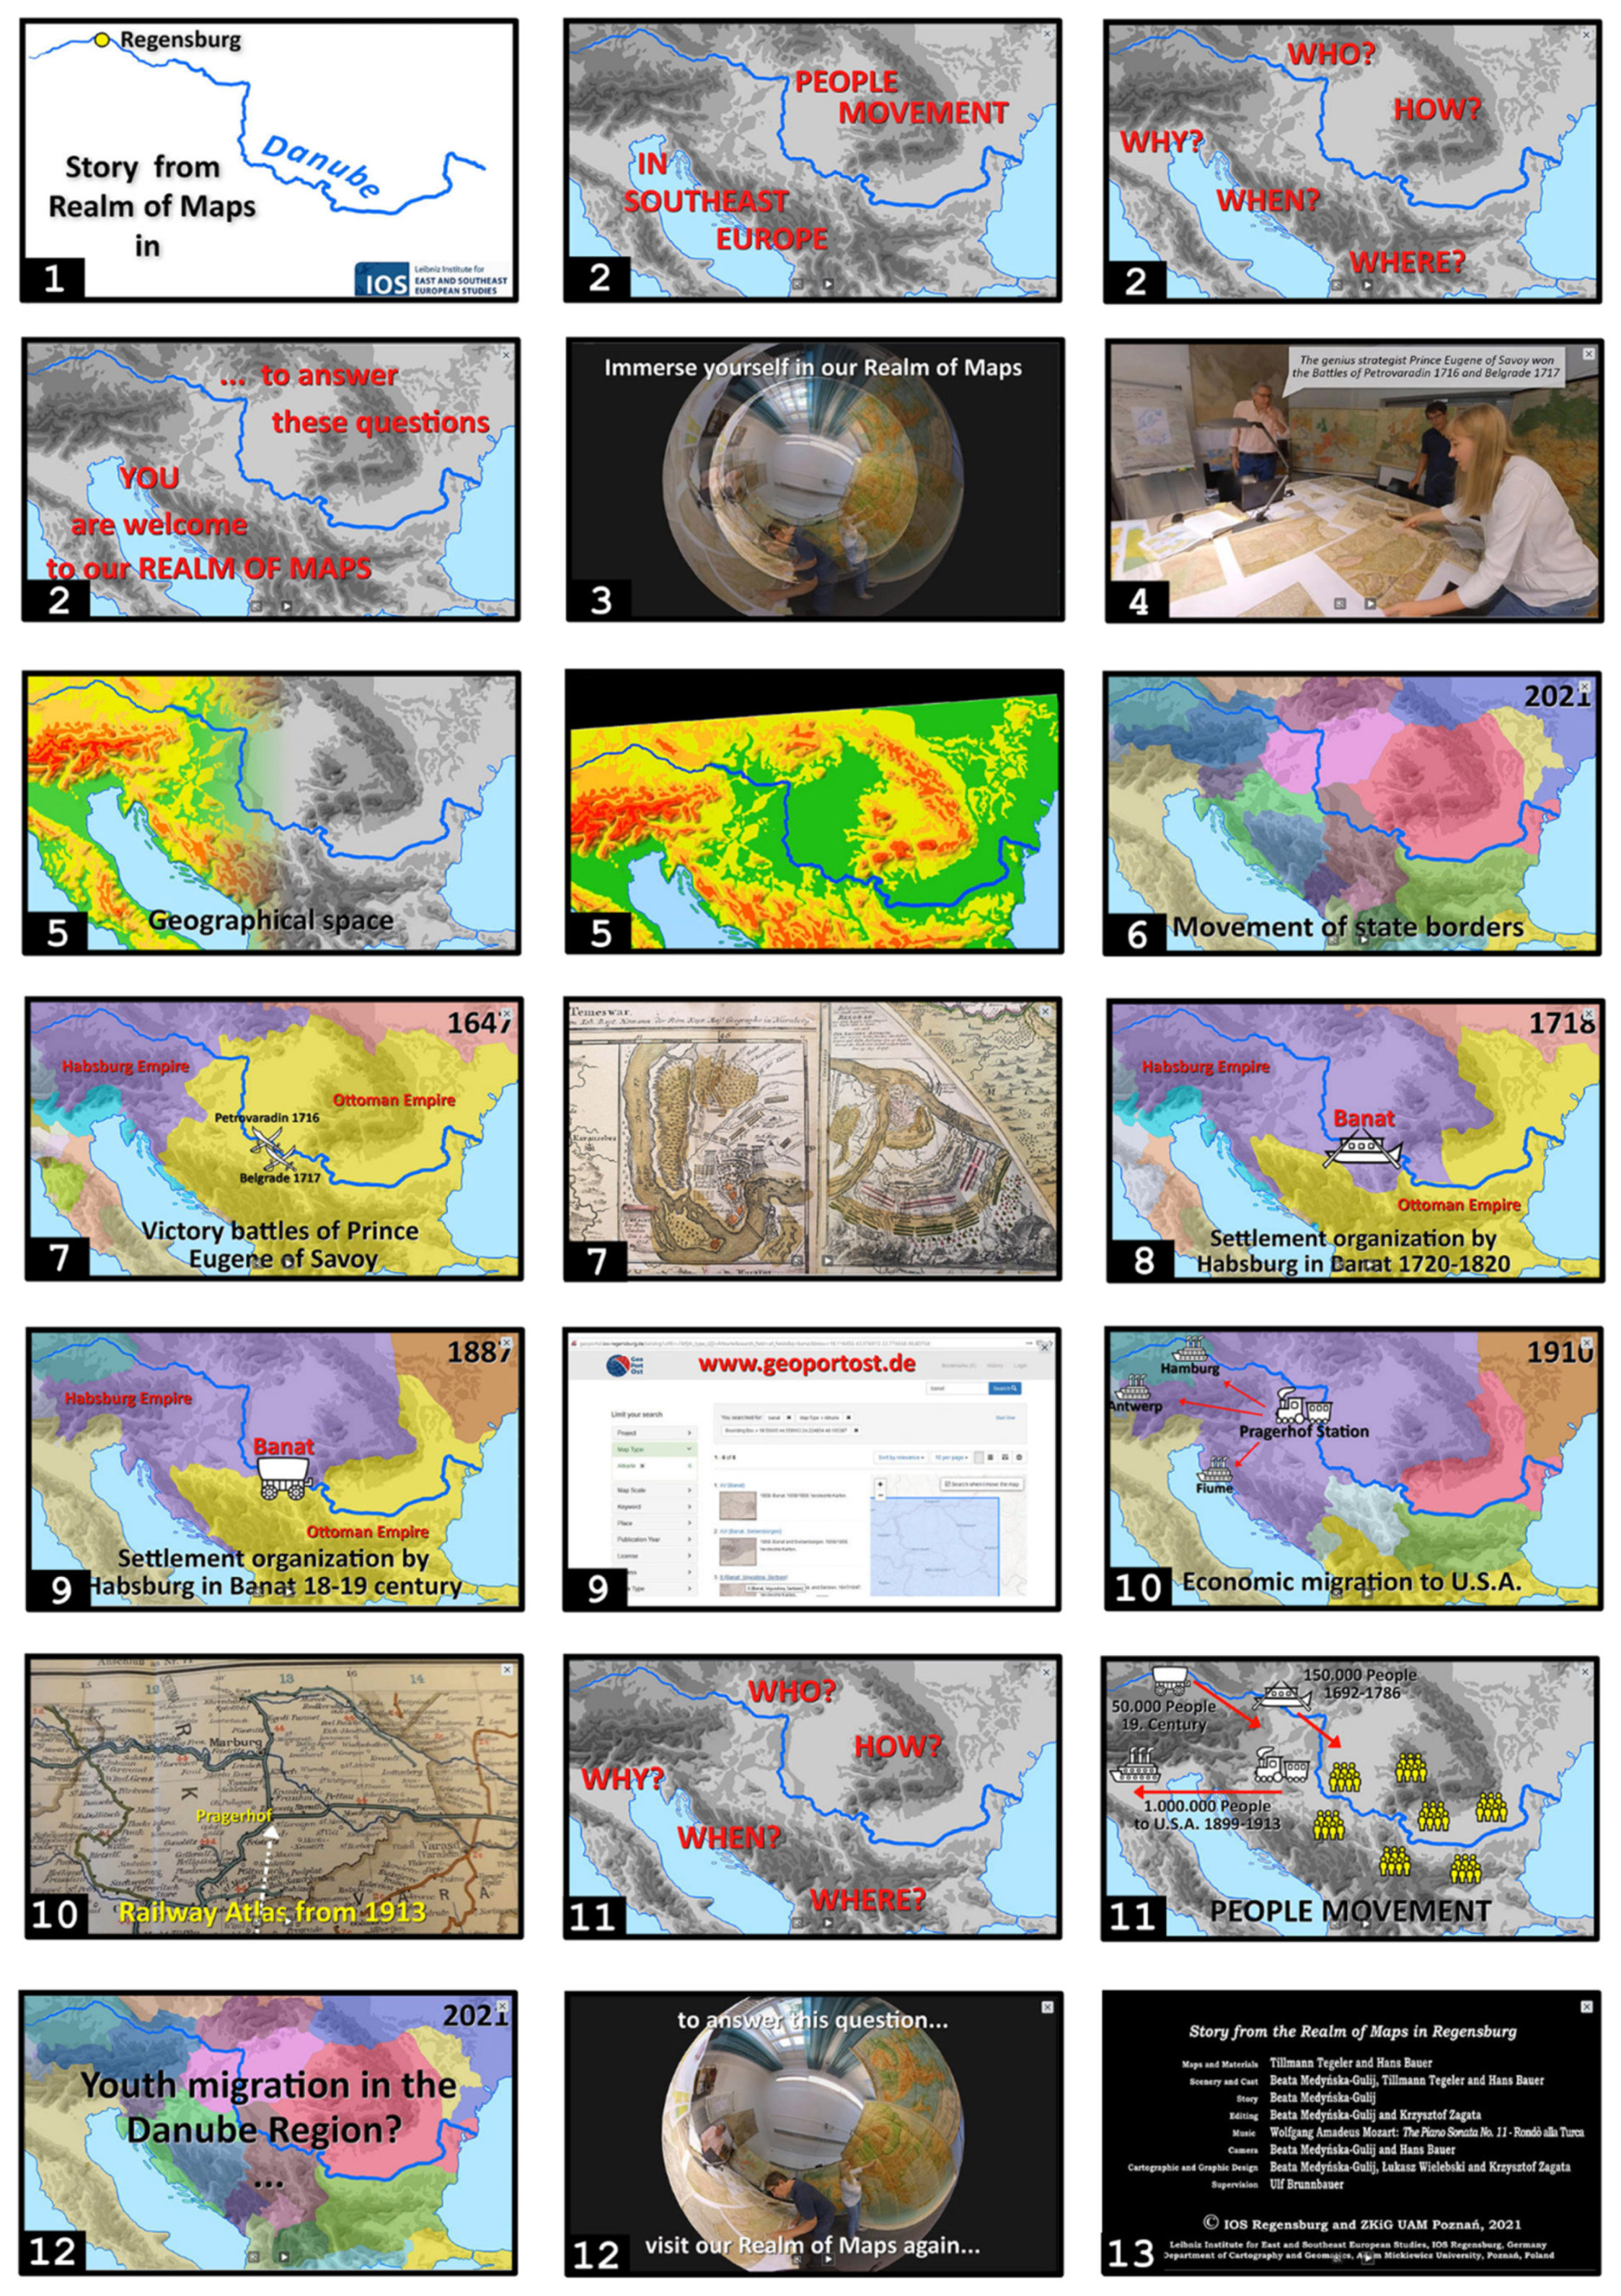
- Creating individual sequences of the story in different types of media: animation, 3D models, animation of photos 180, 360, animation–immersion (Section 3.4, Figure 4);
- –
- Editing the video and publishing it on an online video-sharing platform (Section 4).
3.1. Concept
- The final media form of the story—a short film entitled the Story from the Realm of Maps in Regensburg for online video sharing;
- The viewer—a public user with general geographical and historical knowledge, an expert, or a researcher;
- The story structure—three acts consisting of a beginning (title, topic, and questions); a middle (the immersion in the Realm of Maps, individual sequences presenting historico-geographical space and specific events); an ending (answers and inspiration for future considerations; the closing of the Realm of Maps);
- The plot of the story—a single plot related to the most important historical events in one geographical space constituting a referential cartographic core with a brief textual narration, at a pace following the rhythm of a musical piece and with a wide range of geomedia;
- Two dimensions of the Realm of Maps—a physical dimension, i.e., a studio workroom (printed maps, atlases, wall maps, sketches in books, graphics, catalogs, etc.) and a digital dimension (maps, schemes, 3D models, cartographic visualizations, photographs, geoportals, map scans, etc.);
- A cartographic core of the story—a recognizable cartographic shape for a quick, intuitive spatial reference on all cartographic visualizations in all sequences;
- Medium means—the range was assumed as wide as possible, including textual (descriptions, dates, geographical names, dialogues); graphics (schemes, drawings, raster copies of old maps, photographs (traditional 180, 360); video (traditional, 360); animation; music, e.g., a piece of instrumental classical music representative of the specific historico-geographical space;
- Cartographic forms—cartographic pictograms, political maps, hypsometric maps, old maps, 3D maps, and cartographic animations [35];
3.2. The Realm of Maps in Regensburg—Studio Workroom
3.3. Drafting a Movie Script—The Story Plot: ‘The People’s Movement in Southeast Europe’
3.4. Creating Story Sequences
- –
- A photograph of a part of the copperplate map ‘The War Theatrum’ designed by Homann around 1718;
- –
- A print screen of the internet service of map search from geoportost.de and a fragment of a map of Banat of 1858;
- –
- Zooming the location of a junction station and a railway from the atlas of 1913 with a traditional camera.
4. Results—Editing the Film and Uploading It to the Online Video-Sharing Platform
5. Discussion and Conclusions
- –
- Adjust the map format to the ratio 16:9 in the horizontal orientation;
- –
- Include an easily recognizable and repetitive referential element on maps (here, the Danube and the coastline);
- –
- Fill in the entire film frame with the content;
- –
- Do not use frames for cartographic content;
- –
- Do not place a legend or a linear scale on the map (without a numerical scale!);
- –
- Design pictorial map symbols of high contrast to the background (e. g., symbols filled in white with a black contour on colorful areas);
- –
- Use line symbols with high width (such as on wall maps);
- –
- Prioritize the animation of point symbols over the animation of area symbols on the map;
- –
- Use the minimal number of subtitles and place them in a single spot on the film frame to prevent them from ‘jumping’ in consecutive shots;
- –
- Present old folio and wall maps in the film along with the researcher to show their size and way of use.
Author Contributions
Funding
Institutional Review Board Statement
Informed Consent Statement
Data Availability Statement
Acknowledgments
Conflicts of Interest
References
- Tegeler, T.; Bauer, H. Introduction: Maps in Libraries. Trends in Enabling Spatial Information Retrieval. E-Perimentron 2019, 14, 110–116. [Google Scholar]
- Domosh, M.; Heffernan, M.; Withers, C. The SAGE Handbook of Historical Geography; SAGE Publications: London, UK, 2021; ISBN 978-1526404558. [Google Scholar]
- Kuźma, M.; Bauer, H. Map Metadata: The Basis of the Retrieval System of Digital Collections. Int. J. Geo-Inf. 2020, 9, 444. [Google Scholar] [CrossRef]
- Uhl, J.H.; Leyk, S.; Chiang, Y.-Y.; Duan, W.; Knoblock, C.A. Map Archive Mining: Visual-Analytical Approaches to Explore Large Historical Map Collections. Int. J. Geo-Inf. 2018, 7, 148. [Google Scholar] [CrossRef] [PubMed] [Green Version]
- Medyńska-Gulij, B. How the Black Line, Dash and Dot Created the Rules of Cartographic Design 400 Years Ago. Cartogr. J. 2013, 50, 356–368. [Google Scholar] [CrossRef]
- Medyńska-Gulij, B.; Żuchowski, T.J. European Topography in Eighteenth-Century Manuscript Maps; Bogucki Wydawnictwo Naukowe: Poznań, Poland, 2018; ISBN 978-83-7986-204-7. [Google Scholar]
- Medyńska-Gulij, B. Kartografia i Geomedia; Wydawnictwo Naukowe PWN: Warsaw, Poland, 2021; ISBN 978-83-01-21554-5. [Google Scholar]
- Williams, J.P.; Smith, J.H. The Players’ Realm. Studies on the Culture of Video Games and Gaming; McFarland & Co.: Jefferson, NC, USA, 2007; ISBN 978-0786428328. [Google Scholar]
- Kersten, T.P.; Edler, D. Special Issue “Methods and Applications of Virtual and Augmented Reality in Geo-Information Sciences”. PFG—J. Photogramm. Remote. Sens. Geoinf. Sci. 2020, 88, 119–120. [Google Scholar] [CrossRef] [Green Version]
- Zagata, K.; Gulij, J.; Halik, Ł.; Medyńska-Gulij, B. Mini-Map for Gamers Who Walk and Teleport in a Virtual Stronghold. Int. J. Geo-Inf. 2021, 10, 96. [Google Scholar] [CrossRef]
- Medyńska-Gulij, B.; Lorek, D.; Hannemann, N.; Cybulski, P.; Wielebski, Ł.; Horbiński, T.; Dickmann, F. Die kartographische Rekonstruktion der Landschaftsentwicklung des Oberschlesischen Industriegebiets (Polen) und des Ruhrgebiets (Deutschland), Cartographic reconstruction of the landscape development of the Upper Silesian industrial area (Poland) and the Ruhr area (Germany). KN J. Cartogr. Geogr. Inf. 2019, 69, 131–142. [Google Scholar]
- Jones, K. David Rumsey Map Collection. Multimed. Technol. Rev. 2017. Available online: https://www.arlisna.org/publications/multimedia-technology-reviews/1200-david-rumsey-map-collection (accessed on 13 October 2021).
- Maiellaro, N.; Varasano, A. One-Page Multimedia Interactive Map. Int. J. Geo-Inf. 2017, 6, 34. [Google Scholar] [CrossRef] [Green Version]
- Horbiński, T.; Cybulski, P.; Medyńska-Gulij, B. Web Map Effectiveness in the Responsive Context of the Graphical User Interface. Int. J. Geo-Inf. 2021, 10, 134. [Google Scholar] [CrossRef]
- Roth, R.E. Cartographic Design as Visual Storytelling: Synthesis and Review of Map-Based Narratives, Genres, and Tropes. Cartogr. J. 2021, 58, 83–114. [Google Scholar] [CrossRef]
- Thöny, M.; Schnürer, R.; Sieber, R.; Hurni, L.; Pajarola, R. Storytelling in Interactive 3D Geographic Visualization Systems. Int. J. Geo-Inf. 2018, 7, 123. [Google Scholar] [CrossRef] [Green Version]
- Mocnik, F.-B.; Fairbairn, D. Maps Telling Stories? Cartogr. J. 2018, 55, 36–57. [Google Scholar] [CrossRef]
- Horbiński, T.; Zagata, K. Map Symbols in Video Games: The Example of “Valheim”. KN J. Cartogr. Geogr. Inf. 2021, 14, 13. [Google Scholar] [CrossRef]
- Edler, D.; Dickmann, F. The Impact of 1980s and 1990s Video Games on Multimedia Cartography. Cartographica 2017, 52, 168–177. [Google Scholar] [CrossRef]
- Medyńska-Gulij, B.; Forrest, D.; Cybulski, P. Modern Cartographic Forms of Expression: The Renaissance of Multimedia Cartography. Int. J. Geo-Inf. 2021, 10, 484. [Google Scholar] [CrossRef]
- Harrower, M. The Cognitive Limits of Animated Maps. Cartographica 2007, 42, 349–357. [Google Scholar] [CrossRef]
- Clarke, K.C.; Johnson, J.M.; Trainor, T. Contemporary American cartographic research: A review and prospective. Cartogr. Geogr. Inf. Sci. 2019, 46, 196–209. [Google Scholar] [CrossRef]
- Bertin, J. Semiologie Graphique—Les Diagrammes, les Reseaux, les Cartes; Gaultier: Paris, France, 1967. [Google Scholar]
- Hake, G. Kartographie, 2nd ed.; Walter de Gruyter: Berlin, Germany; New York, NY, USA, 1976. [Google Scholar]
- Freitag, U. Semiotik und Kartographie. Über die Anwendung kybernetischer Disziplinen in der theoretischen Kartographie. Kartogr. Nachr. 1971, 21, 171–182. [Google Scholar]
- Dent, B. Principles of Thematic Map Design; Addison-Wesley Publishing Company: Boston, MA, USA, 1985; ISBN 978-0201113341. [Google Scholar]
- Imhof, E. Thematische Kartographie; Walter de Gruyter: Berlin, Germany; New York, NY, USA, 1972. [Google Scholar]
- Robinson, A.H.; Sale, R.D.; Morrison, J.L. Elements of Cartography, 4th ed.; John Wiley & Sons, Inc.: New York, NY, USA, 1978; ISBN 9780471017813. [Google Scholar]
- Ratajski, L. The methodical basis of the standardization of sign on economic maps. Int. Yearb. Cartogr. 1971, 11, 137–159. [Google Scholar]
- Keates, J. Cartographic Design and Production; Longman: London, UK, 1973; ISBN 978-0582482838. [Google Scholar]
- van Dijck, J. The Culture of Connectivity: A Critical History of Social Media; Oxford University Press: Oxford, UK, 2013; ISBN 978-0199970780. [Google Scholar]
- Nash, P. Short Films. Writing the Screenplay; Oldcastle Books: New York, NY, USA, 2012; ISBN 978-1842435014. [Google Scholar]
- Cooper, P.; Dancyger, K. Writing the Short Film, 3rd ed.; Elsevier/Focal Press: Burlington, MA, USA, 2005; ISBN 978-0240805887. [Google Scholar]
- Booker, C. The Seven Basic Plots. Why We Tell Stories; Bloomsbury Academic: New York, NY, USA, 2006; ISBN 978-0826480378. [Google Scholar]
- Kraak, M.J.; Ormeling, F.J. Cartography. Visualization of Geospatial Data, 4th ed.; CRC Press: Abingdon, UK, 2020. [Google Scholar]
- Medyńska-Gulij, B.; Wielebski, Ł.; Halik, Ł.; Smaczyński, M. Complexity Level of People Gathering Presentation on an Animated Map—Objective Effectiveness Versus Expert Opinion. Int. J. Geo-Inf. 2020, 9, 117. [Google Scholar] [CrossRef] [Green Version]
- Brunnbauer, U. Globalizing Southeastern Europe. Emigrants, America, and the State Since the Late Nineteenth Century; Lexington Books: Lanham, MD/Boulder, CO/New York, NY, USA; London, UK, 2016; ISBN 978-1498519557. [Google Scholar]
- Magocsi, P.R. Historical Atlas of Central Europe, 3rd Revised and Expanded Ed.; University of Toronto Press: Toronto, ON, Canada, 2018; p. 296. [Google Scholar]
- Shuman, A. Storytelling Rights. The Uses of Oral and Written Texts by Urban Adolescents; Cambridge Studies in Oral and Literate Culture 11; Cambridge University Press: Cambridge, UK, 1986; ISBN 9780511983252. [Google Scholar]
- Kühne, O.; Edler, D.; Jenal, C. A Multi-Perspective View on Immersive Virtual Environments (IVEs). Int. J. Geo-Inf. 2021, 10, 518. [Google Scholar] [CrossRef]
- Caquard, S.; Cartwright, W. Narrative Cartography: From Mapping Stories to the Narrative of Maps and Mapping. Cartogr. J. 2014, 51, 101–106. [Google Scholar] [CrossRef]
- Collins, A.; Neville, P.; Bielaczyc, K. The role of different media in designing learning environments. Int. J. Artif. Intell. Educ. 2000, 11, 144–162. [Google Scholar]
- Pham, H.-H.; Farrell, K.; Vuong, Q.-H. Using YouTube Videos to Promote Universities: A Content Analysis. Tech. Technol. Educ. Manag. 2017, 12, 58–72. [Google Scholar]
- Finkler, W.; León, B. The power of storytelling and video: A visual rhetoric for science communication. J. Sci. Commun. 2019, 18, A02. [Google Scholar] [CrossRef]
- DiBiase, D.; MacEachren, A.M.; Krygier, J.B.; Reeves, C. Animation and the Role of Map Design in Scientific Visualization. Cartogr. Geogr. Inf. Syst. 2013, 19, 201–214. [Google Scholar] [CrossRef]
- Cybulski, P.; Wielebski, Ł. Effectiveness of Dynamic Point Symbols in Quantitative Mapping. Cartogr. J. 2019, 56, 146–160. [Google Scholar] [CrossRef]
- Wielebski, Ł.; Medyńska-Gulij, B. Graphically supported evaluation of mapping techniques used in presenting spatial accessibility. Cartogr. Geogr. Inf. Sci. 2019, 46, 311–333. [Google Scholar] [CrossRef]
- León, B.; Bourk, M. Communicating Science and Technology Through Online Video. Researching a New Media Phenomenon; Routledge: Abingdon, UK, 2018. [Google Scholar]
- Cooke, S.J.; Gallagher, A.J.; Sopinka, N.M.; Nguyen, V.M.; Skubel, R.A.; Hammerschlag, N.; Boon, S.; Young, N.; Danylchuk, A.J.; Metcalf, V. Considerations for effective science communication. FACETS 2017, 2, 233–248. [Google Scholar] [CrossRef] [Green Version]


Publisher’s Note: MDPI stays neutral with regard to jurisdictional claims in published maps and institutional affiliations. |
© 2021 by the authors. Licensee MDPI, Basel, Switzerland. This article is an open access article distributed under the terms and conditions of the Creative Commons Attribution (CC BY) license (https://creativecommons.org/licenses/by/4.0/).
Share and Cite
Medyńska-Gulij, B.; Tegeler, T.; Bauer, H.; Zagata, K.; Wielebski, Ł. Filming the Historical Geography: Story from the Realm of Maps in Regensburg. ISPRS Int. J. Geo-Inf. 2021, 10, 764. https://0-doi-org.brum.beds.ac.uk/10.3390/ijgi10110764
Medyńska-Gulij B, Tegeler T, Bauer H, Zagata K, Wielebski Ł. Filming the Historical Geography: Story from the Realm of Maps in Regensburg. ISPRS International Journal of Geo-Information. 2021; 10(11):764. https://0-doi-org.brum.beds.ac.uk/10.3390/ijgi10110764
Chicago/Turabian StyleMedyńska-Gulij, Beata, Tillmann Tegeler, Hans Bauer, Krzysztof Zagata, and Łukasz Wielebski. 2021. "Filming the Historical Geography: Story from the Realm of Maps in Regensburg" ISPRS International Journal of Geo-Information 10, no. 11: 764. https://0-doi-org.brum.beds.ac.uk/10.3390/ijgi10110764