
A Time Series Investigation to Assess Climate Change and Anthropogenic Impacts on Quantitative Land Degradation in the North Delta, Egypt


Abstract
:1. Introduction
2. Materials and Methods
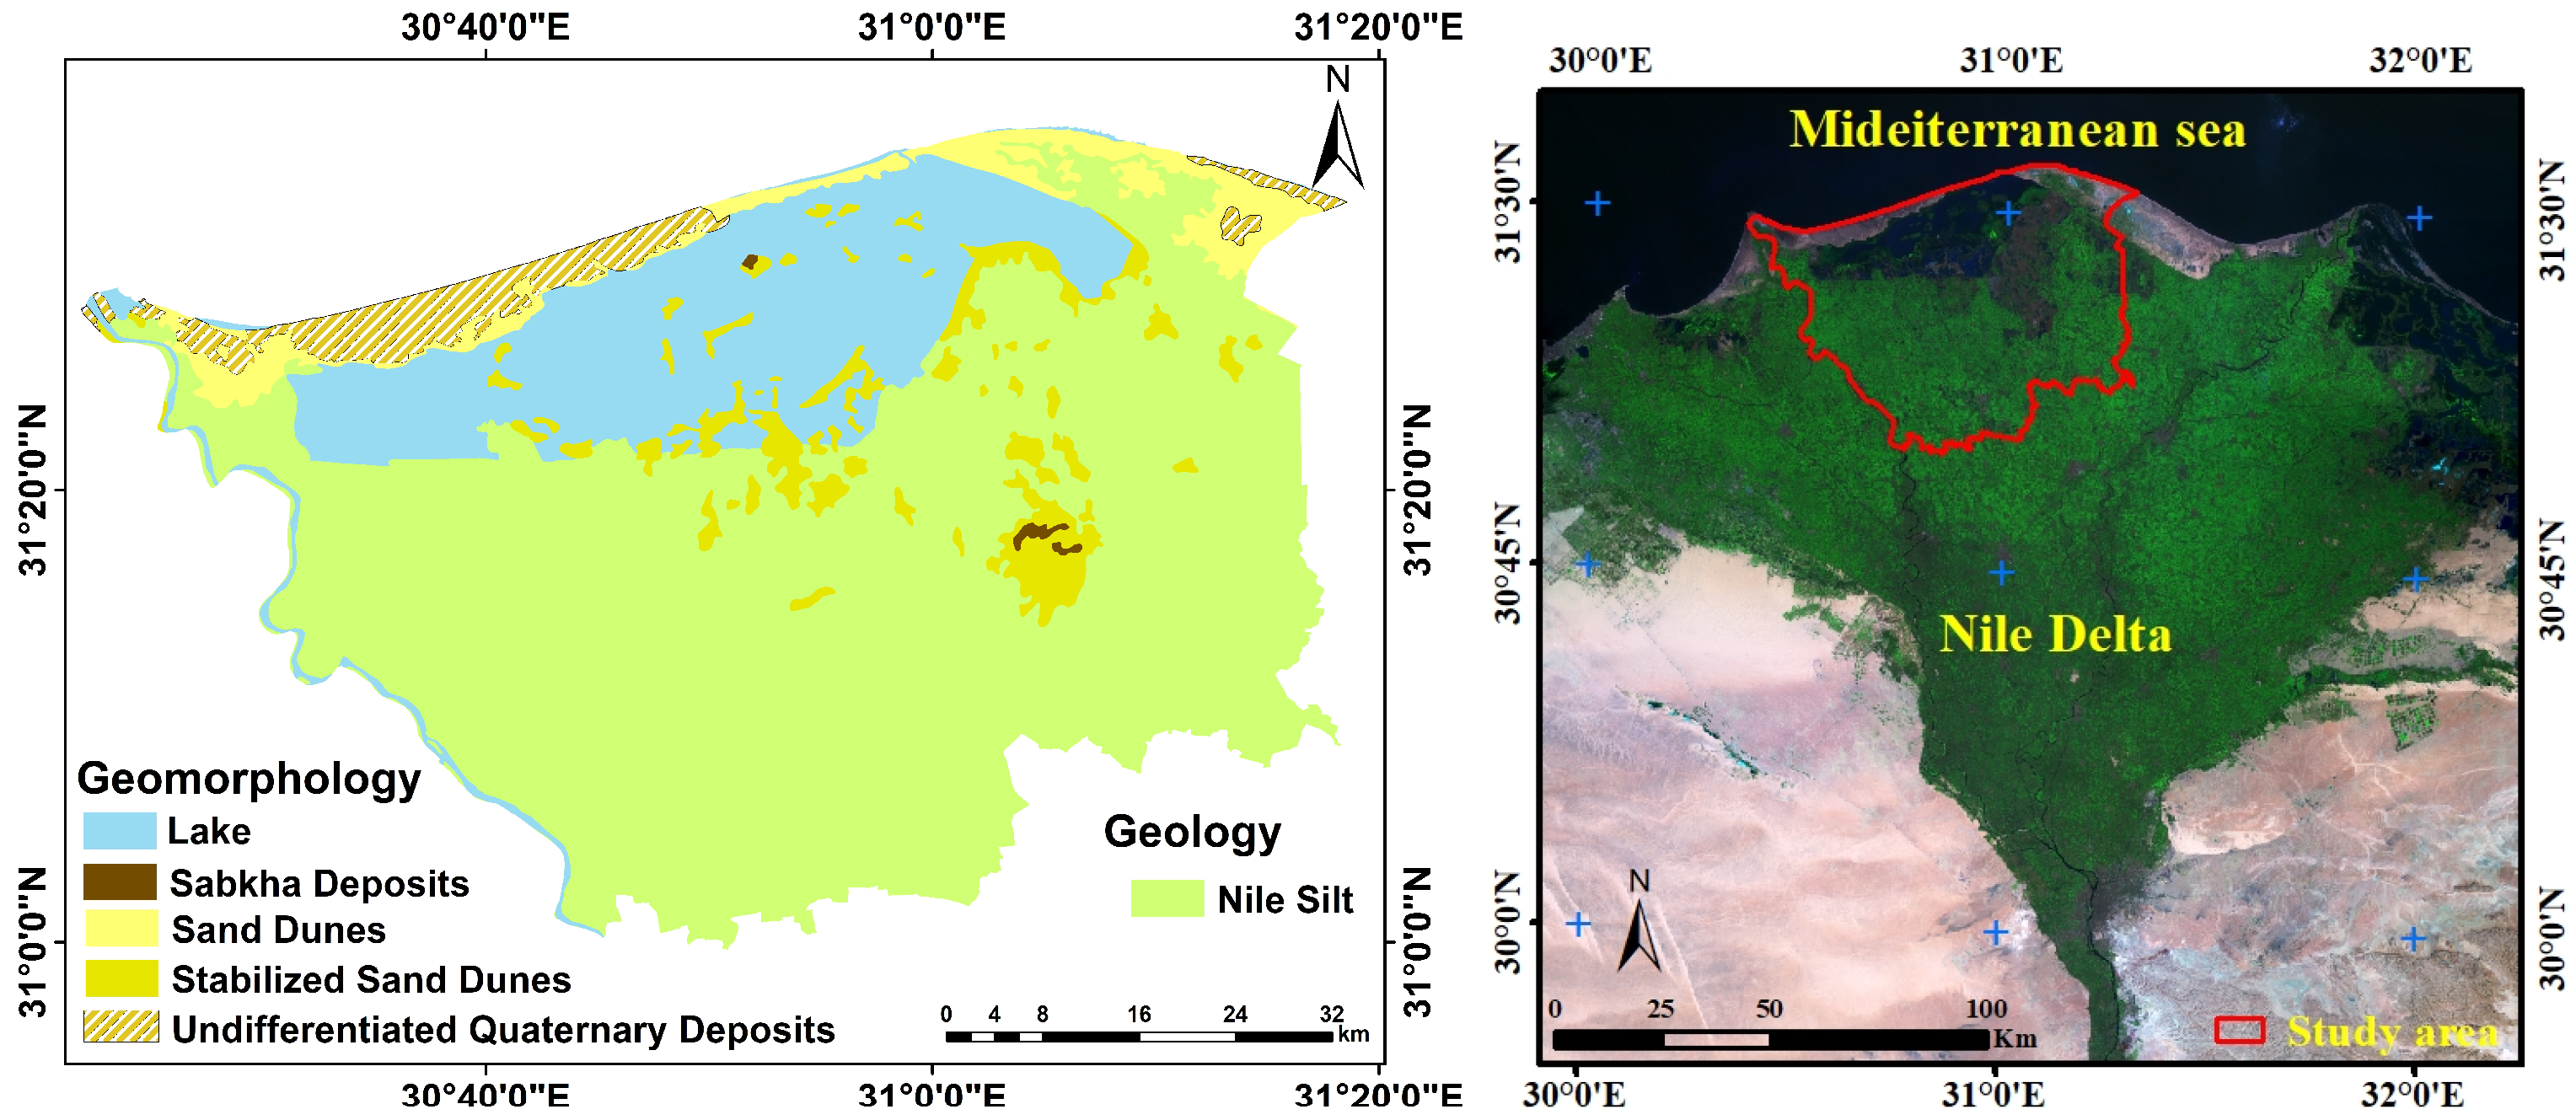
2.1. Study Area
2.2. Remote Sensing Data and Image Processing
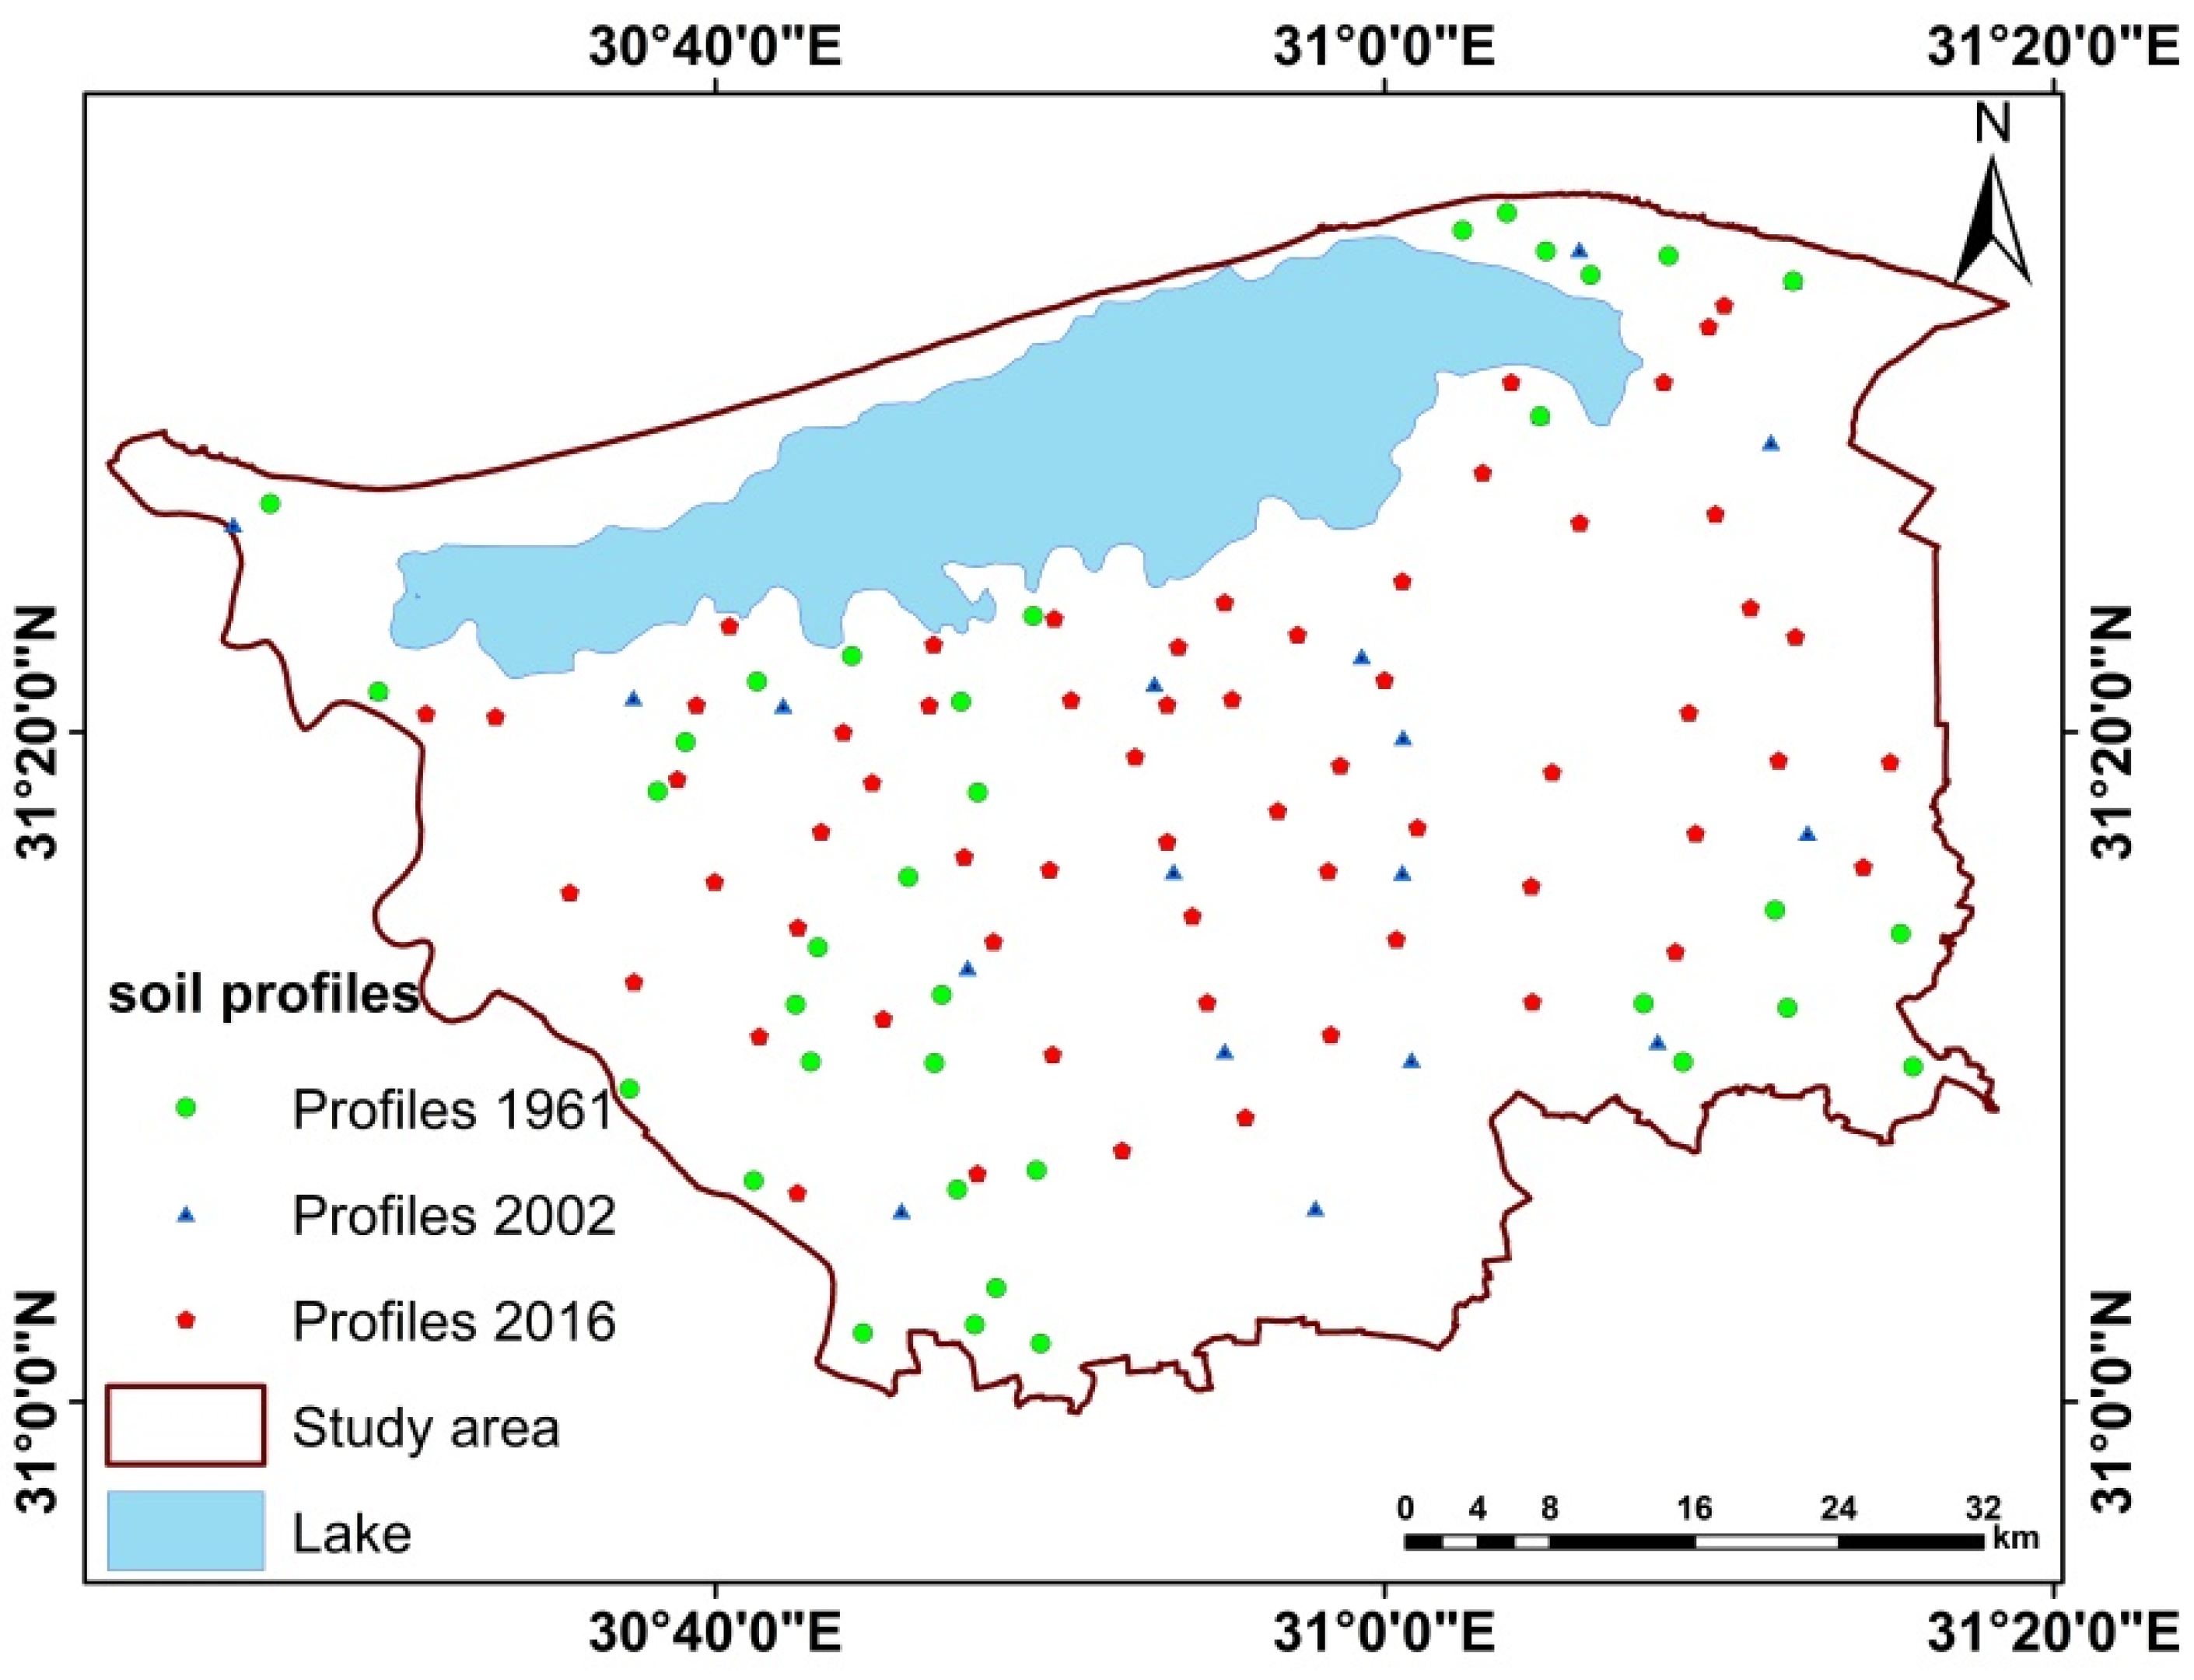
2.3. Fieldwork and Laboratory Analysis
2.4. Preparation of Soil Samples and Methods of Analysis
2.5. Soil Classification
2.6. Active Land Degradation Assessment
2.7. Quantitative Land Degradation Assessment
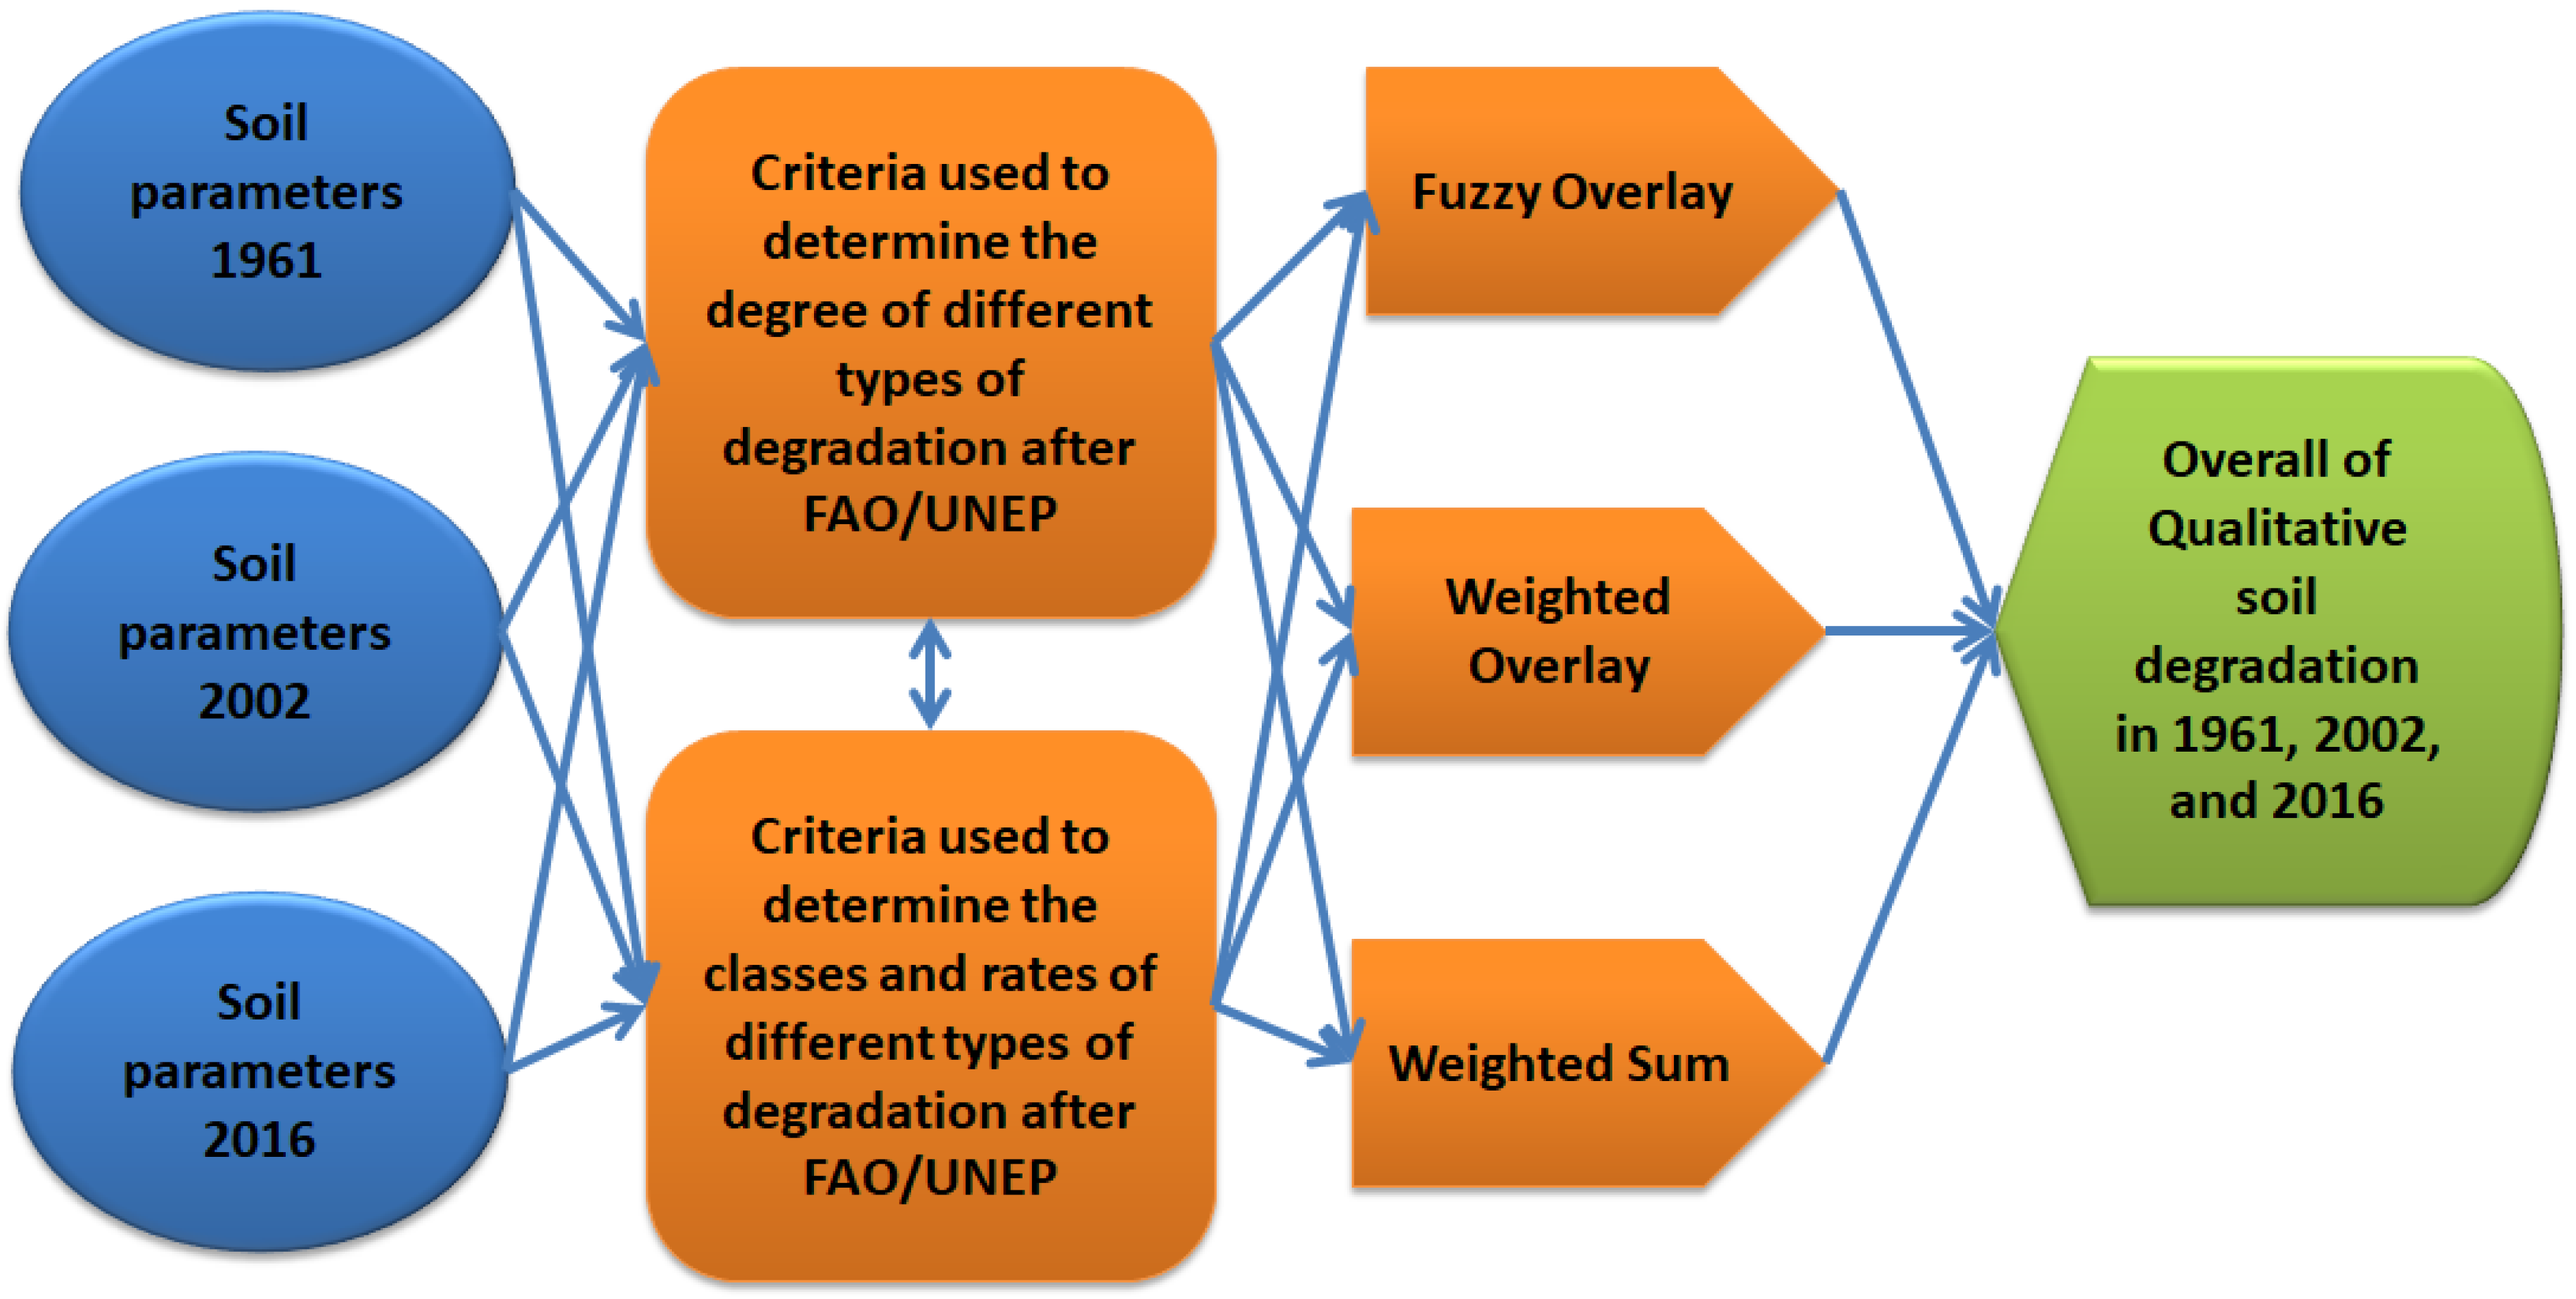
2.8. Spatial Modeling for Land Degradation
3. Results and Discussions
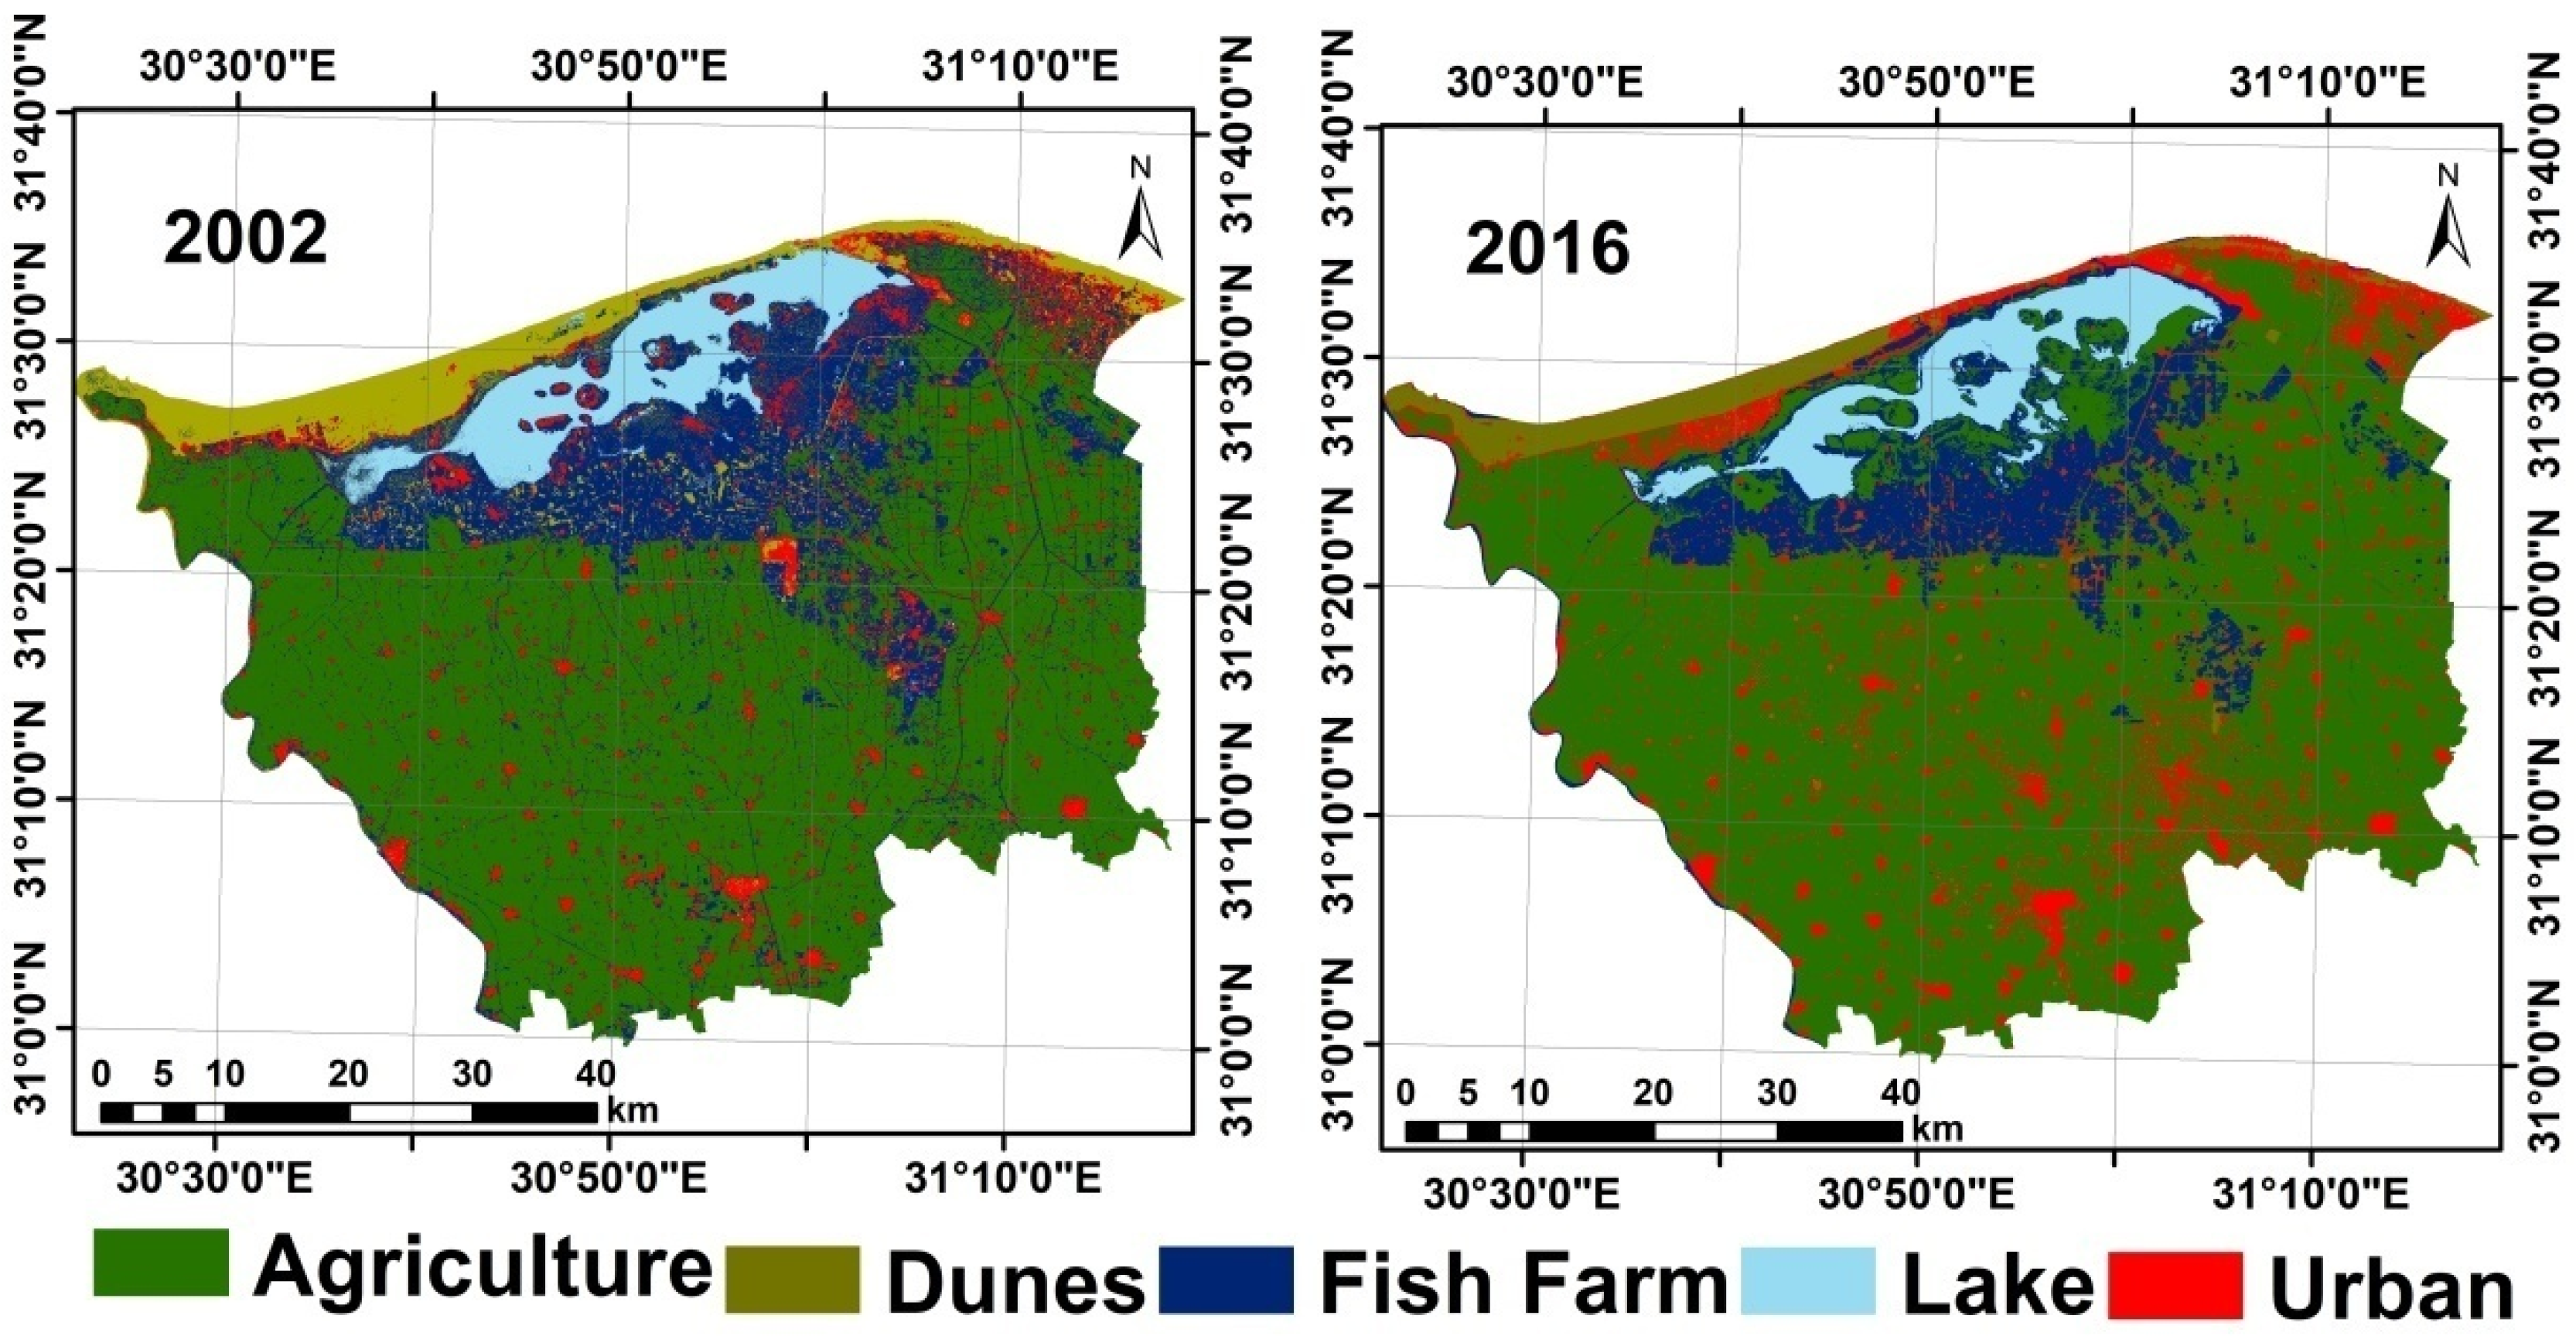
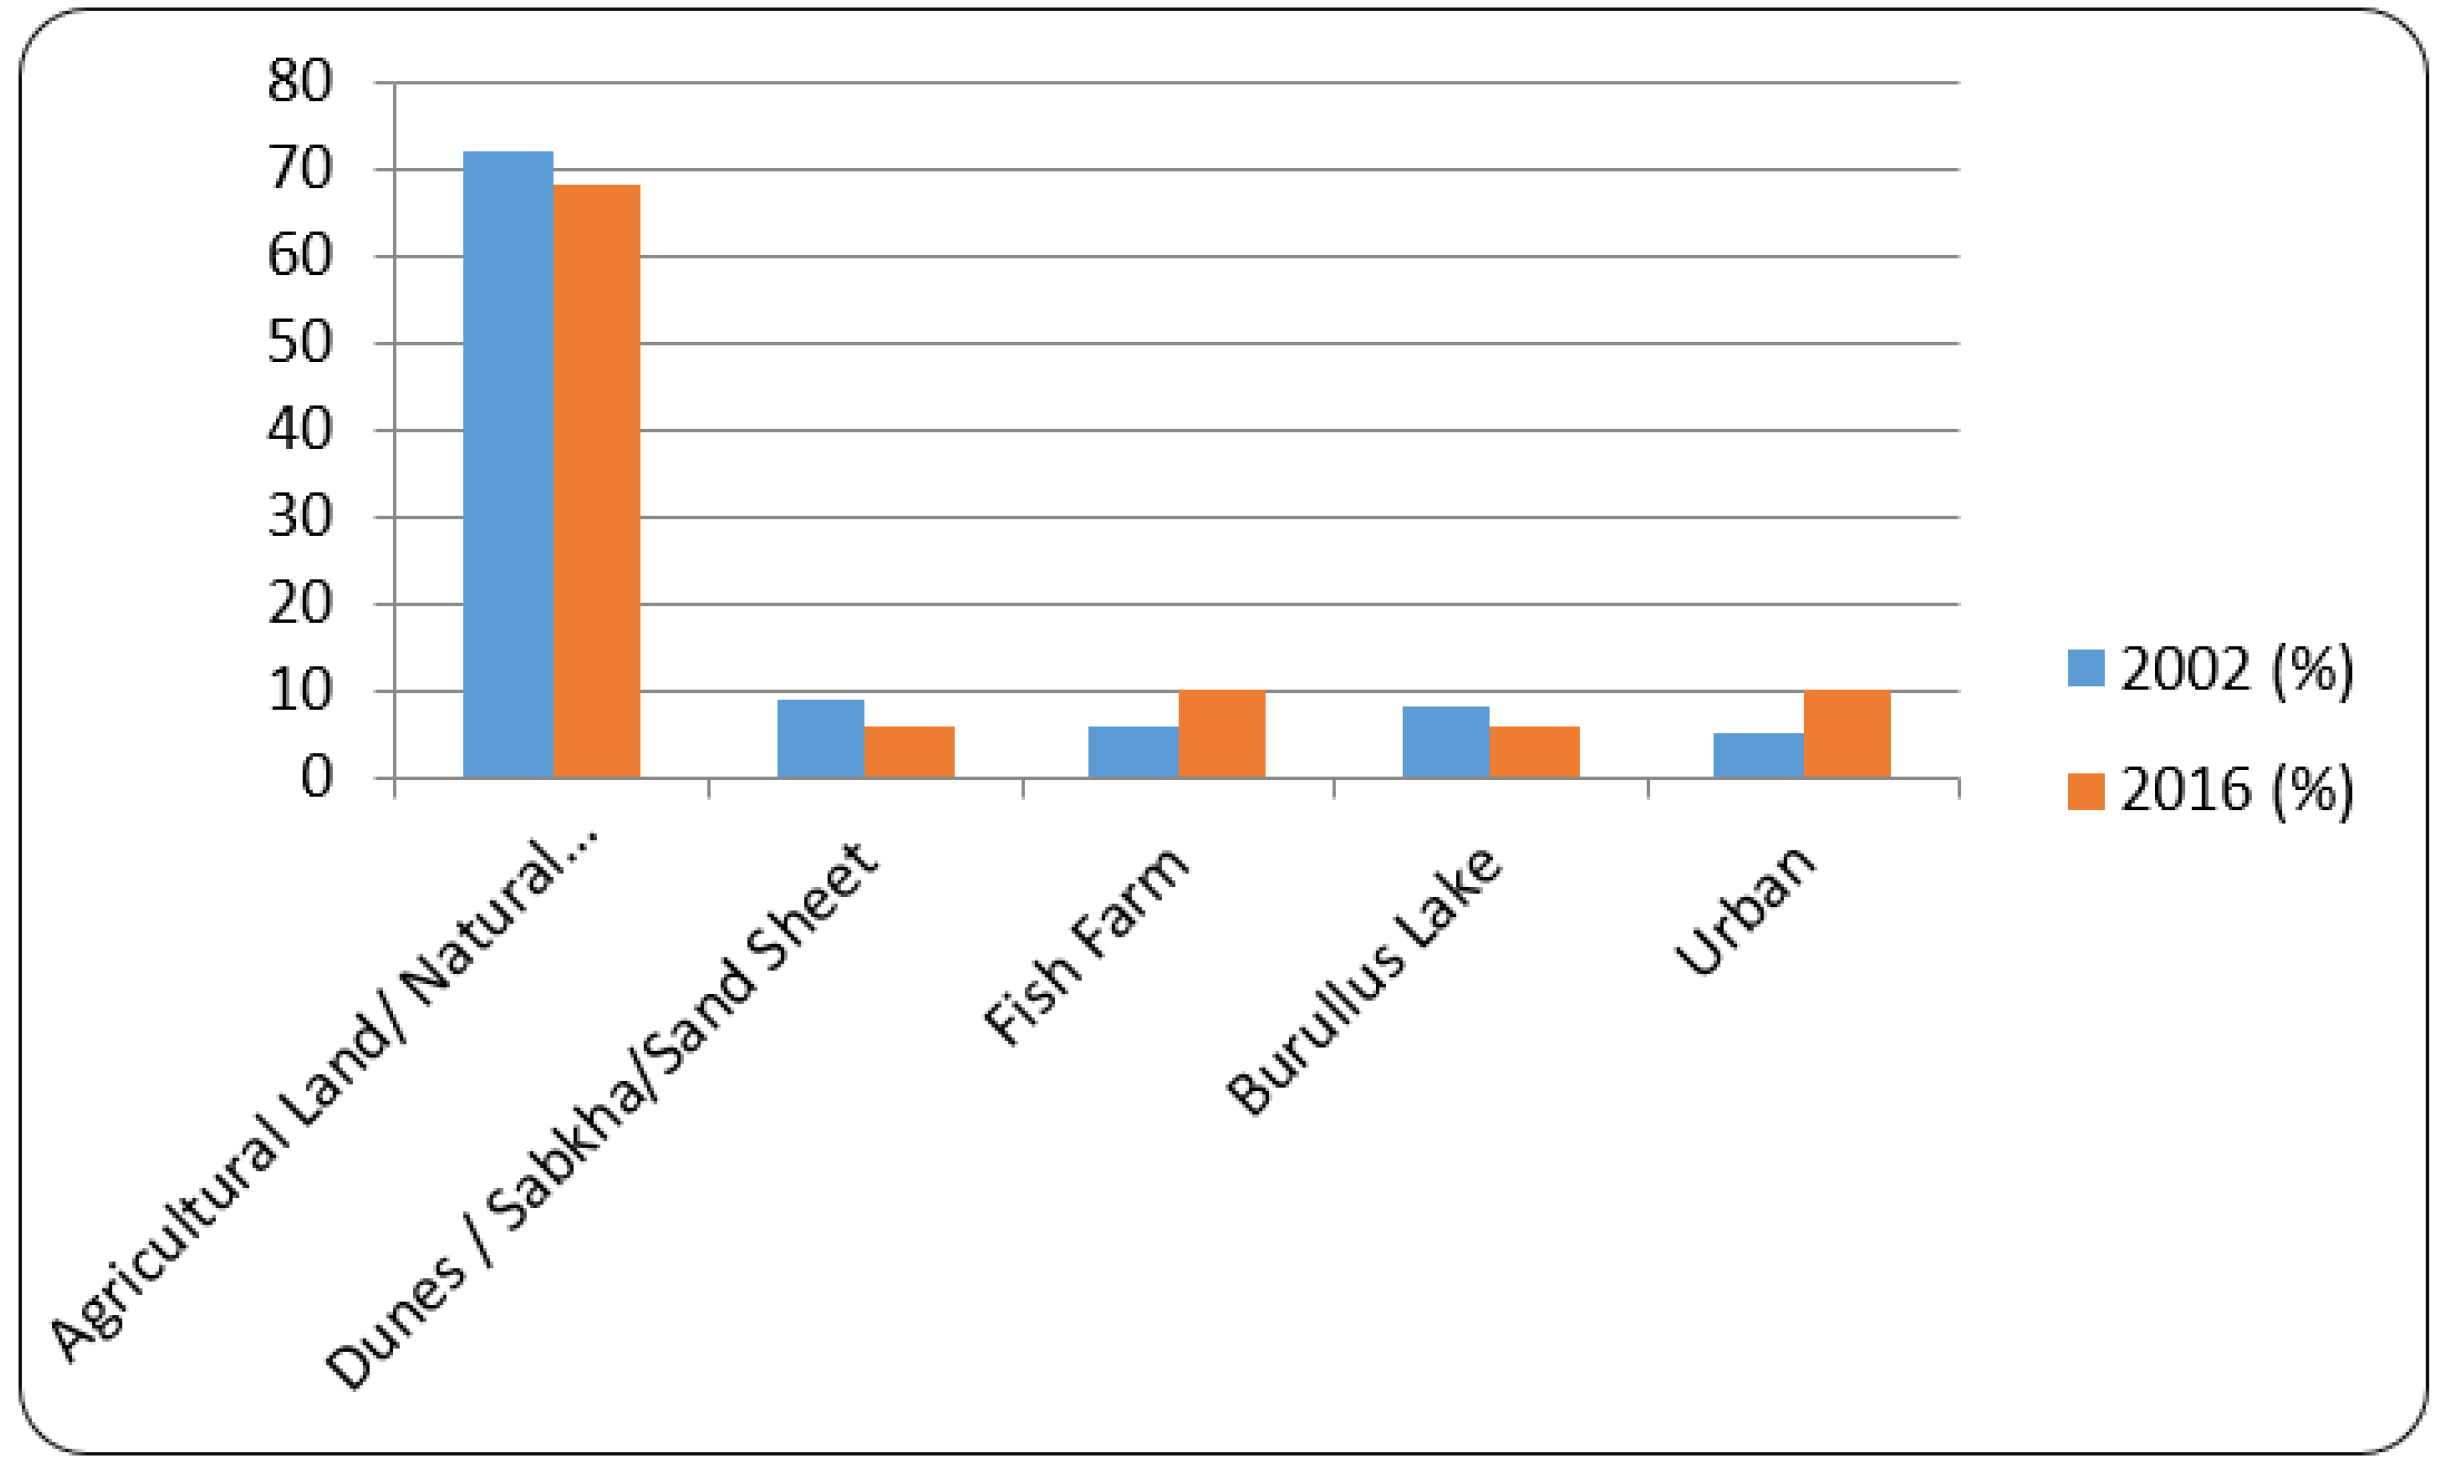
3.1. LULC Classes Using Supervised Classification
3.2. Physiographic and Soil Units in the Area
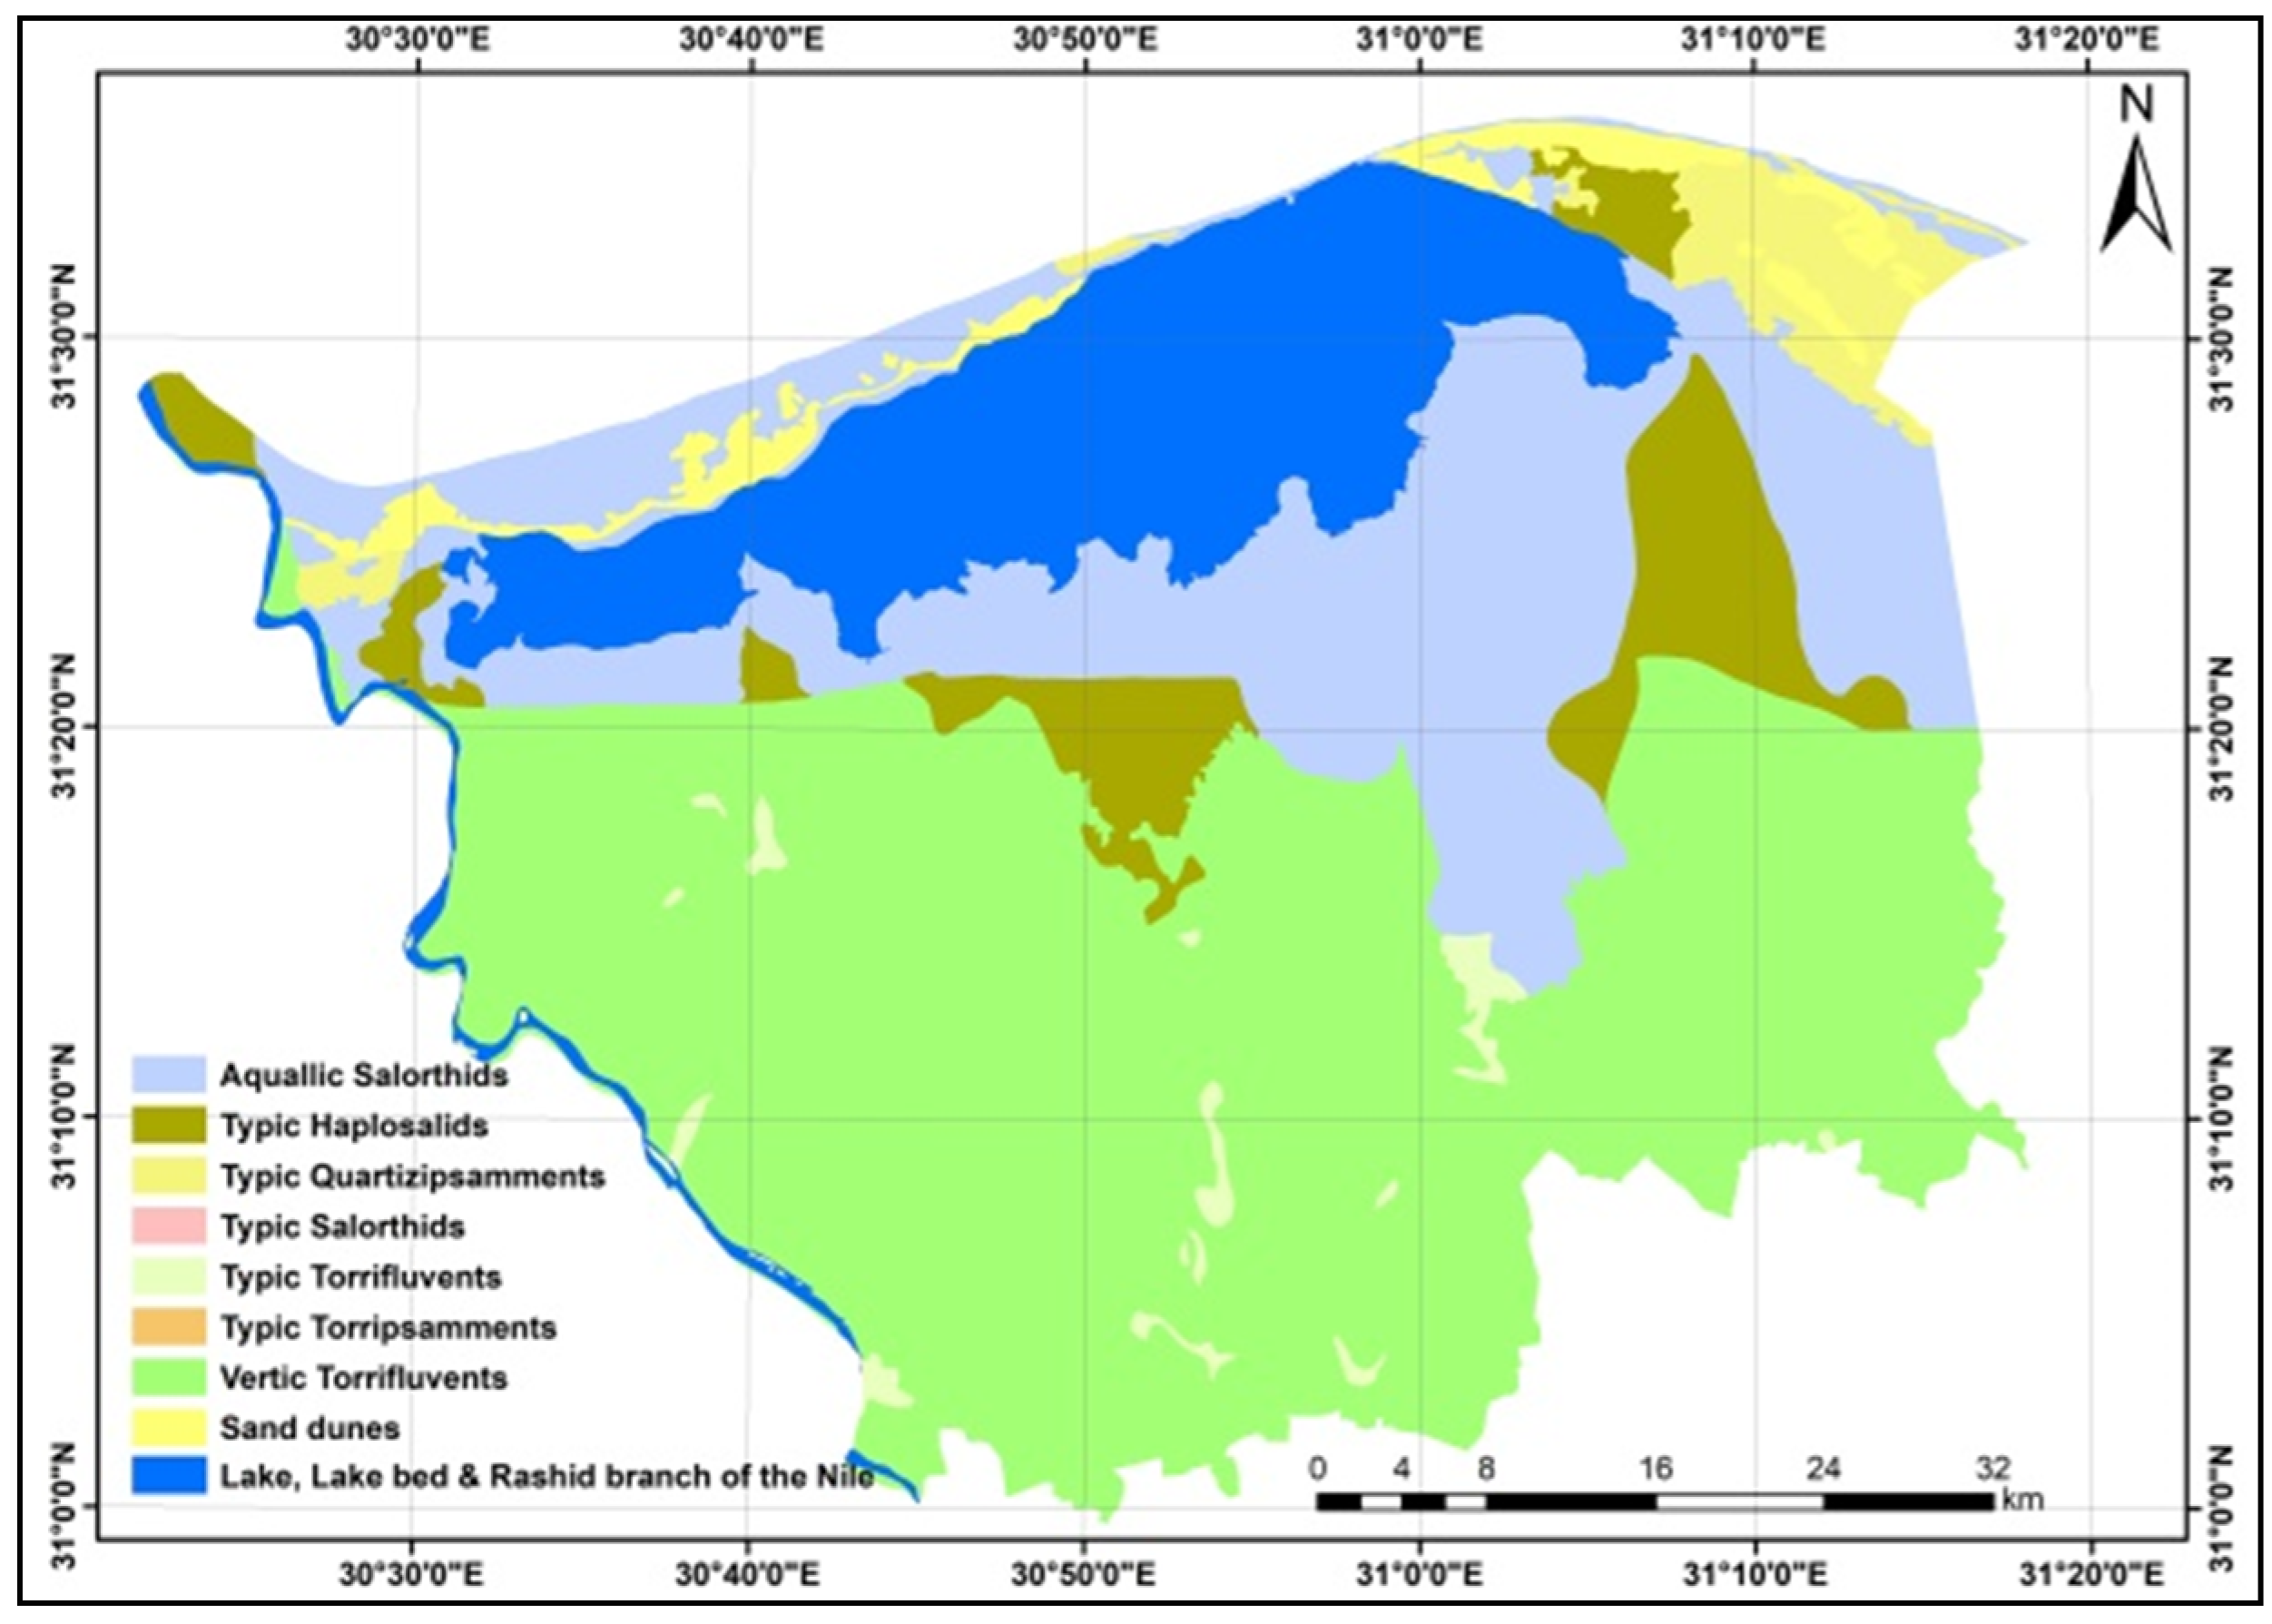
3.3. Soil Classification of the Study Area
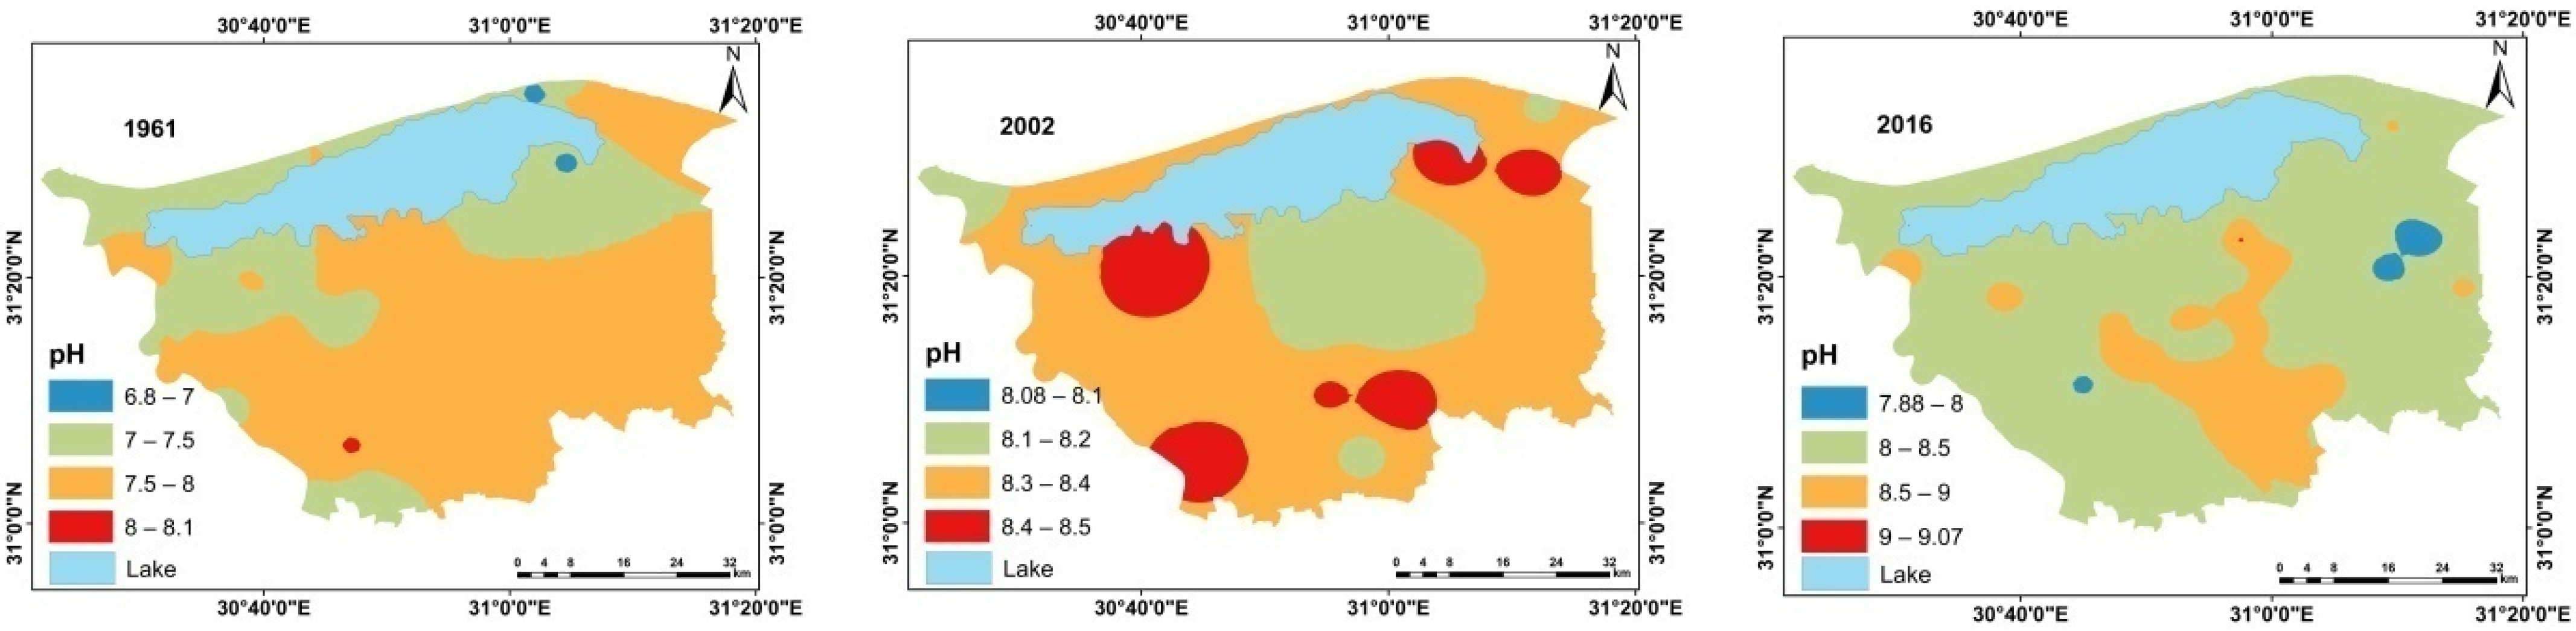
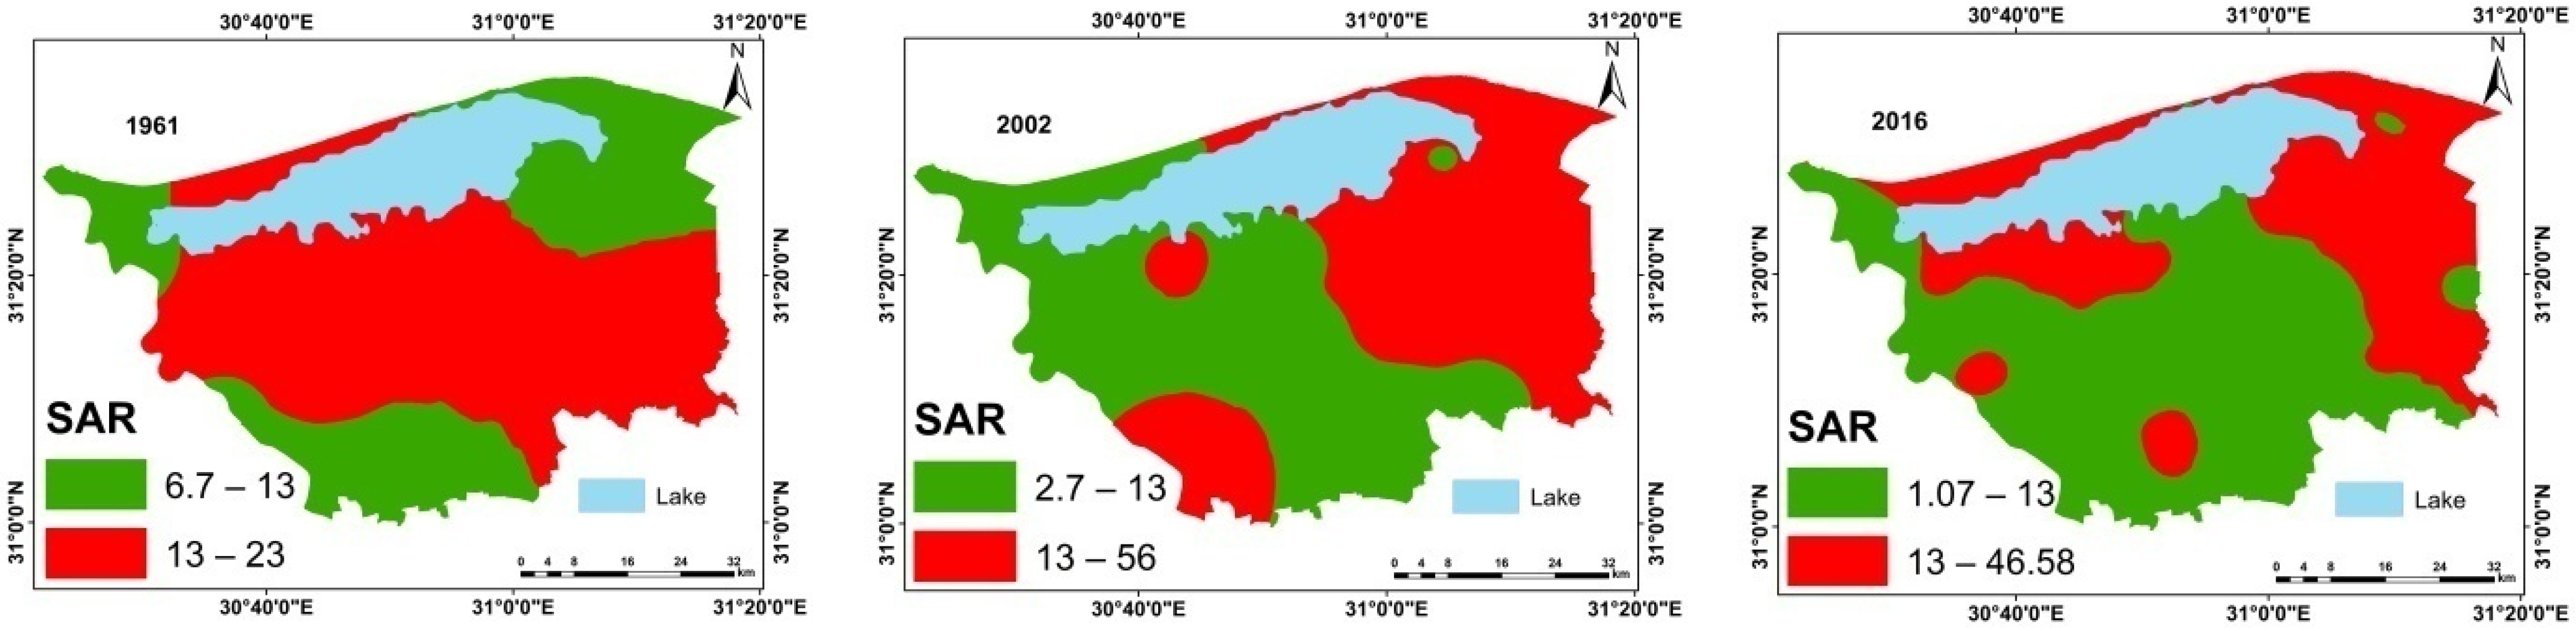
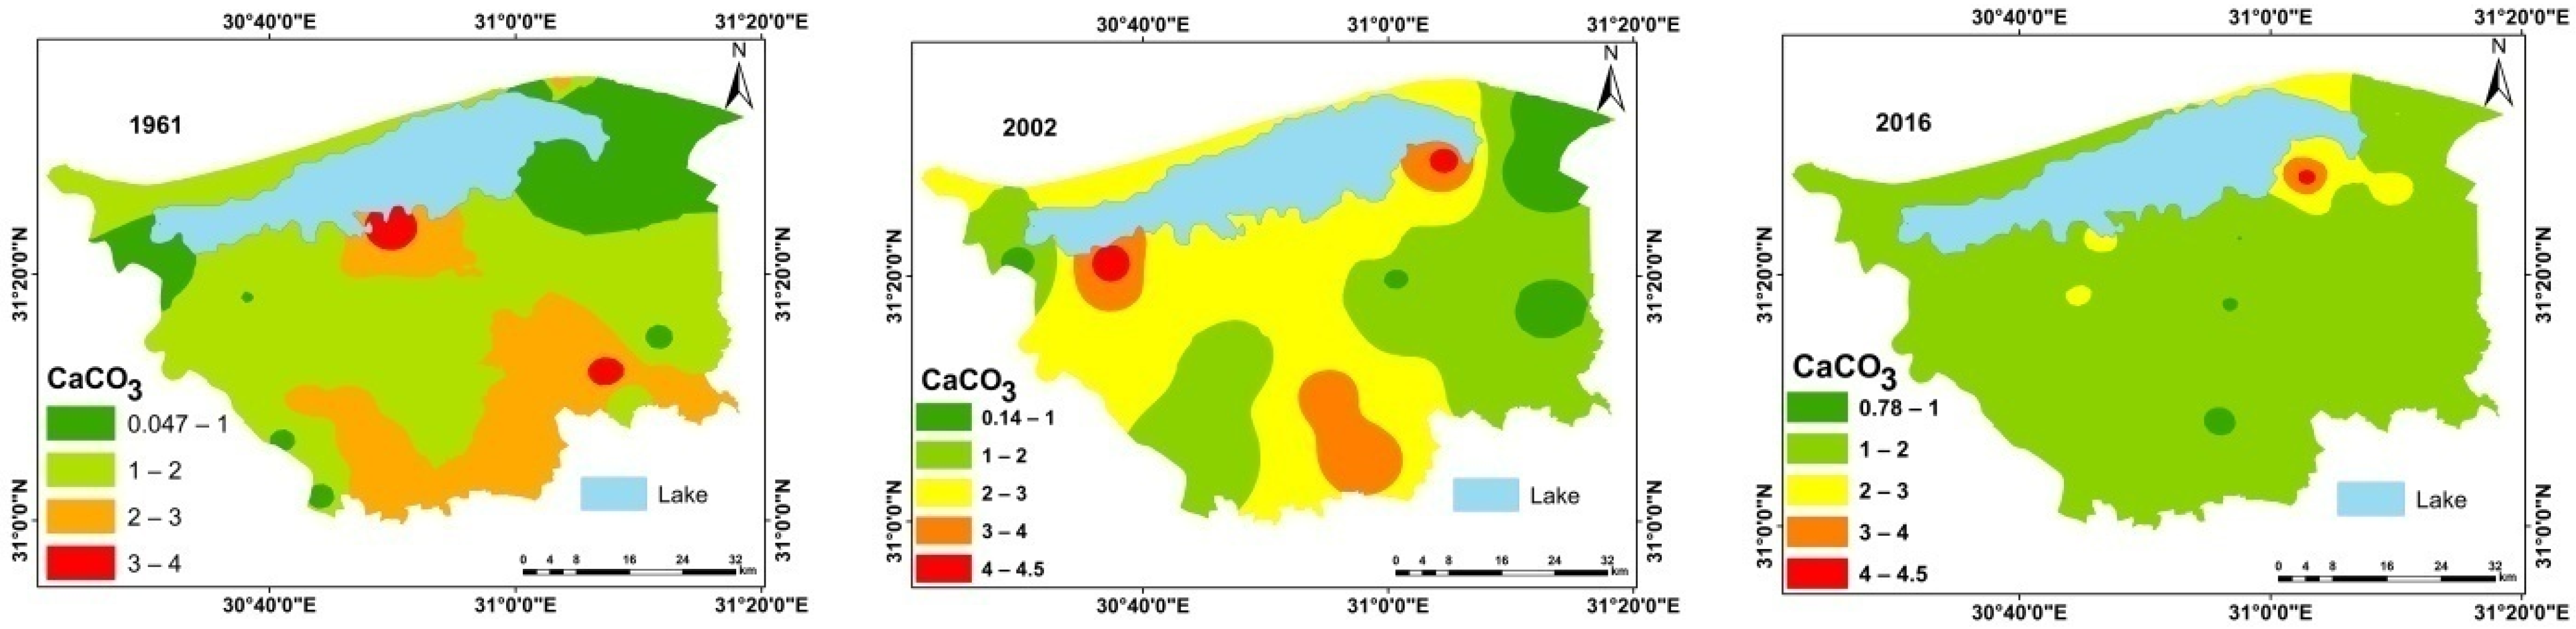
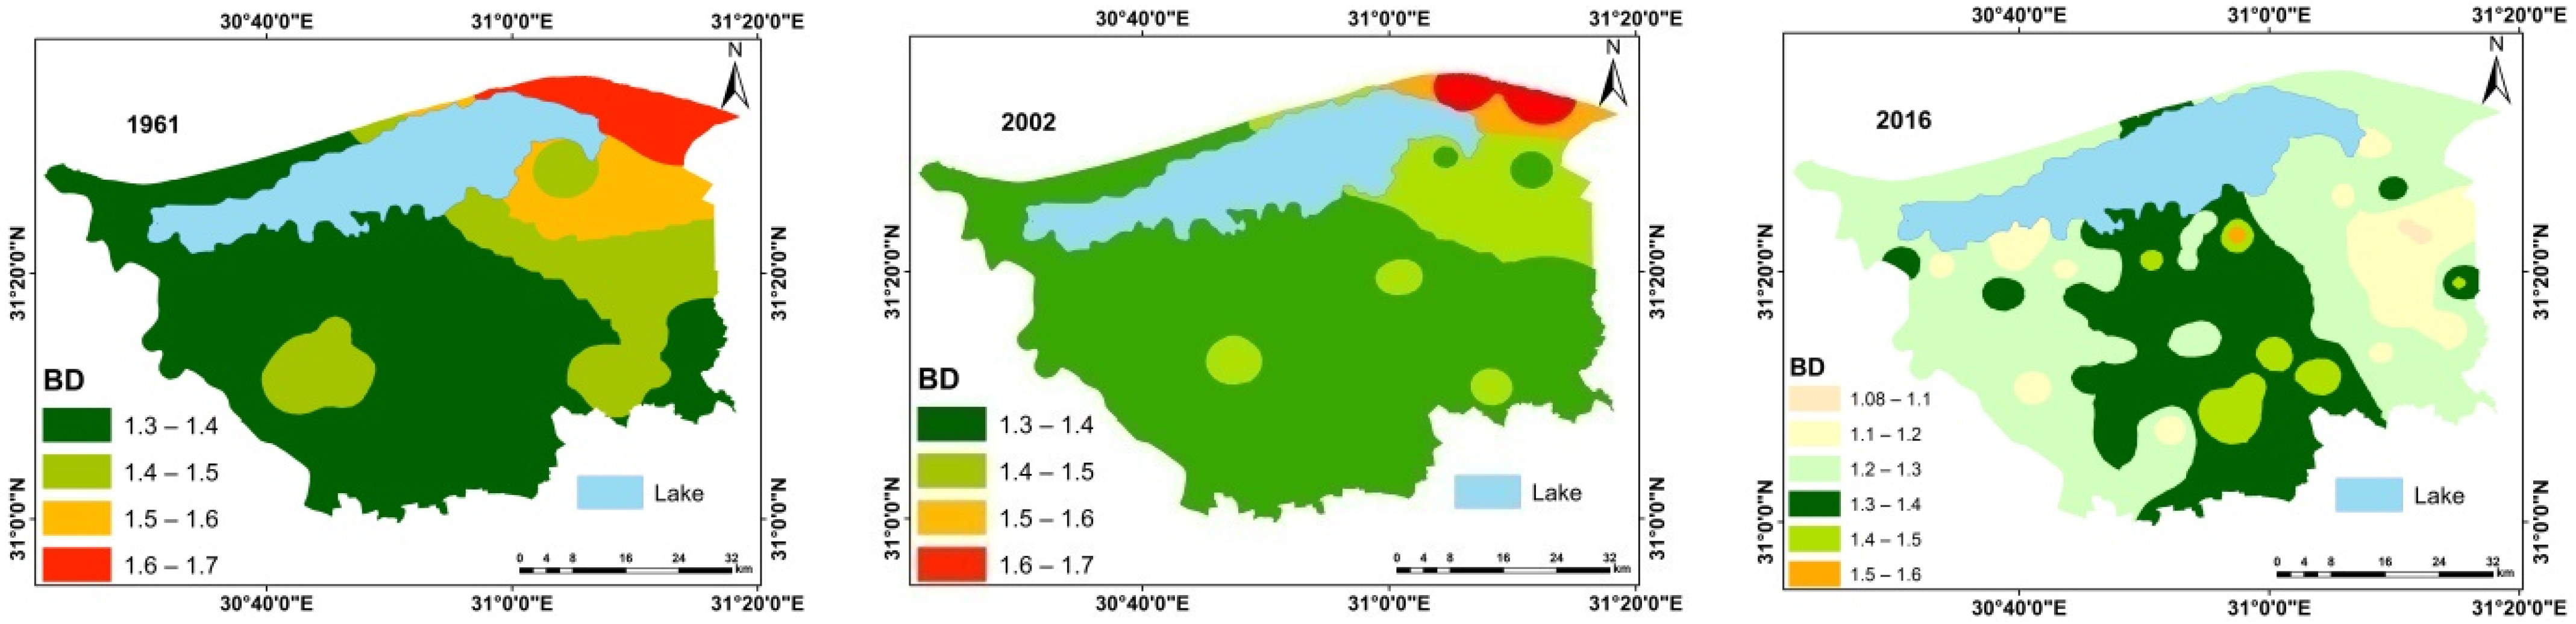
3.4. Comparative Studies of Physiochemical Soil Characteristics
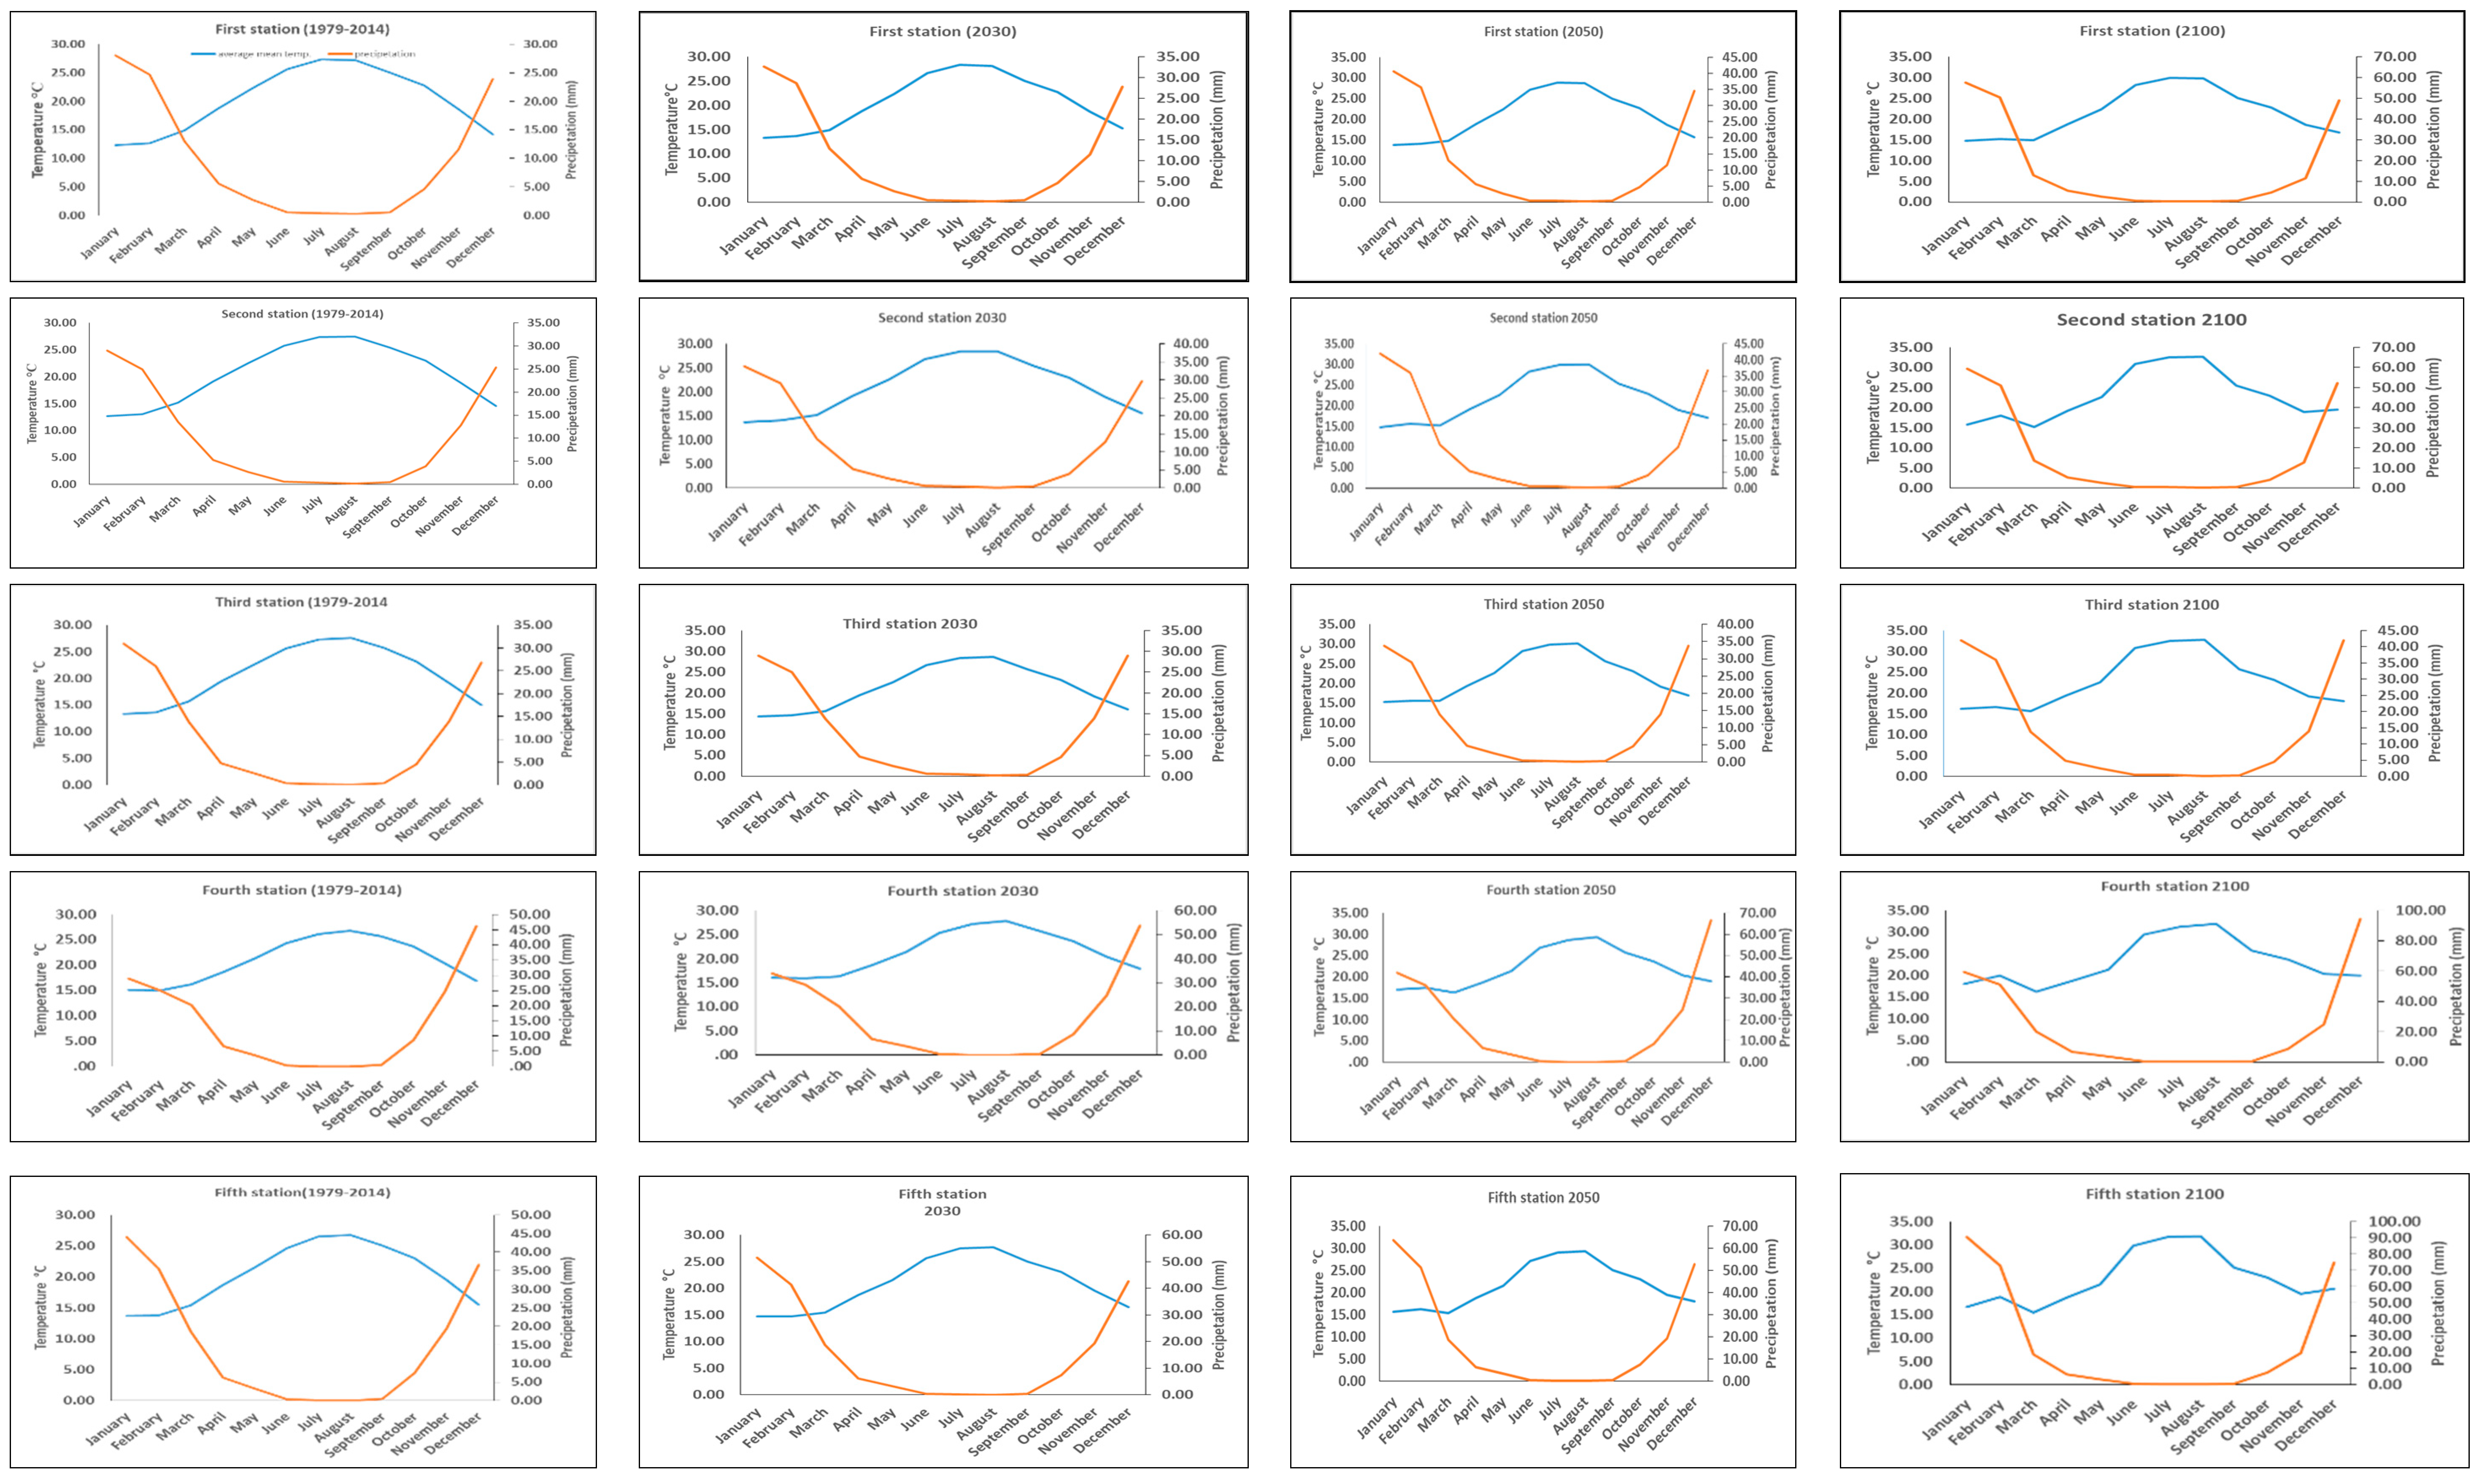
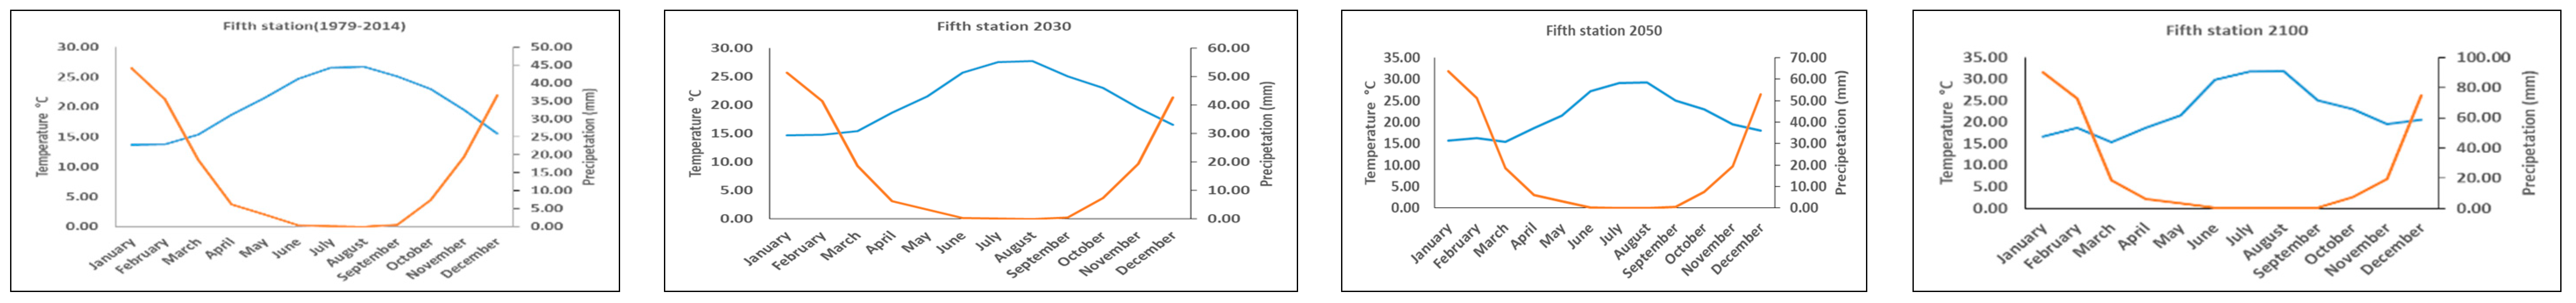
3.5. Climate Attributes
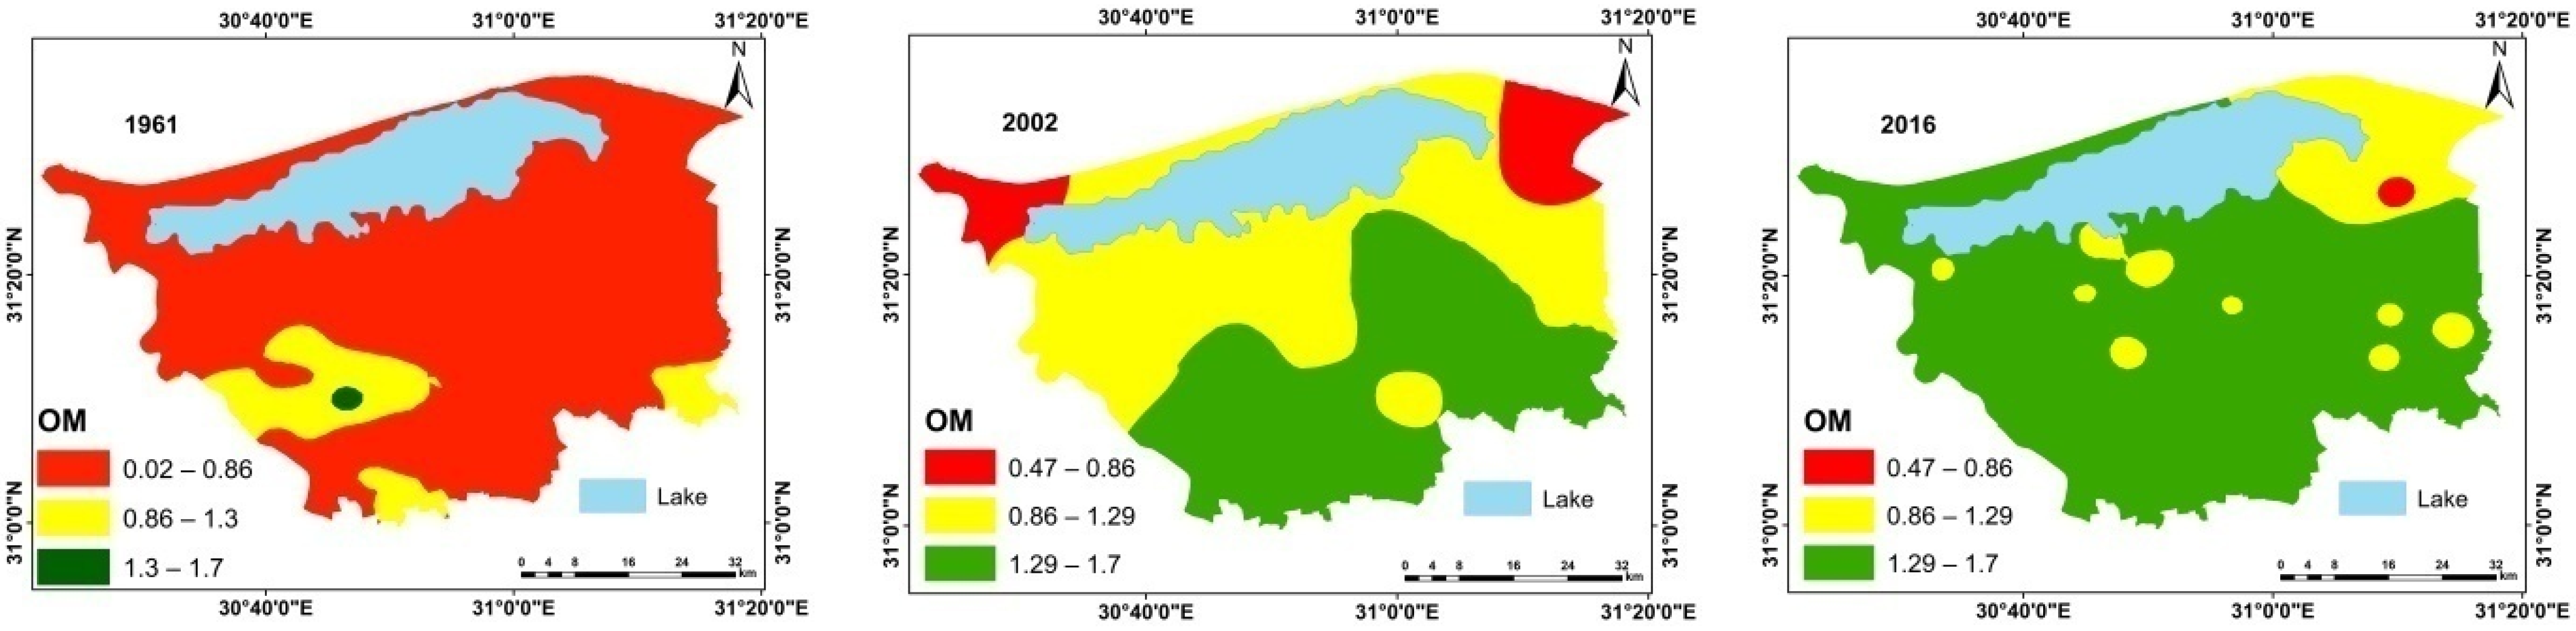
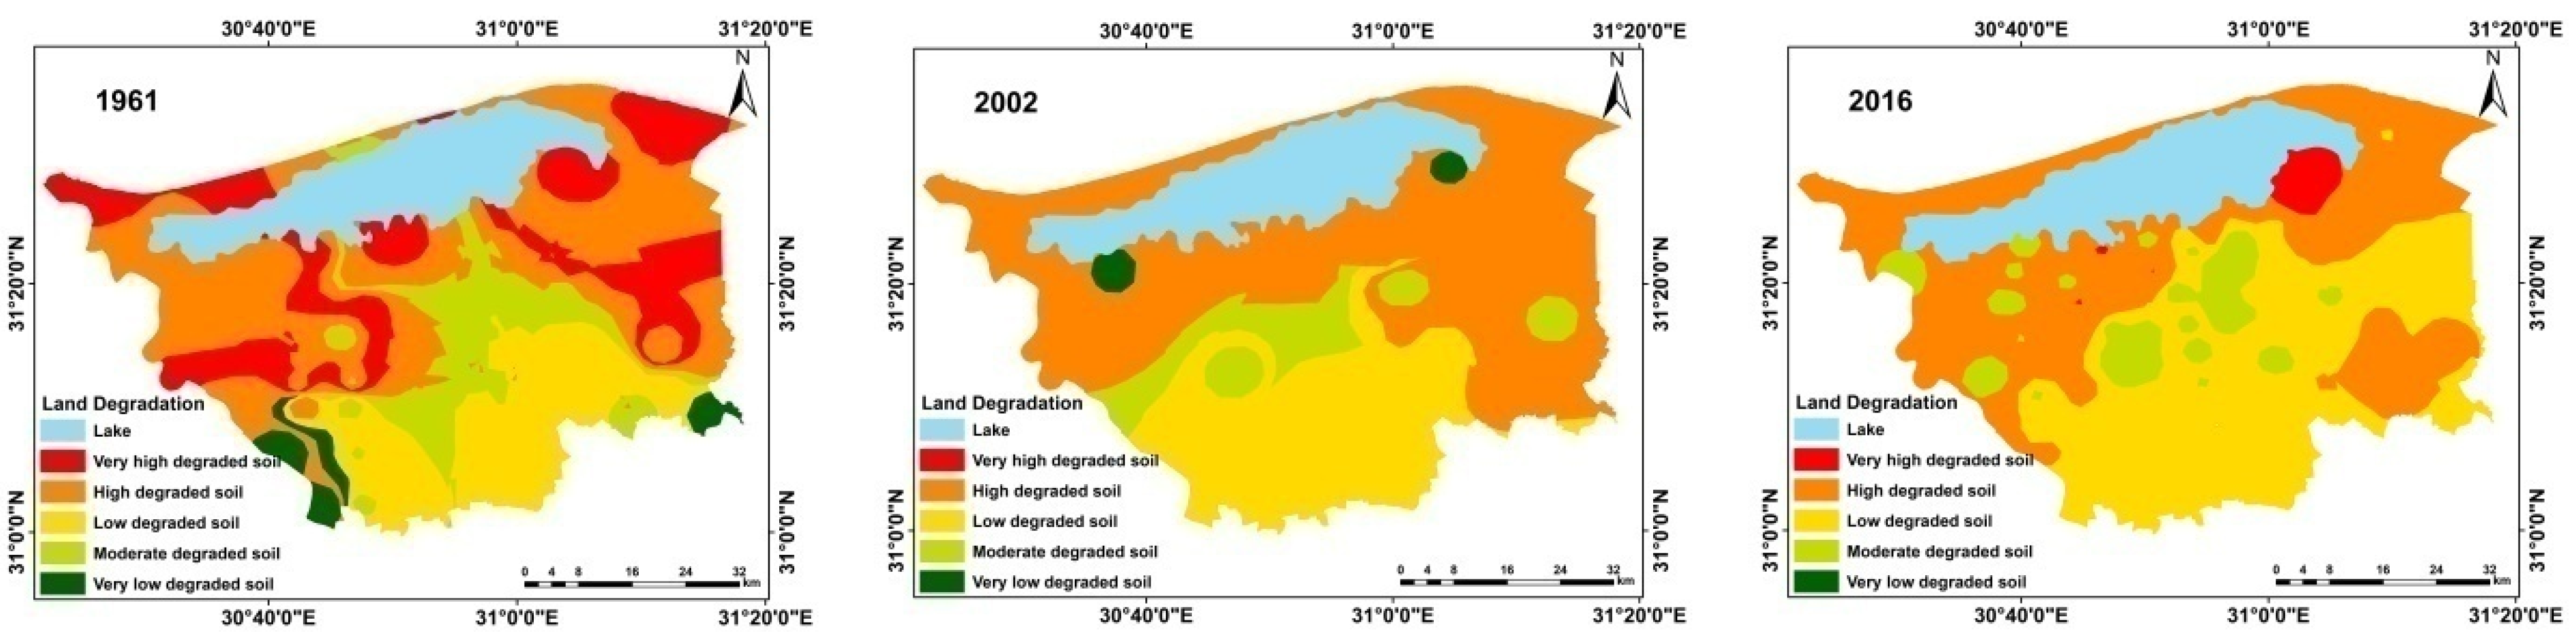
3.6. Overall of Quantitative Soil Degradation Assessment
4. Conclusions
- To develop integrated management systems for land resources and combating desertification.
- To develop land resources, choose their optimal use, and increase their productivity, by preparing land maps (soil-land use-land degradation, etc.).
- To develop and evaluate traditional agricultural operations in dry areas and encourage the exchange of knowledge and successful technologies.
- To develop non-conventional water uses to increase farm income while preserving land from degradation.
Author Contributions
Funding
Institutional Review Board Statement
Informed Consent Statement
Acknowledgments
Conflicts of Interest
References
- Bai, Z.G.; Dent, D.L.; Olsson, L.; Schaepman, M.E. Global Assessment of Land Degradation and Improvement 1: Identification by Remote Sensing; Report 2008/01; ISRIC—World Soil Information: Wageningen, The Netherlands, 2008. [Google Scholar] [CrossRef]
- FAO. FAO/UNEPExpert Consultation on Methodology for Assessing Soil Degradation; FAO: Rome, Italy, 1978. [Google Scholar]
- AdelRahman, M.A.E. Quantification of Land Degradation Indicators Using Remote Sensing and GIS Techniques. Master’s Thesis, Zagazig University, Zagazig, Egypt, 2009. [Google Scholar]
- Belal, A.B.A.; Al-Ashri, K.M.A. GIS based land evaluation in Baharyia oasis, western desert, Egypt. J. Soil Sci. Agric. Eng. Mansoura Univ. 2011, 2, 11–24. [Google Scholar] [CrossRef]
- AbdelRahman, M.A.E. Assessment of Land Degradation and Land Use Planning by Using Remote, Sensing and GIS Techniques in Chamarajanagar District. Ph.D. Thesis, UAS, Bangalore University, Bangalore, Karnataka, India, 2014. [Google Scholar]
- AbdelRahman, M.A.E.; Natarajan, A.; Srinivasamurty, C.A.; Hegde, R. Estimating soil fertility status in physically degraded land using GIS and remote sensing techniques in Chamarajanagar district, Karnataka, India. Egypt. J. Remote Sens. Space Sci. 2016, 19, 95–108. [Google Scholar] [CrossRef] [Green Version]
- AbdelRahman, M.A.E.; Natarajan, A.; Rajendra, H.; Prakash, S.S. Assessment of land degradation using comprehensive geostatistical approach and remote sensing data in GIS-model builder. Egypt. J. Remote Sens. Space Sci. 2018, 22, 323–334. [Google Scholar] [CrossRef]
- AbdelRahman, M.A.E.; Metwaly, M.M.; Shalaby, A. Quantitative assessment of soil saline degradation using remote sensing indices in Siwa Oasis. Remote Sens. Appl. Soc. Environ. 2019, 13, 53–60. [Google Scholar] [CrossRef]
- AbdelRahman, M.A.E.; Shalaby, A.; Essa, E.F. Quantitative land evaluation based on fuzzy-multi-criteria spatial model for sustainable land-use planning. Modeling Earth Syst. Environ. 2018, 4, 1341–1353. [Google Scholar] [CrossRef]
- AbdelRahman, M.A.E.; Shalaby, A.; Mohamed, E.S. Comparison of two soil quality indices using two methods based on geographic information system. Egypt. J. Remote Sens. Space Sci. 2018, 22, 127–136. [Google Scholar] [CrossRef]
- AbdelRahman, M.A.E.; Tahoun, S. GIS model-builder based on comprehensive geostatistical approach to assess soil quality. Remote Sens. Appl. Soc. Environ. 2019, 13, 204–214. [Google Scholar] [CrossRef]
- AbdelRahman, M.A.E.; Natarajan, A.; Srinivasamurthy, C.A.; Hegde, R.; Prakash, S.S. Assessment of Soil Quality by Using Remote Sensing and GIS Techniques; A Case study, Chamrajanagar District, Karnataka, India. Acta Sci. Agric. 2018, 2, 5–12. [Google Scholar]
- AbdelRahman, M.A.E.; Arafat, S.M. An Approach of Agricultural Courses for Soil Conservation Based on Crop Soil Suitability Using Geomatics. Earth Syst. Environ. 2020, 4, 273–285. [Google Scholar] [CrossRef]
- AbdelRahman, M.A.E.; Natarajan, A.; Hegde, R. Assessment of land suitability and capability by integrating remote sensing and GIS for agriculture in Chamarajanagar district, Karnataka, India. Egypt. J. Remote Sens. Space Sci. 2016, 19, 125–141. [Google Scholar] [CrossRef] [Green Version]
- AbdelRahman, M.A.E.; Tahoun, S.A.; Abdel Bary, E.A.; Arafat, S.M. Detecting Land Degradation Processes Using Geo Statistical Approach in Port Said, Egypt. Zagazig J. Agric. Res. 2008, 35, 1361–1379. [Google Scholar]
- AbdelRahman, M.A.E.; Rehab, H.H.; Yossif, T.M.H. Soil fertility assessment for optimal agricultural use using remote sensing and GIS technologies. Appl. Geomat. 2021, 13, 1–14. [Google Scholar] [CrossRef]
- AbdelRahman, M.A.E.; Zakarya, Y.M.; Metwaly, M.M.; Koubouris, G. Deciphering Soil Spatial Variability through Geostatistics and Interpolation Techniques. Sustainability 2021, 13, 194. [Google Scholar] [CrossRef]
- Abuzaid, S.A.; Abdellatif, D.A.; Fadl, M.E. Modeling soil quality in Dakahlia Governorate, Egypt using GIS techniques. Egypt. J. Remote Sens. Space Sci. 2021, 24, 255–264. [Google Scholar] [CrossRef]
- Abuzaid, A.S.; Fadl, M.E. Mapping potential risks of long-term wastewater irrigation in alluvial soils, Egypt. Arab. J. Geosci. 2018, 11, 433. [Google Scholar] [CrossRef]
- Ali, R.R.; Abd El-Kader, A.A.; Essa, E.F.; AbdelRahman, M.A.E. Application of Remote Sensing to Determine Spatial Changes in Soil Properties and Wheat Productivity Under Salinity Stress. Plant Arch. 2019, 19, 616–621. [Google Scholar]
- Bakr, N.; Weindorf, D.C.; Bahnassy, M.H.; El-Badawi, M.M. Multi-temporal assessment of land sensitivity to desertification in a fragile agro-ecosystem: Environmental indicators. Ecol. Indic. 2012, 15, 271–280. [Google Scholar] [CrossRef]
- IPCC. Climate Change 2007: Mitigation. Contribution of Working Group III to the Fourth Assessment Report of the Intergovernmental Panel on Climate Change; Cambridge University Press: Cambridge, UK; New York, NY, USA, 2007. [Google Scholar]
- DEFRA. Impact of Climate Change on Soil Functions; Final Project Report; Research and Development: London, UK, 2005. [Google Scholar]
- Pathak, H.; Aggarwal, P.K.; Singh, S.D. Climate Change Impact, Adaptation and Mitigation in Agriculture: Methodology for Assessment and Application; Indian Agricultural Research Institute: New Delhi, India, 2012; pp. 1–302.
- Varallyay, G.; Farkas, C.S. Impact of Climate Change on Soils. In Climate Change: Environment-Risk-Society; Harnos, Z.S., Csete, L., Eds.; SzaktudasKiadoHaz: Budapest, Hungary, 2008; pp. 91–129. (In Hungarian) [Google Scholar]
- Brinkman, R. Resilience Against Climate Change? In Soil Minerals, Transformations and Surface Properties, EC, pH; Scharpenseel, H.W., Shomaker, M., Ayoub, A., Eds.; Elsevier: New York, NY, USA, 1990; pp. 51–60. [Google Scholar]
- Conoco Geologic Map of Egypt. Egyptian General Authority for Petroleum (UNESCO Joint Map Project), 20 Sheets, Scale 1:50, 000; Conoco Geologic Map of Egypt: Cairo, Egypt, 1987. [Google Scholar]
- FAO. Guidelines for Soil Description, 4th ed.; FAO: Rome, Italy, 2006. [Google Scholar]
- Richards, L.A. Diagnosis and Improvement of Saline and Alkali Soils United State Department of Agriculture Hand Book; No. 60; United State Government Printing Office: Washington, DC, USA, 1954.
- Nelson, R.E. Carbonate and gypsum. In Methods of Soil Analysis, Part 2: Chemical and Microbiological Properties; Page, A.L., Ed.; American Society of Agronomy: Madison, WI, USA, 1982; pp. 181–197. ISBN 9780891180722. [Google Scholar]
- Nelson, D.W.; Sommers, L.E. Total carbon, organic carbon and organic matter. In Methods of Soil Analysis. Part 2: Chemical and Microbiological Properties; Page, A.L., Ed.; American Society of Agronomy: Madison, WI, USA, 1982; pp. 539–579. ISBN 9780891180722. [Google Scholar]
- Black, G.A. Methods of Soil Analysis; American Society of Agronomy: Madison, WI, USA, 1965; Volume 15, p. 72. [Google Scholar]
- Jackson, M.L. Soil Chemical Analysis; Prentice Hall of India, Pvt. Ltd.: New Delhi, India, 1973; p. 498. [Google Scholar]
- USDA-Natural Resources Conservation Service- Soil Survey Staff. Keys to Soil Taxonomy, 12th ed.; USDA: Washington, DC, USA, 2014.
- Ministry of Agriculture and Land Reclamation, Egypt. Survey Report; Ministry of Agriculture and Land Reclamation, Egypt: Giza, Egypt, 1961.
- Abo-Waly, M.E.M. Pedological Studies on Different Salt Affected Soils South of the Mohite Drain at Kafr El-Sheikh Governorate (A.R.E). Master’s Thesis, Soil Science Department, Faculty of Agriculture, Tanta University, Tanta, Egypt, 1982. [Google Scholar]
- Saffan, M.M. To Know the Soil in the Shalma Region (North Nile Delta, Egypt). Ph.D. Thesis, Justus Liebig University, Giessen, Germany, 1984. [Google Scholar]
- FAO; UNEP; UNESCO. A Provisional Methodology for Soil Degradation Assessment; FAO: Rome, Italy, 1979; ISBN 9251008698. [Google Scholar]
- UNEP. UNEP STAFF Global Assessment of Soil Degradation (GLASOD); UNEP, UN, GLASOG Project: Wageningen, The Netherlands, 1991. [Google Scholar]
- Aboelsoud, H.M.; AbdelRahman, M.A.E. Rapid Field Technique for Soil Salinity Appraisal in North Nile Delta using EM38 through Some Empirical Relations. Int. J. Plant Soil Sci. 2017, 14, 1–9. [Google Scholar] [CrossRef]
- Shalaby, A.; AbdelRahman, M.A.E.; Belal, A.A.A. GIS Based Model for Land Evaluation Mapping: A Case Study North Delta Egypt. Egypt. J. Soil Sci. 2017, 57, 339–351. [Google Scholar] [CrossRef] [Green Version]
- AbdelRahman, M.A.E.; Shalaby, A.; Aboelsoud, M.H.; Moghanm, F.S. GIS spatial model based for determining actual land degradation status in Kafr El-Sheikh Governorate, North Nile. Modeling Earth Syst. Environ. 2018, 4, 359–372. [Google Scholar] [CrossRef]
- Rao, D.L.N. Biological Amelioration of Degraded and Contaminated Soils. Biotechnological Approach in Soil Macro Organism for Sustainable Crop Production; Central Soil Salinity Research Institutes: Karnal, India, 1997; pp. 261–275.
- IPCC. Climate Change 2007: Impacts, Adaptation and Vulnerability. Contribution of Working Group II to the Fourth Assessment Report of the Intergovernmental Panel on Climate Change; Parry, M.L., Canziani, O.F., Palutikof, J.P., van der Linden, P.J., Hanson, C.E., Eds.; Cambridge University Press: Cambridge, UK, 2007; p. 976. ISBN 978 0521 88010-7. [Google Scholar]
- El-Ramady, H.; Abowaly, M.; Elbehiry, F.; Omara, A.; Elsakhawy, T.; Mohamed, S.A.; Belal, A.; Elbasiouny, H.; Abdalla, Z. Stressful Environments and Sustainable Soil Management: A Case Study of Kafr El-Sheikh, Egypt. Envir. Biod. Soil Sec. 2019, 3, 193–213. [Google Scholar] [CrossRef]
- Emam, K.; Soliman, K.M. Geospatial analysis, source identification, contamination status, ecological and health risk assessment of heavy metals in agricultural soils from Qallin city, Egypt. Stoch. Environ. Res. Risk Assess. 2021, 1–23. [Google Scholar] [CrossRef]
- Elbehiry, F.; Elbasiouny, H.; El-Ramady, H.; Brevik, E.C. Mobility, distribution, and potential risk assessment of selected trace elements in soils of the Nile Delta, Egypt. Environ. Monit. Assess. 2019, 191, 713. [Google Scholar] [CrossRef] [PubMed]
- Hendawy, E.; Belal, A.A.; Mohamed, E.S.; Elfadaly, A.; Murgante, B.; Aldosari, A.A.; Lasaponara, R. The Prediction and Assessment of the Impacts of Soil Sealing on Agricultural Land in the North Nile Delta (Egypt) Using Satellite Data and GIS Modeling. Sustainability 2019, 11, 4662. [Google Scholar] [CrossRef] [Green Version]
- Abuzaid, A.S.; Bassouny, M.A. Multivariate and Spatial Analysis of Soil Quality in Kafr El-Sheikh Governorate, Egypt. J. Soil Sci. Agric. Eng. 2018, 9, 333–339. [Google Scholar] [CrossRef]
- Elbasiouny, H. Assessment of Environmental Sensitivity to Desertification, Soil Quality and Sustainability in An Area of The North Nile Delta, Egypt. Egypt. J. Soil. Sci. 2018, 58, 399–415. [Google Scholar] [CrossRef]
- Moghanm, F.S.; Belal, A.B. Assessment and Mapping of Environmentally Sensitive Areas to Desertification Using Gis in An Area of The North Delta Region of Egypt. Egypt. J. Soil Sci. 2018, 58, 325–335. [Google Scholar]
- Bakr, N.; Afifi, A.A. Quantifying land use/land cover change and its potential impact on rice production in the Northern Nile Delta, Egypt. Remote Sens. Appl. Soc. Environ. 2019, 13, 348–360. [Google Scholar] [CrossRef]


| Landsat 7 Enhanced Thematic Mapper Plus (ETM+) for the Year 2002 | Landsat 8 Operational Land Imager (OLI) and Thermal Infrared Sensor (TIRS) for the Year 2016 | ||||
|---|---|---|---|---|---|
| Bands | Wavelength (mm) | Resolution (m) | Bands | Wavelength (mm) | Resolution (m) |
| Band 1—Blue | 0.45–0.52 | 30 | Band 1—Ultra Blue (coastal/aerosol) | 0.435–0.451 | 30 |
| Band 2—Green | 0.52–0.60 | 30 | Band 2—Blue | 0.452–0.512 | 30 |
| Band 3—Red | 0.63–0.69 | 30 | Band 3—Green | 0.533–0.590 | 30 |
| Band 4—NIR | 0.77–0.90 | 30 | Band 4—Red | 0.636–0.673 | 30 |
| Band 5—SWIR 1 | 1.55–1.75 | 30 | Band 5—NIR | 0.851–0.879 | 30 |
| Band 6—Thermal | 10.40–12.50 | 60 * (30) | Band 6—SWIR 1 | 1.566–1.651 | 30 |
| Band 7—SWIR 2 | 2.09–2.35 | 30 | Band 7—SWIR 2 | 2.107–2.294 | 30 |
| Band 8—Panchromatic | 0.52–0.90 | 15 | Band 8—Panchromatic | 0.503–0.676 | 15 |
| * ETM+ Band 6 is acquired at 60 m resolution, but products are resampled to 30 m pixels. | Band 9—Cirrus | 1.363–1.384 | 30 | ||
| Band 10—Thermal 1 | 10.60–11.19 | 100 * (30) | |||
| Band 11—Thermal 2 | 11.50–12.51 | 100 * (30) | |||
| * TIRS bands are acquired at 100 m resolution, but are resampled to 30 m in delivered data product. | |||||
| Criteria/Degradation Type | Indicator | Unit | None1 | Slight2 | Moderate3 | Severe4 |
|---|---|---|---|---|---|---|
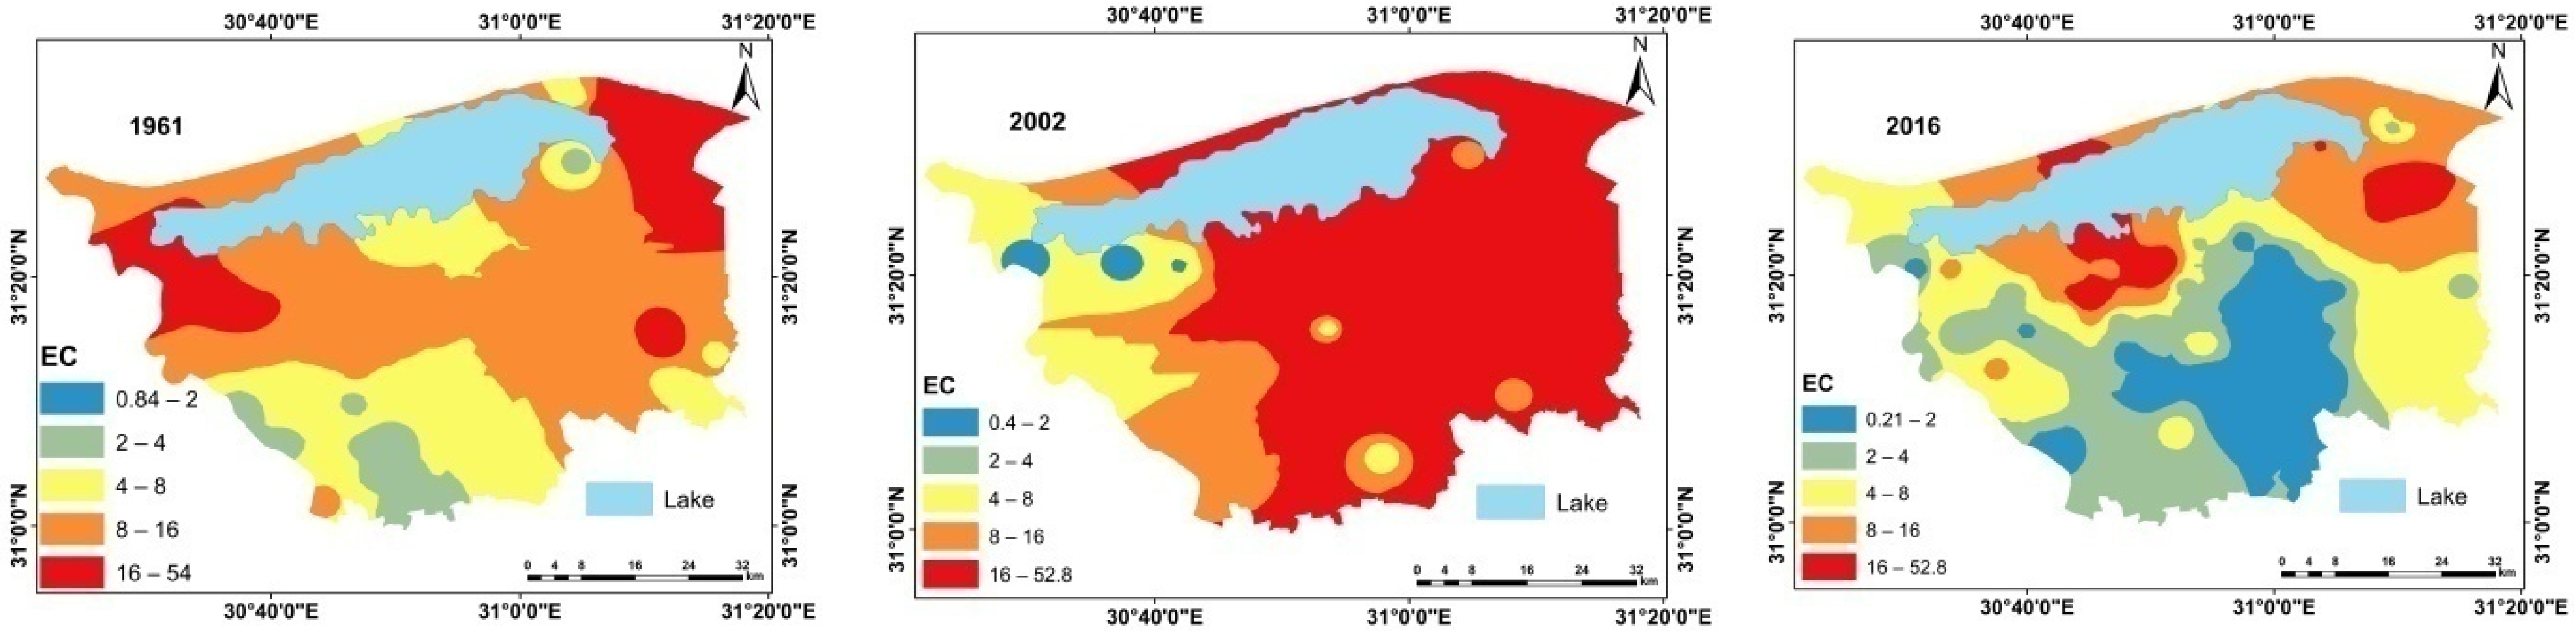
| Salinization | ECe | dS m−1 | <4 | 4–8 | 8–16 | 16–32 |
| Class | Non | Slight | Moderate | Severe | ||
| Alkalization | ESP | % | <10 | 10–15 | 15–30 | 30–50 |
| Class | Non | Slight | Moderate | Severe | ||
| Compaction | Bulk density | g m−1 | <1.2 | 1.2–1.4 | 1.4–1.6 | >1.6 |
| Class | loose | Slight | Hard | Very hard | ||
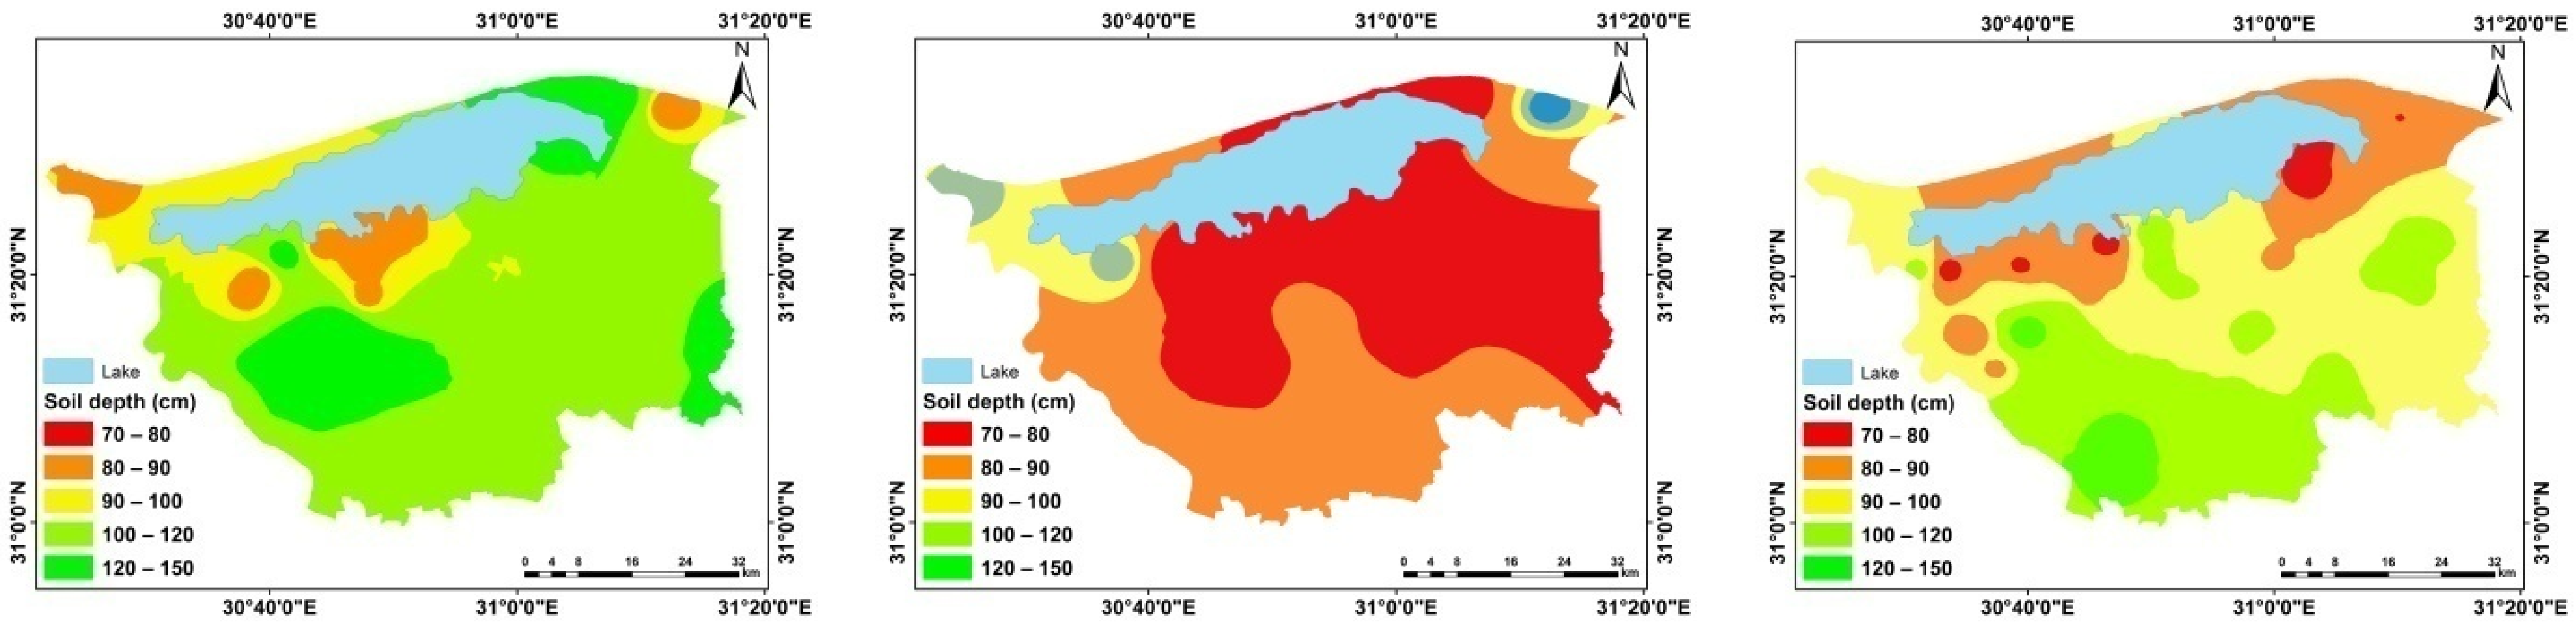
| Waterlogging | Waterlogging | cm | >150 | 150–100 | 100–50 | <50 |
| Class | Non | Slight | Moderate | Severe |
| Chemical Degradation | Salinization/Increase in EC dS m−1 y−1 | Alkalinization/Increase in ESP % y−1 |
| Non to slight | <0.5 | <0.5 |
| Moderate | 0.5–3 | 0.5–3 |
| High | 3–5 | 3–7 |
| Very high | >5 | >7 |
| Physical Degradation | Compaction (Increase in Bulk Density g cm−3y−1) | Waterlogging (Increase in Water Table per cm y−1) |
| Non to slight | <0.1 | <1 |
| Moderate | 0.1–0.2 | 1–3 |
| High | 0.2–0.3 | 3–5 |
| Very high | >0.3 | >5 |
| LULC Classes | 2002 (%) | 2016 (%) |
|---|---|---|
| Agricultural Land/Natural Vegetation | 72 | 68 |
| Dunes/Sabkha/Sand Sheet | 9 | 6 |
| Fish Farm | 6 | 10 |
| Burullus Lake | 8 | 6 |
| Urban | 5 | 10 |
| Characteristics | Soils of Flood Plain | Soils of Lacustrine Deposited | Soils of Coastal Plain |
|---|---|---|---|
| Texture | Clay for all profiles | Sandy clay loam and loamy sand | Sandy soils |
| Depth & Drainage | Moderately deep to deep soils | Moderately deep to deep soils & poor and moderately to well-drained | Very deep |
| Structure | Moderate-to-strong structure evolution and blocky to massive and columnar. The consistence is slightly hard when dry, slightly sticky and slightly plastic. | Moderate-to-strong structure evolution and blocky to massive and columnar. The consistence is slightly hard when dry, slightly sticky and slightly plastic. | Single grain. The consistence is hard when dry, non-sticky and non-plastic. |
| Horizon boundary | Diffuse smooth boundary | Diffuse smooth boundary | Clear and diffuse smooth boundary |
| Bulk density | 1.30 and 1.47 g cm−3, increases with depth | ||
| CaCO3 content | 1.04 to 5.38% | 0.46 to 3.97% | 0.21 to 1.24% |
| pH | 8.00 to 8.60 | 7.80 to 8.50 | 7.1 to 8.8 |
| ECe | 0.99–7.90 dS m−1 | 1.58–79.0 dS m−1 | 1.38–3.36 dS m−1 |
| Dominated cation | Dominated by Na+ cation followed by Ca2+ or Mg2+ cations alternately, while K+ cation is the least soluble component. | Dominated by Na+ cation followed by Ca2+ and Mg2+ cations, while K+ cation is the least soluble component. | Dominated by Na+, Mg2+, Ca2+, while K+ cation is the least soluble component. |
| Dominated Anion | Dominated by Cl− ion or SO42− ion alternately followed by HCO3−. Thus, sodium chloride or sodium sulfate seems to be dominating in these soils. | Cl− ion followed by SO42− ion and HCO3− | Cl− ion followed by SO42− and by HCO3− |
| Organic matter content | 0.34 to 2.78% | 0.33 to 3.03% | 0.52 to 2.19% |
| Cation Exchange Capacity | 33.12 to 46.92 meq/100 g of soil | 33.12 to 46.92 meq/100 g of soil | 6.9 to 18.36 meq/100 g of soil |
| ESP | 3.41 to 14.86% | 6.01 to 43.85% | 5.09% and 12.69% |
| Type (Sub Group) | Area (km2) | % |
|---|---|---|
| AquallicSalorthids | 810.24 | 26.24 |
| TypicHaplosalids | 244.40 | 7.91 |
| TypicQuartzipsamments | 94.07 | 3.05 |
| TypicSalorthids | 0.06 | 0.00 |
| TypicTorrifluvents | 40.44 | 1.31 |
| TypicTorripsamments | 0.13 | 0.00 |
| VerticTorrifluvents | 1812.96 | 58.71 |
| Sand dunes | 85.67 | 2.77 |
| Total | 3087.97 | 100.00 |
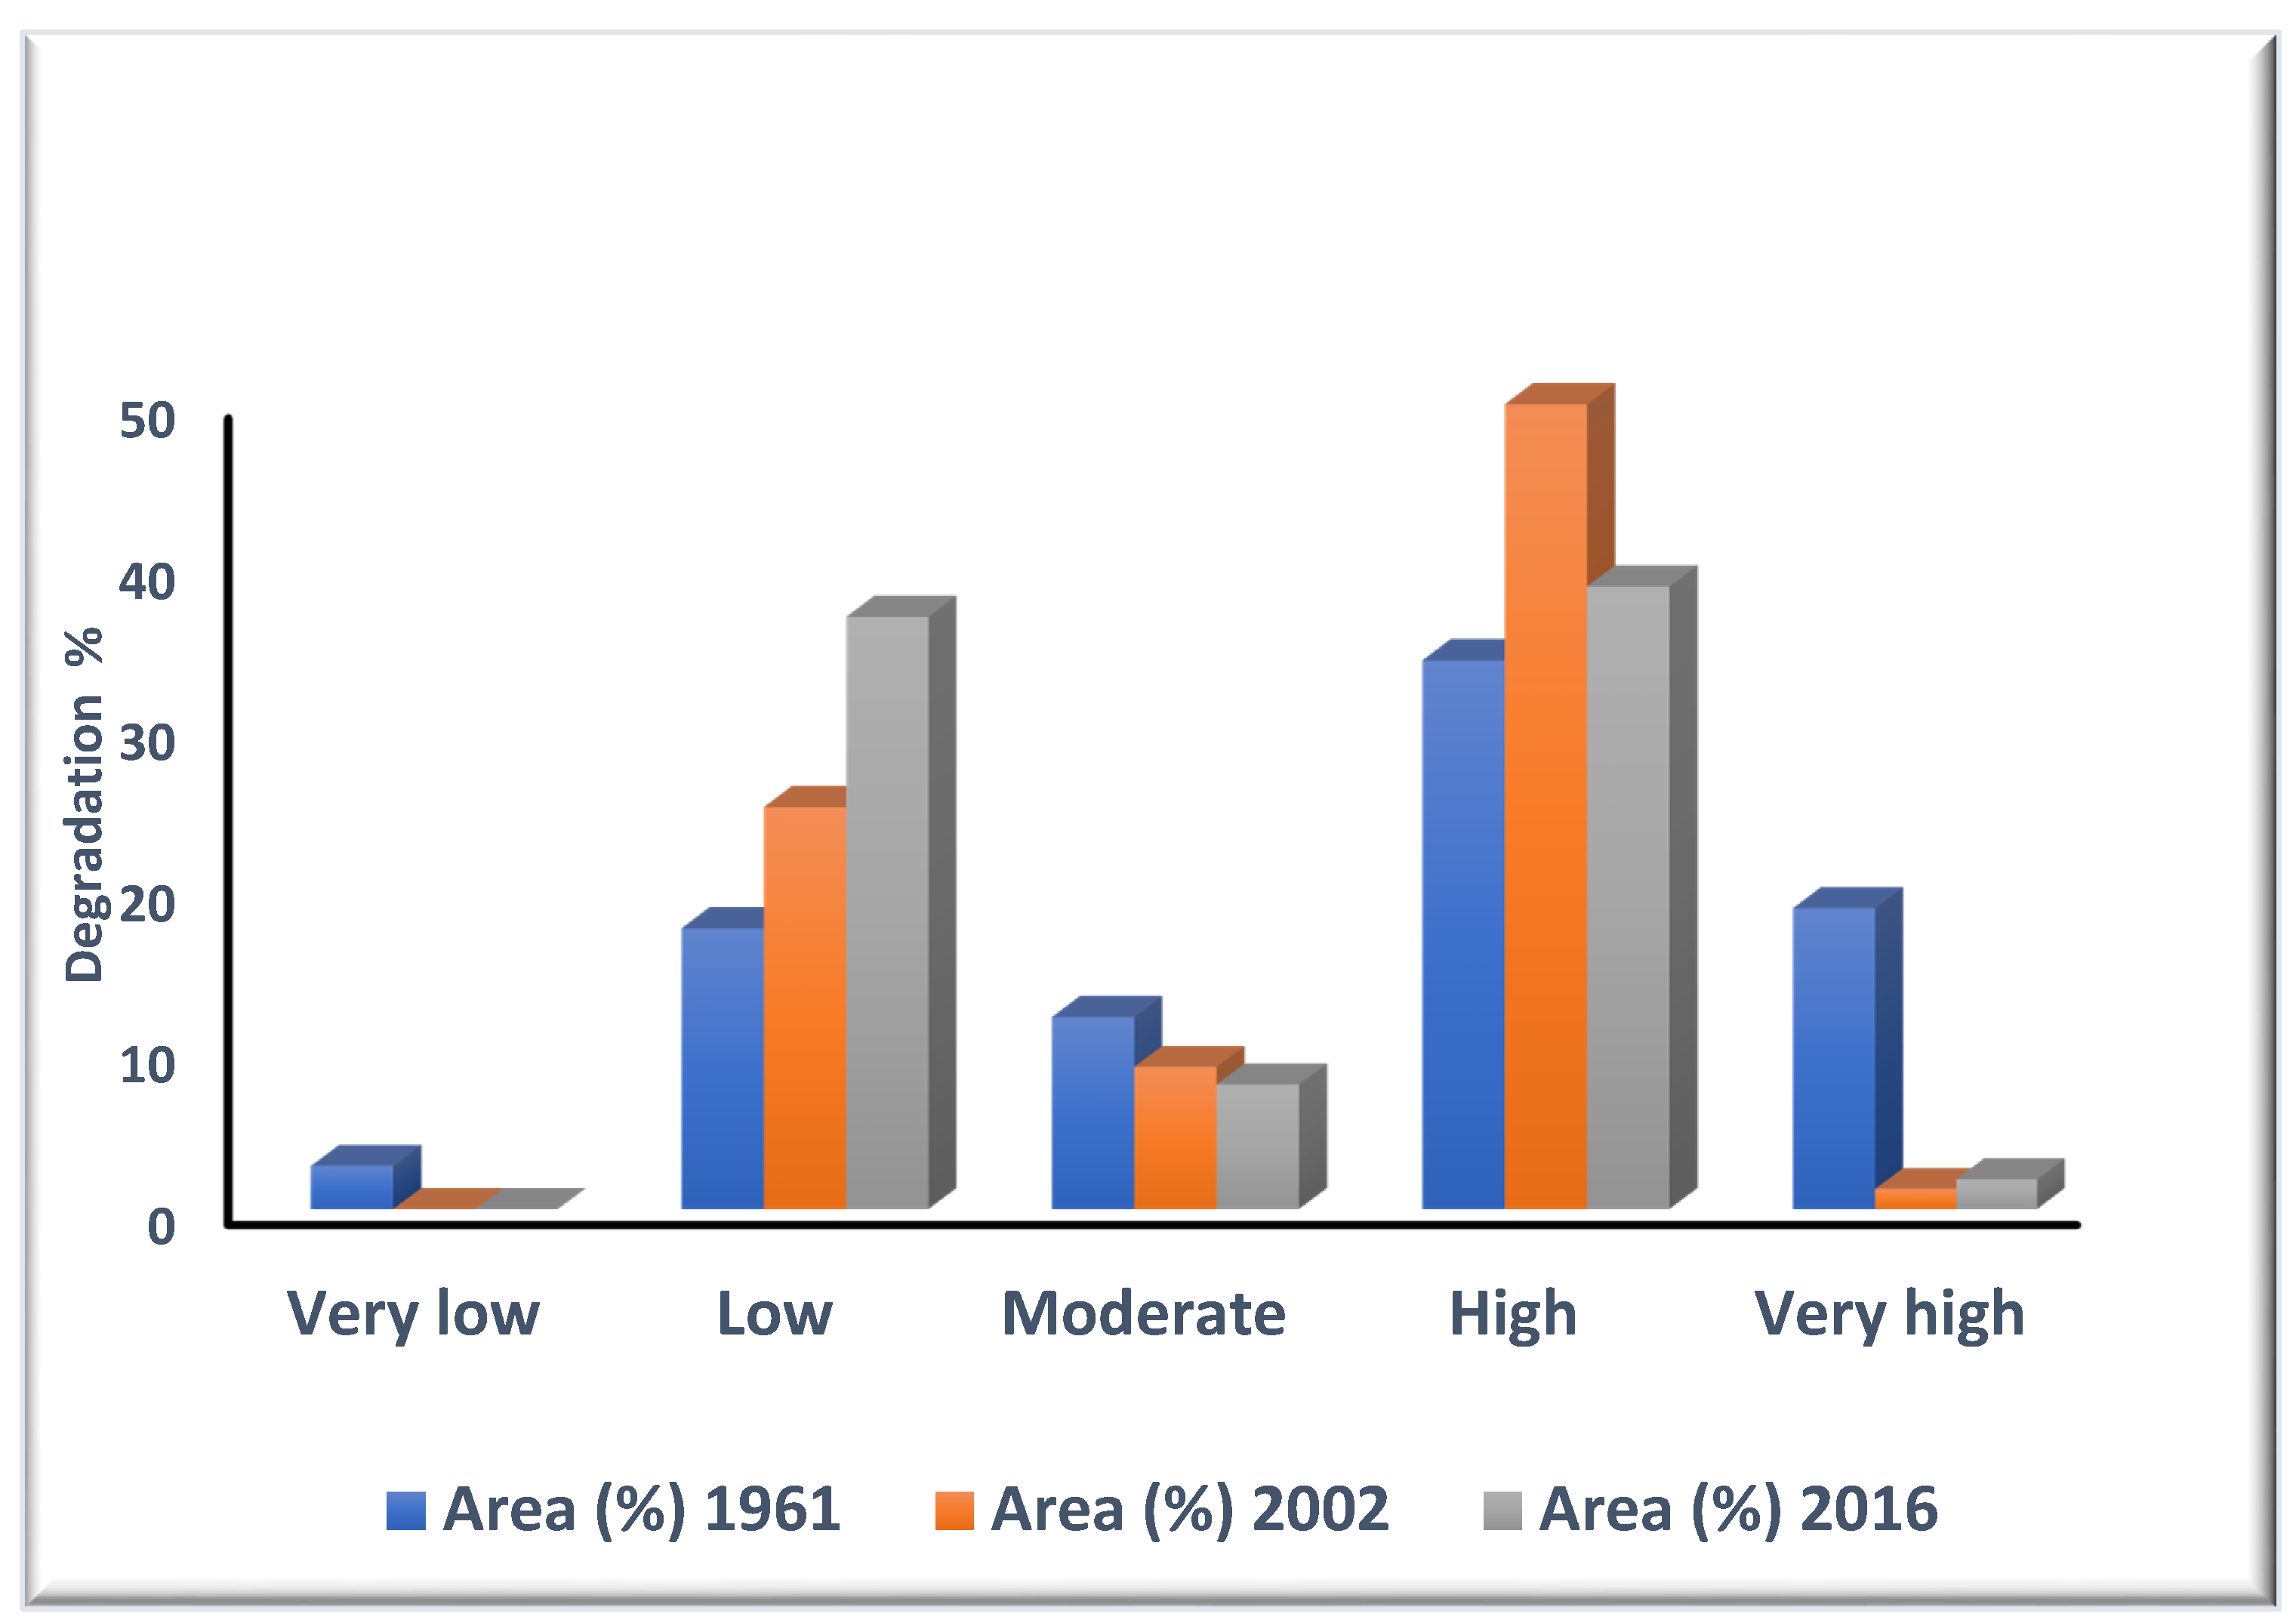
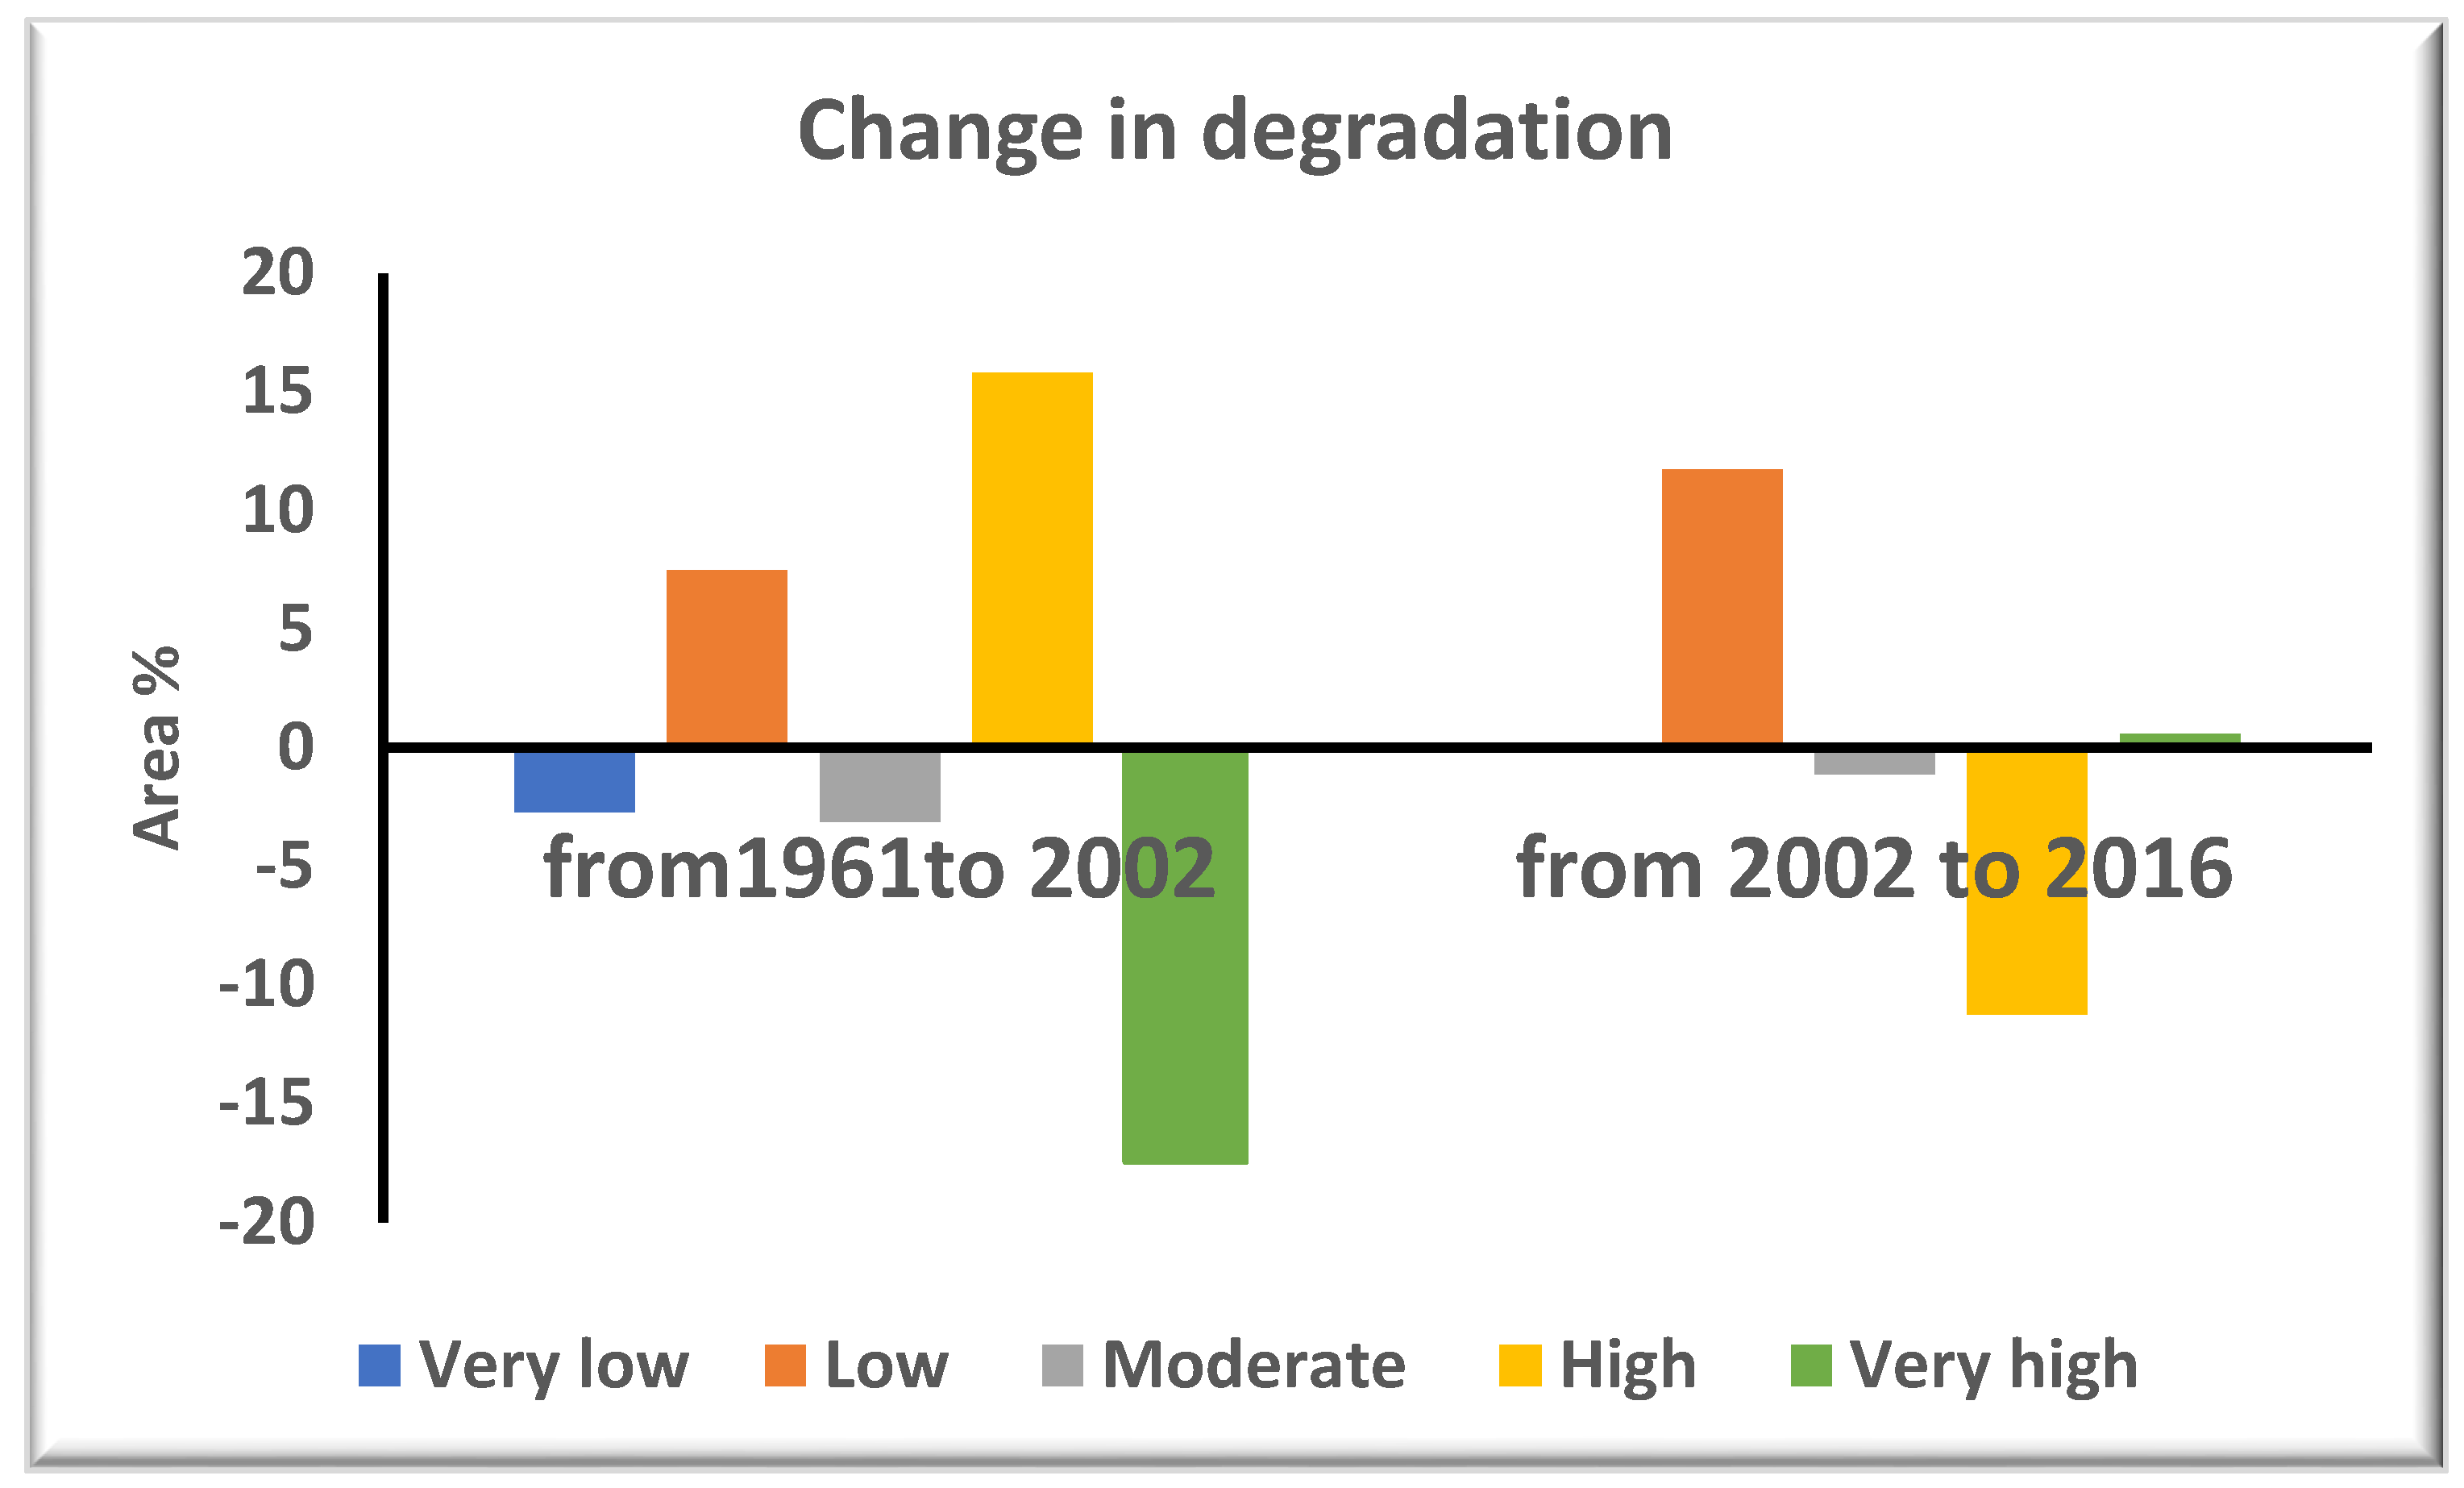
| Element | Area (%) 1961 | Area (%) 2002 | Area (%) 2016 |
|---|---|---|---|
| Very lowly degraded soil | 2.70 | 0.00 | 0.00 |
| Lowly degraded soil | 17.50 | 24.99 | 36.74 |
| Moderately degraded soil | 12.02 | 8.90 | 7.80 |
| Highly degraded soil | 34.06 | 49.88 | 38.62 |
| Very highly degraded soil | 18.74 | 1.26 | 1.86 |
Publisher’s Note: MDPI stays neutral with regard to jurisdictional claims in published maps and institutional affiliations. |
© 2021 by the authors. Licensee MDPI, Basel, Switzerland. This article is an open access article distributed under the terms and conditions of the Creative Commons Attribution (CC BY) license (https://creativecommons.org/licenses/by/4.0/).
Share and Cite
AbdelRahman, M.A.E.; Afifi, A.A.; Scopa, A. A Time Series Investigation to Assess Climate Change and Anthropogenic Impacts on Quantitative Land Degradation in the North Delta, Egypt. ISPRS Int. J. Geo-Inf. 2022, 11, 30. https://0-doi-org.brum.beds.ac.uk/10.3390/ijgi11010030
AbdelRahman MAE, Afifi AA, Scopa A. A Time Series Investigation to Assess Climate Change and Anthropogenic Impacts on Quantitative Land Degradation in the North Delta, Egypt. ISPRS International Journal of Geo-Information. 2022; 11(1):30. https://0-doi-org.brum.beds.ac.uk/10.3390/ijgi11010030
Chicago/Turabian StyleAbdelRahman, Mohamed A. E., Ahmed A. Afifi, and Antonio Scopa. 2022. "A Time Series Investigation to Assess Climate Change and Anthropogenic Impacts on Quantitative Land Degradation in the North Delta, Egypt" ISPRS International Journal of Geo-Information 11, no. 1: 30. https://0-doi-org.brum.beds.ac.uk/10.3390/ijgi11010030