Article

Geomedia Attributes for Perspective Visualization of Relief for Historical Non-Cartometric Water-Colored Topographic Maps

by
Beata Medyńska-Gulij
Department of Cartography and Geomatics, Adam Mickiewicz University Poznan, 61-680 Poznan, Poland
ISPRS Int. J. Geo-Inf. 2022, 11(11), 554; https://0-doi-org.brum.beds.ac.uk/10.3390/ijgi11110554
Submission received: 14 September 2022 / Revised: 25 October 2022 / Accepted: 5 November 2022 / Published: 8 November 2022
(This article belongs to the Special Issue Cartography and Geomedia)

Abstract

:
The selection of appropriative geomedia attributes for constructing natural and suggestive perspective visualizations of historical non-cartometric manuscript topographic works is investigated, to enable an intuitive perception of relief landforms. The main objective of the study is to demonstrate geomedia parameters for representing the third dimension in topographic watercolor maps from the eighteenth century, using cartographic rules and geoinformation operations for transforming graphic means of expression. The following methods were used: the choice of representative map fragments with specific painterly means of expression; the analysis of main relief forms on historical and modern maps; the rectification; vectorization of contour lines, and the transformation to a GRID model; the use of parameter variations: elevation rise, azimuth and altitude, contrast of illumination; and the creation of the final bird’s-eye-view visualization, with appropriate parameters. It is found that the parameters for the visualization of the non-cartometric water-colored topographic image on a 3D model can be selected in turn. However, what matters is maintaining their complementarity. The proposed parameters for the three maps work well for creating the general static bird’s-eye-view visualization, with the natural and suggestive perception of the landscapes’ relief.

1. Introduction

By definition, a map has no perspective, because the observer is located above all parts of the graphic image at the same time [1]. However, for centuries, techniques of adapting perspective–related parameters for cartographic representations of the terrain are associated with the use of geometrical principles and painting techniques [2]. Contour lines have represented relief on topographic maps since the early nineteenth century, i.e., since the first rigorous national triangulation and levelling surveys based on an agreed datum, typically sea level [3]. The arranging of contour lines shows mainly the measurable height of features, whereas supplementary shading helps one notice the plasticity of landform relief [4]. The representation of the third dimension in the context of the topographic content on the map has been an object of research on measurability, imageability, and the esthetics of cartographic images for a long time [5].
At the beginning of professional topography in the eighteenth century, monarchs would order their military engineers to work out multi-sheet topographic works for military and/or administrative purposes [6]. The field survey of that time included reconnaissance by eye, acute observation, and correct distance evaluation and sketching, both in rough sketchbooks and using the plane table [7]. Such secret maps were usually created for the ruler as manuscript works that used water-based media and, as such, few copies were made [8]. At that time, no other technique offered map makers the opportunity to reflect landscape so realistically. This artistic painterly manner, which employed sophisticated graphical means of expression, with harmonious colors and imitation of natural features, is highly predisposed to transformations from the 2D cartographic image to the 3D perspective visualization [6].
The significance of historical topographic maps as a unique window into the state of topography in the eighteenth century is proven by dedicated geoportals and multimedia websites [9,10]. Sheets are subject to georeferencing to current spatial systems, in which the transparency function allows one to manipulate the view of several overlapping maps from different historical periods [11,12]. Unfortunately, such geometric georeferencing to calibration points distorts the graphics of a historical map and, as a consequence, causes the deformation of the means of graphical expression created in such artistic water-based media.
Most eighteenth-century topographic maps are non-cartometric, because they betray highly irregular distortion within single sheets [6]. A non-cartometric map means that the values of angles and distances measured on that map are approximate values to the real azimuths and real distances derived from the map scale. This is why in catalogs and cartobibliographies, the scale figures relating to the eighteenth-century topographic maps are often preceded by the word ‘ca’ (circa).
Therefore, the issue of the appropriate transformation of such artistic graphics from maps to the third dimension in relation to creating perspective images for areas of the landscape, will be discussed in this study. Such panoramas, with highly individualized images of mountains and valleys, have been created by manipulating parameters and painting and drawing effects [13,14].
On the other hand, to be able to use historical maps more widely, it is important to prepare digital terrain TINs (triangulated irregular networks) and GRID models that make it possible to select measurable and visual parameters in 3D in cartographic-geoinformation applications [15,16]. The creation of realistic visualizations from such models to help explain landscape processes [17], or create a real-time interactive visualization [18], has become the focus for research. The freedom to render topographic images on screen allows more than appropriately shaded slopes [19].
The minimization of the interference of the original graphic elements on the historical map, and allowing one to interpret relationships between relief and topographic objects correctly, remains a great challenge [20]. Hence, the focus of this study is related to a complementary selection of geomedia attributes for constructing the most beneficial 3D visualization from manuscript topographic maps for the simple intuitive perception of relief landforms and a good interpretation of their mutual relations, while maintaining a high level of esthetics.

2. Aims and Questions

The main objective of the study was to demonstrate geomedia parameters for representing the third dimension on non-cartometric topographic water-colored maps, using cartographic rules and geoinformation operations for transforming the graphic means of expression. To meet this objective, the following questions were raised:
Which cartographic rules are advantageous, and which of them limit the opportunity to create 3D views from topographic maps in the painterly watercolor style?
Which measurable parameters can be applied to extract visual suggestiveness of relief and landforms via a graphic means of expression in water-color?
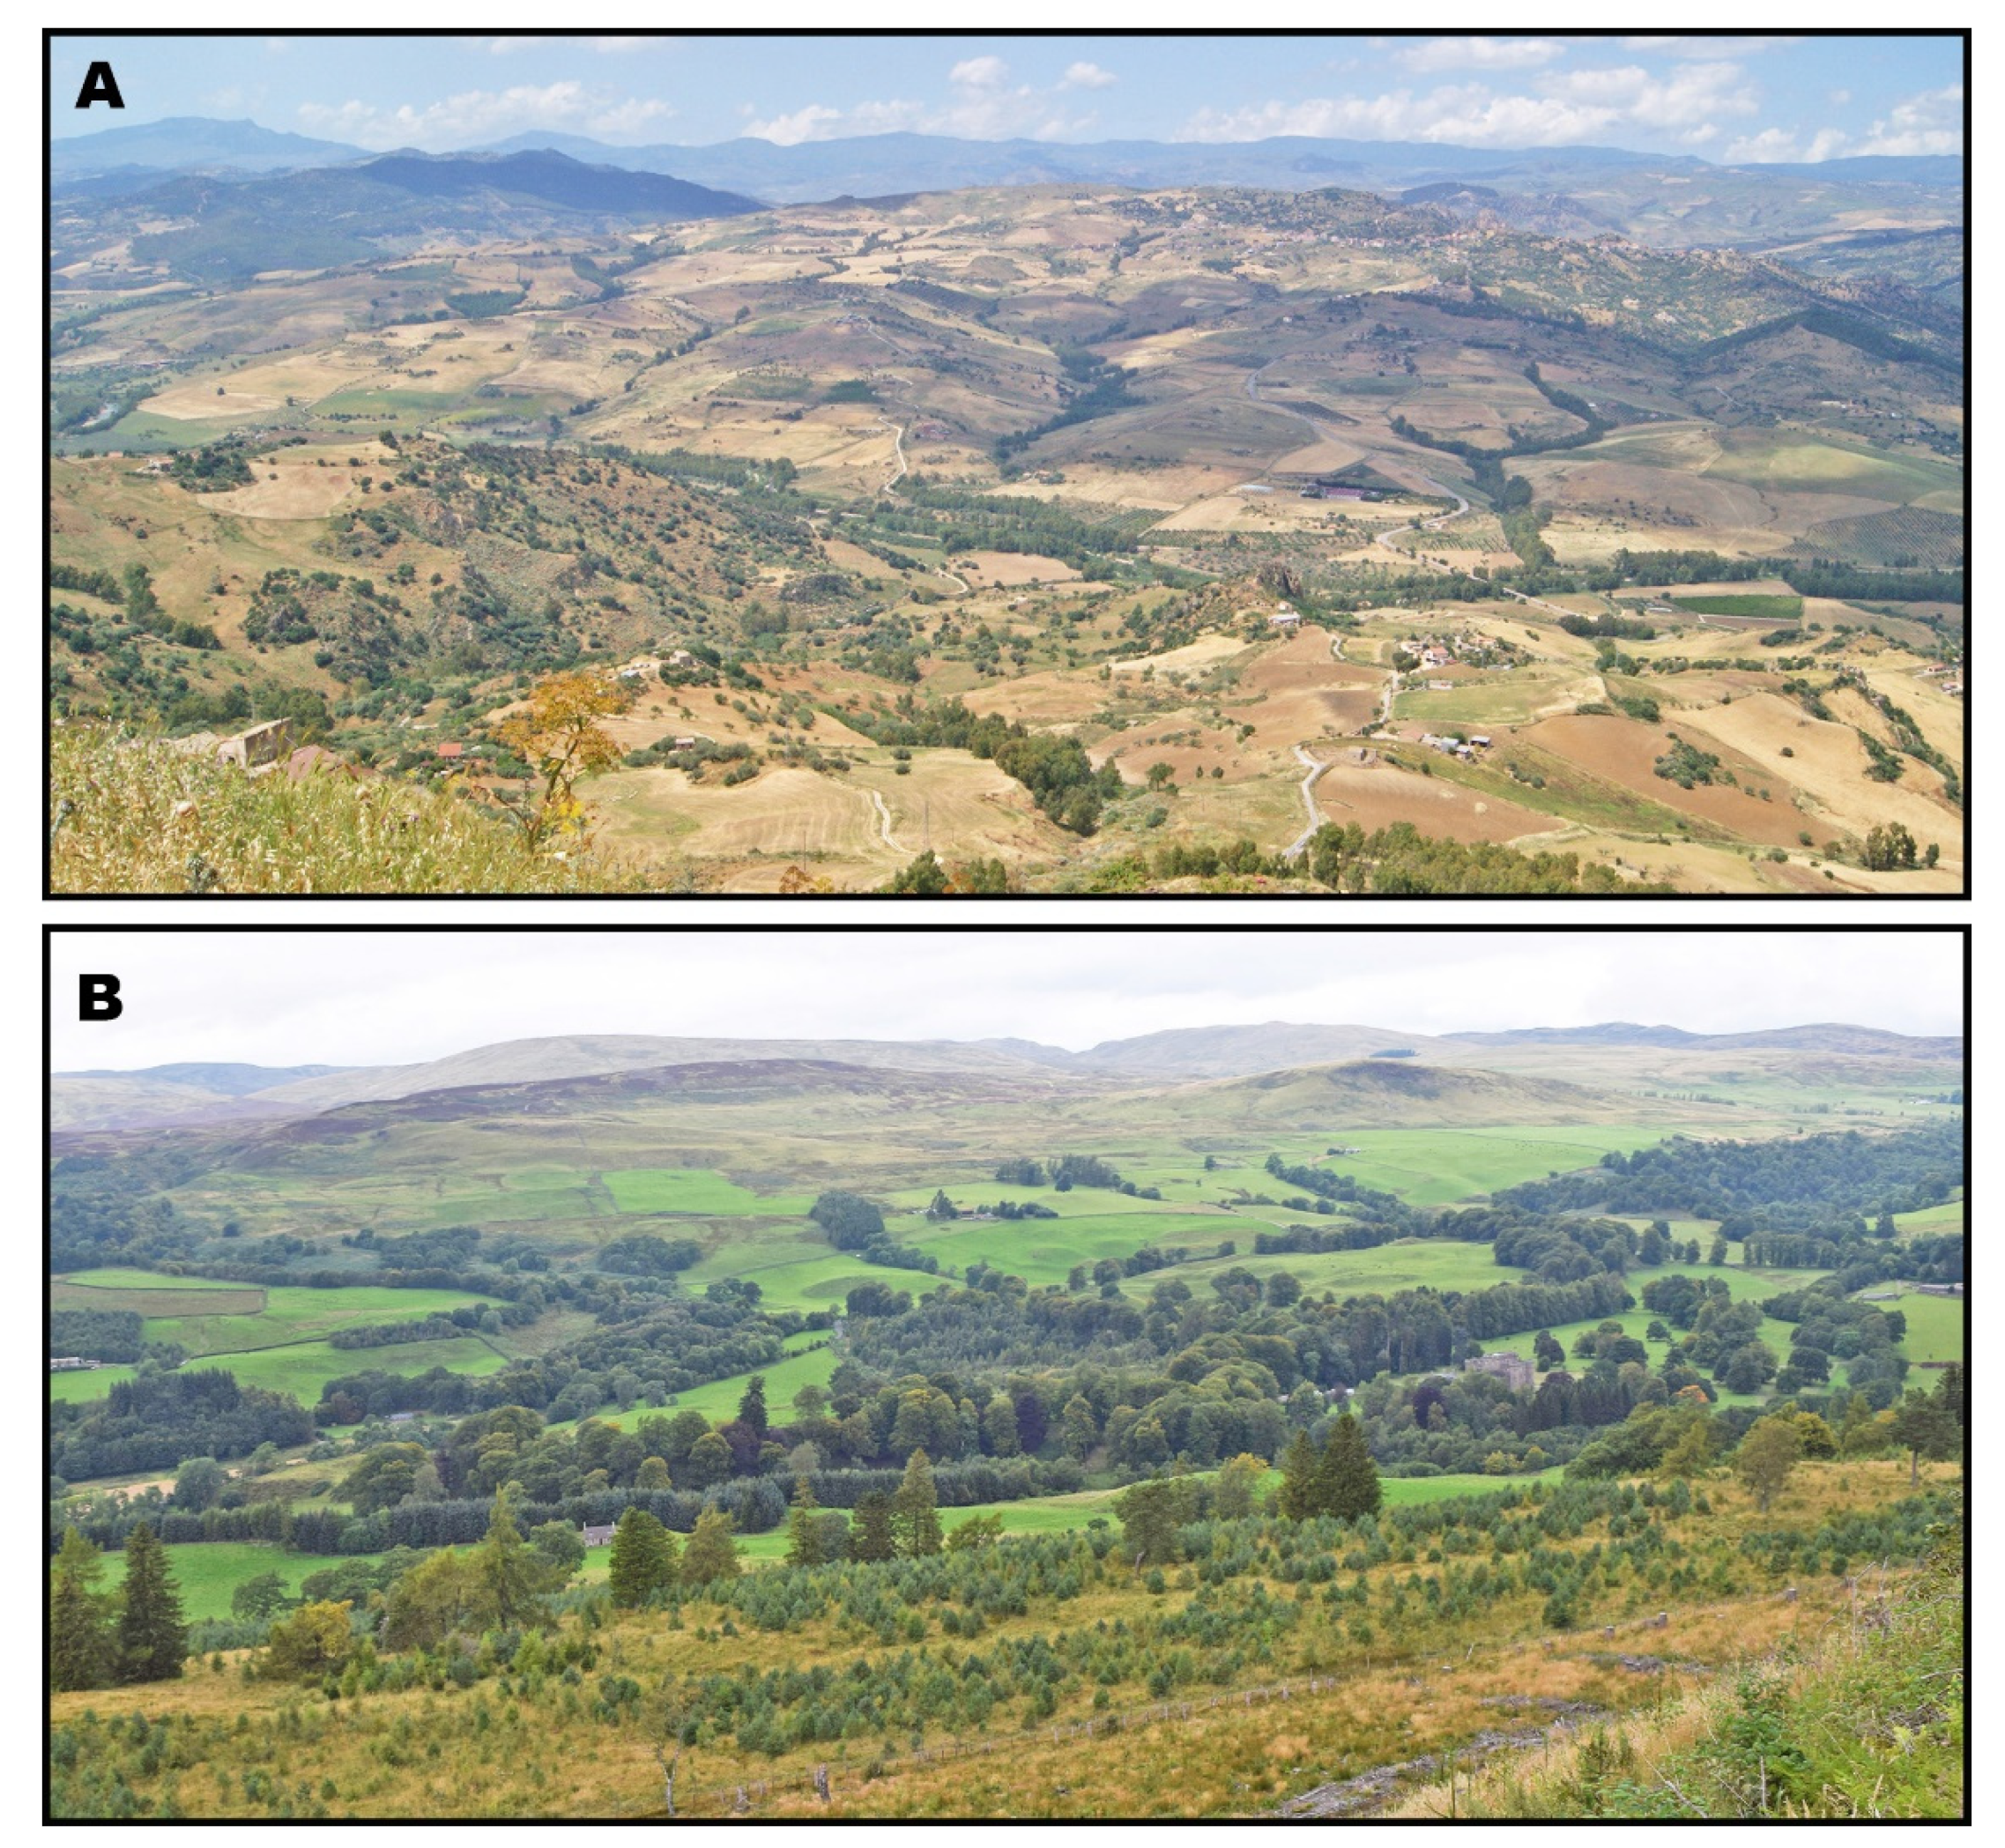
How can one achieve naturalness in terms of color adequacy of a specific existing landscape?
What are the separate and complementarity issues of using measurable parameters and the manual modelling of bird-eye perspective in the construction of a 3D visualization?

3. Materials and Methods

The fundamental methods of research were: the visual analysis of cartographic content; the classification and selection of cartographic material; the comparison of the representations of relief forms on historical and modern topographic maps; the selection of parameters in geoinformation software; the employment of cartographic design rules; the adaptation of the graphical means of expression in water-based media to promote the suggestiveness of relief-form representation.
To meet the objective and answer the questions raised, the stages of research were:
Formulation of the concept of the research process (Section 3.1);
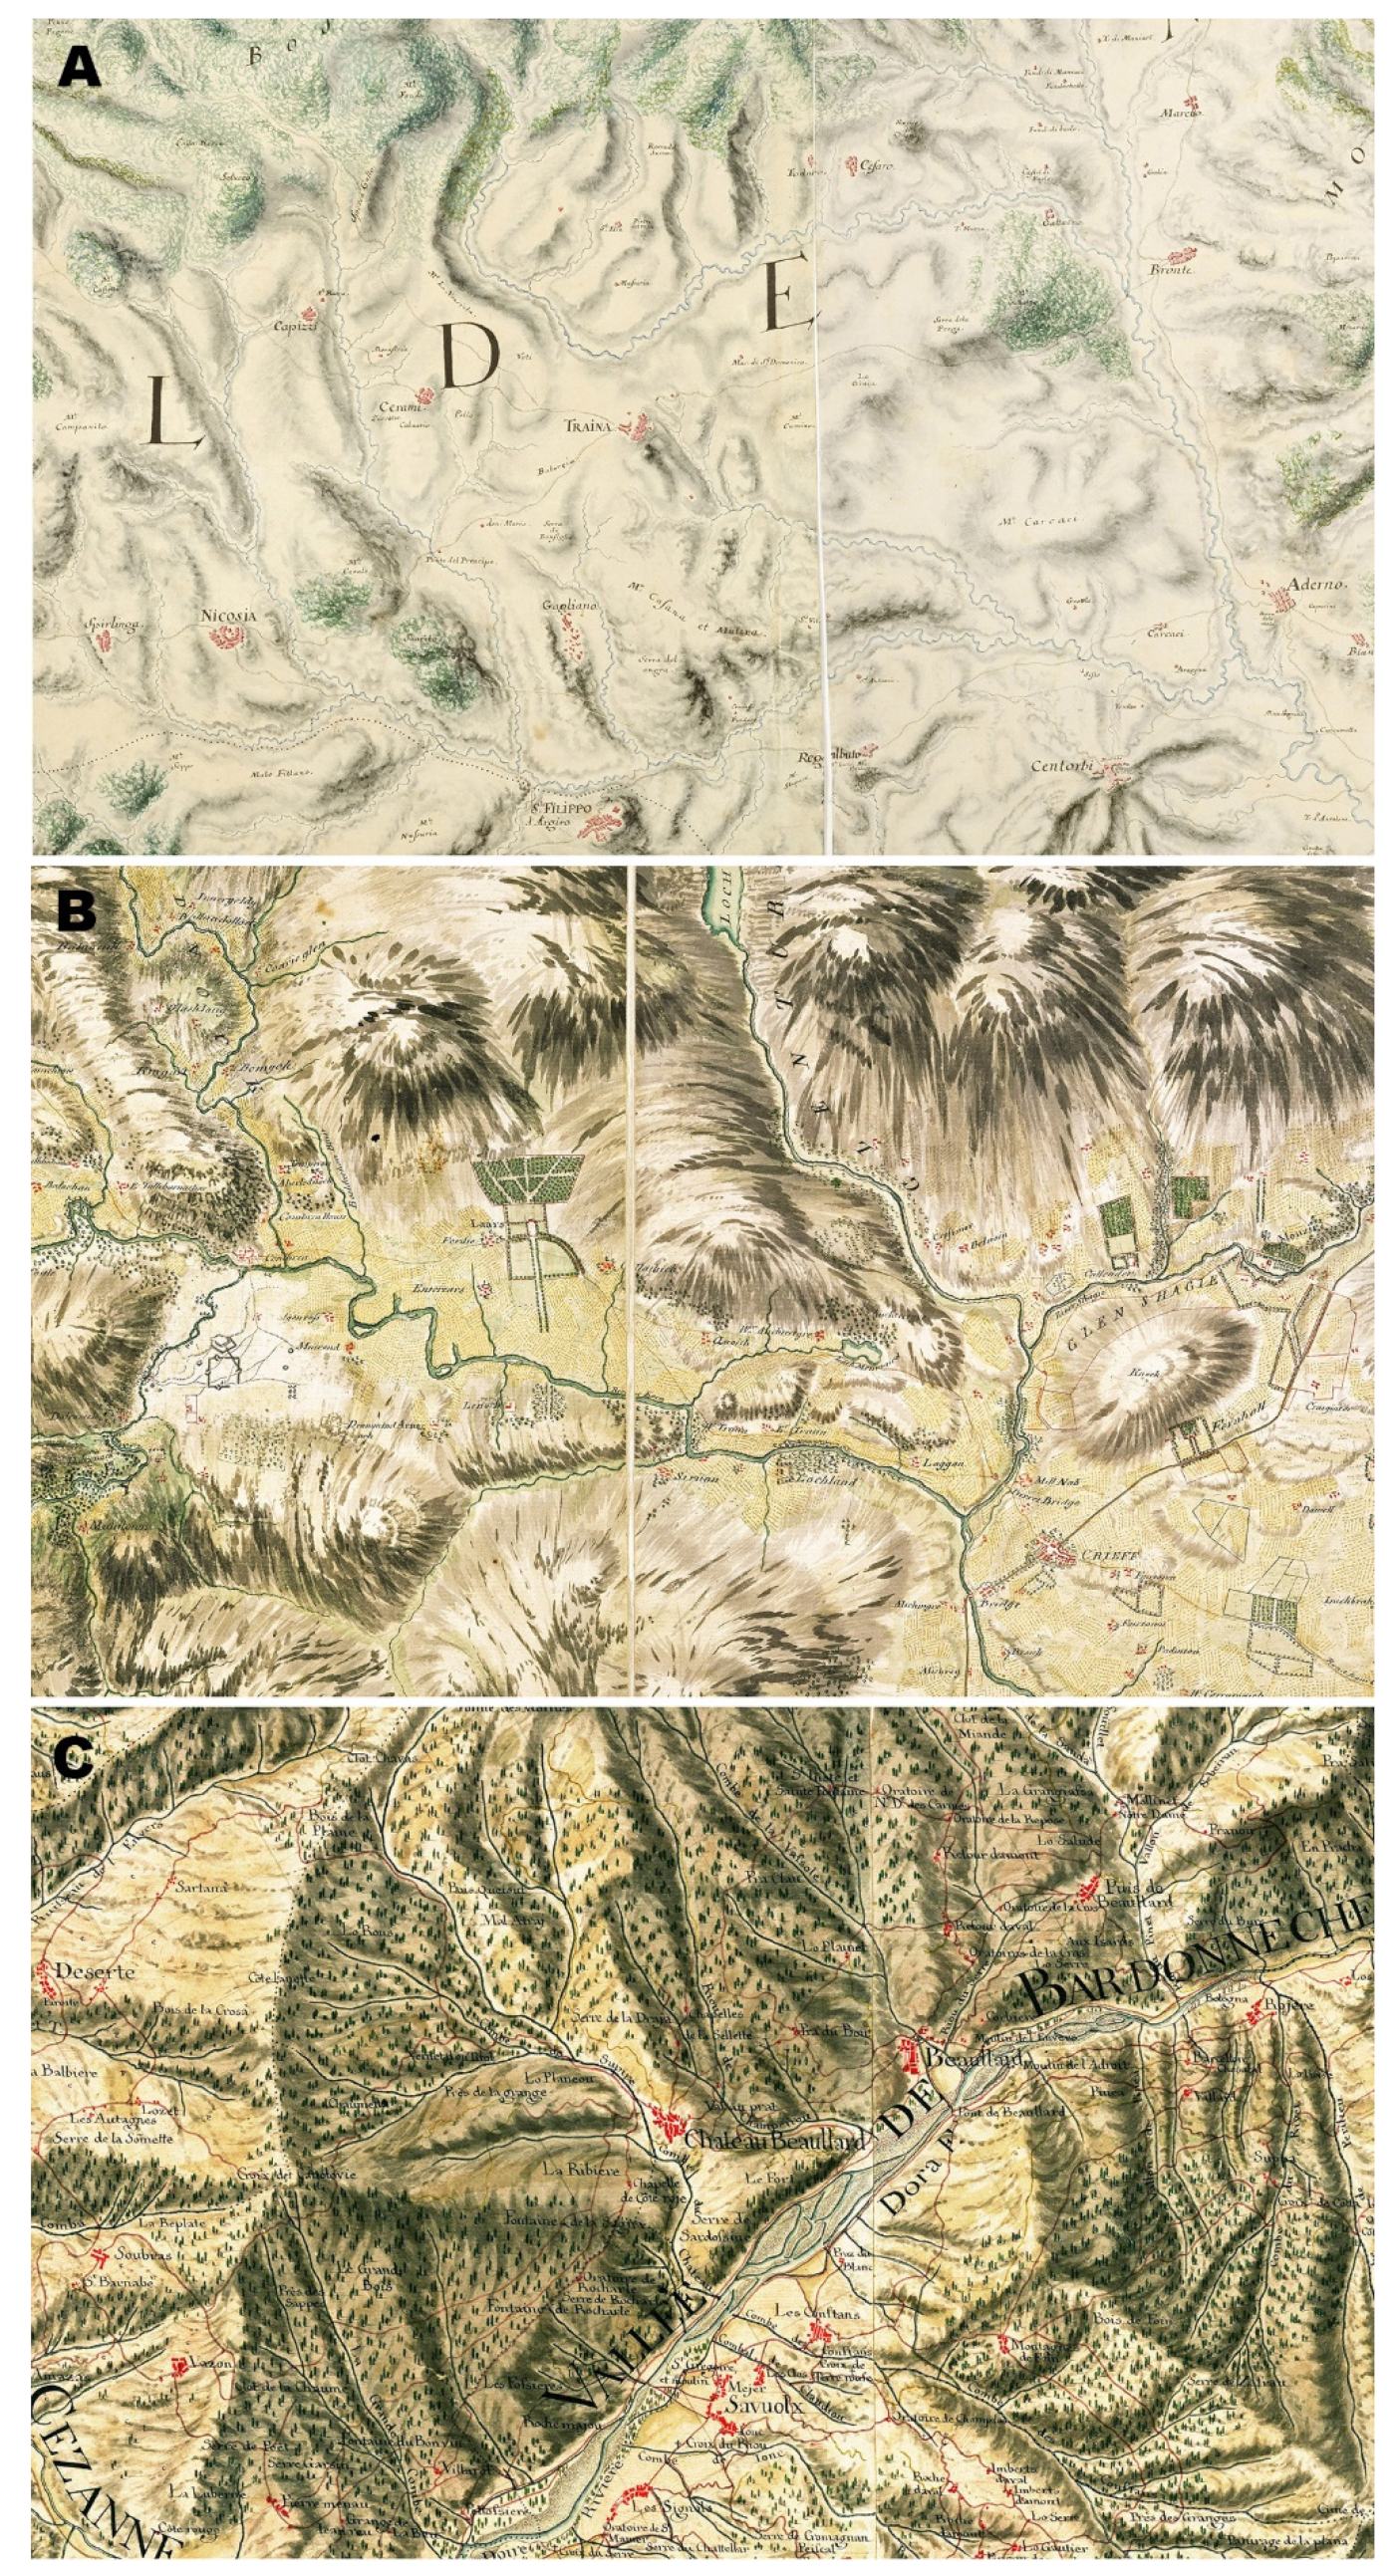
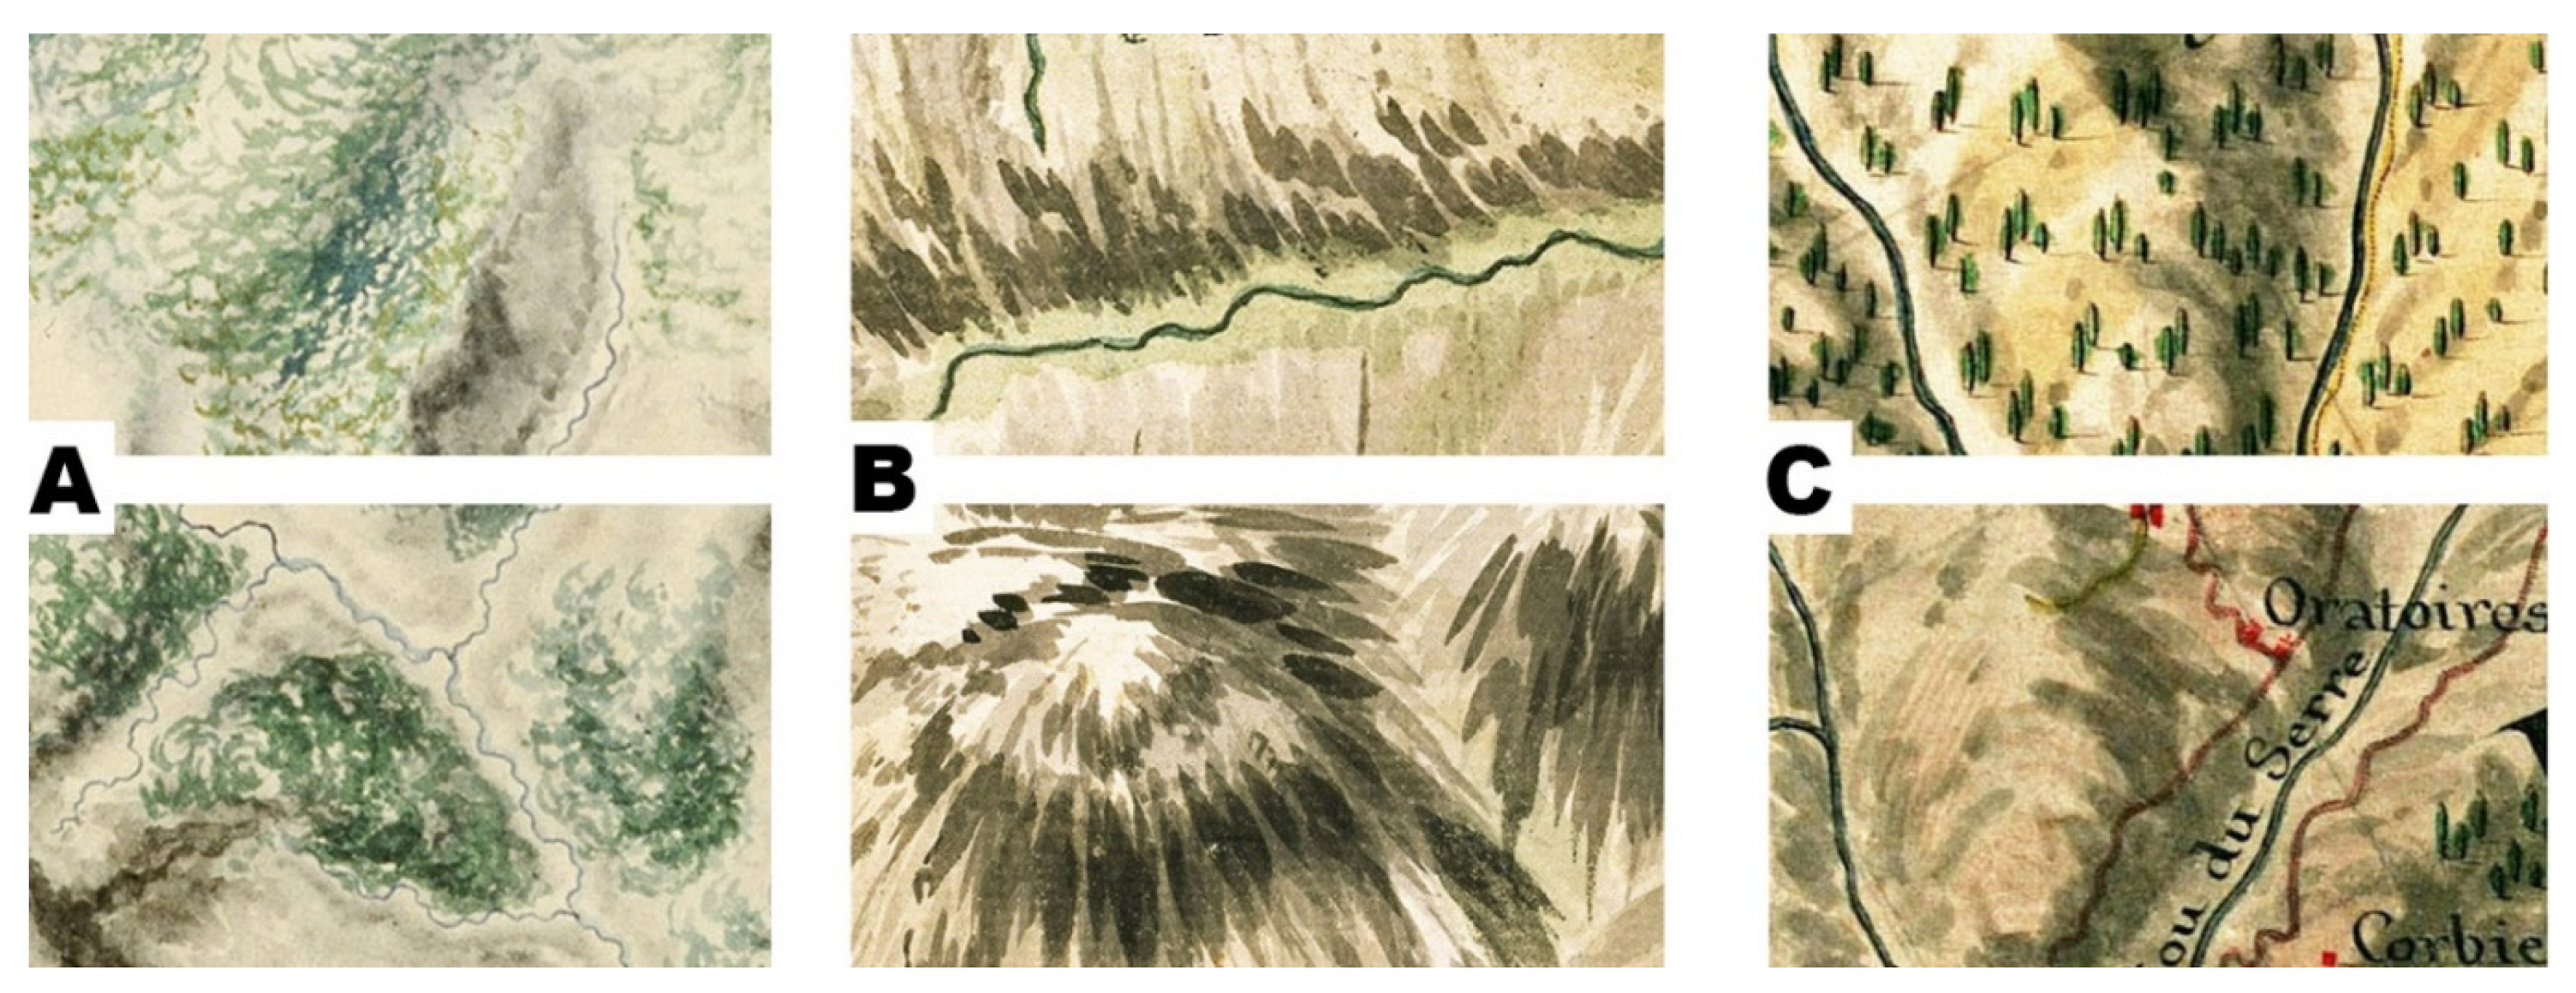
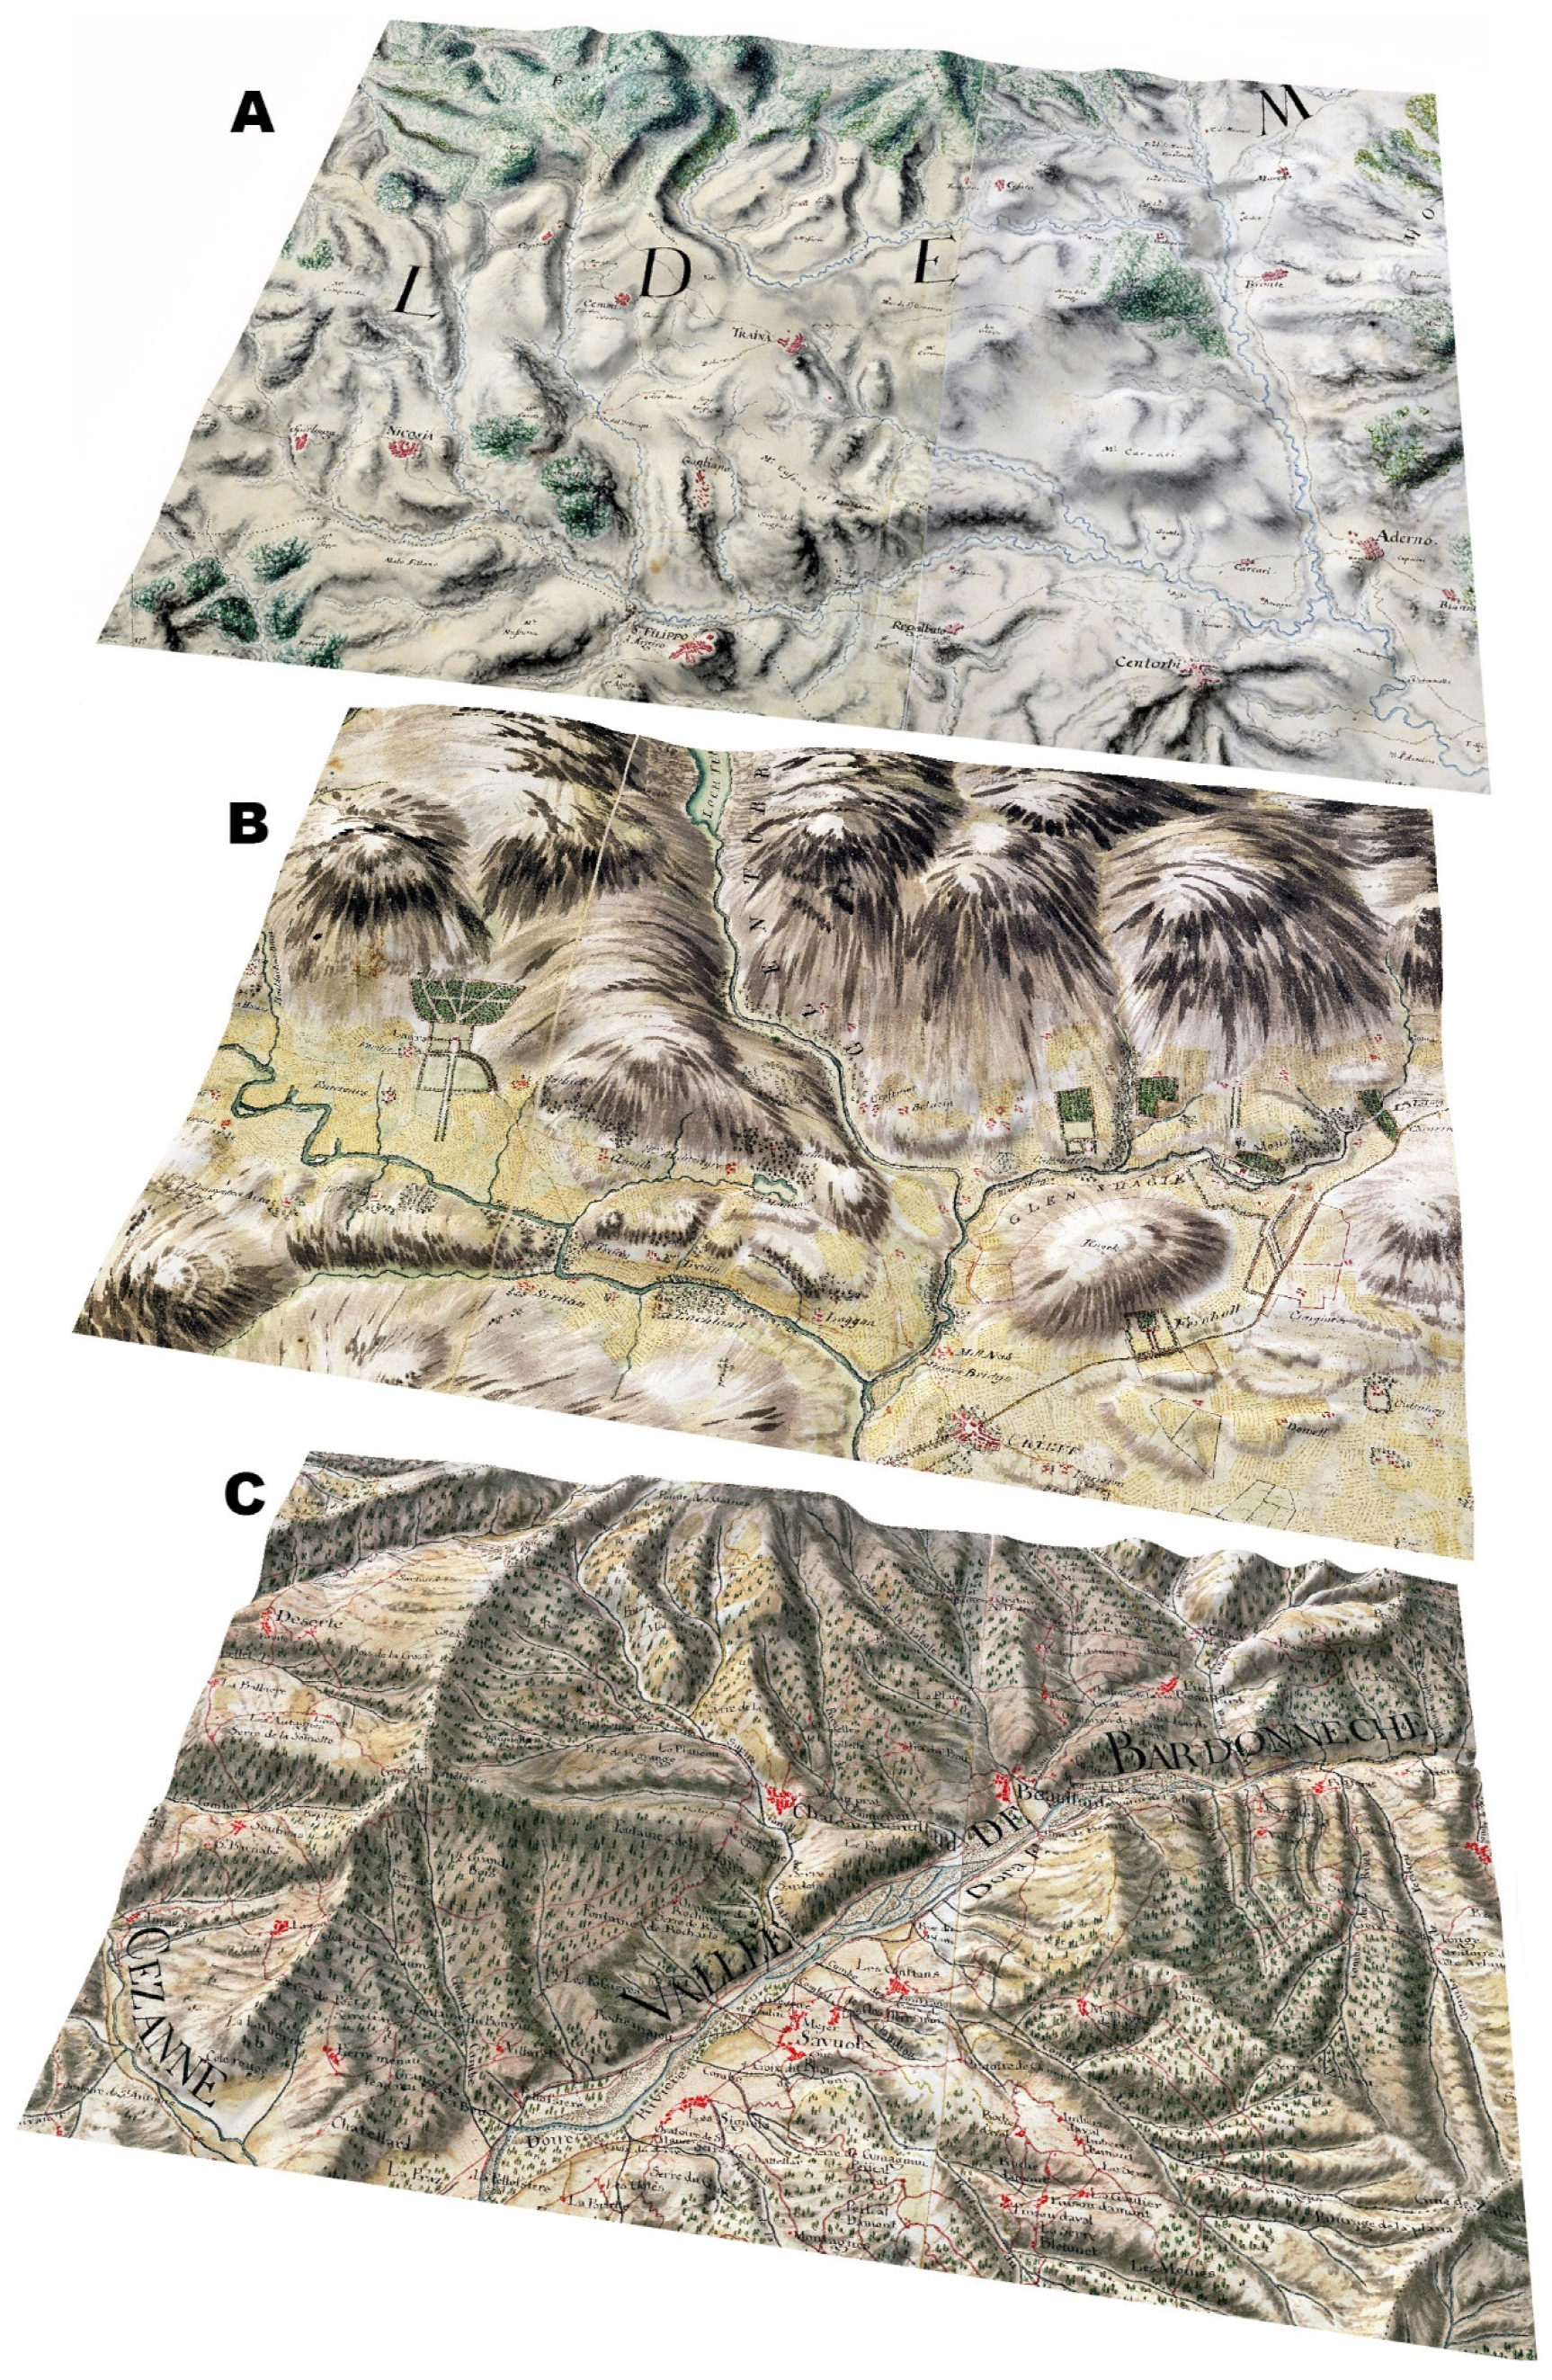
The choice of representative non-cartometric sheets/map fragments that demonstrate specific painterly means of expression: cartographic materials (Section 3.2, Figure 1 and Figure 2);
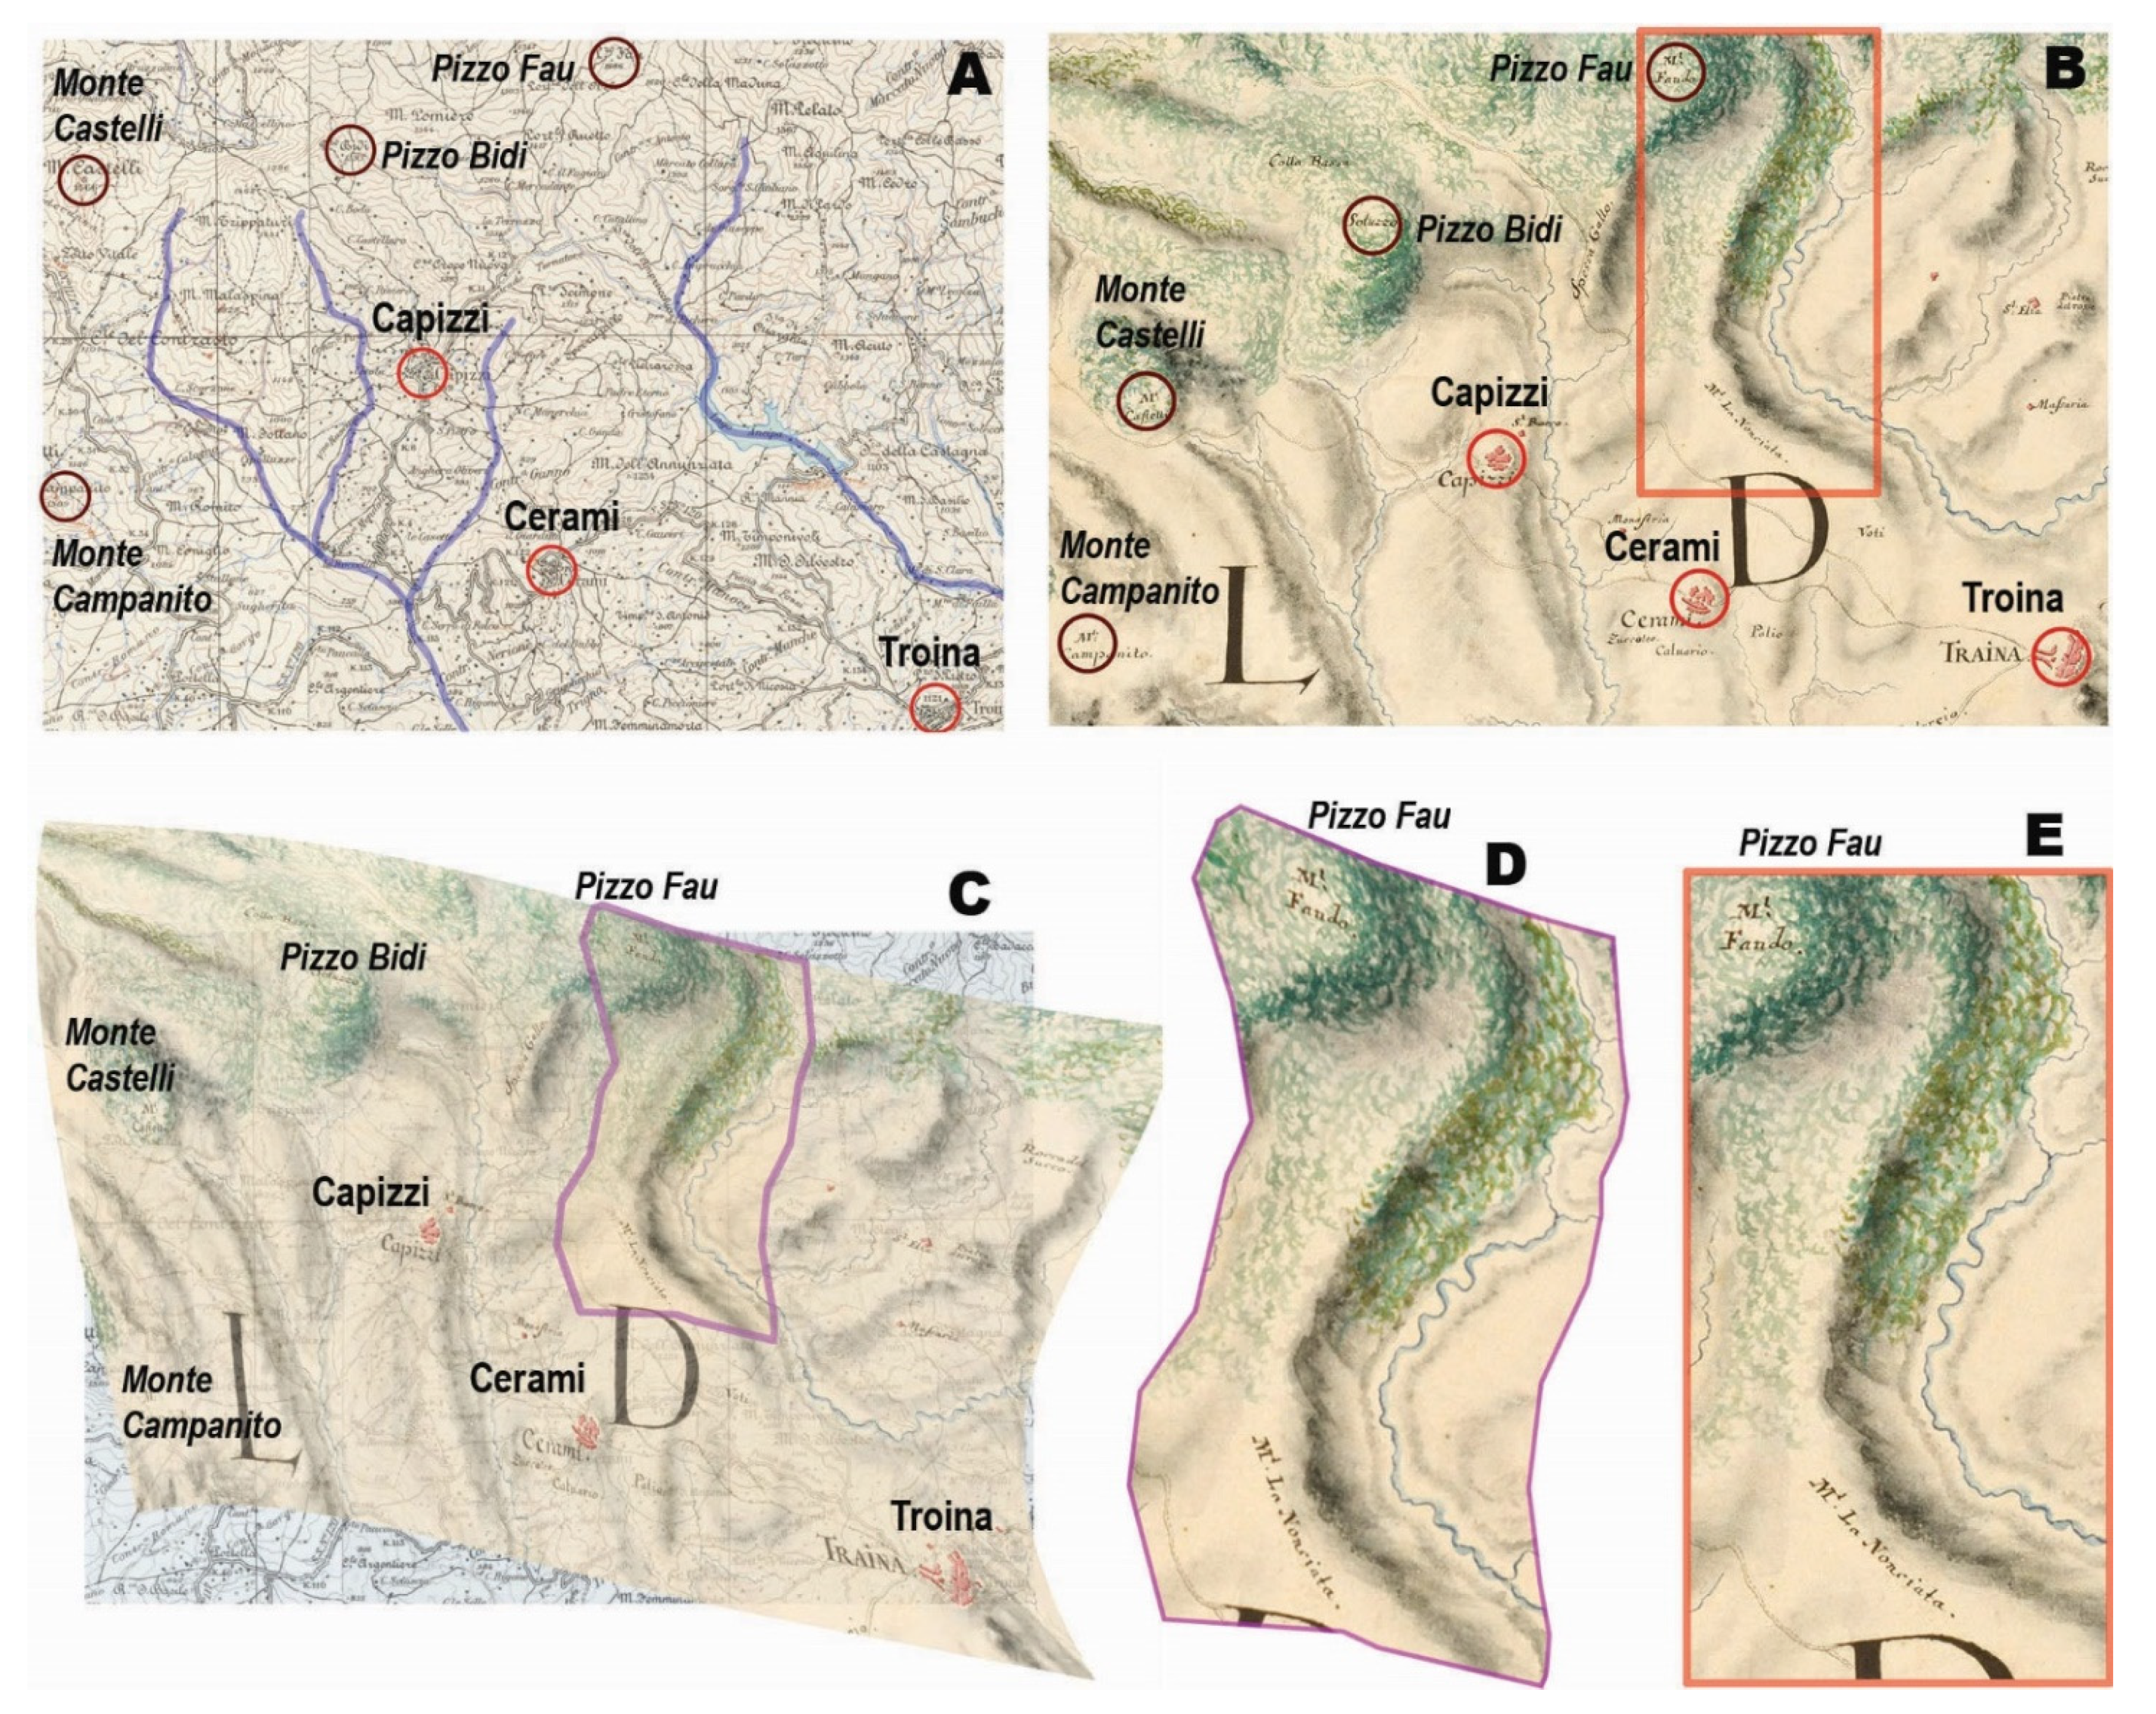
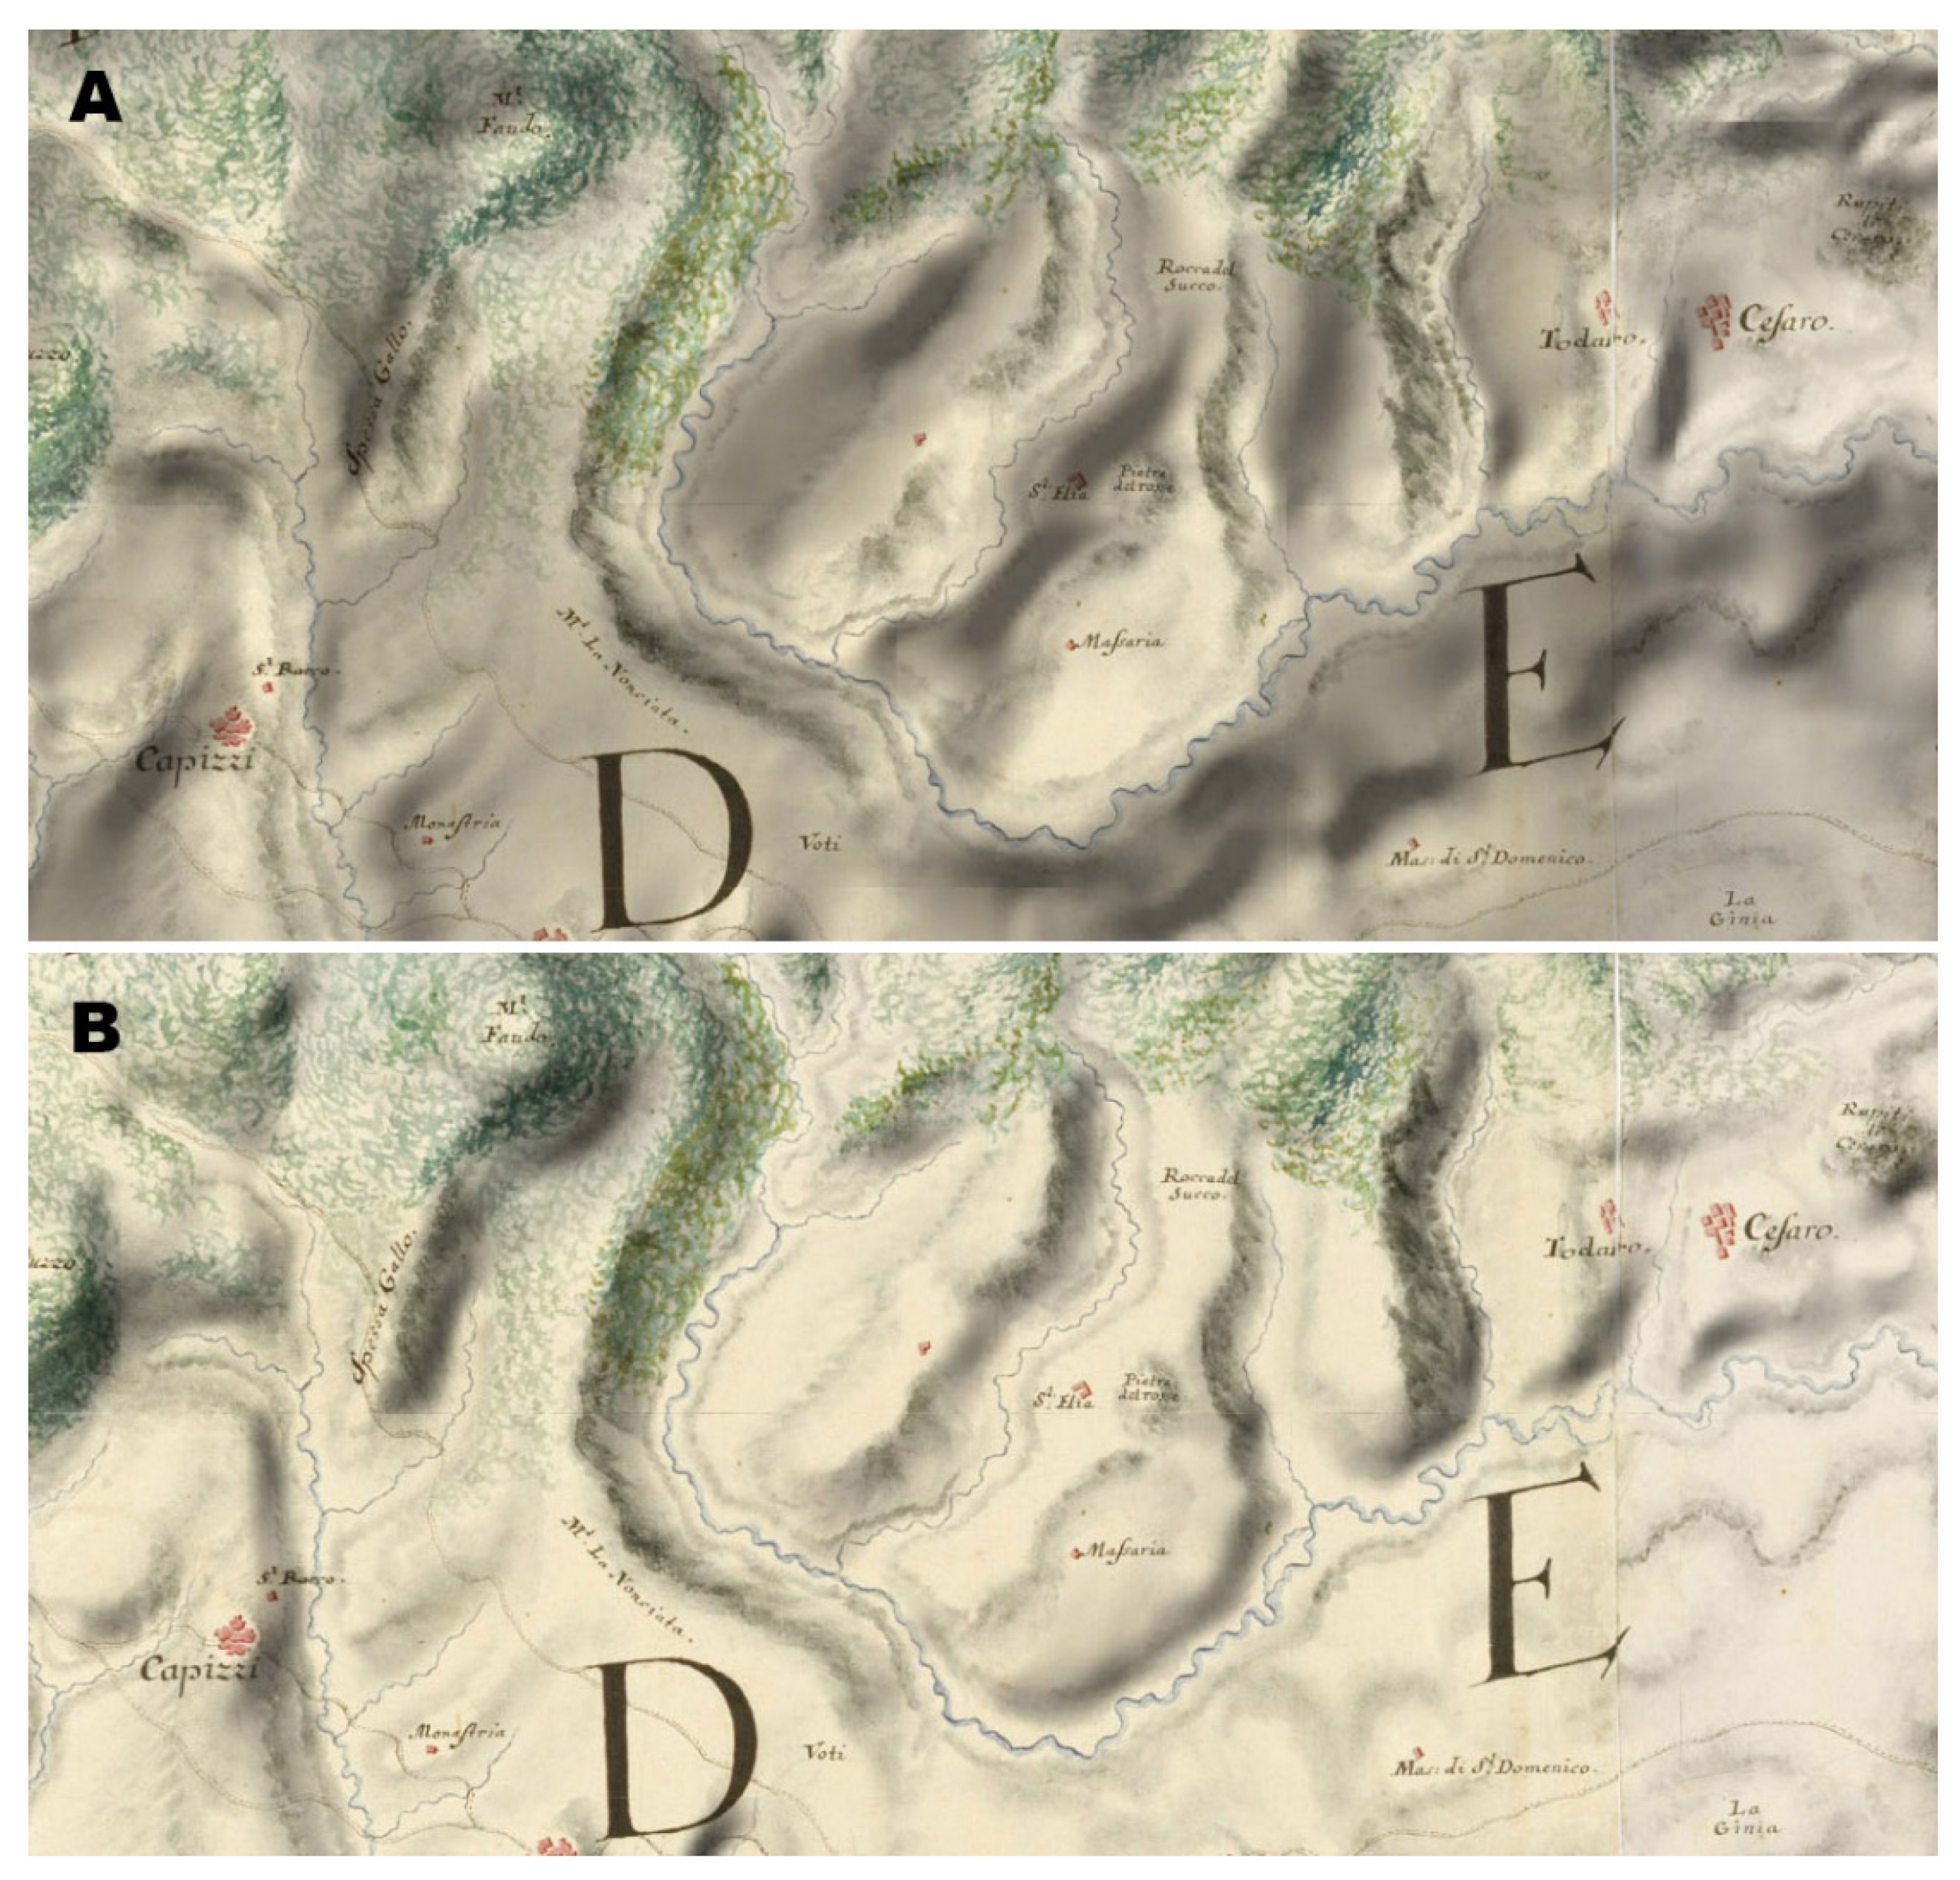
Comparative analysis of main relief forms on historical and modern maps, map rectification, and vectorization of contour lines (Section 3.3., Figure 3 and Figure 4);
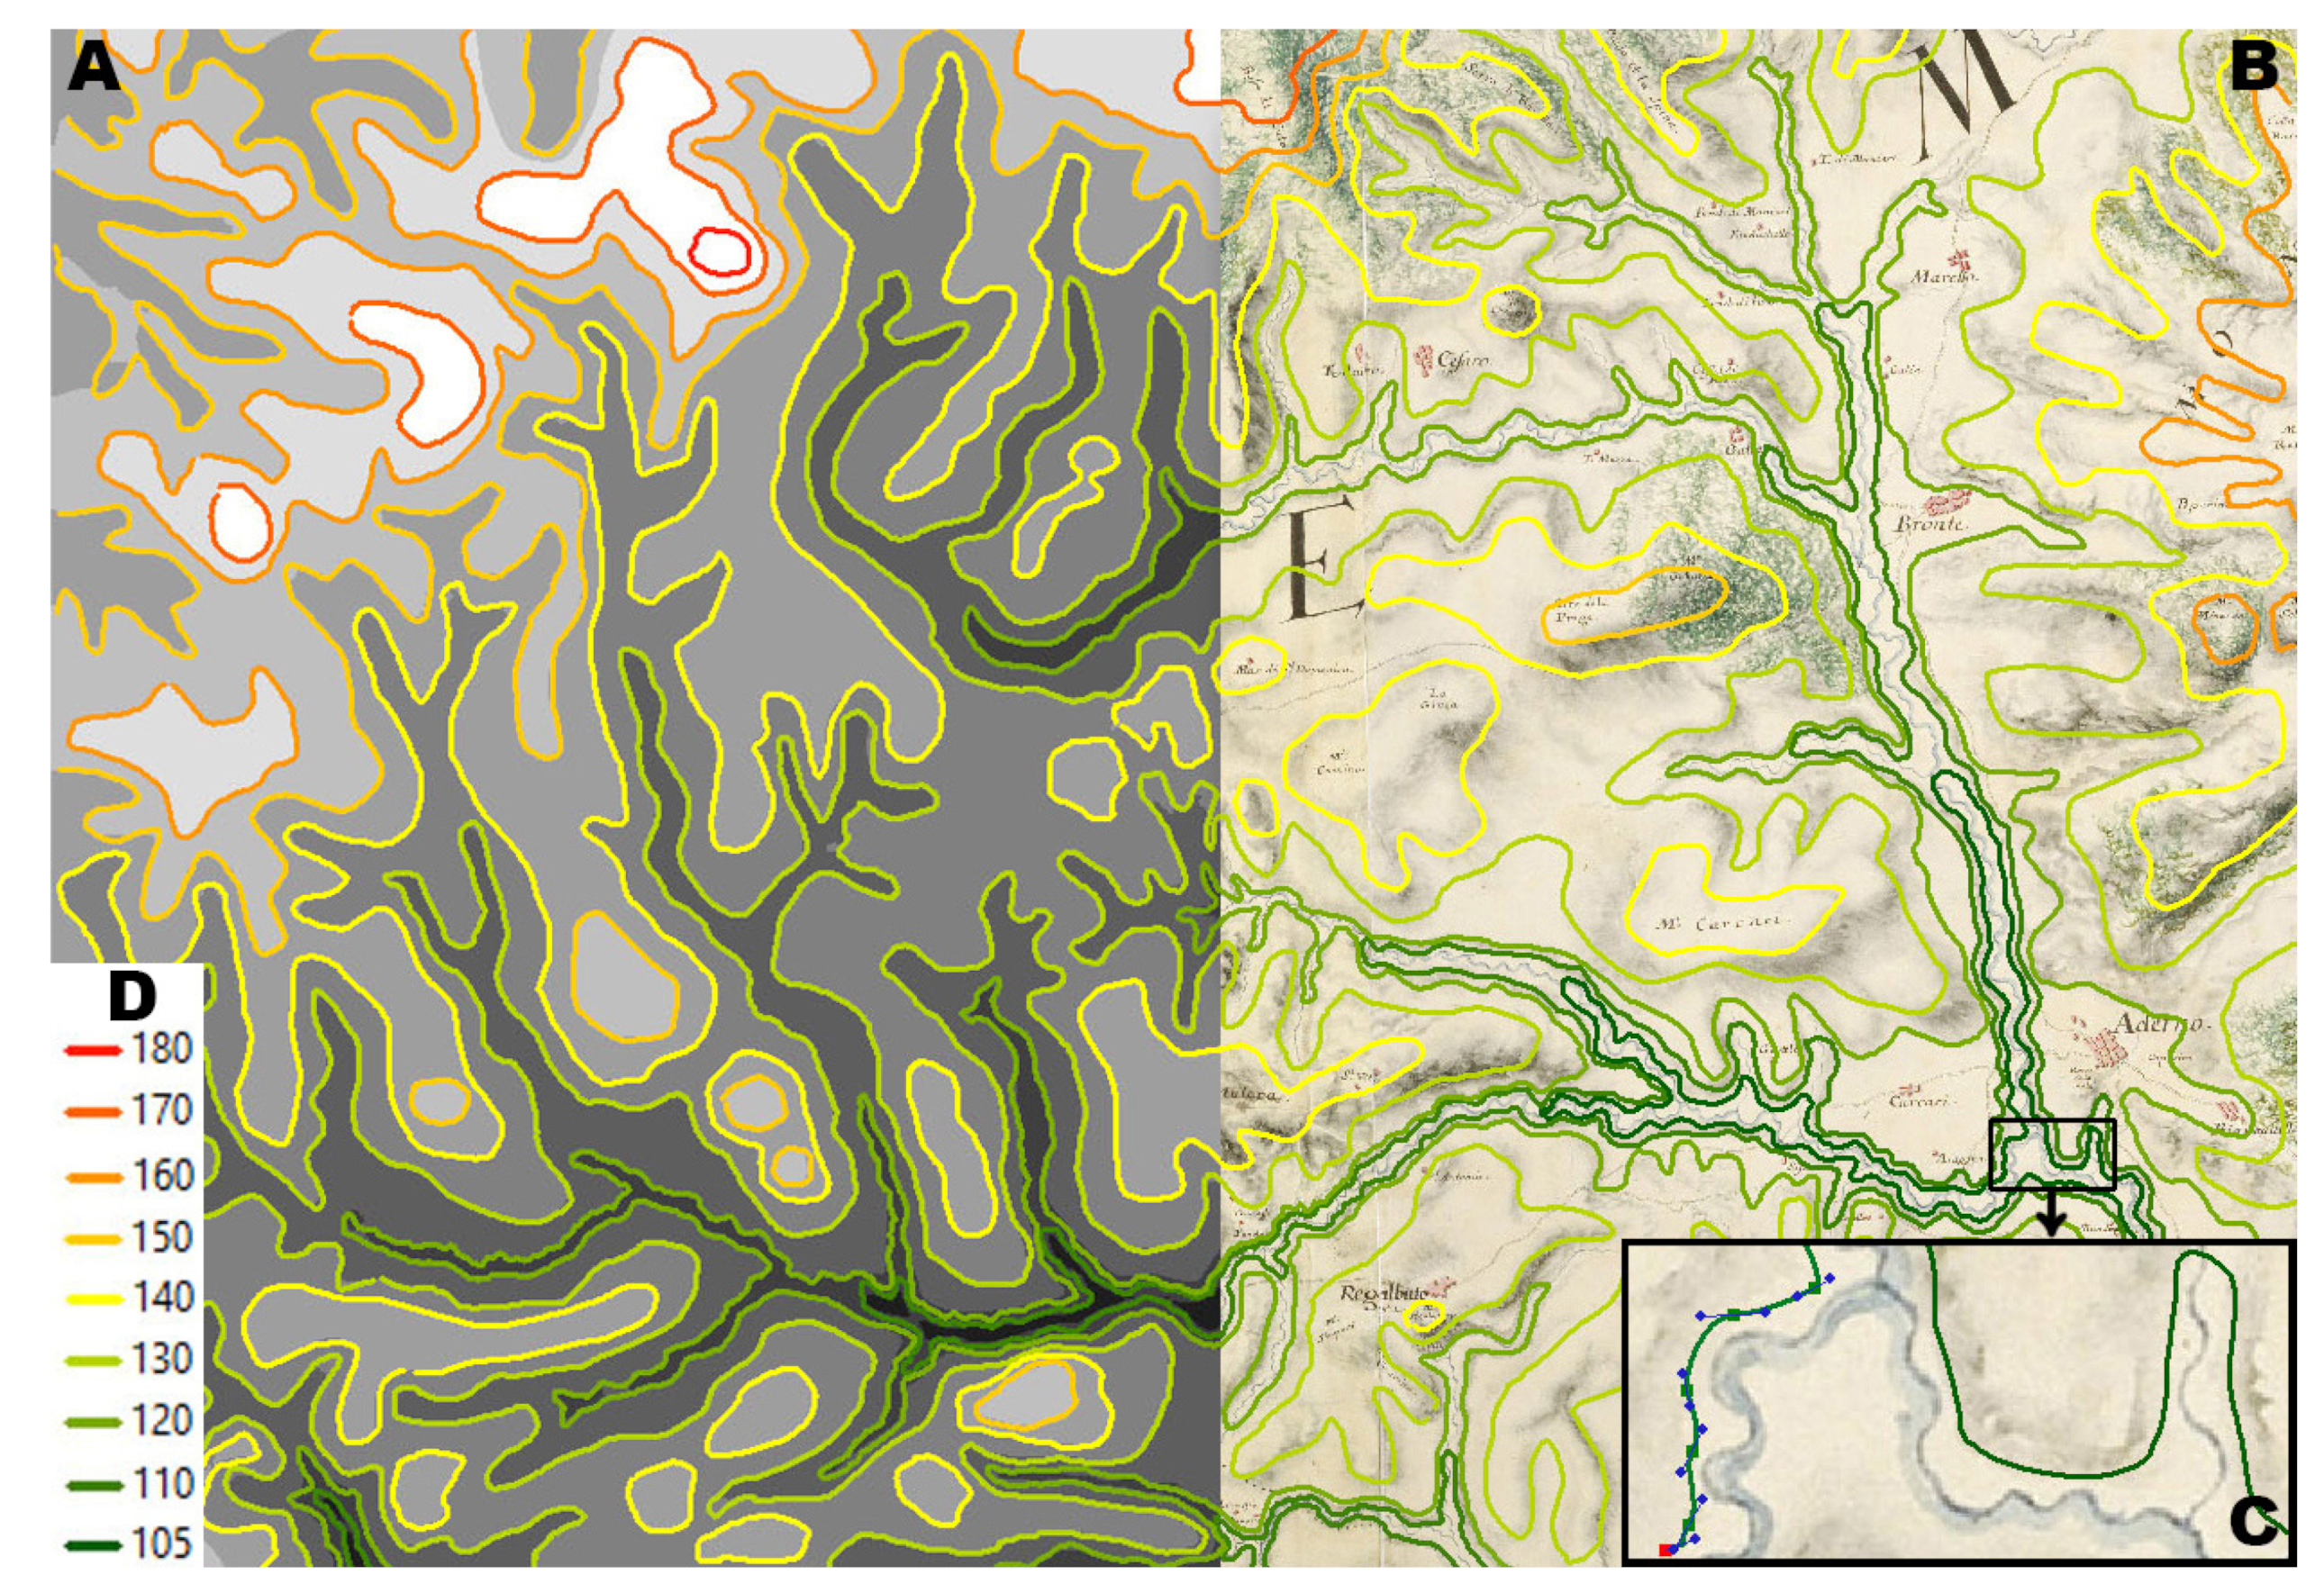
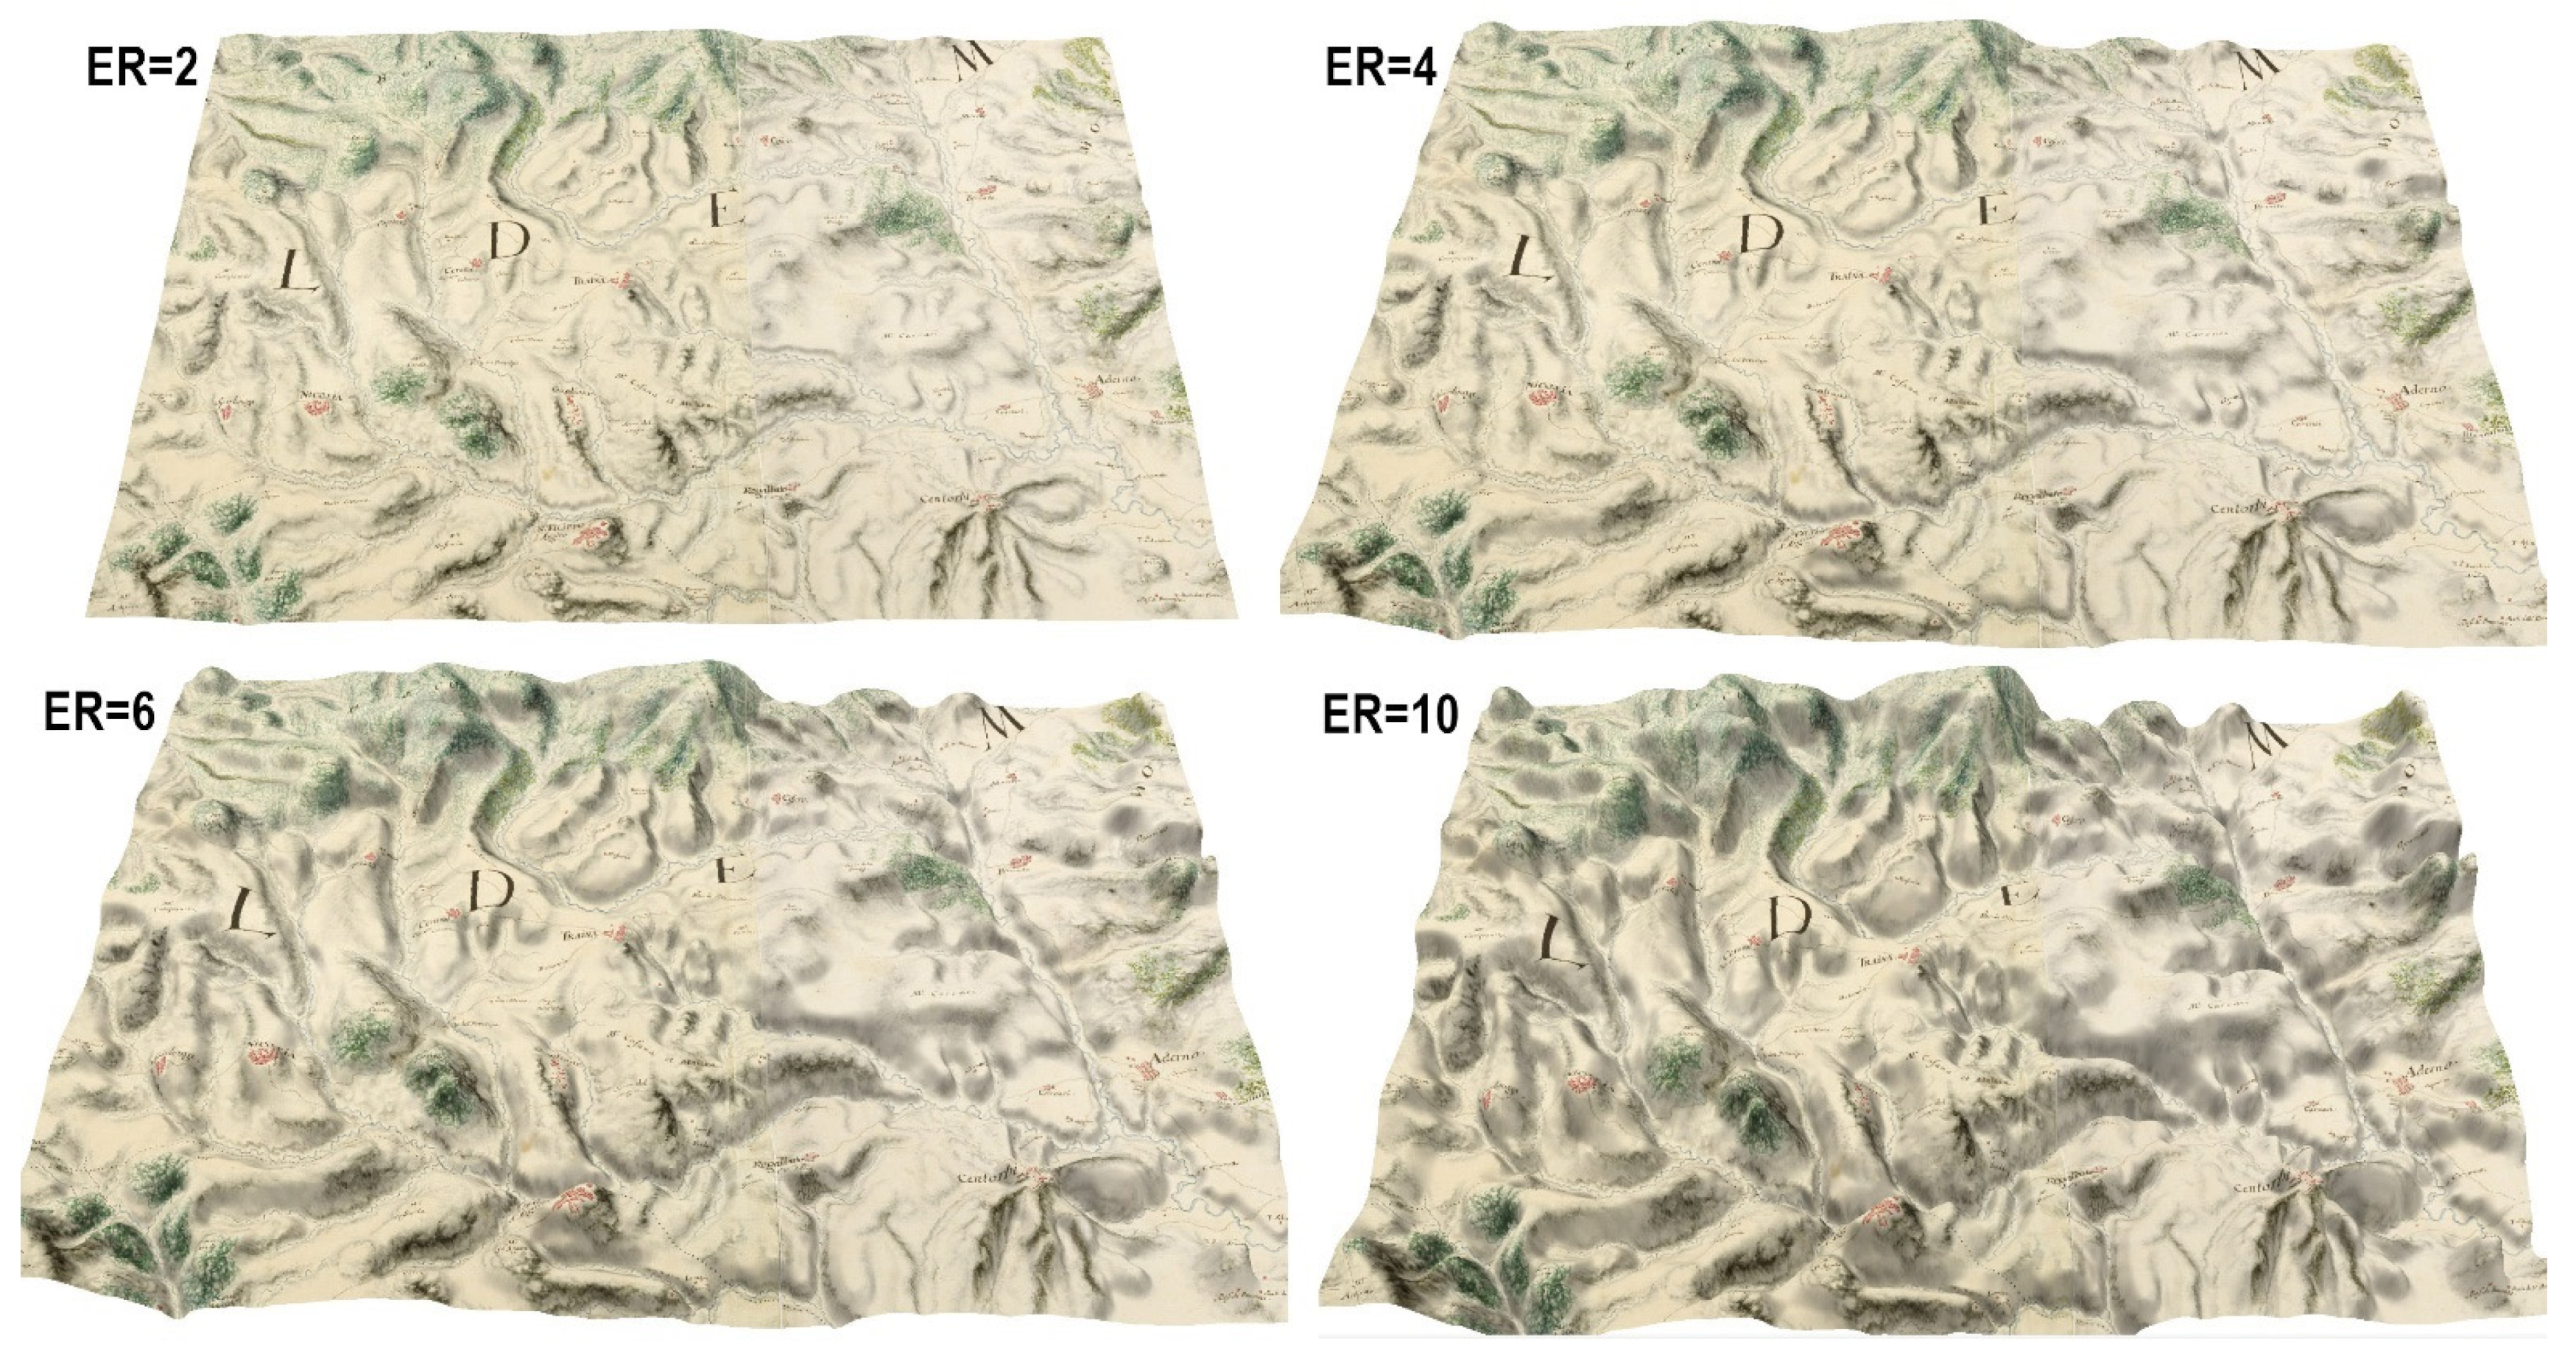
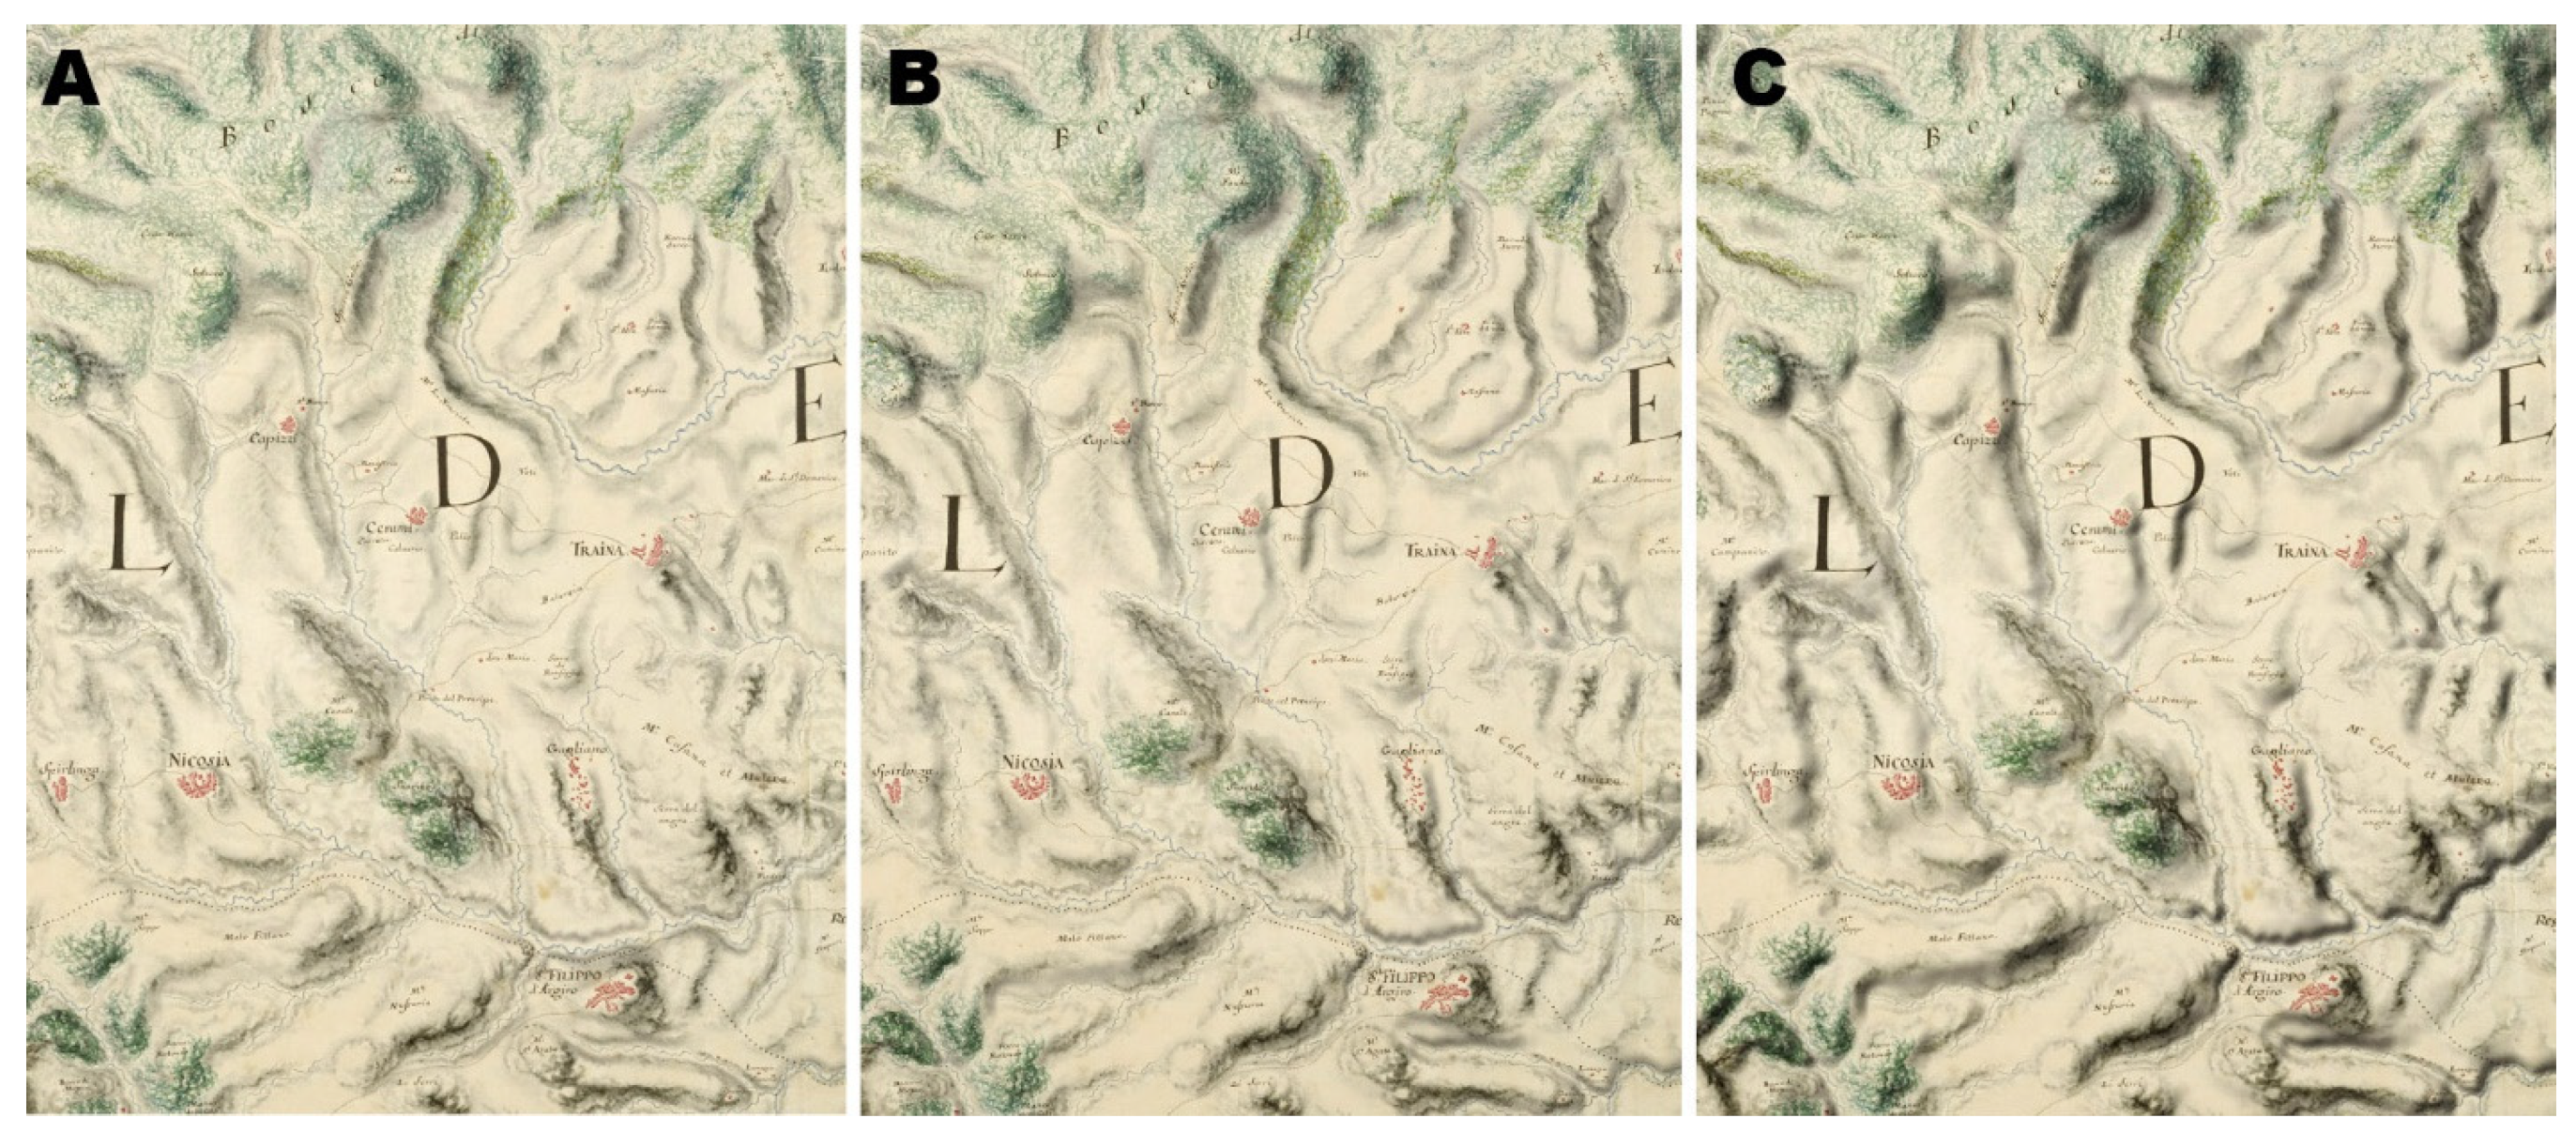
Transformation to GRID model and parameter variations: vertical exaggeration (vertical scaling factor) and illumination features (Section 3.4., Figure 5, Figure 6 and Figure 7);
Creation of the final effect: 3D visualization using the favorable parameters to achieve a suggestive and close natural landscape of the terrain (Section 4., Figure 8 and Figure 9).

3.1. Conception

The following points were included in the concept of the research:
  • Cartographic material: representative topographic works from the eighteenth century with painterly graphic means of expression in water-based media;
  • Digital interference in cartographic image: rasterized image, no map georeferenced to the coordinate system, transformation to GRID adjusted to graphical means of expression in water-based media;
  • Cartographic rules: plasticity of the relief, shape of contour lines, excessive ‘meandering’ of rivers, vertical-scale exaggeration, bird’s-eye view;
  • Measurable geoinformational parameters: elevation rise (vertical scale exaggeration); illumination: azimuth–altitude contrast;
  • Artistic and esthetic context: maintaining high expression of the painterly style, landscape naturalness of colors, painterly perspective in the artistic image, rendering and perspective changes;
  • Technology: rasterized images, raster graphics (Photoshop), manual vectorization: modelling of line arches, Bézier curves, GRID model, variants of parameters (ESRI ArcMap andArcScene 10.6.1.9270, Environmental Systems Research Institute, Inc. (ESRI), Redlands, CA, USA);
  • The expected effect: visualization of high suggestiveness of plasticity (imageability) representation from non-cartometric topographical maps with painterly style, recommendations for favorable arrangement of the perception point and image plane, bird’s-eye view.

3.2. Cartographic Materials

Figure 1 presents three map fragments selected from manuscript topographic works made in watercolor for European monarchs from the eighteenth century. The map of Sicily [21] is distinguished by a depiction of woodland in graduated varieties of green and a perfectly toned grey to render the relief forms (Figure 1A). The map of Scotland (Figure 1B) [22] and map of Susa (Figure 1C) [23], despite the richness of the pigments, seem considerably toned and muted. On these three maps, the landscape effect was achieved by employing subtle painterly techniques, predominantly watercolor and washes. Taking a look at originals directly on-site in cartographic archives was indispensable in order to select representative sheets of topographic maps with a favorable layout of the main relief forms.
A painterly means of expression, with blots of color and brushstrokes, prevails in Roy and Sandby’s maps of Scotland (Figure 2B) [24] and in Avico and Carelli’s map of the Susa Valley (Figure 2C) [25]. These maps seem considerably artistic, in contrast to other maps from the the eighteenth century, with more drawing (linear) means of graphical expression [6]. The three-dimensionality of landforms was rendered most realistically in these maps, due to the use of painterly means of graphical expression. Figure 2 shows the sophisticated painterly means of expression, with harmonious colors and imitation of natural features: stippling, spotting or blotting in grey (relief grading; brush; Indian ink and wash); and blotting, banding with multi-color and multi-shade spotting (landform hatching, land-relief shading on woods or on fields; varying use of landform; brush; Indian ink, bistre, and wash) [26].

3.3. Comparative Analysis of Main Relief Forms, Rectification, and Vectorization of Contour Lines

The first step of the analysis of the main relief landforms was to compare the location of mountain peaks, and the course of mountain chains and rivers on historical and modern maps. Figure 3 presents two maps of the middle part of Sicily (Figure 3A,B) with the location of four peaks, three towns, and the main rivers, to allow researchers to establish the total direction of the fall of the land and the volume of the main relief forms. Irregular distortions of the topographic objects’ location on the old map at the scale ca. 1:80,000 do not facilitate the evaluation of the main directions of the fall of the land, even when compared with the drawing of contour lines on the modern topographic map at the scale 1:100,000. The next step was to prepare for the vectorization of contour lines through the registration of the cartographic image in the geoinformation workspace. In line with the concept, a layer with a raster image without georeferences was registered with the modern spatial coordinate system.
A routine transformation to the coordinate system was performed, to check the degree of distortion of the graphical means of expression in the ESRI ArcMap 10.6.1 software (Figure 3C). The UTM 33 North coordinate system according to the UTM grid was specified for the modern topographic map. The next step was the rectification of the historical map according to common points on both maps. Seventeen points were identified, and a 3rd order polynomial transformation was used. The total RMS (root-mean-square) error was 522.342 m. Figure 3C shows a very irregular distortion of the graphics of the old map. In the case of these studies, the most important thing is to clearly indicate the distortion of the painterly style of the original map (Figure 3E) in the image, after rectification to the modern coordinate system (Figure 3D).
The next step was to prepare for the vectorization of contour lines through the registration of the cartographic image in the geoinformation workspace. A layer with the raster image without georeferences to the modern spatial coordinate system was registered (Figure 4B). Then, the vectorization for nine contour lines with agreed-upon altitude values took place, starting with the lowest value, 105, in the bed of the main valley (Figure 4A,D). The vectorization of contour lines was based on the polyline geometrical shapefiles with the use of Bezier curves in a freehand mode. Figure 4C in the bottom right corner shows a manual way of drawing contour lines by means of Bézier curves, which makes it possible to model smooth curves. The isochromatic map in the left part of Figure 4 presents the system of contour lines according to cartographic rules, whereas in the right part it shows the adjustment to a painterly means of expression on the map from the eighteenth century. All of these actions were performed using the ESRI ArcMap 10.6.1 software.
Figure 1. Map fragments with reduction from the originals by approximately 70%: (A): Nova et accurata Siciliae Regionum, Schmettausche Karte von Sizilien (1722), ca. 1:80.000; Vienna, Österreichische Nationalbibliothek; Schmettau: Sizilien, ÖNB/KAR: AB141, E19.585-D: 12; (B): Military Survey of Scotland—Highlands, ca. 1:36.000; 1747–1752. London, British Library. K.Top: Maps. CC.5a441/16-3f BL; (C): Valle di Susa: CARTA TOPOGRAFICA in misura, delle Valli di Cezana, e Bardoneche…, (1764), ca. 1:19.000; Turin, Archivio di Stato; Cartella 7, Susa.
Ijgi 11 00554 g001
Figure 2. The painterly graphical means of expression in map details from Figure 1. (A): map of Sicily, (B): map of Scotland, and (C): map of Susa.
Ijgi 11 00554 g002
Figure 3. Comparative analysis of main relief forms on map of Sicily, comparing the location of mountain peaks, the course of mountain chains and the rivers (with the location of four peaks, three towns, and main rivers) on the map of Sicily, ca.1:80,000, 1722 (B), and topographic map of Italy, sheet: Bronte, 1955, UTM, 1:100,000 (A): irregular distortion of old map frame (C): distortion of the center of the graphic expression of the valley/ridge south of Pizza Mountain (D): original painting style before rectification (E).
Ijgi 11 00554 g003
Figure 4. Vectorization of contour lines on the map of Sicily: (A): isochromatic map after vectorization; (B): contour lines on the layer with raster image; (C): manual way of drawing contour lines via Bézier curves; (D): nine contour lines with contrasting color.
Ijgi 11 00554 g004
Figure 5. Four values for vertical scaling factor (elevation rise): 2, 4, 6, and 10.
Ijgi 11 00554 g005

3.4. Transformation to GRID Model and Versioning Parameters

The contours were then used to interpolate a DRID Digital Terrain Model. The cells of the GRID have been calculated for 5-m sides and the height values in adjacent points have clearly been averaged. This was carried out in the ESRI ArcMap 10.6.1 software using the Topo-to-Raster tool which is based on the ANUDEM program [27]. The DTM output was transferred into ESRI ArcScene 10.6.1 software, which enables 3D representation. Modifying the height scale can be done by using elevation values in the raster layer and changing the view settings of the main viewer, (e.g., changing view field and roll angle).
To achieve a compromise between the distortions of the cartographic image and the suggestiveness of the land-relief visualizations, the variation in parameters were tested. Four values for the vertical scaling factor (elevation rise) show results according to the vertical exaggeration rule on the maps of smaller scales (Figure 5). As far as the area in Sicily is concerned, vertical scaling factors of 2–4 seem the most appropriate, and values of 6–10 should be rejected [28,29].
Setting the azimuth and the altitude of illumination parameters is a simple activity, because a cartographic rule says that azimuth NW = 315° and altitude 45° are favorable for intuitive interpretation [29,30]. A juxtaposition of two opposite azimuths of illumination in Figure 6 confirms that rule, as with azimuth SE = 135°, which is more natural for Europe. Rivers seem to be located on mountain ridges, whereas mountain ridges seem to be located in valleys.
Figure 6. Juxtaposition of two opposite azimuths of illumination (Map of Sicily: (A): SE = 135° and (B): NW = 315°.
Ijgi 11 00554 g006
Figure 7. Three contrast values (Map of Sicily): (A): 20, (B): 40, and (C): 100.
Ijgi 11 00554 g007
Figure 8. Natural landscape colors: high similarity of the map of Sicily (A) and the map of Scotland (B), (compare the photographs with Figure 1 and Figure 9).
Ijgi 11 00554 g008
Figure 9. Final bird’s-eye view with the following values adopted: vertical scaling = 4, contrast 40%; illumination: azimuth 315° = NW, altitude 45°, slightly inclined towards the viewer (to the right) by approximately 20°; (A): from a detail of the Sicily map; (B): from a detail of the Scotland map; (C): from a detail of the Susa map.
Ijgi 11 00554 g009
Contrast is a more subjective parameter; therefore, it is necessary to consider the quality of the raster image in order to achieve an effect similar the original paper in terms of the three most important features of color: hue, saturation and value. If an adequate 3D effect for relief-form visualizations is to be achieved, the level of contrast is related to enhancing grayness for the shaded mountain slopes and valley sides. Figure 7 presents three contrast values, with value 20 and 40 appearing to be more favorable than the maximum value of 100. A similar process using appropriate data, map projections, and control points was then carried out for the other two landscape fragments.

4. Results

In the process of creating the final perspective visualization, the author focused on a complementary selection of appropriate perspective parameters: the variable of vertical scaling factor (vertical exaggeration) and slope exposition, and exposure of the cartographic image surface for the suggestive whole representation of land relief. Due to the high similarity of the map of Sicily and the map of Scotland in natural landscape colors, the author used observations and photographs taken from observation points on-site to aid the process (Figure 8).
Considering the variations of parameters demonstrated above, in the context of both naturalness and suggestiveness of relief-form representation on the water-colored topographic maps, to create a 3D model the following values were adopted: vertical scaling = 4; illumination: azimuth 315° = NW, altitude 45°, and contrast 40%. For a correct comprehensive interpretation of the relief for the entire area in 3D view, three visualizations were prepared, using the same parameters (Figure 9). The author used the possibility of smooth rendering with a computer mouse button for setting the bird’s-eye view: the height of the observation point, range of the field of vision, and the slope and rotation of the cartographic image plane [31]. In general, each of the three cartographic images (along with previously selected versions of parameters presented above for the map of Sicily) was slightly inclined towards the viewer (to the right) by approximately 20°.

5. Discussion

The research path suggested here was based on three non-cartometric cartographic images with favorable layouts of main relief forms. The fragment of the map of Sicily includes high mountains in the north, and valleys lowering towards the south east. In this case, watercolor banding with multi-color and multi-shade spotting and stippling, and blotting in gray make an excellent match with the parameters selected to highlight the 3D effect. The relief of the map of Scotland is generally lowering southwards with wide valleys; however, massive elevations at the bottom of the sheet near longer multi-color and multi-shade spotting may evoke slight visual discomfort. On the map of Susa, neither high mountain ridges in the north and west, nor a broad valley (along with the tree pattern on mountain slopes) distorts the image perception. The peak with mountain ridges in the south east with slopes directed northwards may cause difficulties with visual interpretation. Thus, when dealing with historical maps in water-based media, one needs to consider limitations that result from digital transformation of the paper map to the 3D model [15]. With the modern panoramas created at present, the problem is minimized by rigorous geometric distortions in favor of readability and the illustrative aspect.
A remaining issue is the establishment of the lowest possible number of contour lines required to create an adequate GRID DTM to match the non-cartometric topographic map. This will have a direct impact on the parameter variants in the 3D model to best represent the artistic water-color relief representation. If one compares the number and density of contour lines on the modern map, one can observe a great reduction in the number of contour lines used for creating the DRID model. The smaller contour interval has been replaced by an approach using river-valley framing and mountain ridge/domineering mountain-peaks framing. When it comes to drawing (digitizing) contour lines along rivers, based on maps from the sixteenth to the eighteenth century, one needs to consider the graphical manner of showing excessive ‘meandering’ of the river [32]. Those small meanders on the map should not be taken into account in the process of vectorization of contour lines in river valleys (Figure 4C). Thus, in the contour-line vectorization stage, the initial comparative analysis of the river course on the historical non-cartometric map and the modern map, becomes significant.
The order of variations of parameters for the historical water-colored map may also be subject to discussion, because in the line of study suggested in this research, cartographic rules were prioritized. Therefore, the author focused on subjective esthetic feelings and sensations, which are a lot more difficult to verify and are more individualized. The fact that users of interactive atlases have tools for any changes in parameters of 2D and 3D views on the monitor allows users to select the visualization that suits them best [33], and it is useful to give them an appropriate starting point and some guidance.
What is becoming more and more significant is the subjective evaluation of the esthetics of the topographic image in relation to the natural landscape [34], which does not need to go hand in hand with a high effectiveness of interpreting mutual volume relationships of relief forms. For instance, on the one hand, high contrast highlights the most significant features for larger valleys and mountain ridges. On the other hand, such contrast does not allow one to notice the morphology of small forms [35,36]. High contrast is, however, appreciated in designing map symbols that are supposed to be seen in the context of the entire map content.

6. Conclusions

To summarize this analysis, one may conclude that water-based media offered an opportunity to represent relief suggestively and landscape realistically. Focusing on the discussed sophisticated painterly means of expression, the author concludes that the appropriate application of cartographic rules and the complementary selection of measurable geomedia parameters becomes a decisive factor when it comes to the creation of 3D visualizations from historical non-cartometric topographic maps. The rules for drawing contour lines should be applied, but along with the generalization of a necessary number of them, adequate for banding with multi-color and multi-shade spotting and stippling, and spotting or blotting in gray by brush, using water media (Indian ink, bistre, and wash). The vectorization of contour lines suggested here was based on the analysis of topography on the historical and modern maps. The image of the historical map was registered in the graphical layout with no georeference to the standard modern spatial system, because such georeference would distort the graphical means of expression. On the other hand, the adequate transformation of the image to the 3D model, based on vectorized contour lines, adjusts any distortions of the appropriate perception of the artistry in the water-colored image [37].
Generally speaking, the parameters of the non-cartometric topographic image in a 3D model can be selected in turn; however, what matters is to maintain their complementarity, as their effects will interact. On the basis of several parameter variants, the following parameter recommendations are as follows: vertical scaling = 4, illumination: azimuth 315° = NW, altitude 45°, contrast 40% (Figure 4, Figure 5, Figure 6 and Figure 7). Those parameters work well for creating the general static 3D visualization for the perception of relief features, particularly with a bird’s-eye view. On the other hand, the location of the observation point for the bird’s-eye view and the rotation of the map surface, are subject to the individual manual action of the designer and an intention to balance the artistry and the measurability of the land-relief representation. In the case of these three watercolor maps, for a favorable overall perception of the relief (suggestive and close to landscape naturalness), the author proposes a gentle tilt and clockwise rotation of the topographic image surface, and an appropriate distance for the observation point (Figure 9).
The limitations on creating the fully renderable 3D models for topographic images in the painterly style result from the existing shading of mountain slopes and valley sides on the north-western side. Hence, the best effect in terms of suggestiveness in perceiving the landscape naturalness, characterizes a static 3D-visualization that resembles professional panoramas of mountain landscapes, created in artificial perspectives [38]. In the research, it is also recommended that a cartographic rule is applied that says that the mountains should be located further toward the top part of the view, whereas valleys and the entire area should be lowered in the direction of the viewer, who is located in the lower part.
Considering the high artistic and documenting value of topographic works from the eighteenth century, the establishment of parameters for interactive rendering of 3D models remains the issue for further research, as each work has its own individual use of artistic application of water-based media. The features of water-colored visualizations for the construction of suggestive and natural 3D visualizations presented here may be of great importance for the construction of scientific visualizations explaining the variability of phenomena on topographic scales since the eighteenth century.

Funding

This research received no external funding.

Data Availability Statement

Not applicable.

Conflicts of Interest

The author declares no conflict of interest.

References

  1. Robinson, A.H.; Sale, R.D.; Morrison, J.L. Elements of Cartography, 4th ed.; John Wiley & Sons, Inc.: New York, NY, USA, 1978; ISBN 9780471017813. [Google Scholar]
  2. Medyńska-Gulij, B. Kartografia i Geomedia; Wydawnictwo Naukowe PWN: Warsaw, Poland, 2021; ISBN 978-83-01-21554-5. [Google Scholar]
  3. Edney, M. Mapping, Survey and Science. In The Routledge Handbook of Mapping and Cartography; Kent, A., Vujakovic, P., Eds.; Routledge: London, UK, 2018; pp. 292–325. ISBN 9781138831025. [Google Scholar]
  4. Imhof, E. Cartographic Relief Presentation; Walter de Gruyter: Berlin, Germany, 1982; ISBN 9783110067118. [Google Scholar]
  5. Kent, A.; Vujakovic, P. Cartographic Language: Towards a New Paradigm for Understanding Stylistic Diversity in Topographic Maps. Cartogr. J. 2011, 48, 21–40. [Google Scholar] [CrossRef]
  6. Medyńska-Gulij, B.; Żuchowski, T.J. European Topography in Eighteenth-Century Manuscript Maps; Bogucki Wydawnictwo Naukowe: Poznań, Poland, 2018; ISBN 9788379862047. [Google Scholar]
  7. Withers, C.W. Placing the Enlightenment: Thinking Geographically about the Age of Reason; The University of Chicago Press: Chicago, IL, USA, 2008; ISBN 9780226904054. [Google Scholar]
  8. Medyńska-Gulij, B.; Żuchowski, T.J. An Analysis of Drawing Techniques used on European Topographic Maps in the Eighteenth Century. Cartogr. J. 2018, 55, 309–325. [Google Scholar] [CrossRef]
  9. Mapire.eu. Available online: https://maps.arcanum.com/en/ (accessed on 6 September 2022).
  10. Roy Military Survey of Scotland, 1747–1755. Available online: https://maps.nls.uk/geo/roy/#zoom=7&lat=56.8860&lon=-4.0709&layers=0 (accessed on 6 September 2022).
  11. Fleet, C.; Kowal, K. Roy Military Survey map of Scotland (1747–1755): Mosaicing, geo-referencing, and web delivery. E-Perimetron 2007, 2, 194–208. [Google Scholar]
  12. Timár, G.; Biszak, S.; Székely, B.; Molnár, G. Digitized Maps of the Habsburg Military Surveys: Overview of the Project of ARCANUM Ltd. (Hungary). In Preservation in Digital Cartography; Jobst, M., Ed.; Springer: Berlin-Heidelberg, Germany, 2011; pp. 73–283. ISBN 9783642127335. [Google Scholar]
  13. Gartner, G. Seeing the “perfect world” through Heinrich Berann’s Panorama Map of the Alps. Int. J. Cartogr. 2021, 7, 240–244. [Google Scholar] [CrossRef]
  14. Veronesi, F.; Hurni, L. Changing the light azimuth in shaded relief representation by clustering aspect. Cartogr. J. 2014, 51, 291–300. [Google Scholar] [CrossRef]
  15. Svobodová, J.; Voženílek, V. Relief for Models of Natural Phenomena. In Landscape Modelling: Geographical Space, Transformation and Future Scenarios; Anděl, J., Bičík, I., Dostál, P., Shasneshin, S., Eds.; Springer: Dordrecht, The Netherlands, 2009; Volume 8, pp. 183–196. ISBN 9789048130528. [Google Scholar]
  16. Kettunen, P.; Koski, C.; Oksanen, J. A design of contour generation for topographic maps with adaptive DEM smoothing. Int. J. Cartogr. 2017, 3, 19–30. [Google Scholar] [CrossRef] [Green Version]
  17. Rink, K.; Chen, C.; Bilke, L.; Liao, Z.; Rinke, K.; Frassl, M.; Yue, T.; Kolditz, O. Virtual geographic environments for water pollution control. Int. J. Digit. Earth 2018, 11, 397–407. [Google Scholar] [CrossRef]
  18. Cornel, D.; Buttinger-Kreuzhuber, A.; Konev, A.; Horvath, Z.; Wimmer, M.; Heidrich, R.; Waser, J. Interactive Visualization of Flood and Heavy Rain Simulations. Comput. Graph. Forum 2019, 38, 25–39. [Google Scholar] [CrossRef]
  19. Pingel, T.; Clarke, K. Perceptually Shaded Slope Maps for the Visualization of Digital Surface Models. Cartographica 2014, 49, 225–240. [Google Scholar] [CrossRef]
  20. Collier, P.; Forrest, D.; Pearson, A. The Representation of Topographic Information on Maps: The Depiction of Relief. Cartogr. J. 2003, 40, 17–26. [Google Scholar] [CrossRef]
  21. Dufour, L. La Sicilia Disegnata. La Carta di Samuel Von Schmettau 1720–1721; Società Siciliana per la Storia Patria: Palermo, Italy, 1995; ISBN 9788874010660. [Google Scholar]
  22. Anderson, C. Constructing the Military Landscape: The Board of Ordnance Maps and Plans of Scotland, 1689–1815. Ph.D. Thesis, University of Edinburgh: Edinburgh, Scotland, 2009. [Google Scholar]
  23. Garis, E. La Carta in Nove Parti Della Valle di Susa. In Il Teatro Delle Terre: Cartografia Sabauda tra Alpi e Pianura; Ricci, I., Gentile, G., Raviola, B.A., Eds.; L’Artistica Savigliano: Turin, Italy, 2006; pp. 212–240. [Google Scholar]
  24. Hodson, Y. The Highland Survey 1747–1755 and the Scottish School of Cartography. Opening up the Highlands Highland History and Archives. Scott. Rec. Assoc. Conf. Rep. 1991, 17, 1–4. [Google Scholar]
  25. Sereno, P. Li Ingegneri Topograffici di Sua Maesta. La formazione del cartografo militarenegli stati sabaudi e l‘istituzione dell‘Ufficio di Topografia Reale. In Rappresentare uno Stato. Carte e Cartografi degi Stati Sabaudi dal XVI al XVIII secolo; Comba, R., Sereno, P., Eds.; Umberto Allemandi & C.: Turin, Italy, 2002; Volume 1, pp. 61–102. ISBN 9788842207177. [Google Scholar]
  26. Teissig, K. Drawing Techniques; Octopus Books Ltd: London, UK, 1983; ISBN 9780706417395. [Google Scholar]
  27. Hutchinson, M.F.; Xu, T.; Stein, J.A. Recent Progress in the ANUDEM Elevation Gridding Procedure. In Geomor-Phometry; Hengel, T., Evans, I.S., Wilson, J.P., Gould, M., Eds.; Elsevier: Amsterdam, the Netherlands, 2011; pp. 19–22. Available online: http://geomorphometry.org/HutchinsonXu2011 (accessed on 6 August 2022).
  28. Jenks, G.; Caspall, F. Vertical Exaggeration in Three- Dimensional Mapping; Technical Report No. 2.; Office of Naval Research: Washington, DC, USA, 1967. [Google Scholar]
  29. Castner, H.; Roger Wheate, R. Re-assessing the Role Played by Shaded Relief in Topographic Scale Maps. Cartogr. J. 1979, 16, 77–85. [Google Scholar] [CrossRef]
  30. Imhof, E. Gelände und Karte, 2nd ed.; Eugen Rentsch: Zürich, Switzerland, 1958. [Google Scholar]
  31. Lexikon der Kartographie und Geomatik; Bollman, J.; Koch, W.-G. (Eds.) Spektrum Akademischer: Berlin/Heidelberg, Germany, 2001; Volume 1, p. 451. ISBN 978-3827410559. [Google Scholar]
  32. Medyńska-Gulij, B. How the Black Line, Dash and Dot Created the Rules of Cartographic Design 400 Years Ago. Cartogr. J. 2013, 50/4, 56–368. [Google Scholar] [CrossRef]
  33. Sieber, R.; Serebryakova, M.; Schnürer, R.; Hurni, L. Atlas of Switzerland Goes Online and3D—Concept, Architecture and Visualization Methods. In Progress in Cartography; Gartner, G., Jobst, M., Huang, H., Eds.; Springer: Cham, Switzerland, 2016; ISBN 9783319196022. [Google Scholar]
  34. Verdier, N.; Besse, J.-M. Color and Cartography. In The History of Cartography; Edney, M.H., Pedley, M.S., Eds.; The Chicago University Press: Chicago, IL, USA, 2020; Volume 4, pp. 294–302. ISBN 9780226339221. [Google Scholar]
  35. Leonowicz, A.M.; Jenny, B.; Hurni, L. Terrain sculptor: Generalizing terrain models for relief shading. Cartogr. Perspect. 2010, 67, 51–67. [Google Scholar] [CrossRef] [Green Version]
  36. Patterson, T. A desktop approach to shaded relief production. Cartogr. Perspect. 1997, 28, 38–39. [Google Scholar] [CrossRef]
  37. Medyńska-Gulij, B. Linear and painterly expression in topographic works of art during the Enlightenment. Int. J. Cartogr. 2021, 7, 158–163. [Google Scholar] [CrossRef]
  38. Patterson, T. A View From On High: Heinrich Berann’s Panoramas and Landscape Visualization Techniques for the U.S. National Park Service. Cartogr. Perspect. 2000, 36, 38–65. [Google Scholar] [CrossRef]
Publisher’s Note: MDPI stays neutral with regard to jurisdictional claims in published maps and institutional affiliations.

