Article

A Spatial Data Infrastructure Integrating Multisource Heterogeneous Geospatial Data and Time Series: A Study Case in Agriculture

1
Institute for Electromagnetic Sensing of the Environment, National Research Council of Italy (CNR-IREA), via Bassini 15, 20133 Milano, Italy
2
Institute for the Dynamics of Environmental Processes, National Research Council of Italy (CNR-IDPA), piazza della Scienza 1, U1, 20126 Milano, Italy
*
Author to whom correspondence should be addressed.
ISPRS Int. J. Geo-Inf. 2016, 5(5), 73; https://0-doi-org.brum.beds.ac.uk/10.3390/ijgi5050073
Submission received: 4 January 2016 / Revised: 4 May 2016 / Accepted: 9 May 2016 / Published: 21 May 2016
(This article belongs to the Special Issue Geographic Information Retrieval)

Abstract

:
Currently, the best practice to support land planning calls for the development of Spatial Data Infrastructures (SDI) capable of integrating both geospatial datasets and time series information from multiple sources, e.g., multitemporal satellite data and Volunteered Geographic Information (VGI). This paper describes an original OGC standard interoperable SDI architecture and a geospatial data and metadata workflow for creating and managing multisource heterogeneous geospatial datasets and time series, and discusses it in the framework of the Space4Agri project study case developed to support the agricultural sector in Lombardy region, Northern Italy. The main novel contributions go beyond the application domain for which the SDI has been developed and are the following: the ingestion within an a-centric SDI, potentially distributed in several nodes on the Internet to support scalability, of products derived by processing remote sensing images, authoritative data, georeferenced in-situ measurements and voluntary information (VGI) created by farmers and agronomists using an original Smart App; the workflow automation for publishing sets and time series of heterogeneous multisource geospatial data and relative web services; and, finally, the project geoportal, that can ease the analysis of the geospatial datasets and time series by providing complex intelligent spatio-temporal query and answering facilities.

Graphical Abstract

1. Introduction

Geospatial information on the Web, also named GeoWeb, is becoming more and more important not only among traditional users (mainly environmental researchers, geographers, and social scientists) but also among public authorities and citizens for the most diverse tasks: retrieval of Point of Interests (POIs), consultation of time series of meteorological and thematic maps for natural hazards, agriculture, etc. Specialized applications using Geospatial Data (GD), such as Location-Based Services (LBS), Web Mapping Systems, and interactive maps and globes, are becoming very popular [1].
It has been estimated that more than 15% of queries submitted to search engines are of a geographic nature [2], requesting mainly georeferenced information. Other studies reported in [1,3] have analyzed the social impact of GD with an explicit extension on the geographical space, like remotely sensed Earth Observation (EO) images and aerial photographs, thematic digital maps with associated attributes, crowdsourced geotagged information from social networks, and Volunteered Geographic Information (VGI), which is georeferenced information freely created by citizens [4], possibly by means of smart applications installed on their mobile devices connected to the Internet.
Search engines have become very powerful and effective means to search and retrieve not only information in textual form, but also pictures, news, blogs, videos, audio recordings, and, last but not least, georeferenced textual information, by means of Google Maps, etc. Nevertheless, there is still a gap to fill in order to enable effective access, retrieval, integration, visualization, analysis and interpretation of GD and time series with heterogeneous formats and themes and from multiple sources [3]. Specifically, to support land planning, nowadays SDI need to be designed and developed to integrate both GD sets and time series of information of spatial explicit data from multiple sources: products derived by processing of continuous acquisition of remotely sensed images, georeferenced in-situ measurements from sensors, and georeferenced information created by operators and volunteers by means of smart applications.
Despite the fact that technologies to enable GD management on the Web and a number of open source solutions are available, there is an urgent need to improve the methods for managing heterogeneous multisource GD [5]. The main open research issues concern: (i) the design of scalable solutions for SDI architectures; (ii) the interoperable management of heterogeneous GD integrating sensor data and VGI; (iii) the composition and automation of web services to define workflows for deployment through the Web of multisource heterogeneous GD sets and time series; and (iv) the availability of standards providing complex service facilities for an easy access and integrated analysis of GD both in space and in time.
The integration and interoperability enablement of GD distributed among multiple servers need a SDI adopting standards as identified by the Open Geospatial Consortium (OGC) to enable contents sharing and analysis [1,3,6]. In our proposal, to cope with scalability and dynamic GD and time series we adopted an acentric and distributed SDI architecture based on a set of OGC web services for GD sharing and discovery [6]. Among the Web services, catalogue services are fundamental to enable geo-data discovery by users having information needs, expressed by queries. A catalogue service exploits a Web database management system to manage metadata, i.e., information about GD, and to answer users’ queries. Metadata describe the characteristics of the GD format, authorship, semantics, geographic and temporal context, and ancillary information on their quality, which is necessary to allow consumers and stakeholders to interpret the GD meaning and to understand if the correspondent GD fits their information needs. The bottleneck in setting up a catalogue service is the need to perform the burdensome activity of manually creating metadata by data providers or authors [7]. This task must be carried out each time a new GD is published in a SDI, and it must be periodically performed in the case of time series of geospatial data. To address this activity, we propose an original automation of the workflow for Web deployment of both GD sets and time series, and the creation and updating of metadata based on a semi-automatic procedure [8,9,10].
Furthermore, applications collecting VGI for specific citizen science projects, generally do not serve it by following OGC standard Web services: even when VGI is released as open data, one has to connect to the project’s geoportal to visualize, query and possibly download it. To analyze VGI contextually to open GD from other projects within a standard and interoperable SDI some proposals introduced a Web 2.0 broker to access and collect VGI created in social networks [11]. Our proposed solution addresses this problem from a different and complementary point of view, by designing a smart application for mobile devices, connected to the Internet, capable of creating in-situ native interoperable VGI reports. The smart application is designed and implemented to directly publish data through a SDI and to provide them to stakeholders by standard web services. This way, VGI can be visualized, queried and analyzed contextually to other open data.
A final bottleneck of current geoportals is the lack of complex functionalities that allow stakeholders to easily perform queries on both GD layers with also a temporal dimension (e.g., time series of environmental parameters) from several distinct sources without the need to bother about data format (e.g., vector or raster) and data structure [12]. This means that they violate the data independence principle of database management systems that guarantees that users can interact with data independently of the actual data format and physical structure [13]. Common OGC standard geoportals support Web Map Service (WMS), and sometimes Web Feature Service (WFS) requests, but rarely Web Map Service-Time (WMS-T) requests to retrieve information from time series. Furthermore, to our knowledge, they never provide, as query answers, graphic diagrams showing the temporal variation of the parameter in a selected location (i.e., a pixel or a portion of the geographic area) contextually to VGI for the same location as we do.
Currently, operators rely on the following workflow to perform their analysis of GD: (i) they first discover the products of interest by querying a catalogue service; (ii) they then download the GD matching their needs; (iii) further, they import the data inside a desktop Geographic Information System (GIS) to perform, often, a data transformation operation; and (iv) they apply several complex spatial analysis operations to obtain the desired results summarized in the form of graphs. These are the kind of functionalities that operators would like to perform in an easier, faster and more practical manner than the current approach for carrying out their analysis by exploiting the potentiality of Web processing services. To enable an easy user interaction, we designed an original geoportal that overcomes the above mentioned limitations of current practices by providing efficient and effective complex query facilities, which can be personalized to user’s needs and compliant with the principle of data independence.
In this paper, we first discuss the issues in creating an SDI for sharing and discovering GD (Section 2). Then, in Section 3, we illustrate the realized SDI acentric architecture integrating multisource heterogeneous GD sets and time series. Section 4 provides a description of the components of the SDI by illustrating its features: the typology of GD sets and time series, the app realized for in-situ data creation, the workflow for metadata creation and management, and, finally, the GD sets and time series discovery by the catalogue service and their fruition by the geoportal. Section 5 discusses the related works. Section 6 focuses on the conclusions drawn from the results of the experimentation and provides insights for future work.

2. Current Issues in GD Sharing and Management on the Web

The amount of GD, in-situ sensor measurements and observations, and time series of products, derived by processing multitemporal acquisition of remotely sensed images, is dramatically increasing. This trend is mainly favored by: (i) the fast diffusion of the Internet of Things (IoT), where smart devices, which are connected to the Internet and equipped with the most diversified sensors, are increasing; and (ii) the availability of operational free of charge satellite images at medium/high spatial resolution, such as NASA-MODIS (Moderate Resolution Imaging Spectroradiometer) and Landsat OLI (Operational Land Imager). The availability of free of charge satellite images will be further enlarged in the near future by the full ESA Sentinel constellation of radar and optical satellites.
From the processing and analysis of raw GD, which are provided by IoT and remote sensing, new GD products and time series are generated by researchers and ICT companies. In fact, most of those newly generated datasets are the results of scientific projects, funded to support business and social sectors, such as agriculture and food production, human safety and security, and natural hazard risk monitoring, with the aim of optimizing the economic impact of maintenance processes and policies [14].
The current most widespread and common practice to manage such data is to store them on Network Access Server (NAS) machines and to share them by means of a local Internet computer network. However, if any external user would like to discover and use these datasets, he/she will never succeed without calling the intervention of an intermediary, a technician, to provide him/her with the right data.
There are several reasons, both political and technical, that explain this situation.
First of all, researchers are reluctant to adopt best practices of GD sharing on the Web because either they do not want it, or, in the best cases, they do not feel the need to publish and share data and, mostly, they are not forced to do so by the policies of their organizations and/or donors that funded the research projects. Although GD constitute the most relevant results of their research effort, researchers are not incentivized to deliver their GD to the public without a recognition of their work or without a mandate that allow them substituting/updating the official source of information.
The technical aspects also play a key role in limiting the adoption of best practices for GD publication on the Web. Often, researchers ignore standards, established within the ICT community, and they do not have tools to facilitate GD publication in an easy and handy way.
Nevertheless, this situation is rapidly changing thanks to several factors, among which the most impacting are reported in Table 1 and hereafter discussed.
-
Legislation and new strategies entered into force with the European Directive 2007/2/EC known as INSPIRE [6] which defines a complex legislative framework for the establishment of an INfrastructure for SPatial InfoRmation in Europe to improve usability of GD to support environmental protection and sustainable development policies. Another Directive 2003/98/EC, known as the 'PSI Directive', focuses on the economic aspects of the re-use of information and it encourages Member States to make as much information available for reuse as possible [15]. European Commission also supports Open data initiative, which refers to the idea that datasets created with the support of public funding should be freely available for use, and more precisely re-use [20]. The Commission's work is focusing on generating value through re-use of a specific type of data—public sector data, and government data. Another area, which has recently gained high interest by the European political scene, is related to exploiting Big Data [21] for supporting and accelerating the transition towards a data-driven economy. The data-driven economy will stimulate research and innovation on data while leading to more business opportunities and to increased availability of knowledge and capital, in particular for SMEs, across Europe.
-
Standardization activities of both the World Wide Consortium (W3C) [22] and the Open Geospatial Consortium (OGC) [23] who announced, at the beginning of 2015, a new collaboration to improve interoperability and integration of GD on the Web. GD describing geographic locations on Earth and natural and anthropic features significantly enriches location-based consumer services, online maps, news, scientific research, government administration, and many other applications. OGC standards support interoperable solutions for the Geo-Web, wireless and location-based services, and mainstream IT “geo-enabled” applications. Bridging GIS systems and the Web will create a network effect that enriches both worlds.
-
Increasing trend of available free and open software can significantly facilitate GD handling processes. Open software is perhaps the most well-known aspect of open GIS. Indeed, open source software is one of the methodological driving forces behind the paradigm of open science [24].
-
Decreasing trend of market prices for hardware resources can also favor investments: nowadays, a computer, which would be sufficient to deploy a GD node on the Internet from a medium research institute, can be purchased at low cost.
If, on the one hand, the publication of GD sets on the Web, single static thematic product or time series, is becoming more and more diffused, on the other hand, very few issues have focused on the problem of GD metadata creation and publication. Metadata as descriptive information about data [25], contain information that can be used for discovering existing data of potential interest to users, understanding the semantic content of data, and thus taking decisions on data fitness for use. Thus, GD metadata represent a very important complement to each GD set and time series, because it serves as its promotion material. Discovery can be performed by querying metadata subparts, such as spatial, thematic and temporal coverage, t how to access it and what property rights may apply. Standardized metadata ensure that the data will be discoverable and reusable on a broader scale, and not only for the project internal purposes. Nevertheless, the importance of metadata is not always understood by data providers, who regard metadata creation as an additional burden for them, especially if the number of datasets increases and most of the information available in metadata must be repeated.

3. Spatial Data Infrastructure Design

Our approach to publish GD and to create their metadata has been designed within the Space4Agri (S4A) project (the project Web site can be seen at [26]), an Italian project funded jointly by CNR (Consiglio Nazionale delle Ricerche) and Lombardy Region to develop innovative methodologies for the integration of Earth Observation (EO) products into monitoring activities for the agricultural sector in Lombardy. S4A has the objective of answering the needs, arising at the regional level, for the agro-food sector to support efficient and effective ways of planning and managing cropping systems, water stress and impacts of climate change affecting the territory [27]. To this aim, an OGC standard SDI was designed for managing geospatial and mainstream information produced within the project from three types of data sources, namely:
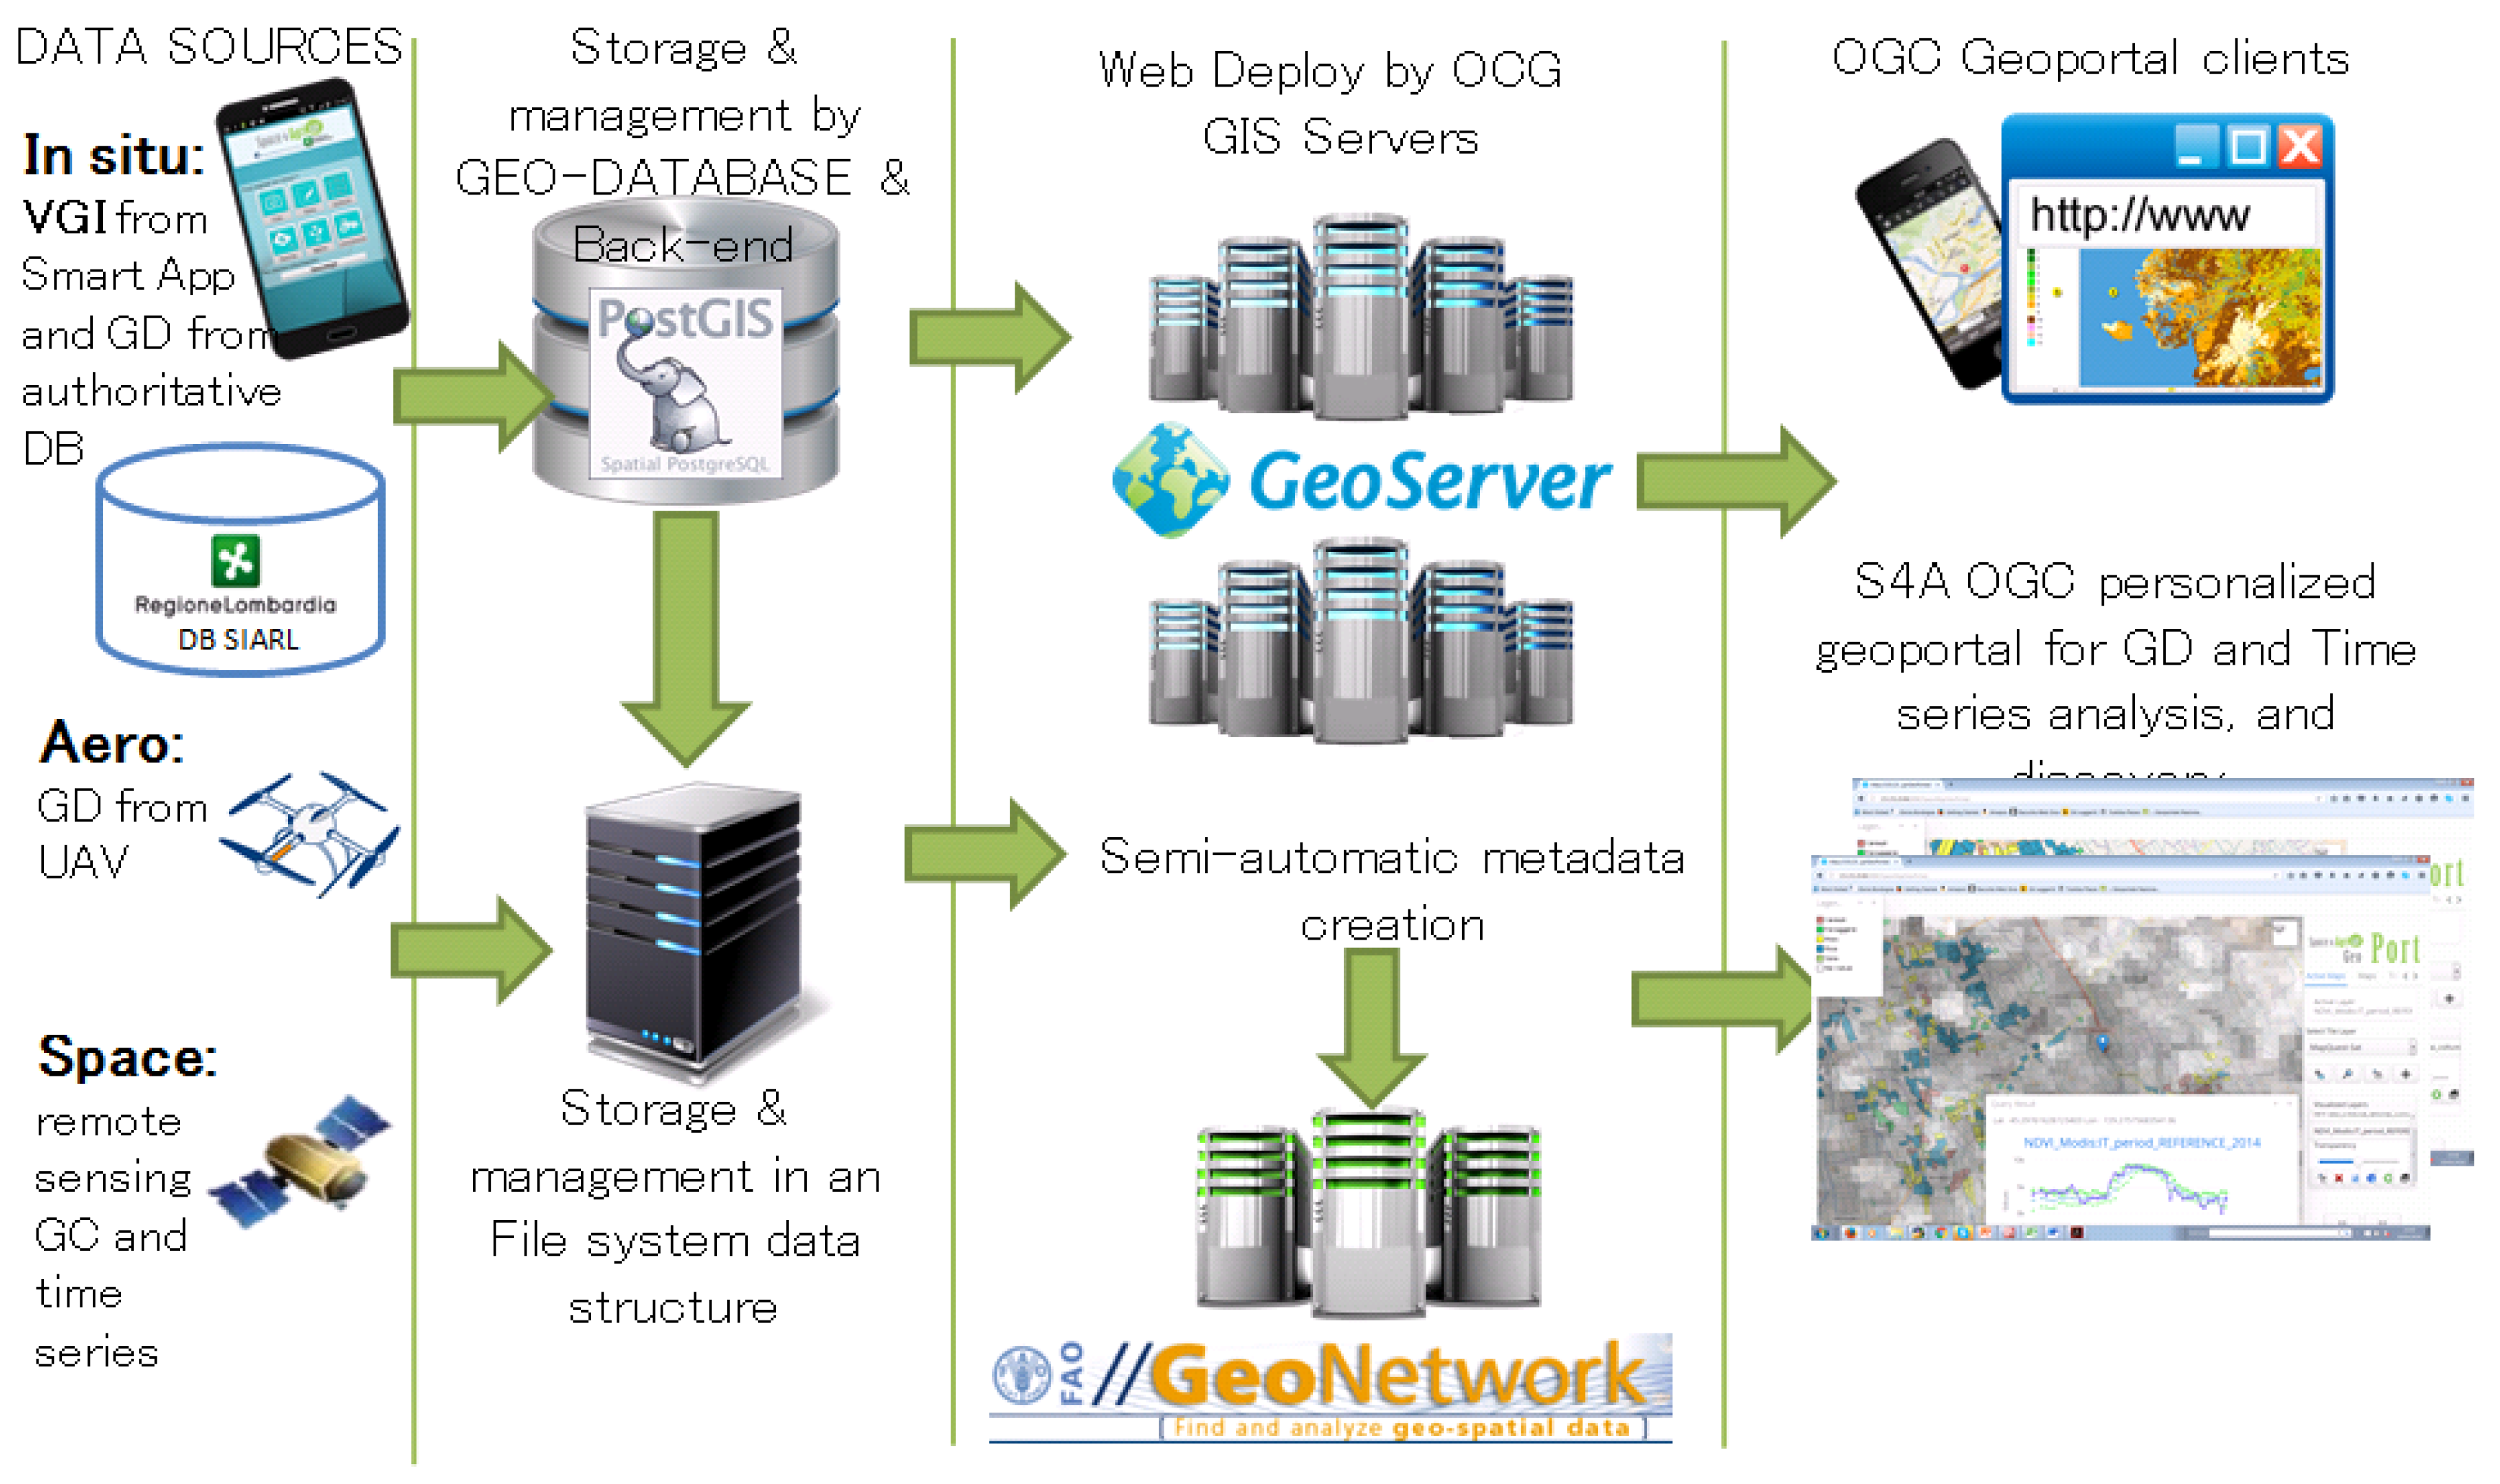
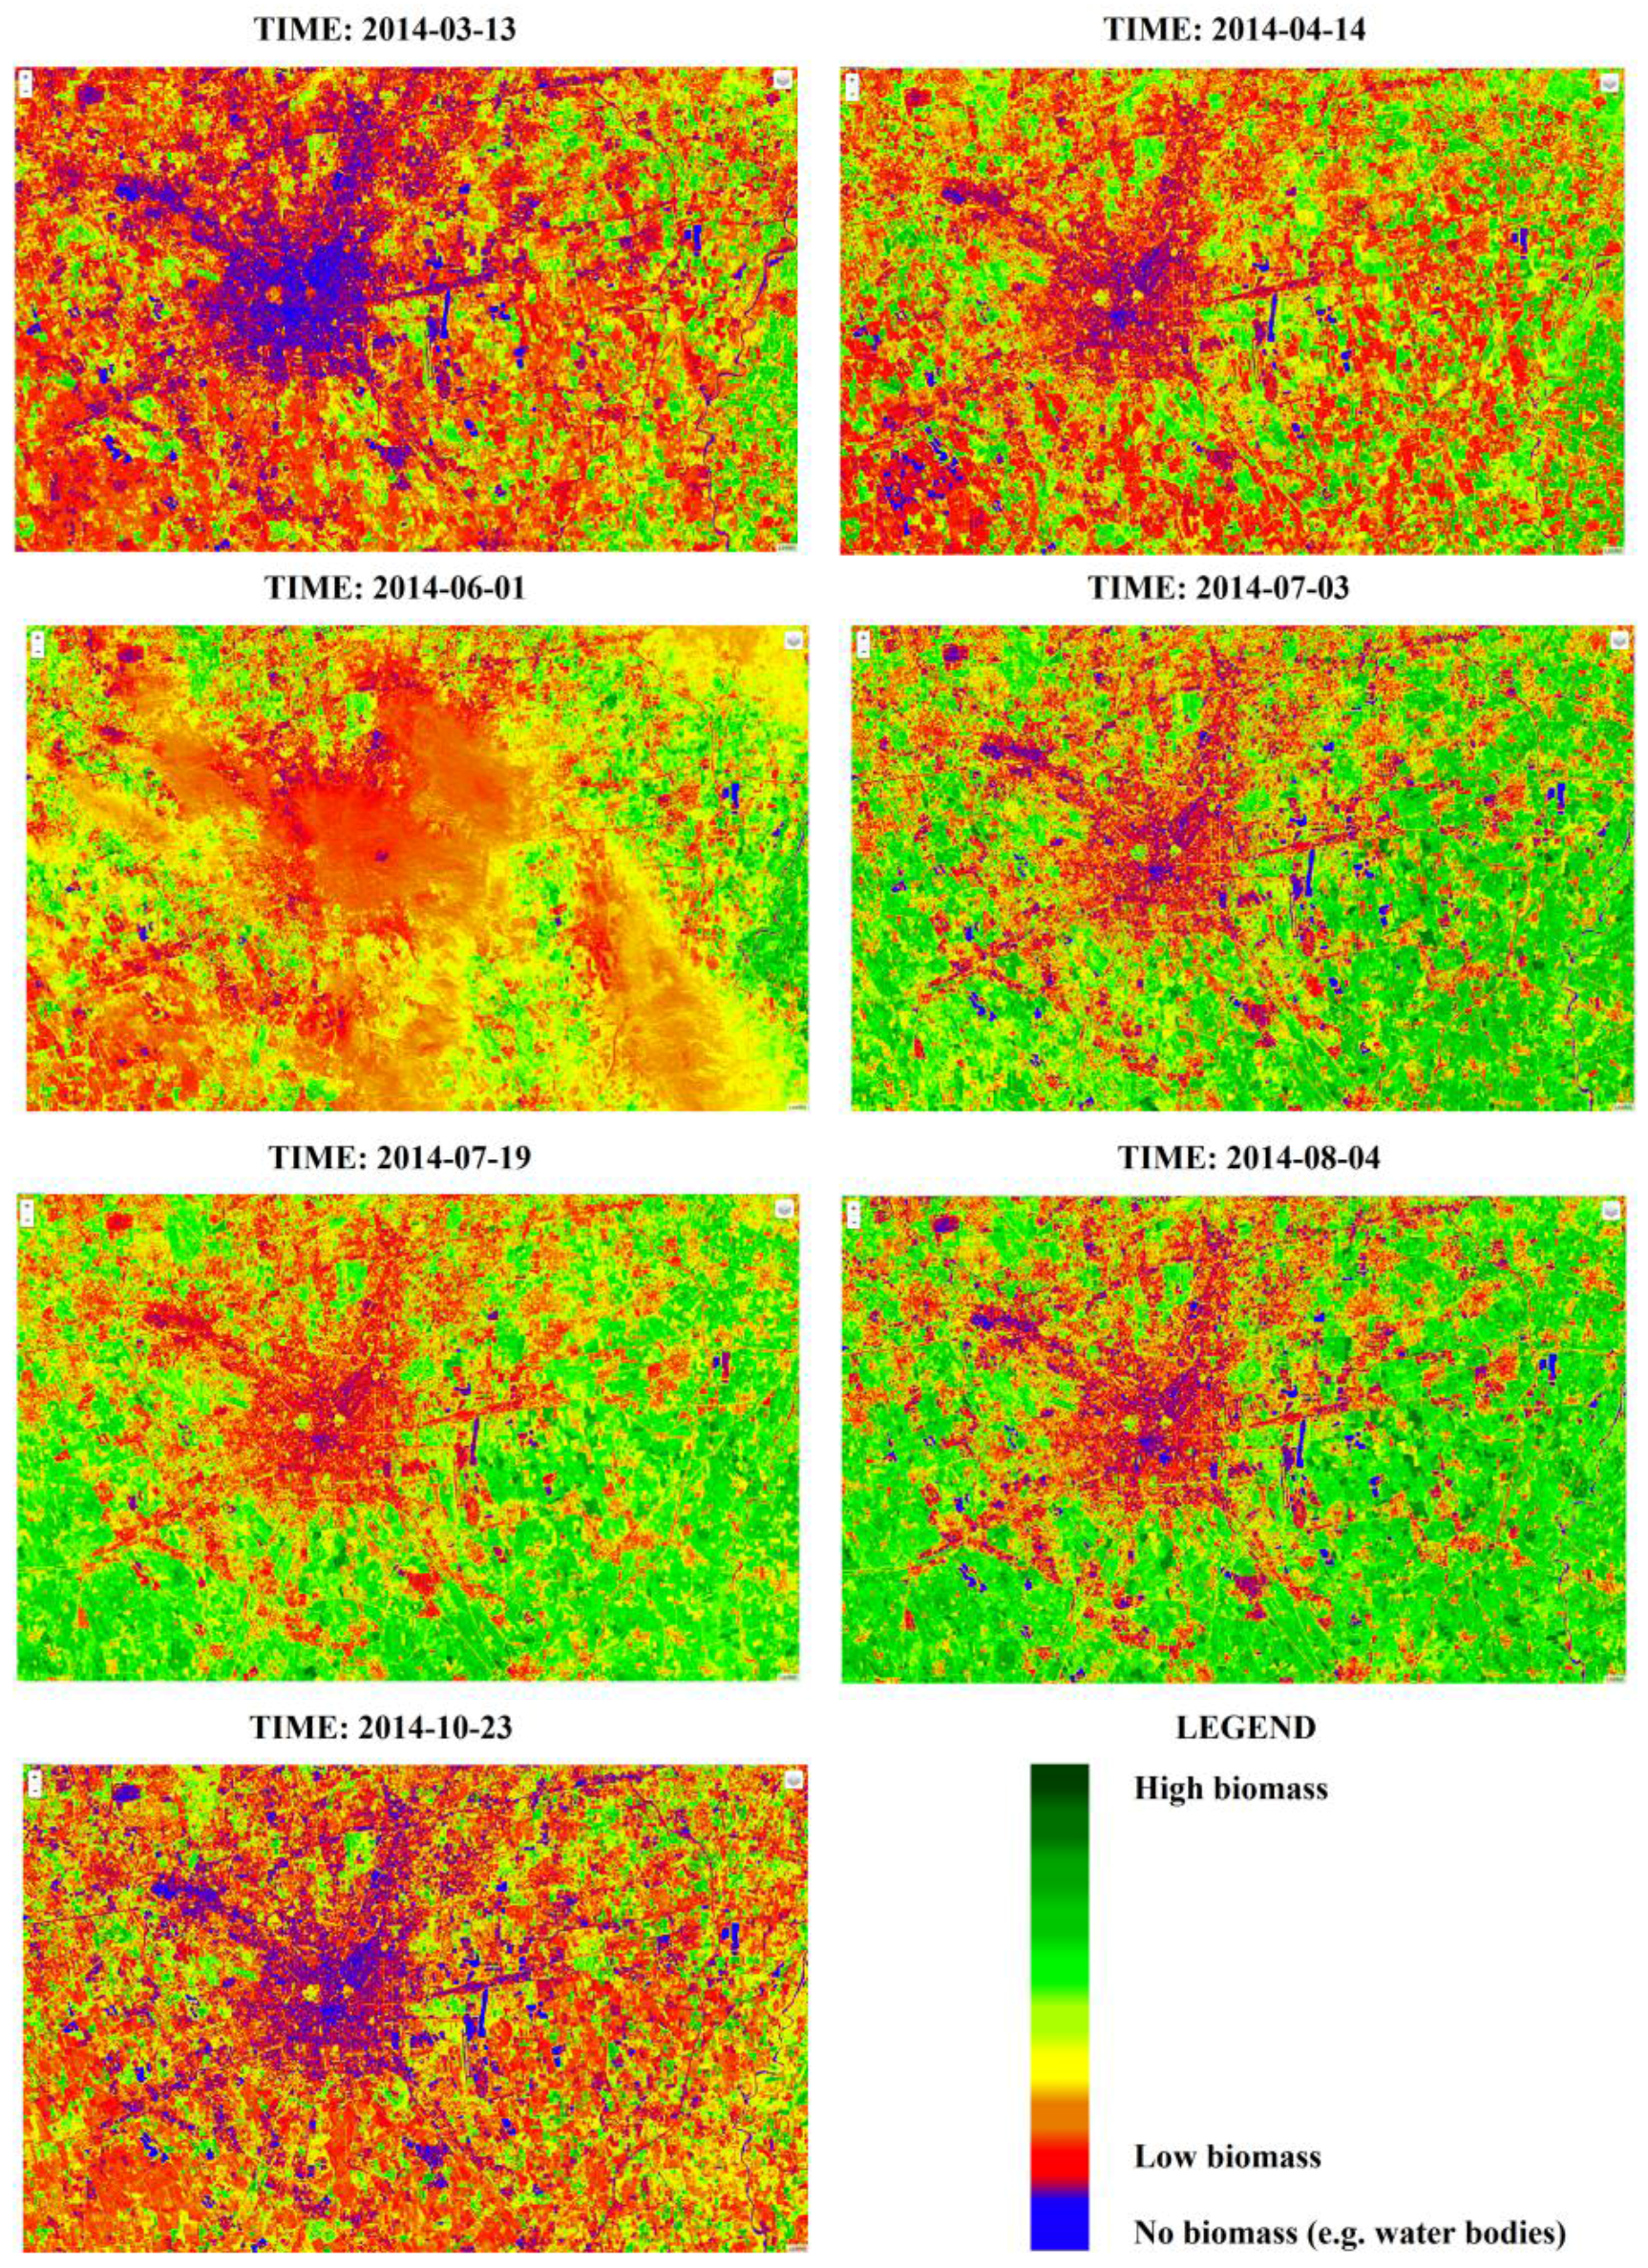
  • space, i.e., time series of multispectral satellite images for monitoring crop conditions and crop growing;
  • aero, i.e., one/few image(s) acquired by drones for monitoring crop conditions at the local scale for precision agriculture applications and/or to further investigate anomalous condition identified by satellite analysis; and
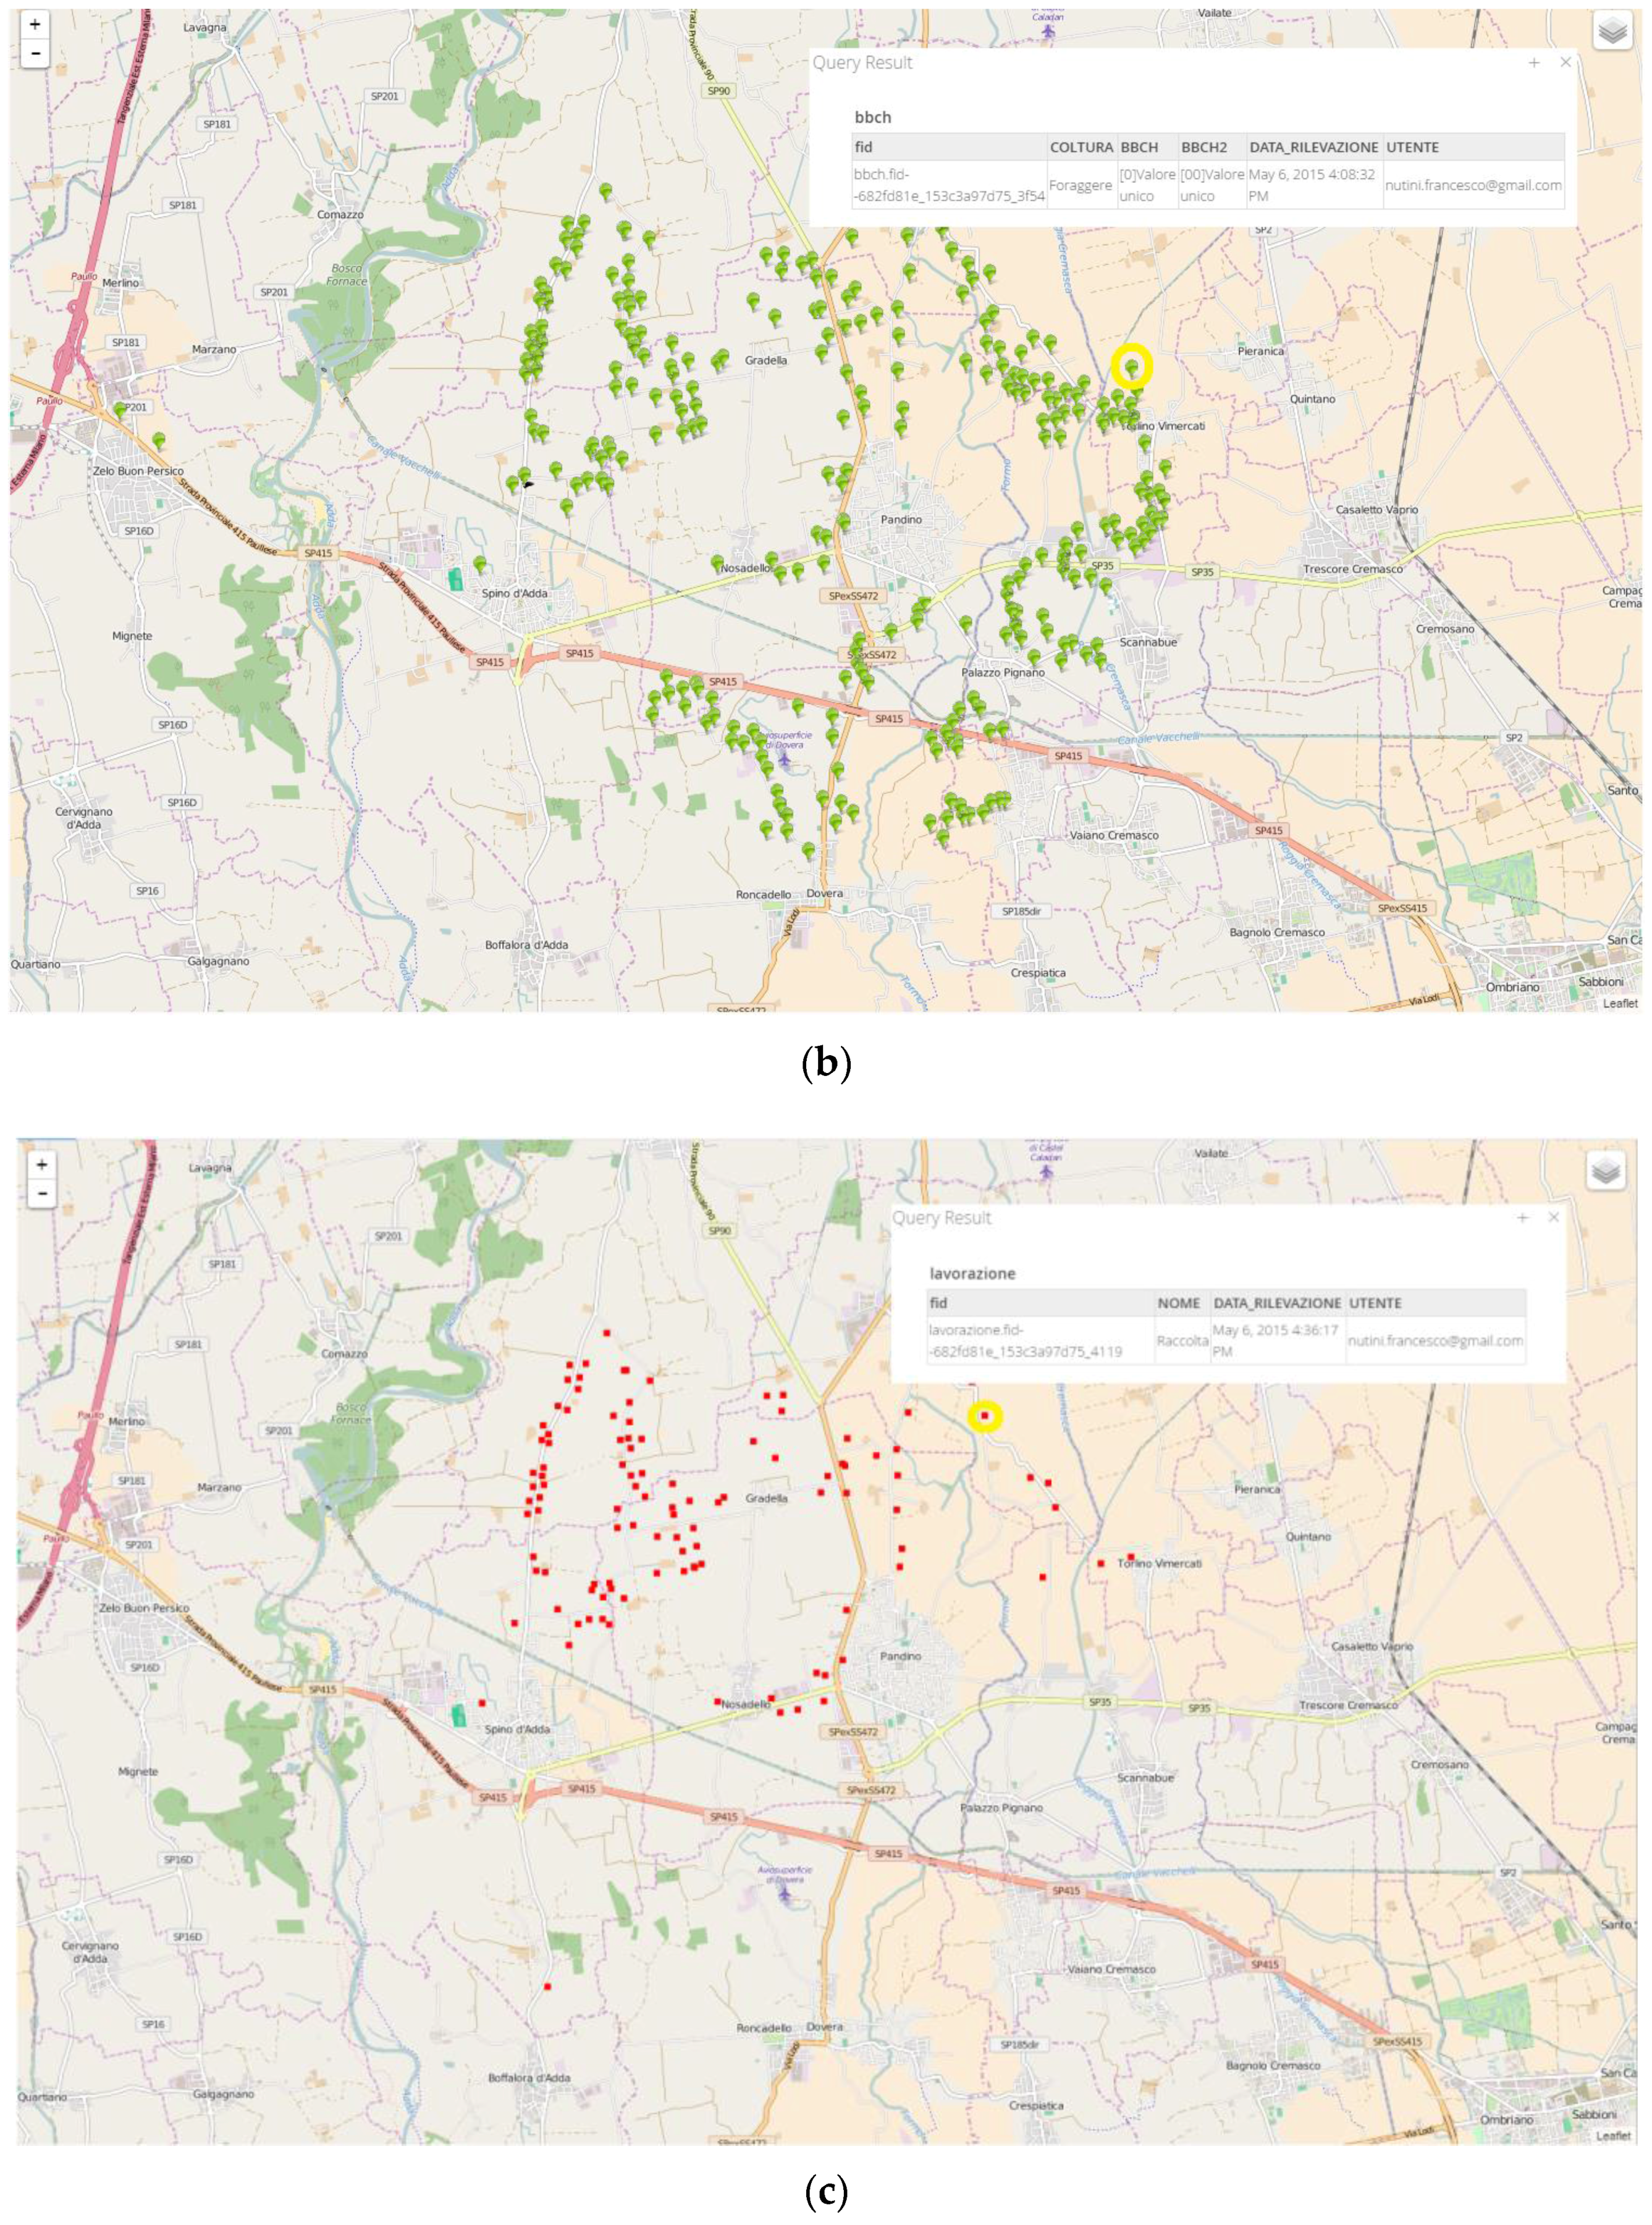
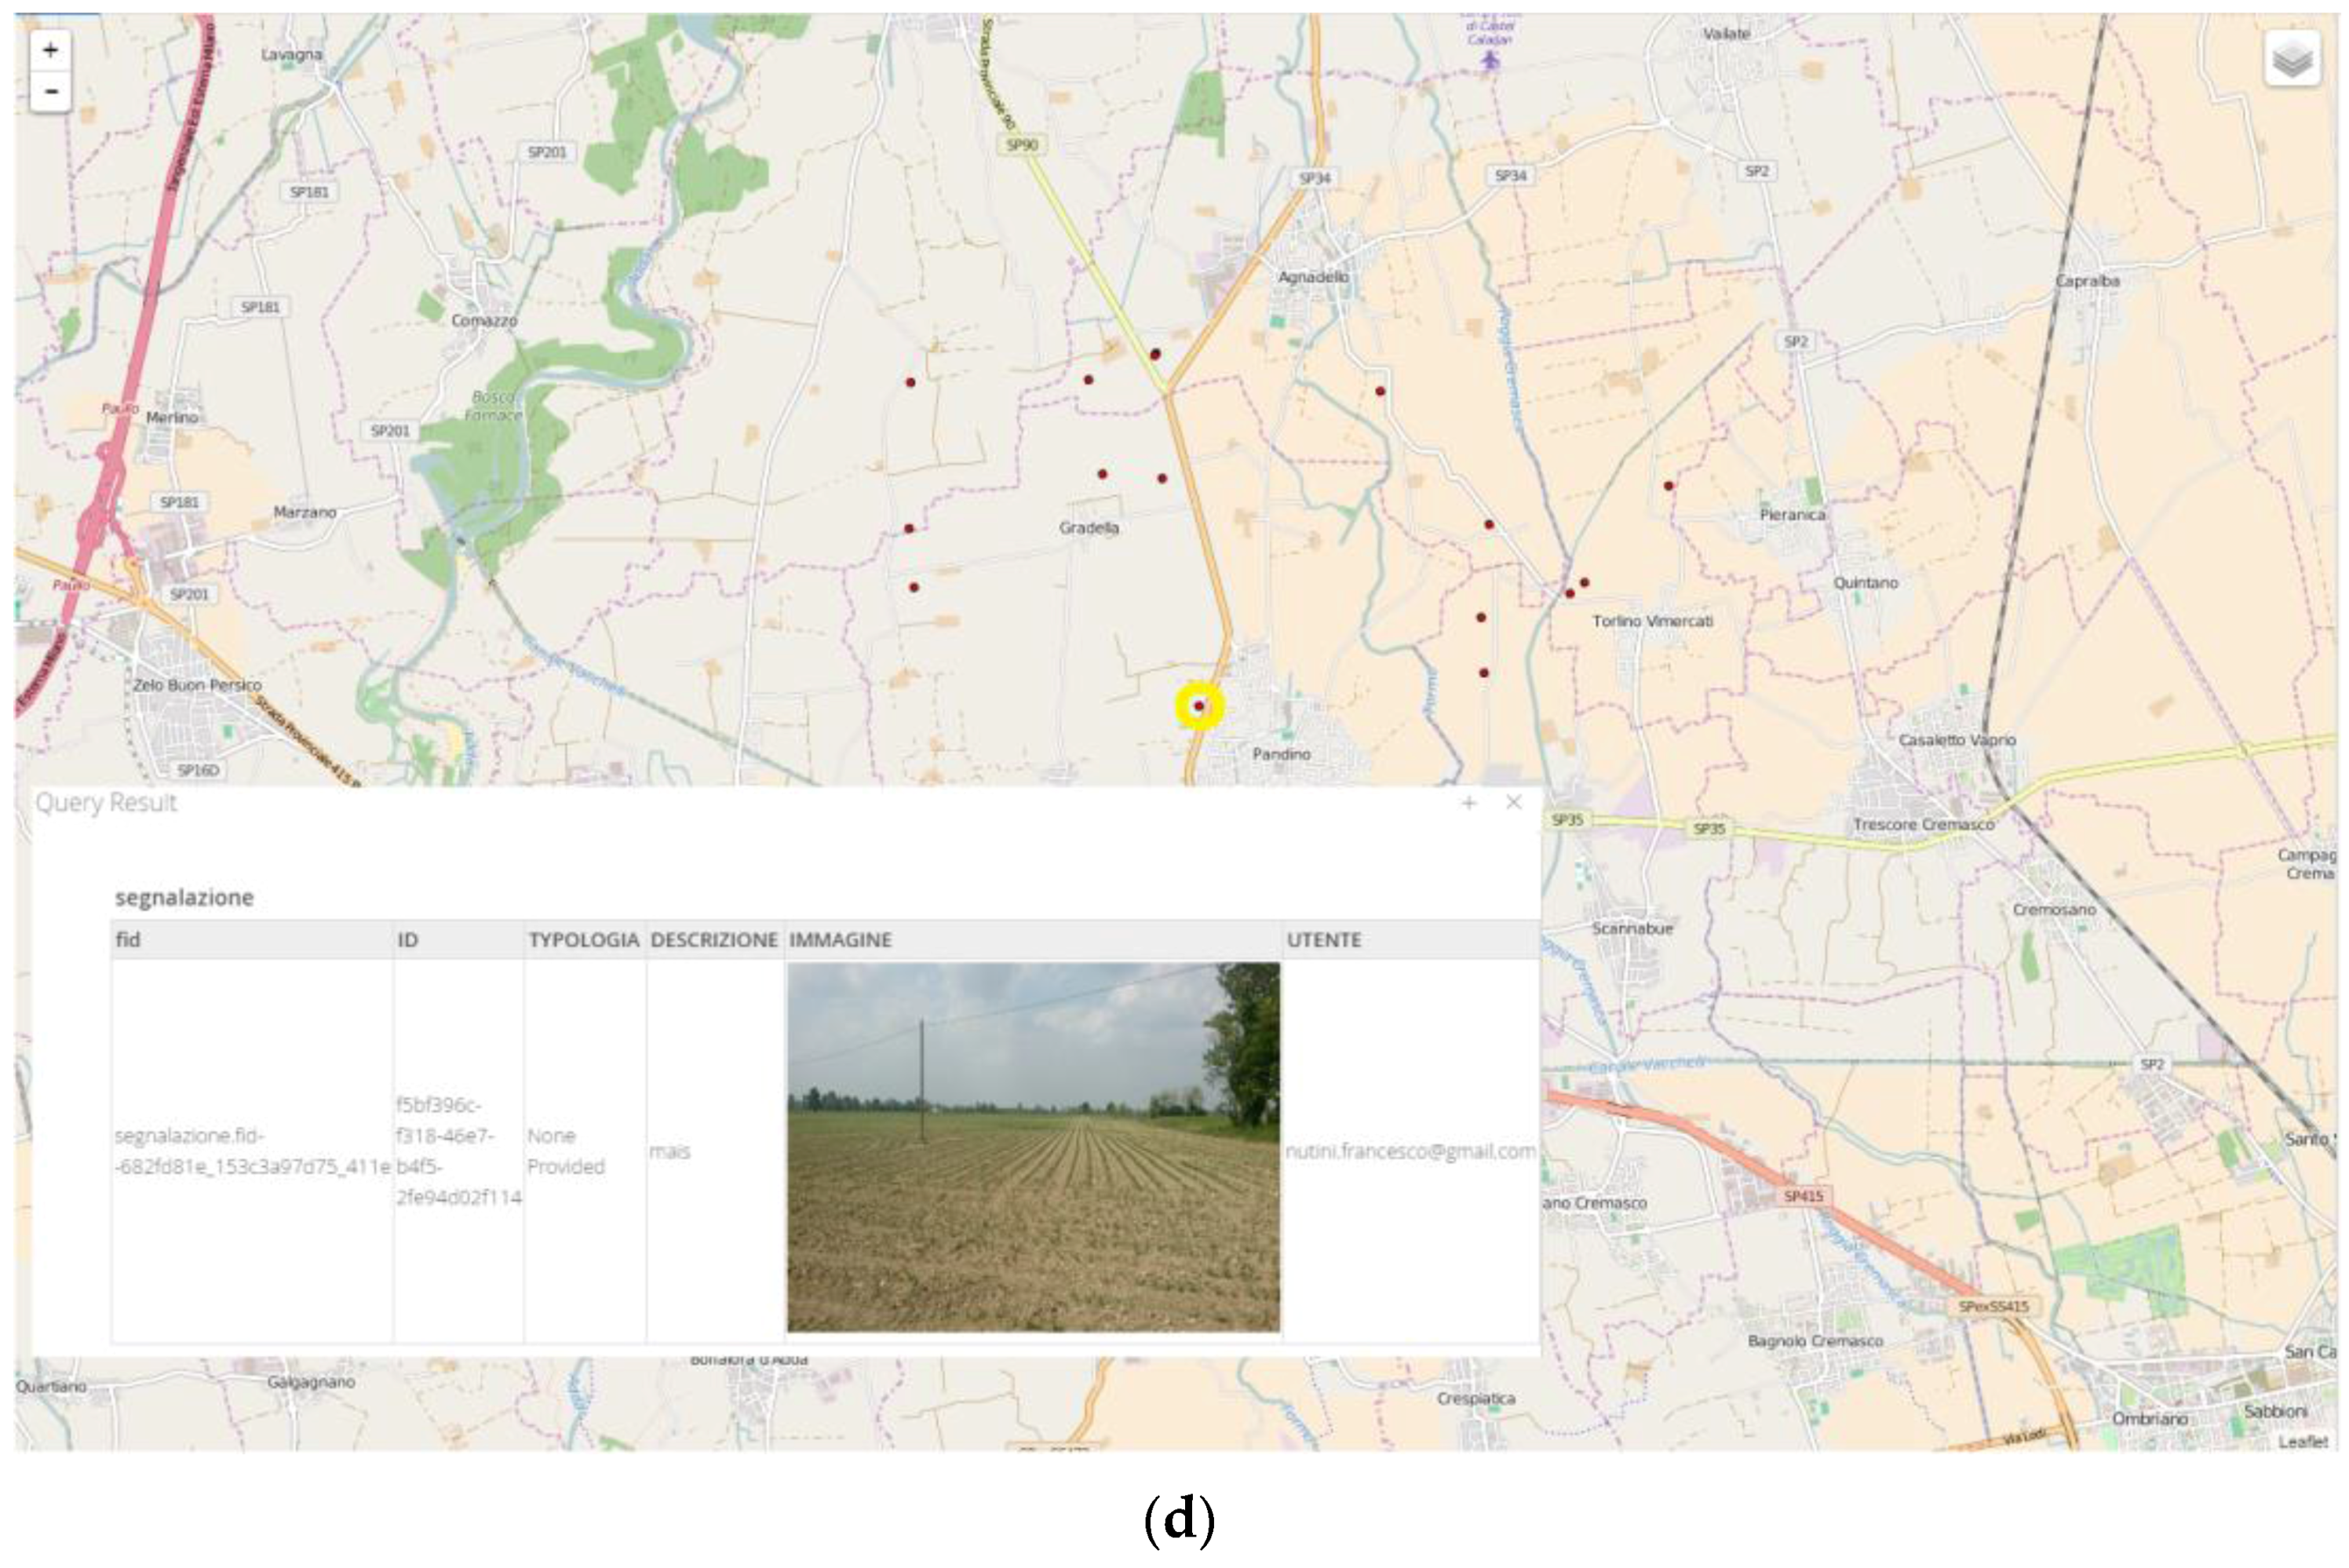
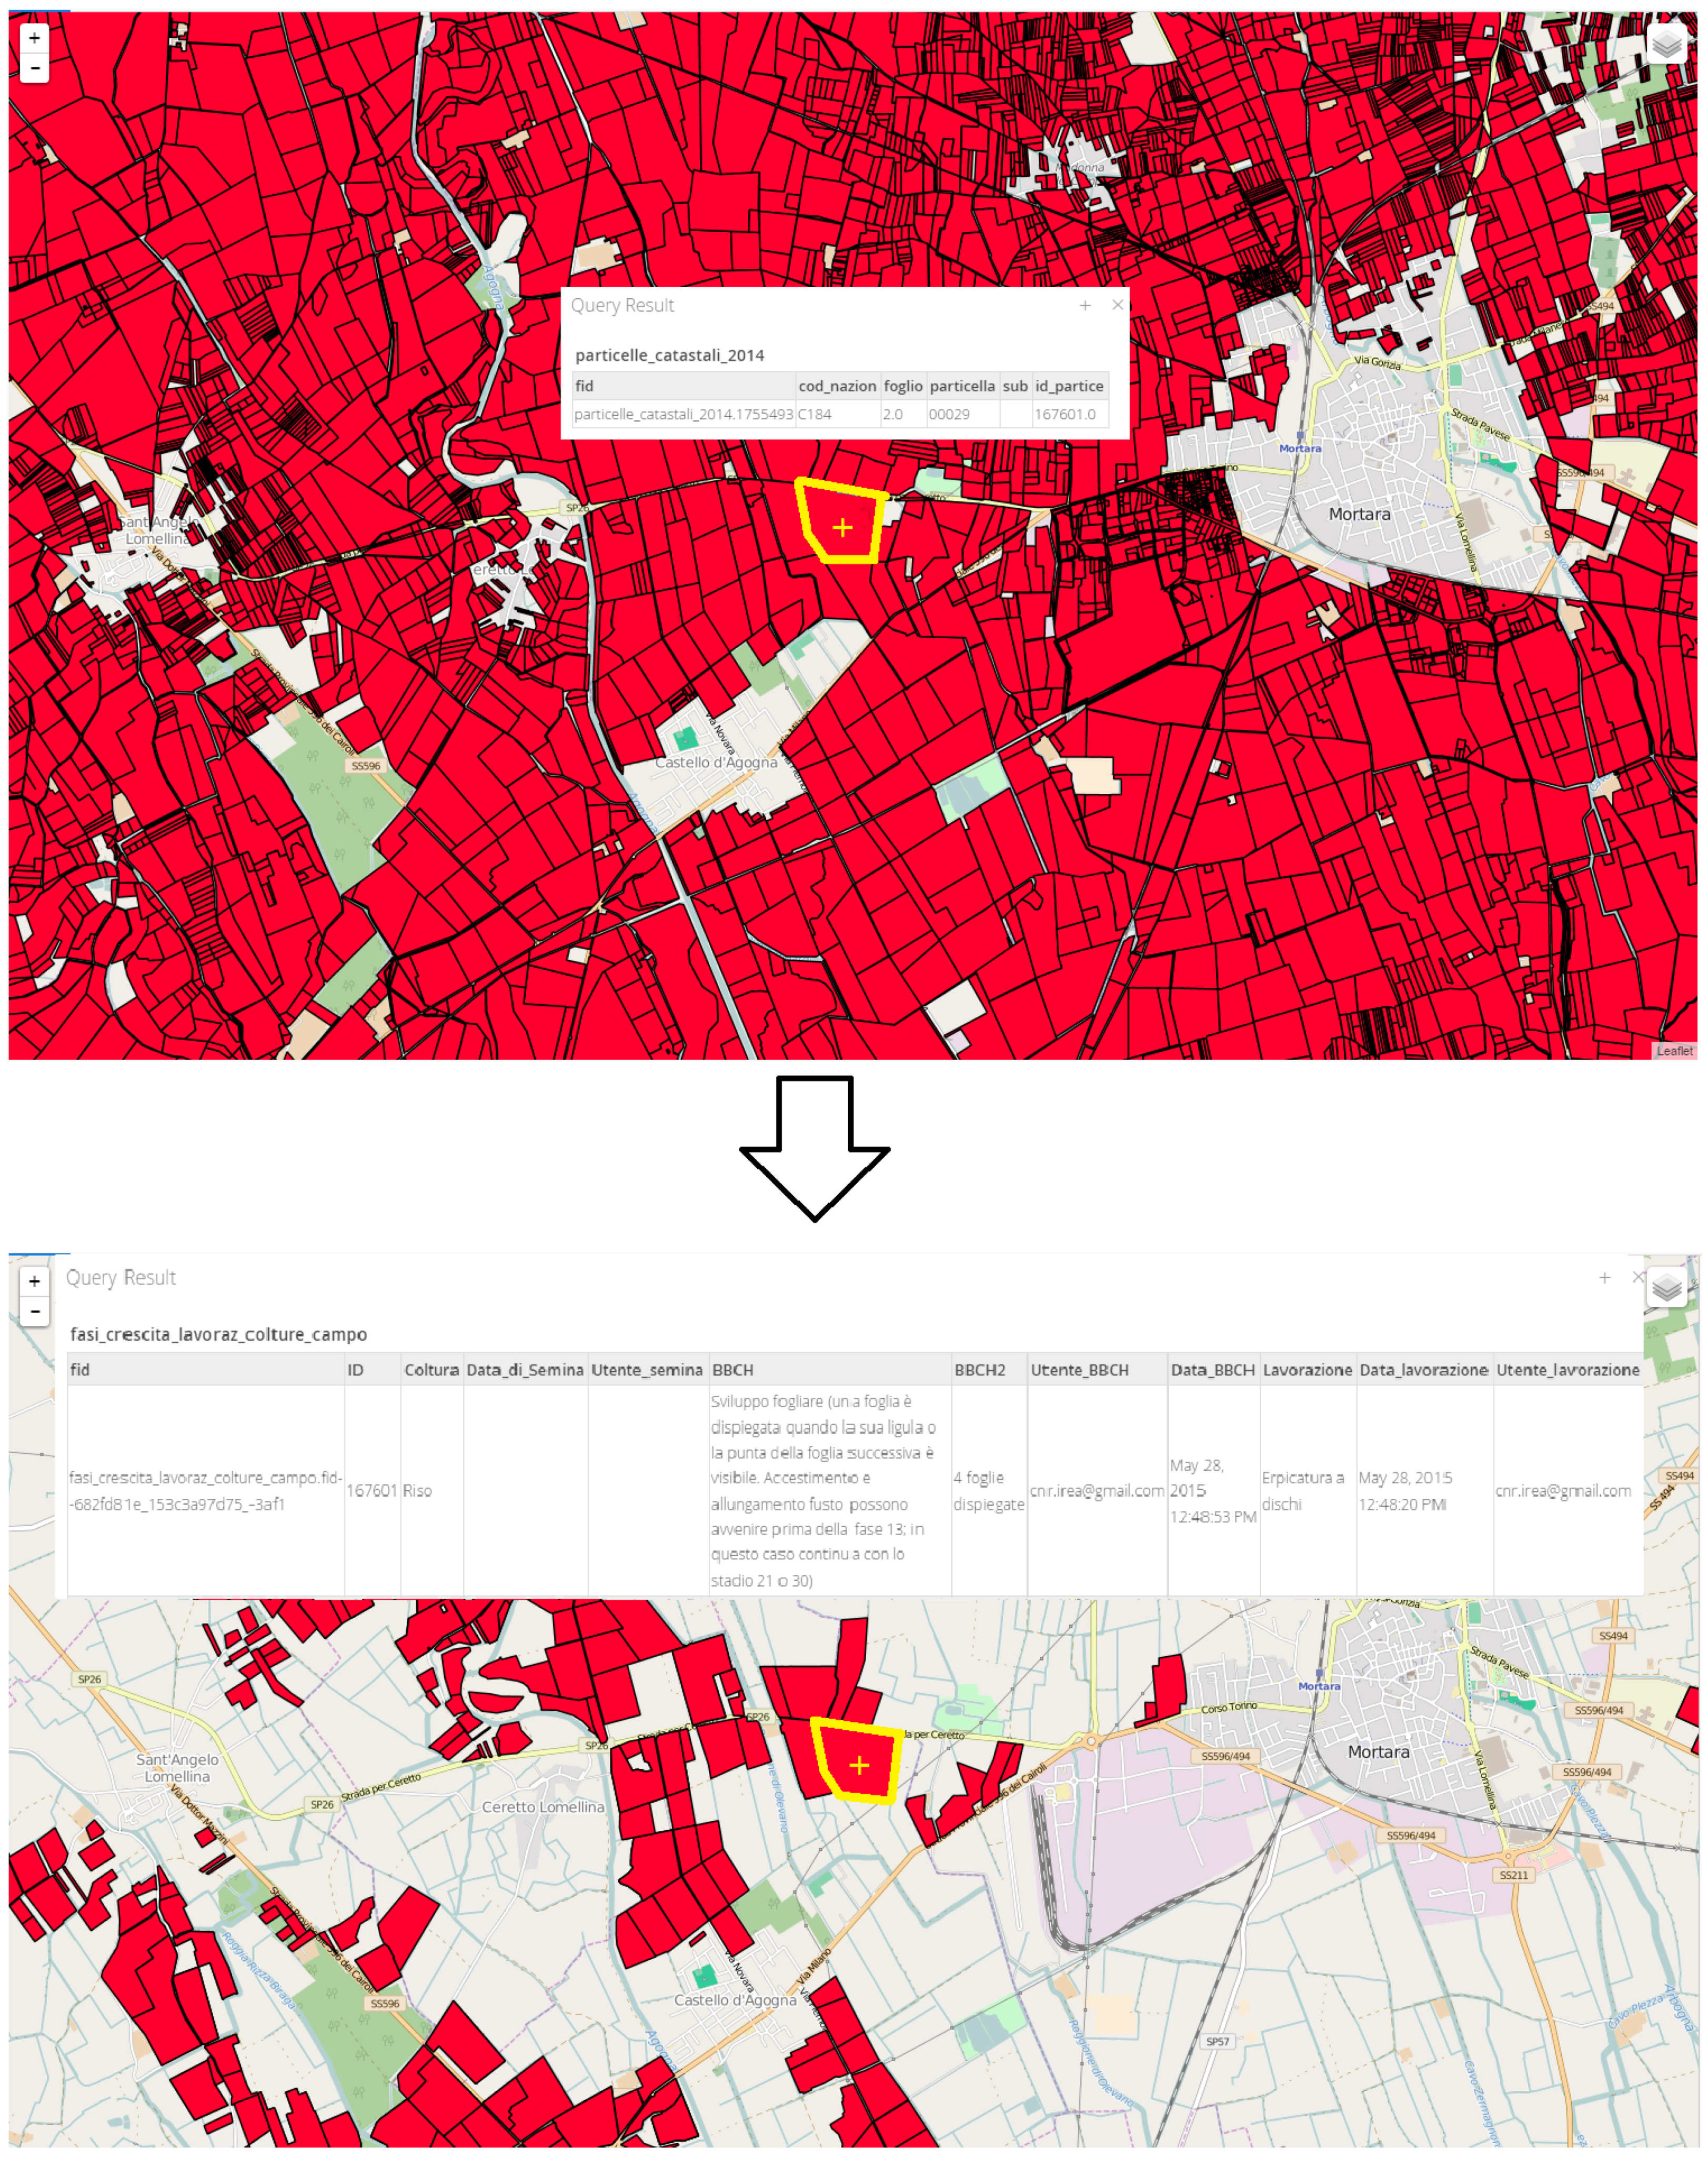
  • in-Situ, i.e., time series of data from automatic (i.e., meteo stations) and human sensors such as periodic observations from authoritative field operators (i.e., agronomists, Lombardy Region experts) or volunteers (i.e., citizens or farmers) equipped with a smart applications. These in-situ data are dynamically joined to official GD derived from both the Lombardy Region agronomic database “Sistema Informativo Agronomico Regione Lombardia” (SIARL), [27] and the cadastral database.
The GD sets and time series originated by these three sources plus the official ones are exposed on the Internet in a distributed decentralized architecture depicted in Figure 1 and managed in an integrated and interoperable way by the S4A SDI, implemented on open source software.
PostgreSQL [28] extended with PostGIS [29] is an open source geo-database with an object relational data model that has been installed to store all the in-situ and authoritative GD sets.
Geoserver [30] is a Web GIS server that has been installed in distinct Web servers for deploying GD sets and time series from the three distinct sources, space, aero and in-situ, in a scalable way. This partition on distinct machines allows an efficient management of the project’s GD and time series and a partial parallelization of access processes to the data by OGC clients geoportals that can interact by the standard OGC WMS, WMS-T and WFS web services. As the GD of the project increases, and the performance of the access degrades, new Geoserver installations can be set up.
Geonetwork [31] is used to provide the discovery facility to consumers interested in exploring the available S4A GD datasets and time series through the catalogue service that manages all the metadata of the GD sets and time series. As will be described in the following section, a semiautomatic process has been designed and developed to create the GD metadata.
Finally, even if in principle the access to the S4A GD sets and time series can be performed by any OGC standard client geoportal such as the open source GIS (QGIS [32]), within the S4A project, an original geoportal has been developed that can provide guided and personalized Web mapping and complex spatial analysis facilities defined to satisfy and ease specific use cases. It allows saving the user’s personal preferences for given GD layers and time series, and a personal bounding box of the area of interest. Further, besides the basic mapping functions to view the retrieved GD layers in overlay mode, it provides the additional functionalities for:
  • automatically listing all available DG and time series published timely on the SDI without the need of accessing the catalogue to retrieve them;
  • spatially exploring the active GD layers and time series such as the ability to spatially query multiple heterogeneous and multisource active layers with a single query;
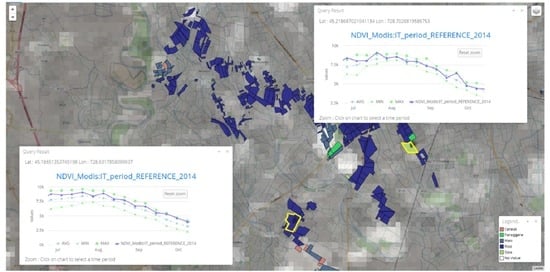
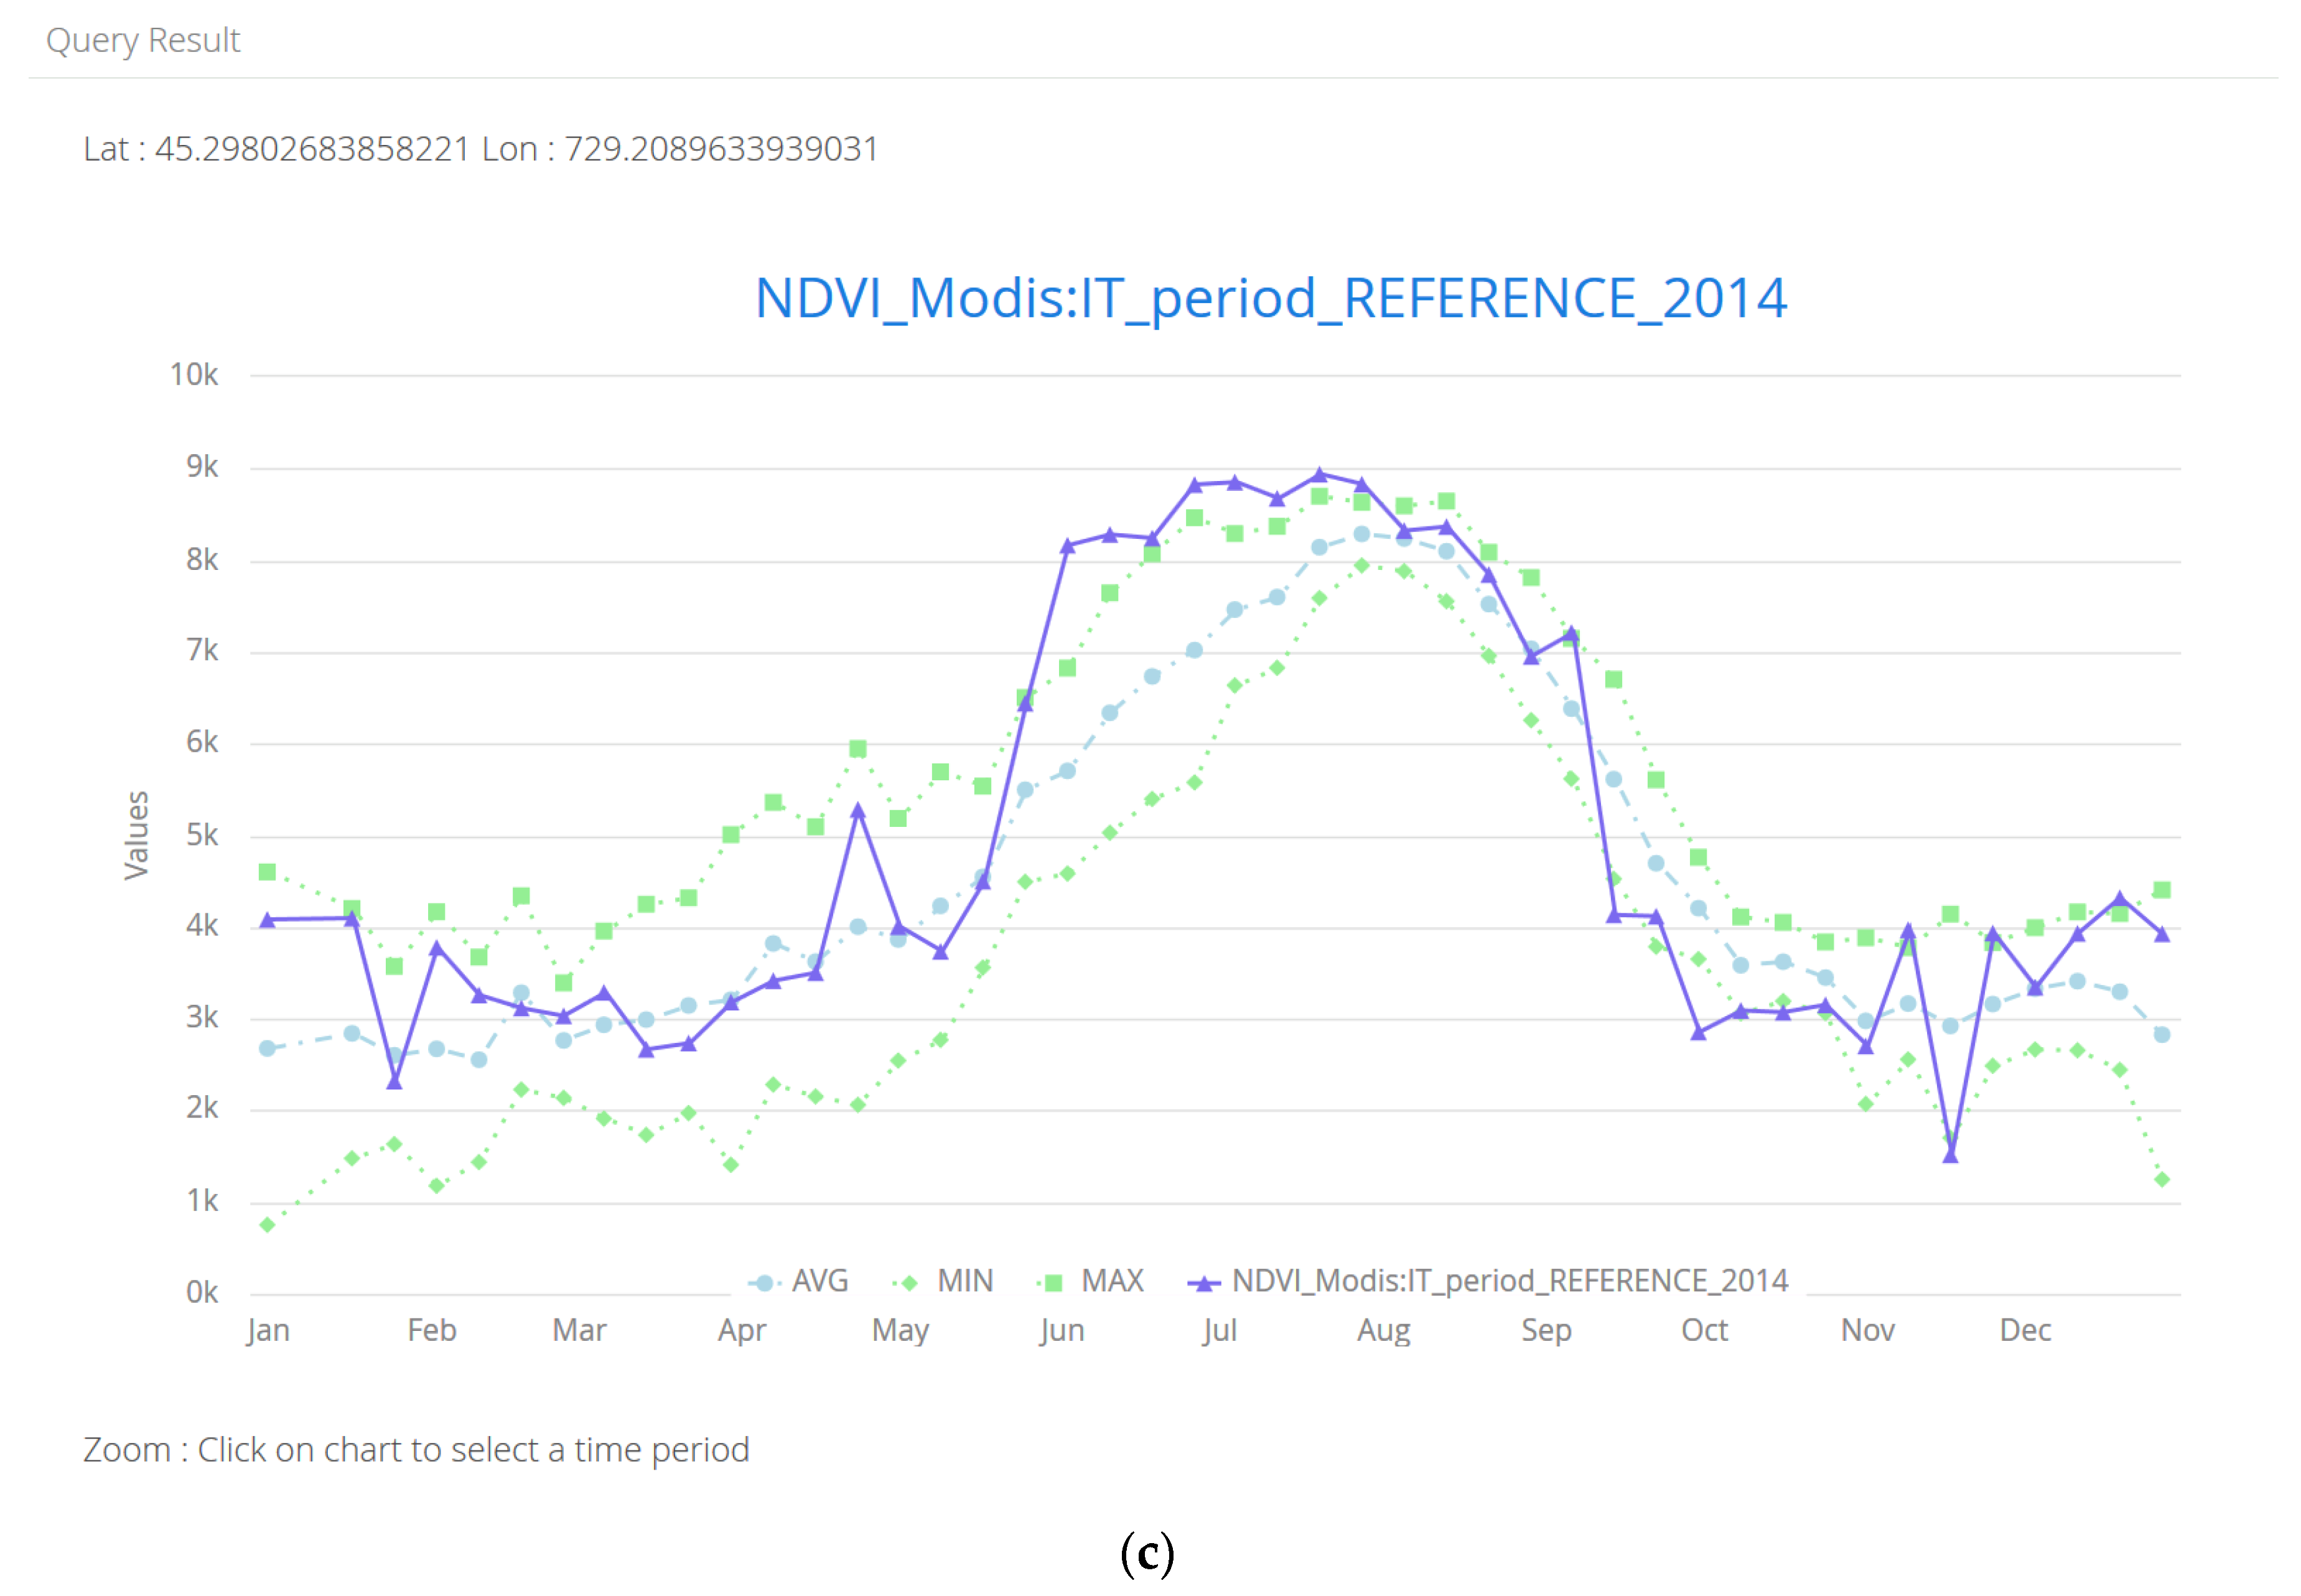
  • analyzing and producing diagrams of the GD time series trend in time and space so as to be able to enhance local anomalies and correlations with other heterogonous multisource GD; and
  • performing the discovery of S4A GD sets and time series to understand their semantics and quality through a link to the geo-catalogue service.

4. SDI Components

4.1. GD Sets and Time Series

The EO GD products are in raster format with distinct spatial and temporal resolution derived from distinct satellite optical sensors, such as NASA-MODIS (Moderate Resolution Imaging Spectroradiometer)—daily revisit and 250 m pixel size—and Landsat-OLI (Operational Land Imager) and Landsat-TM (Thematic Mapper)—16 days revisit and 30 m pixel size—EO products comprise time series for the time period ranging from 2003 (2014) to 2015 for MODIS (Landsat) imageries of vegetation indices useful for crop monitoring activities: Normalized Difference Vegetation Index (NDVI; [33]), Enhanced Vegetation Index (EVI; [34]), Red Green Ratio Index (RGRI; [35]), and Normalized Difference Flood Index (NDFI; [36]).
The authoritative GD data are in vector format and comprise official cadastral maps of farm estate parcels and related agronomic information, i.e., crop type based on farmer declarations and automatically derived from the database of Lombardy Region (SIARL) for the years preceding the current season.
The in-situ GD data in vector format, indeed, consisting of VGI, have been created by expert agronomists, researchers and farmers involved in the project through the use of the S4A Smart App installed on their Android mobile devices (Figure 2 depicts the work flow of the data created by the S4A smart App).

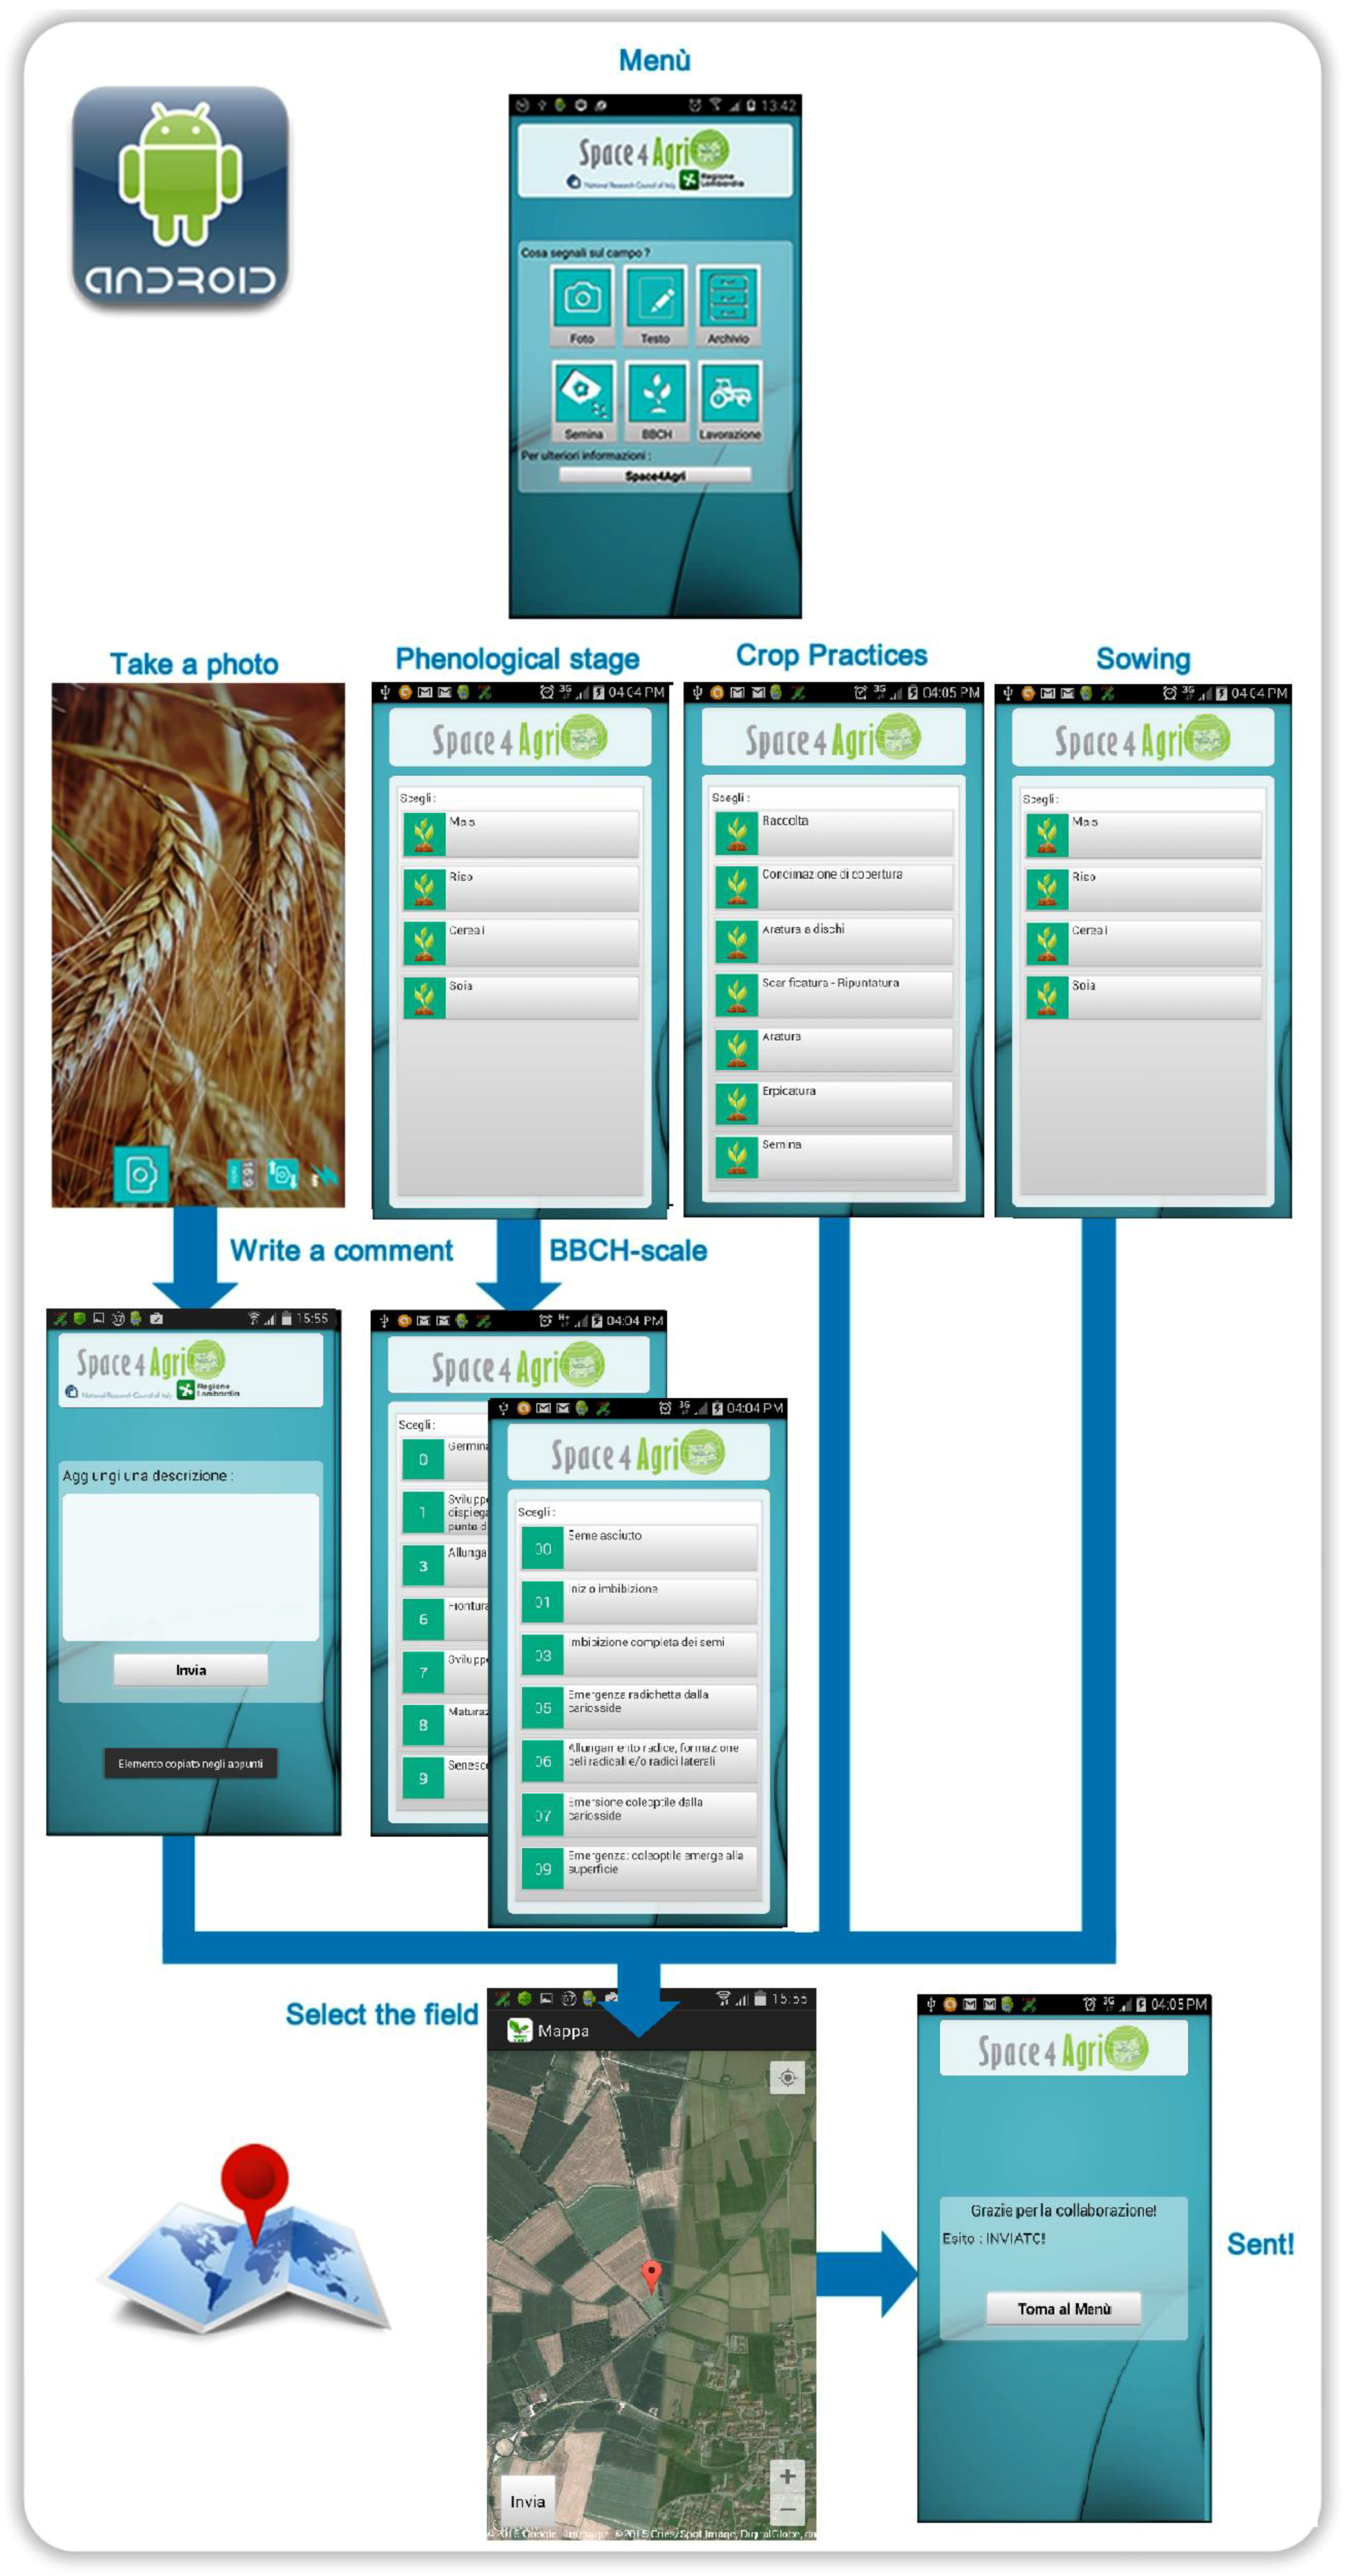
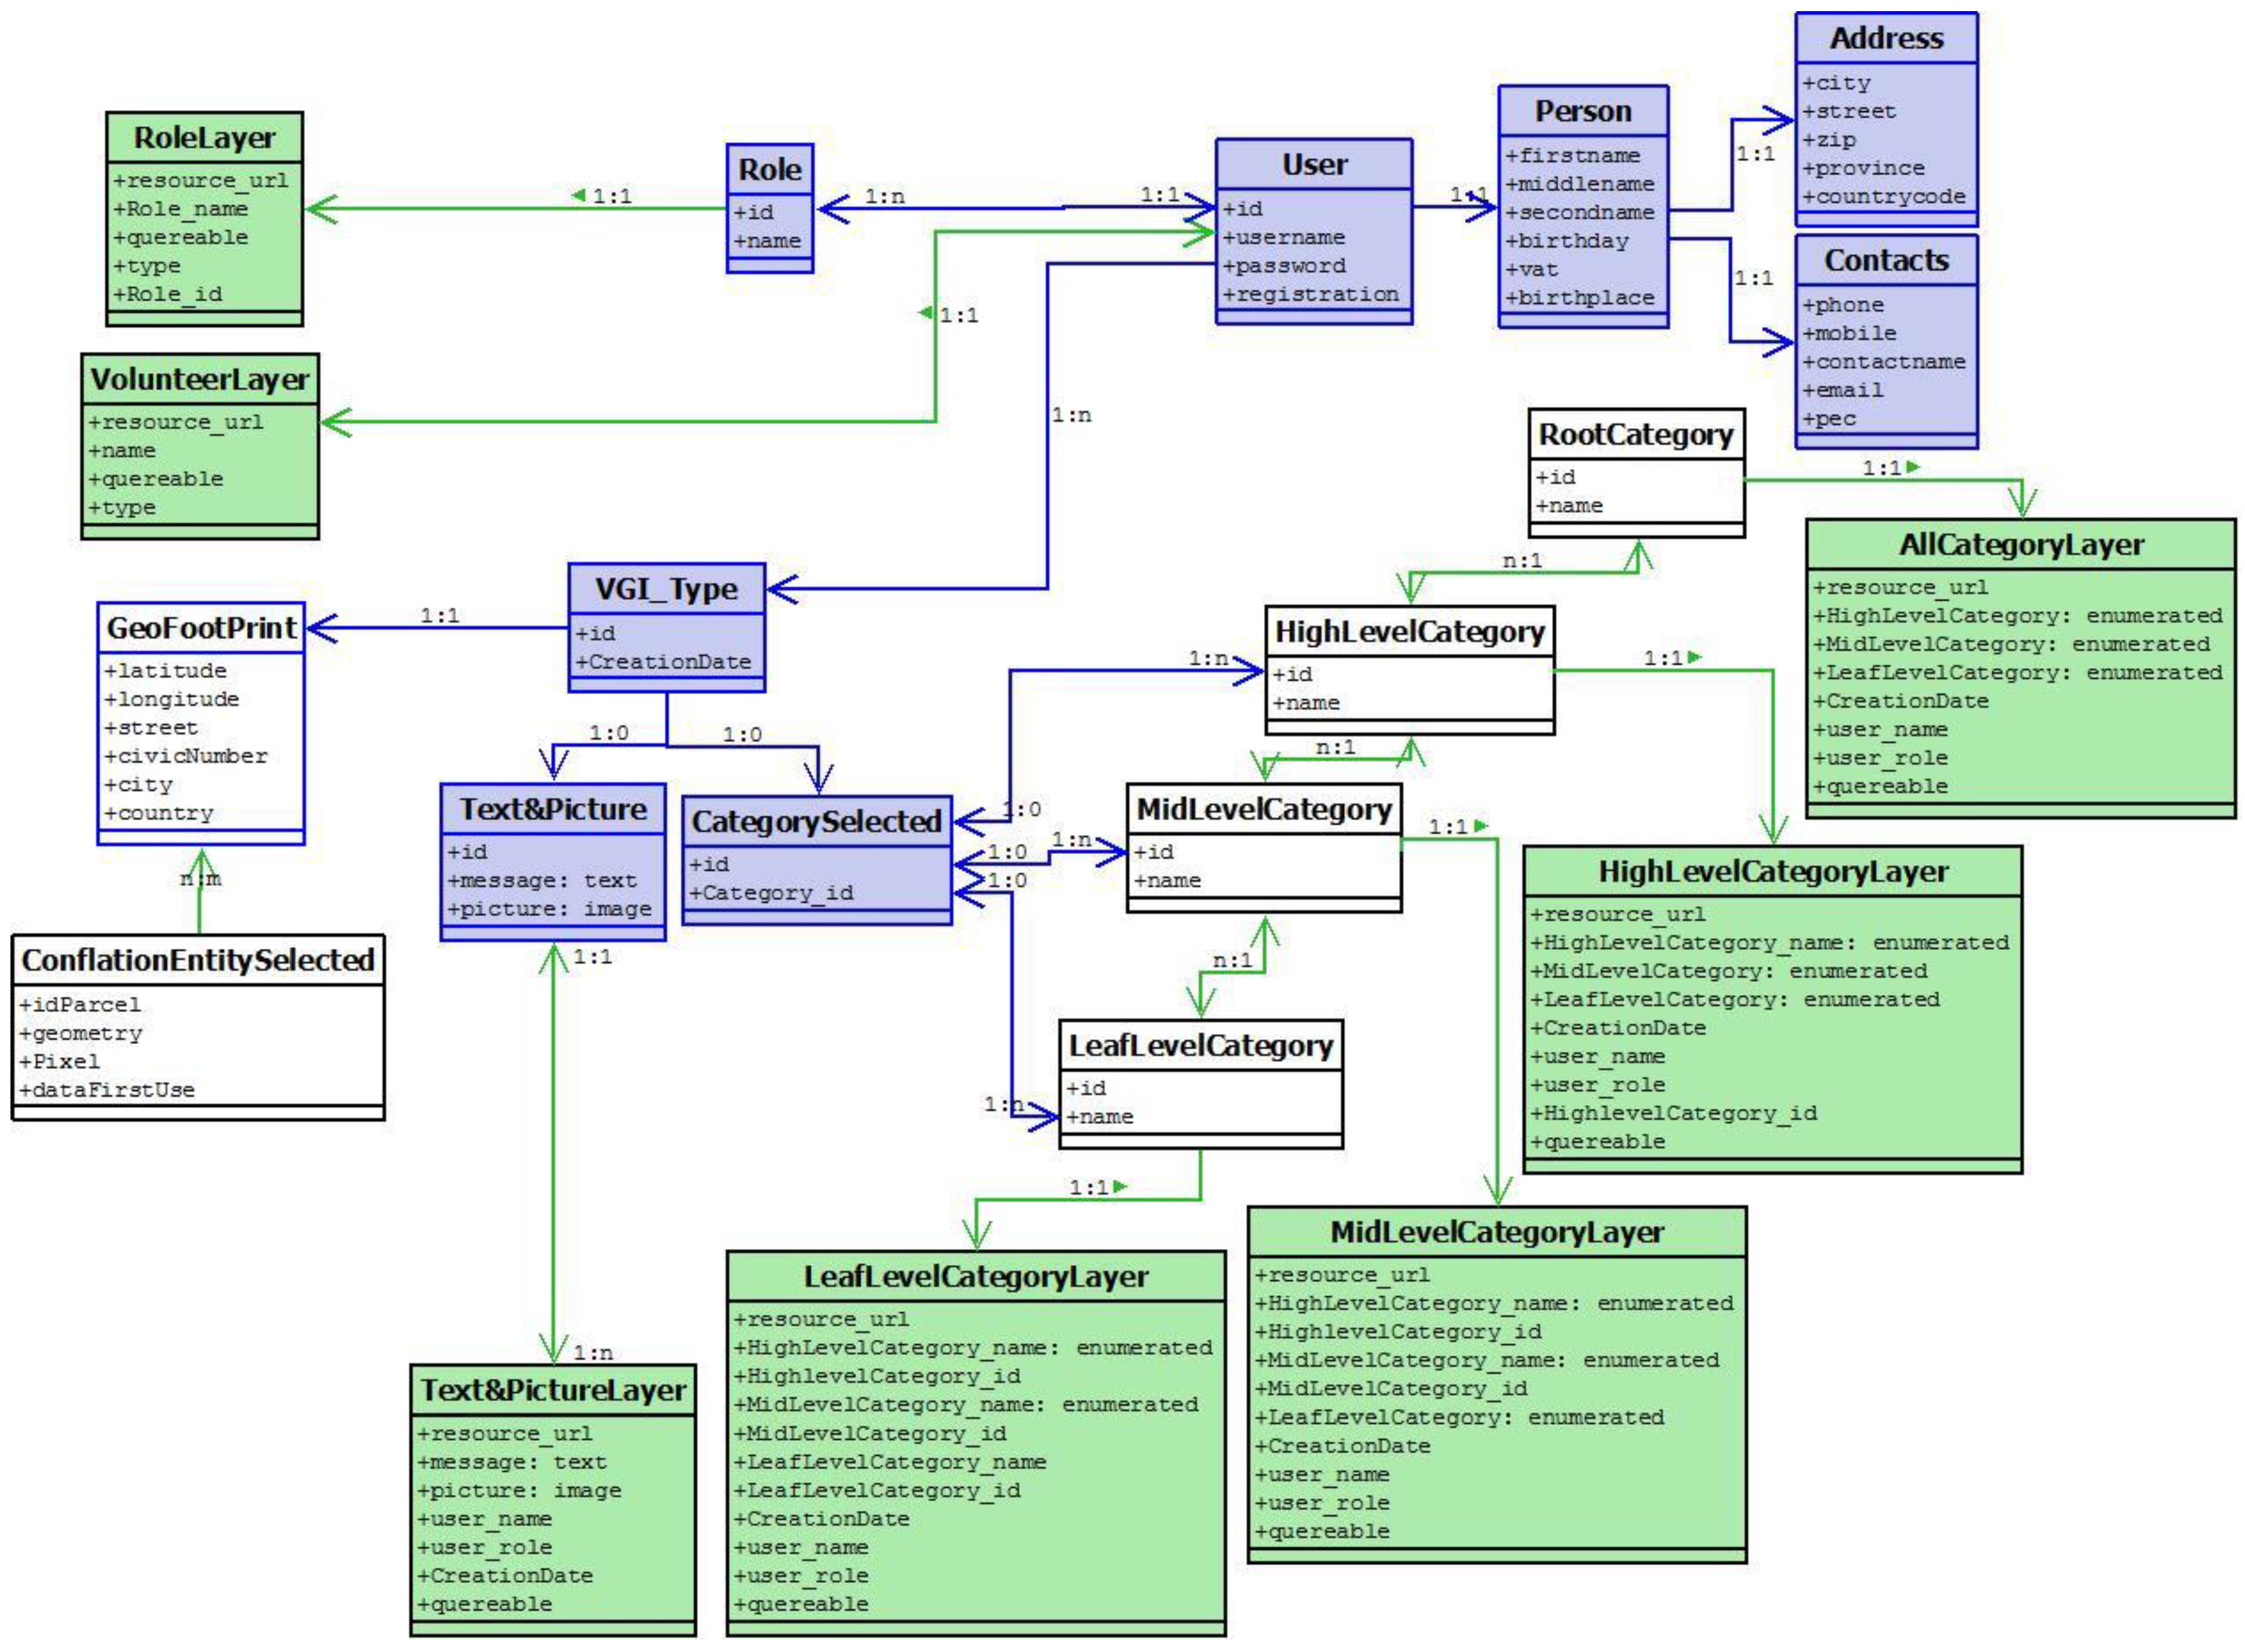
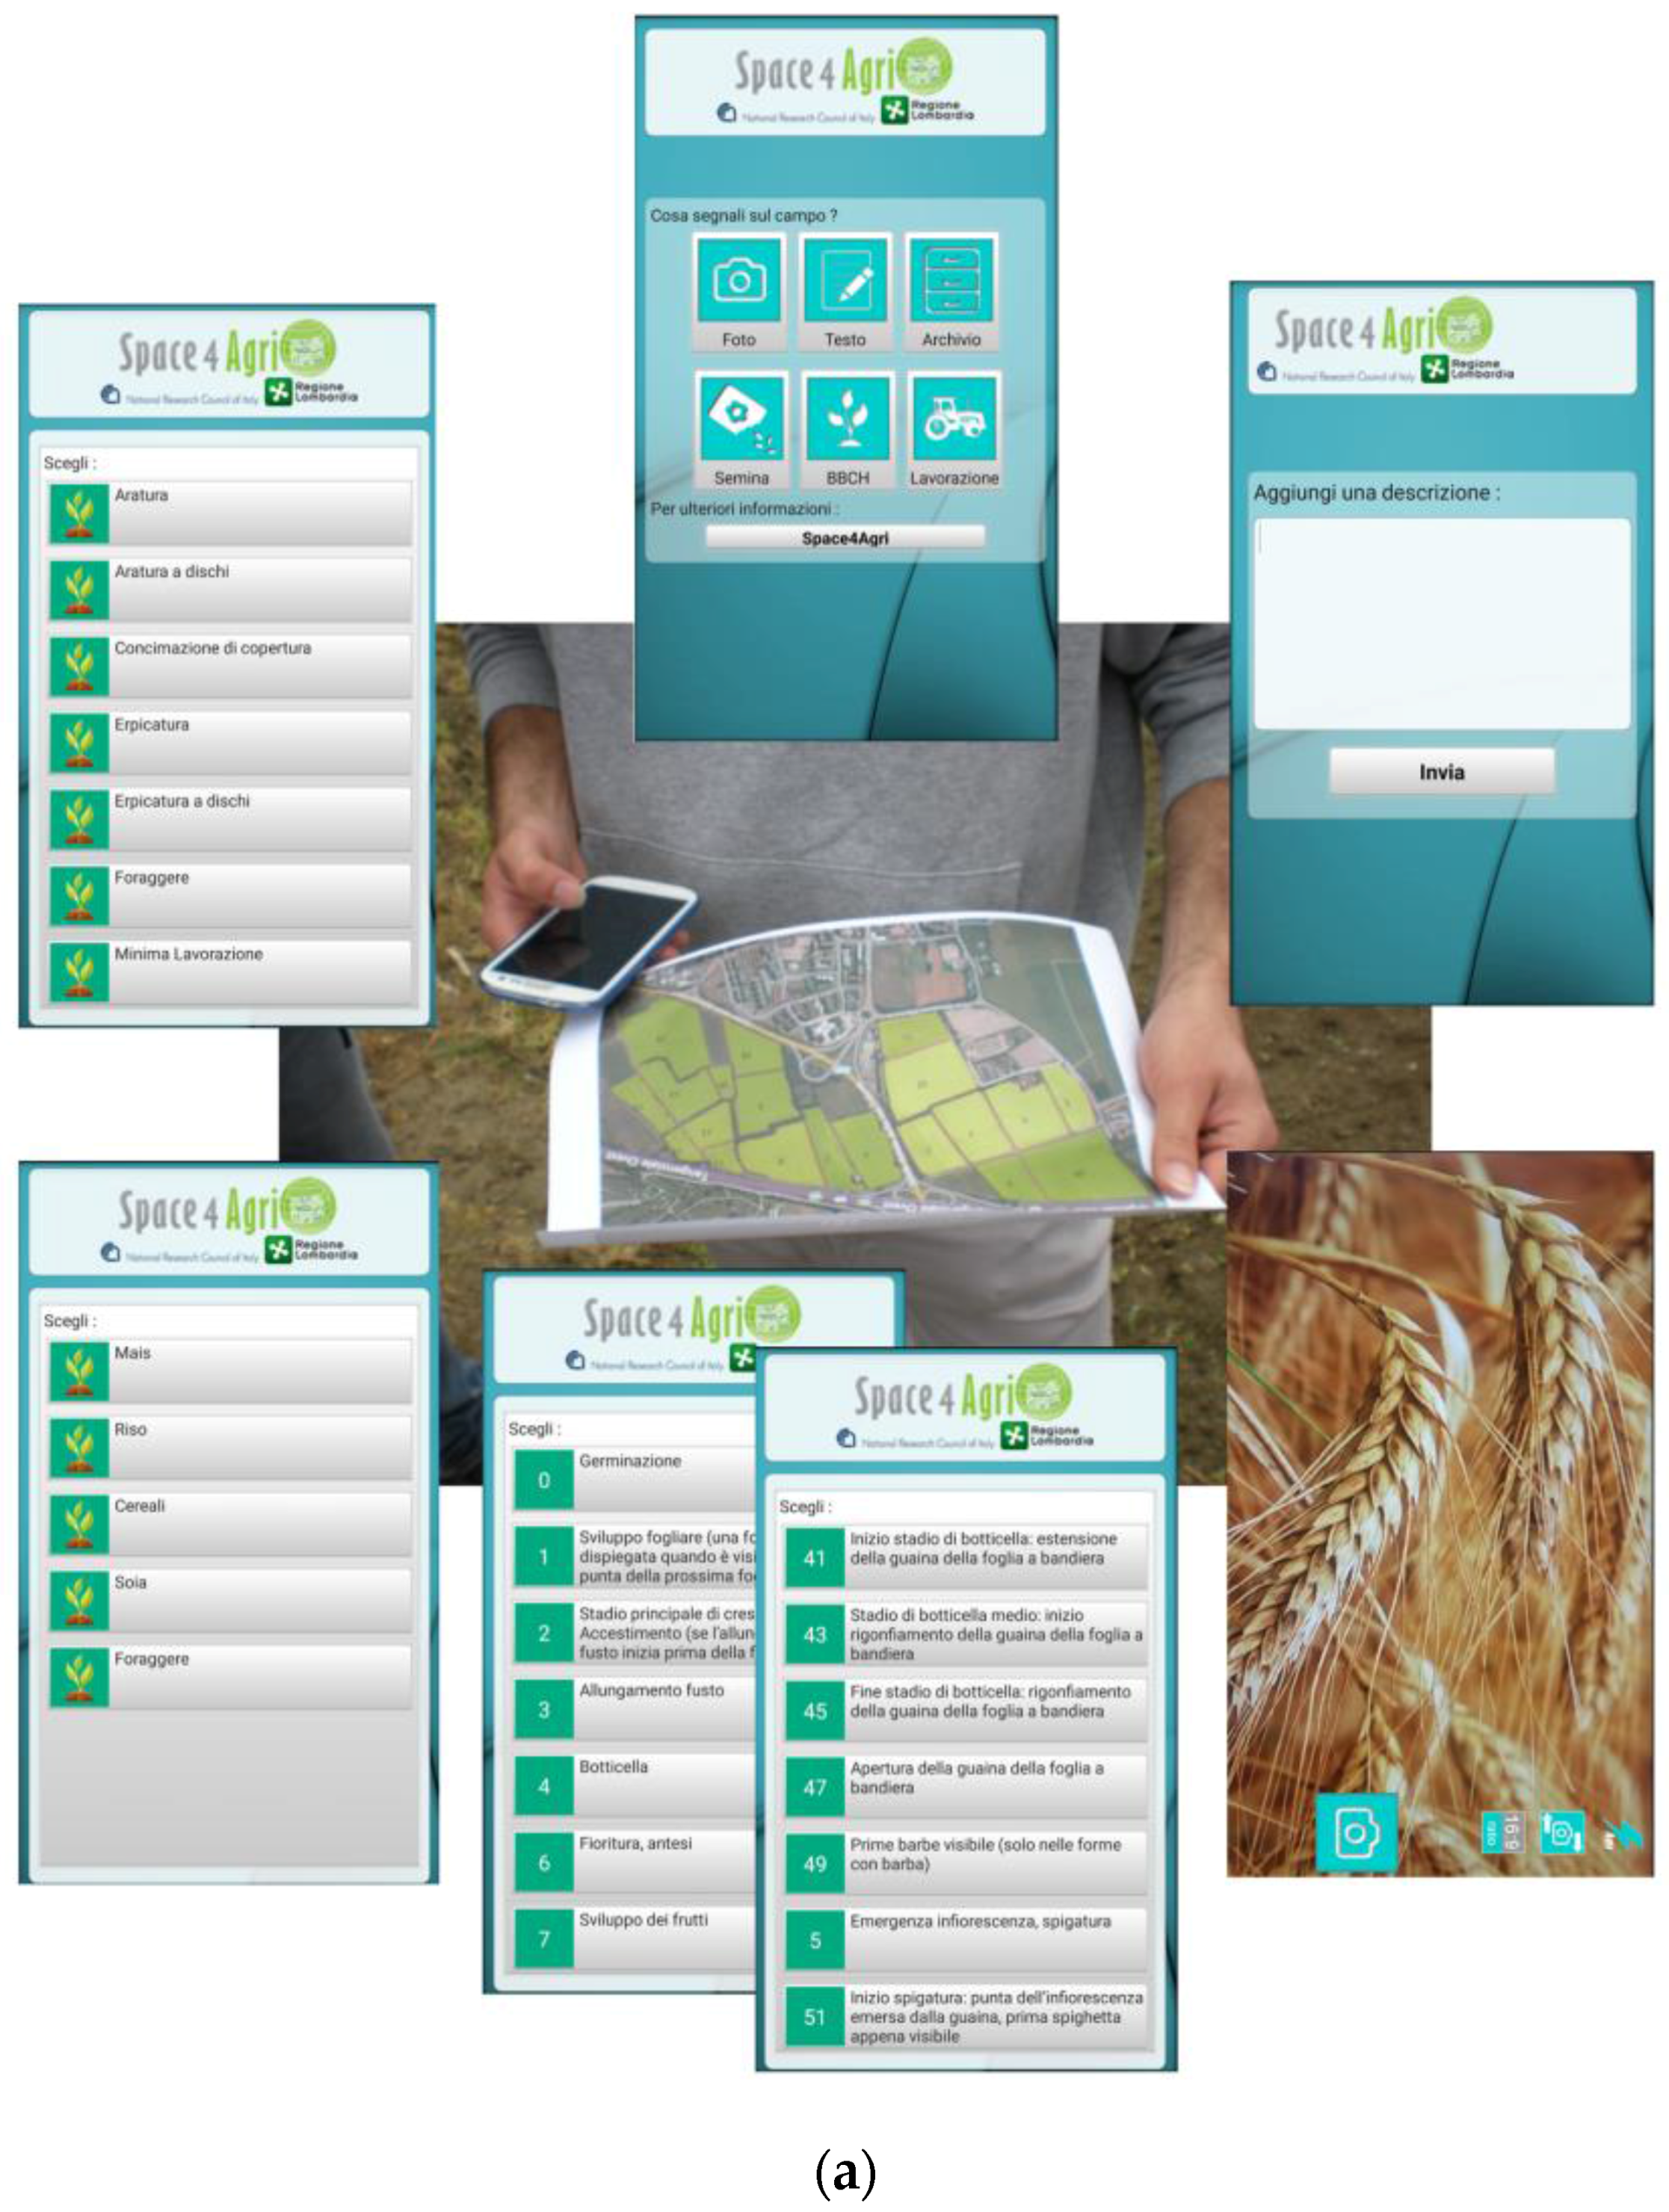
4.2. The Smart APP for Creating VGI Reports

The Smart App has been implemented by having as cornerstones the following design concepts [37]:
  • The possibility to support data normalization and semantic interoperability by providing a domain ontology to the user in order to ease both the creation of observations and the interpretation of contents by potential stakeholders. The user can describe the observed objects by selecting tags from a set of pre-defined categories and sub-categories whose meaning is provided in the form of both a textual description and a visual prototype, such as a picture of an object representing the category.
  • The OGC standard Web deploy of the created VGI and correspondent metadata so as to be able to discover it by content queries and to correlate it with other georeferenced information from other sources and with distinct format and semantic.
  • The resolution of geometric imprecision of the VGI footprints by the application of georeferenced conflation techniques, so as to eliminate redundancy and inconsistencies by fusing VGI items created within the boundary or close to the boundary of the same entities of interest.
The Smart App implemented for the S4A project runs on Android mobile devices and can be freely downloaded from Google play store. The in-situ data created by the Smart App consist of on-field observations regarding agro-practices and crop phenology, and comprise both georeferenced free texts with associated photographs, and categorized information on both the type of crop with associated sowing dates and phenological phases, and agro-practices. Each piece of in-situ information is associated with contextual information on the creator, the timestamp of the creation, and a twofold geographic footprint: a georeference comprising the geographic coordinates detected by the GPS of the mobile device, possibly manually corrected by the creator (option that allows the operator to specify if his/her observation is related to a field which is different from where he/she is currently located), and the unique identifier of the closest cadastral agronomic field in the cadastral parcels vector layer. The App can locally store the created information when the Internet connection is not available and the data can be viewed, revised, deleted or sent to the SDI later on. These in-situ data are organized into the geo-database whose schema is depicted in Figure 3. Notice that users who create in-situ observations belong to distinct roles, agronomists, researchers, or operators. The categories of crop types with their phenological stages and phases are chosen from a hierarchical agronomic ontology (known as BBCH ontology [38]), which serves to support both operators in the creation of normalized data and their interpretation by stakeholders. All observations whose geographic coordinates are included or nearby the boundaries of the same agronomic cadastral parcel are conflated. This allows resolving imprecisions of GPS localization, thus eliminating redundancies and inconsistencies.

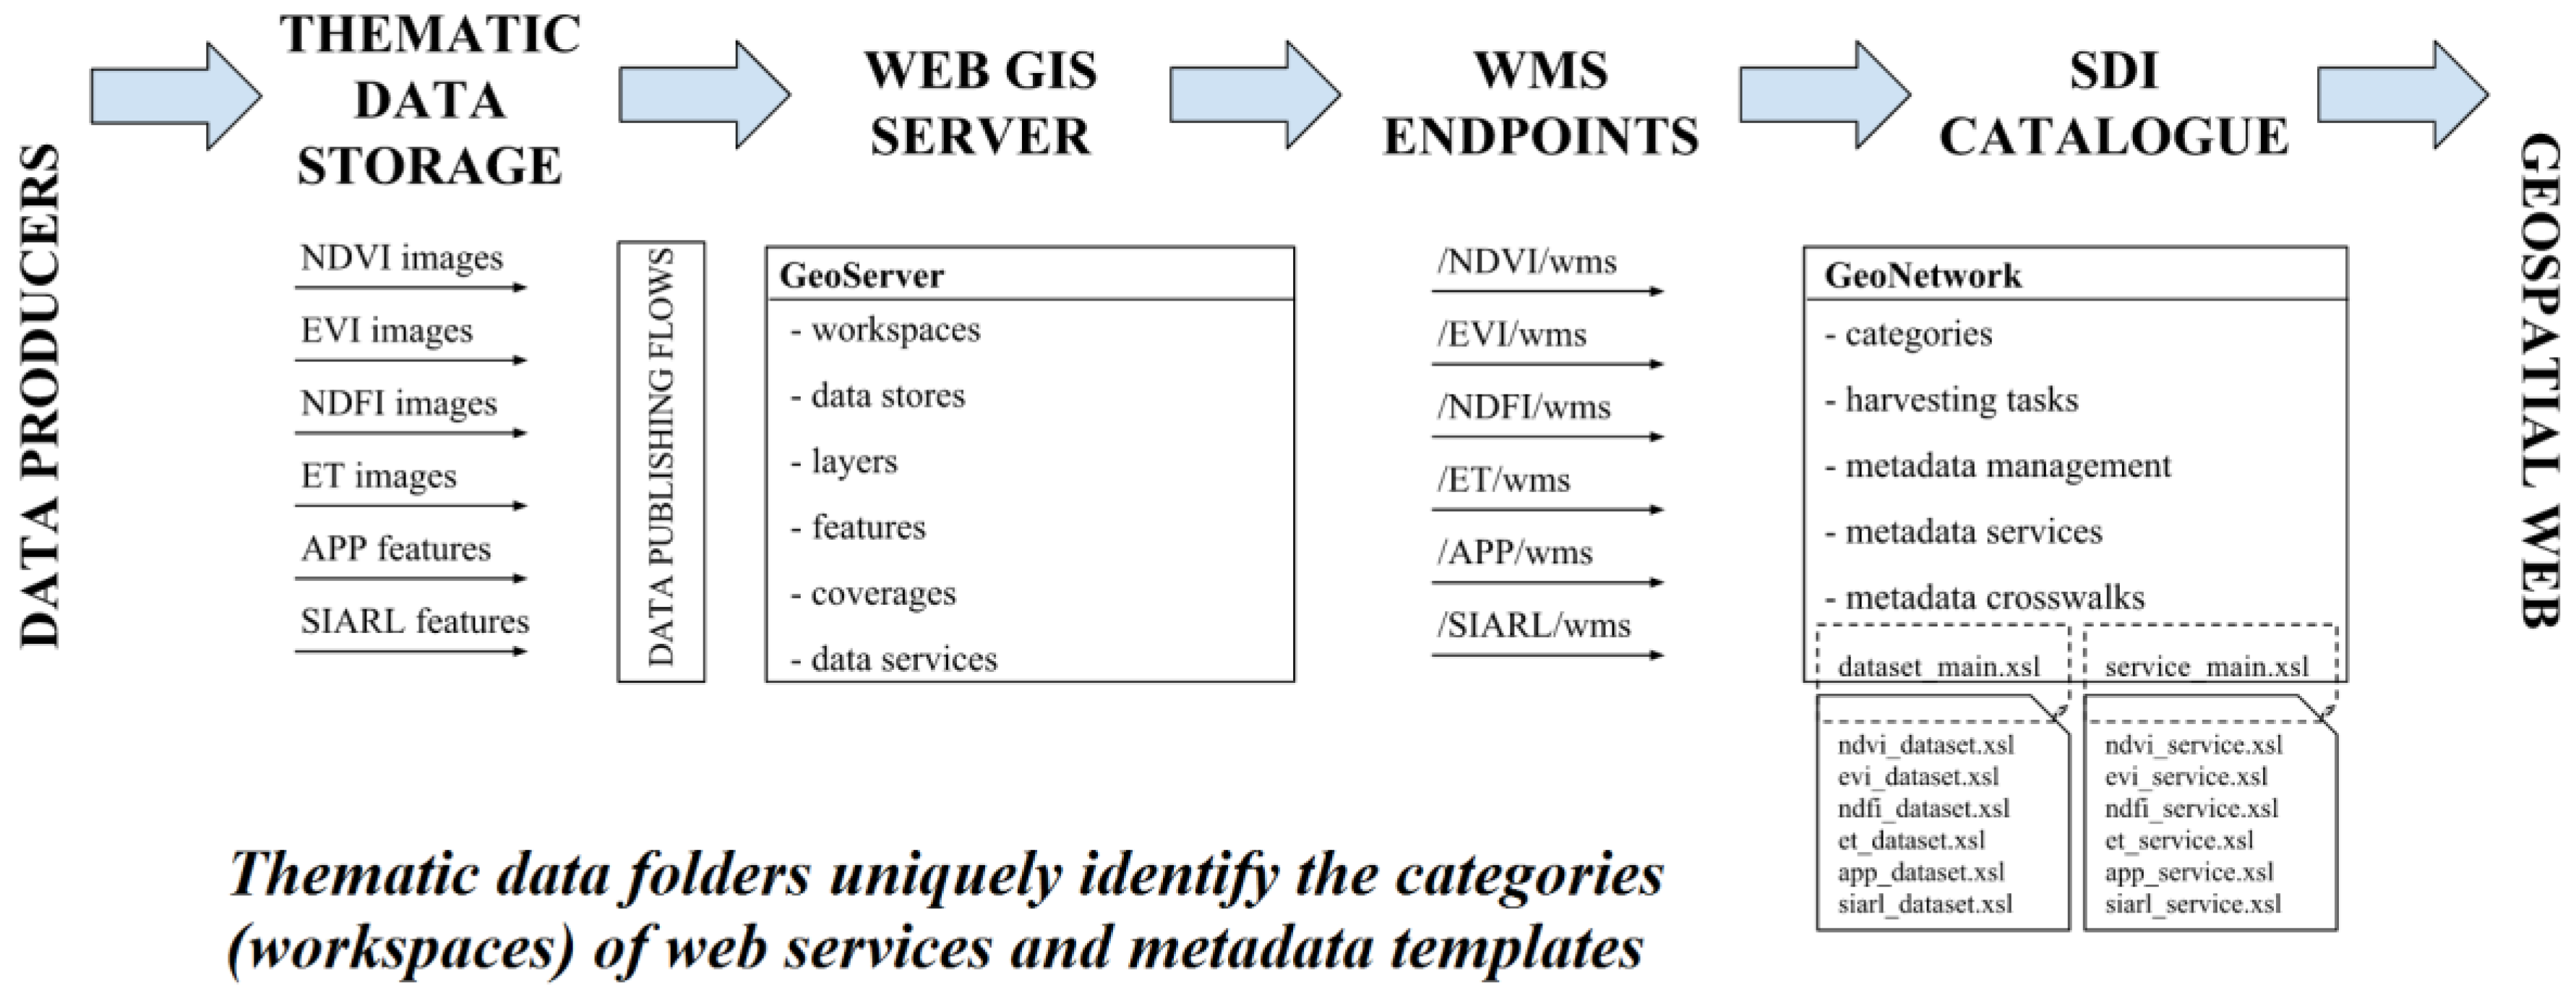
4.3. SDI Services for GD Sets, Time Series and Metatada Web Deploy

All the GD sets (static or time series) and VGI reports described in the previous sections constitute the input to the workflow for their Web deploy. The methodology to publish GD sets and time series and to generate corresponding metadata is schematically depicted in Figure 4.
The remote sensing datasets are stored in a file system data structure on the NAS, organized into thematic folders, taking into account the semantic meaning of the products as expressed by remote sensing experts who created them; each folder is a theme or category uniquely identifying a dataset within the whole workflow. This thematic folder structure was defined based on the domain knowledge of the data providers so that each folder can be populated with GD having a common category and format, so that the naming convention of the folders and dataset files allows univocally identifying semantic information of the data contained. Furthermore, each folder contains a comprehensive metadata record, manually created, once and for all, for each data category according to the INSPIRE metadata regulation and its Italian extension, by using the Edi Editor [39]. The comprehensive metadata are semantically enriched by exploiting contextual knowledge of the provider and organization of the GD. The publishing process is executed each time a new GD is placed in a folder, creating corresponding data store and related layer on the target Web GIS server within a predefined workspace. Each workspace deploys on the Web the dataset through available data services (e.g., OGC WMS or OGC WFS). Furthermore, the gap between data and metadata is bridged during the harvesting task, when each new layer is complemented by its metadata. Metadata are automatically extracted from service capabilities document [40] according to Web Service common specifications [41] and extended by the information from the comprehensive metadata template defined for each data theme.
As far as the in-situ data and the authoritative data, their deploy process is executed each time a new observation is sent by the S4A App and stored in the geo-database or when the SIARL database is updated once a year. Several views of the GD base are automatically deployed as separate GD layers: some of these views combine in-situ GD information with authoritative information from SIARL, such as the layer displayed in Figure 5 that depicts with distinct colors the in-situ observation of crop type, as stored in the GD base, assigned to each agronomic parcels.

4.3.1. Publishing Remote Sensing Images

As stated in Section 4.1, data products derived from remotely sensed images (i.e., Vegetation Indices) are stored in data folders created on the IREA-CNR Institute NAS server. Publishing workflows were implemented using GeoBatch which is an open source application used to process and publish GD in a real time [41]. The application provides an event-based GD aware batch processing system to ease the development, deployment, and the management of jobs on streams of GD. A batch job is encoded by an XML configuration file, hereafter named a flow. Each flow consists of three sections: a descriptive part, a data streams monitoring and recognition part of particular files within a stream, and its elaboration and final publication part. Individual flows were created for each data folder containing the datasets of remote sensing image products, which are raster datasets. Events to elaborate and publish the data files were configured to be applied to each file with TIF extension when placed in a predefined data folder. This ensures that each time a new dataset, e.g., EVI, is produced (depending on the satellite source sensor revisiting time and cloud free condition), the data producer places its file into a predefined data/theme folder. Then, the dataset gets published on a Web GIS server. Each raster file is published as a separate GeoTIFF (Tagged Image File Format with GD) raster data layer available in GeoServer data source configuration. In addition, for each relevant data theme, a time series image mosaic data store is created and updated each time a new dataset is published on GeoServer. With such a setting, the images can be used as either individual WMS layers published for each dataset or as one common time series layer, which can be queried by TIME parameter to display images of a specific date (see Figure 6).

4.3.2. Publishing in-Situ Observations

Four basic thematic vector datasets created by field operators using the S4A smart App are published on the web through GeoServer as WMS and WFS in an automatic way as follows (see Figure 7): crop typology (Figure 7b), agro-practices (Figure 7c), crop phenological stages and free text observations with associated photograph (Figure 7d).
Each observation is aggregated into a thematic dataset and the data collected are assigned to an agronomic cadastral parcel based on spatial relations. This process is performed within the post processing and quality checking procedures.

4.3.3. Publishing Authoritative Data from Regional Agricultural Database

GD about the agricultural declarations of farmers to the Lombardy regional authority are collected in the SIARL database as alphanumeric data associated to the cadastral parcels. A subset of unclassified cadastral parcels (without farm sensitive information) has been provided in ESRI SHP format [42] for relevant areas of interest (municipality units) to be published on the Web by the S4A SDI. This kind of information is provided yearly and represents the type of crops cultivated in the agricultural parcels for the previous cropping season. In the framework of the seasonal monitoring system analysis, this information is static. The data are integrated into the S4A SDI as two datasets with the same geographic and geometric definition. The first dataset represents 1:1 the information available in the regional agricultural database and the second dataset aggregates the in-situ data collected by the S4A App: general description, crop type, variety, date of sowing, agro-practice, date of agro-practice observation, phenological stage (encoded according to the taxonomy known as BBCH), and date of BBCH definition (Figure 8). In addition, a link web editor, developed to provide interface to verify and correct the data collected by the S4A Smart App, is provided to authorized users. Besides, External Thematic (ET) maps, such as background maps of the OpenStreetMap project [43], can also be shared, as shown in Figure 4.

4.3.4. Publishing Metadata

A very important component of the harvesting task applied to generate the metadata of dataset, series and service for each project’s relevant data theme, was one comprehensive metadata record containing all the information required by INSPIRE metadata regulation and its Italian extension. The Metadata editor Edi, developed in Ritmare project [39], was used to provide an easy and web accessible interface to create the comprehensive metadata record for each data theme. Information as abstract, keywords from relevant controlled vocabularies (INSPIRE theme, GCMD, Earth Science Keywords, etc.), free keywords, topic category, update frequency, additional information, constraints on data, lineage and responsible party of several roles (creator, point of contact and distributor) were provided by researchers who produce the datasets. Resulting metadata records were used to develop custom eXtensible Stylesheet Language (XSL) transformations to be applied during the harvesting tasks executed by GeoNetwork catalogue service.
GeoNetwork package enables harvesting metadata records that results in the automatic creation of metadata from a remote node, which can be an OGC service capabilities end point. In fact, harvesting is the process of collecting remote metadata and of storing them locally for a faster access and retrieval. Harvesting is not a simple import operation: local and remote metadata are kept aligned periodically. GeoNetwork node is capable of discovering metadata that has been added, removed or updated in the remote node. Normally, when GeoNetwork executes a harvesting task on the remote OGC endpoints, e.g., OGC WMS, it executes the so-called metadata crosswalk [9], implemented as an XSL transformation. GeoNetwork installation by default integrates a general XSL file for OGC Web Service of supported type and based on matching criterion, it applies a set of specific XSL transformations to create metadata records for the service itself, and for datasets (if configured to do so). Depending on the service type configured for the harvesting task, a particular XSL template is processed. We customized the XSL files as well as created new ones in order to apply automatic metadata generation for individual data themes. The main identifier of the data theme (e.g., APP, EVI, NDVI, etc.) served as a variable used to decide which set of templates should be applied. For example, the fragment of the main XSL file, which serves as the router for automatic dataset metadata generation for NDVI themes is displayed in Table 2. Based on the agreed acronym convention, an XSLT processor implemented in GeoNetwork catalogue evaluates the XPath expression and, if satisfied, the corresponding XSL templates (defined by mode attribute) are applied to the matching data theme. If none of XPath expressions are met, then the default GeoNetwork XSL templates are applied in order to generate metadata.
GeoNetwork installation comes with an internal DBMS server, the McKoi SQL database. However, it has the capability of connecting to other databases including Oracle, PostgreSQL, and MySQL. GeoNetwork stores the metadata records in XML format. An entire metadata XML string is stored in a single database column [44]. We used PostgreSQL with PostGIS extension in order to store spatial indexes directly in the database in order to improve searching performance.
GeoNetwork uses Lucene index engine, which is an information retrieval library written in Java with high performance and easy to scale, that can easily add searching and indexing capabilities to applications [45]. Lucene configuration is performed through XML configuration files and provides several options for customizing searching functionalities that end users may ask on the metadata stored in the catalogue. Search fields can be configured to be indexed separately, and used to filter as well as to retrieve and display matching metadata records in the result list. Lucene indexes are used also in the definition of virtual CSW endpoints to filter the metadata provided by a specific endpoint

4.4. SDI Discovery and Analysis Access Points

The user or stakeholder is provided with two distinct access points for visualizing and analyzing the GD:
  • the GeoNetwork catalogue service which allows discovering the GD of interest by specifying queries to retrieve the metadata and consequently the correspondent GD (the S4A geo-catalogue sevice is available at [46]);
  • the S4A project’s customizable geoportal which automatically provides the list of all available GD layers and time series in a menu from which the user can select and perform spatio temporal queries (the S4A geo-catalogue sevice is available at [47]).

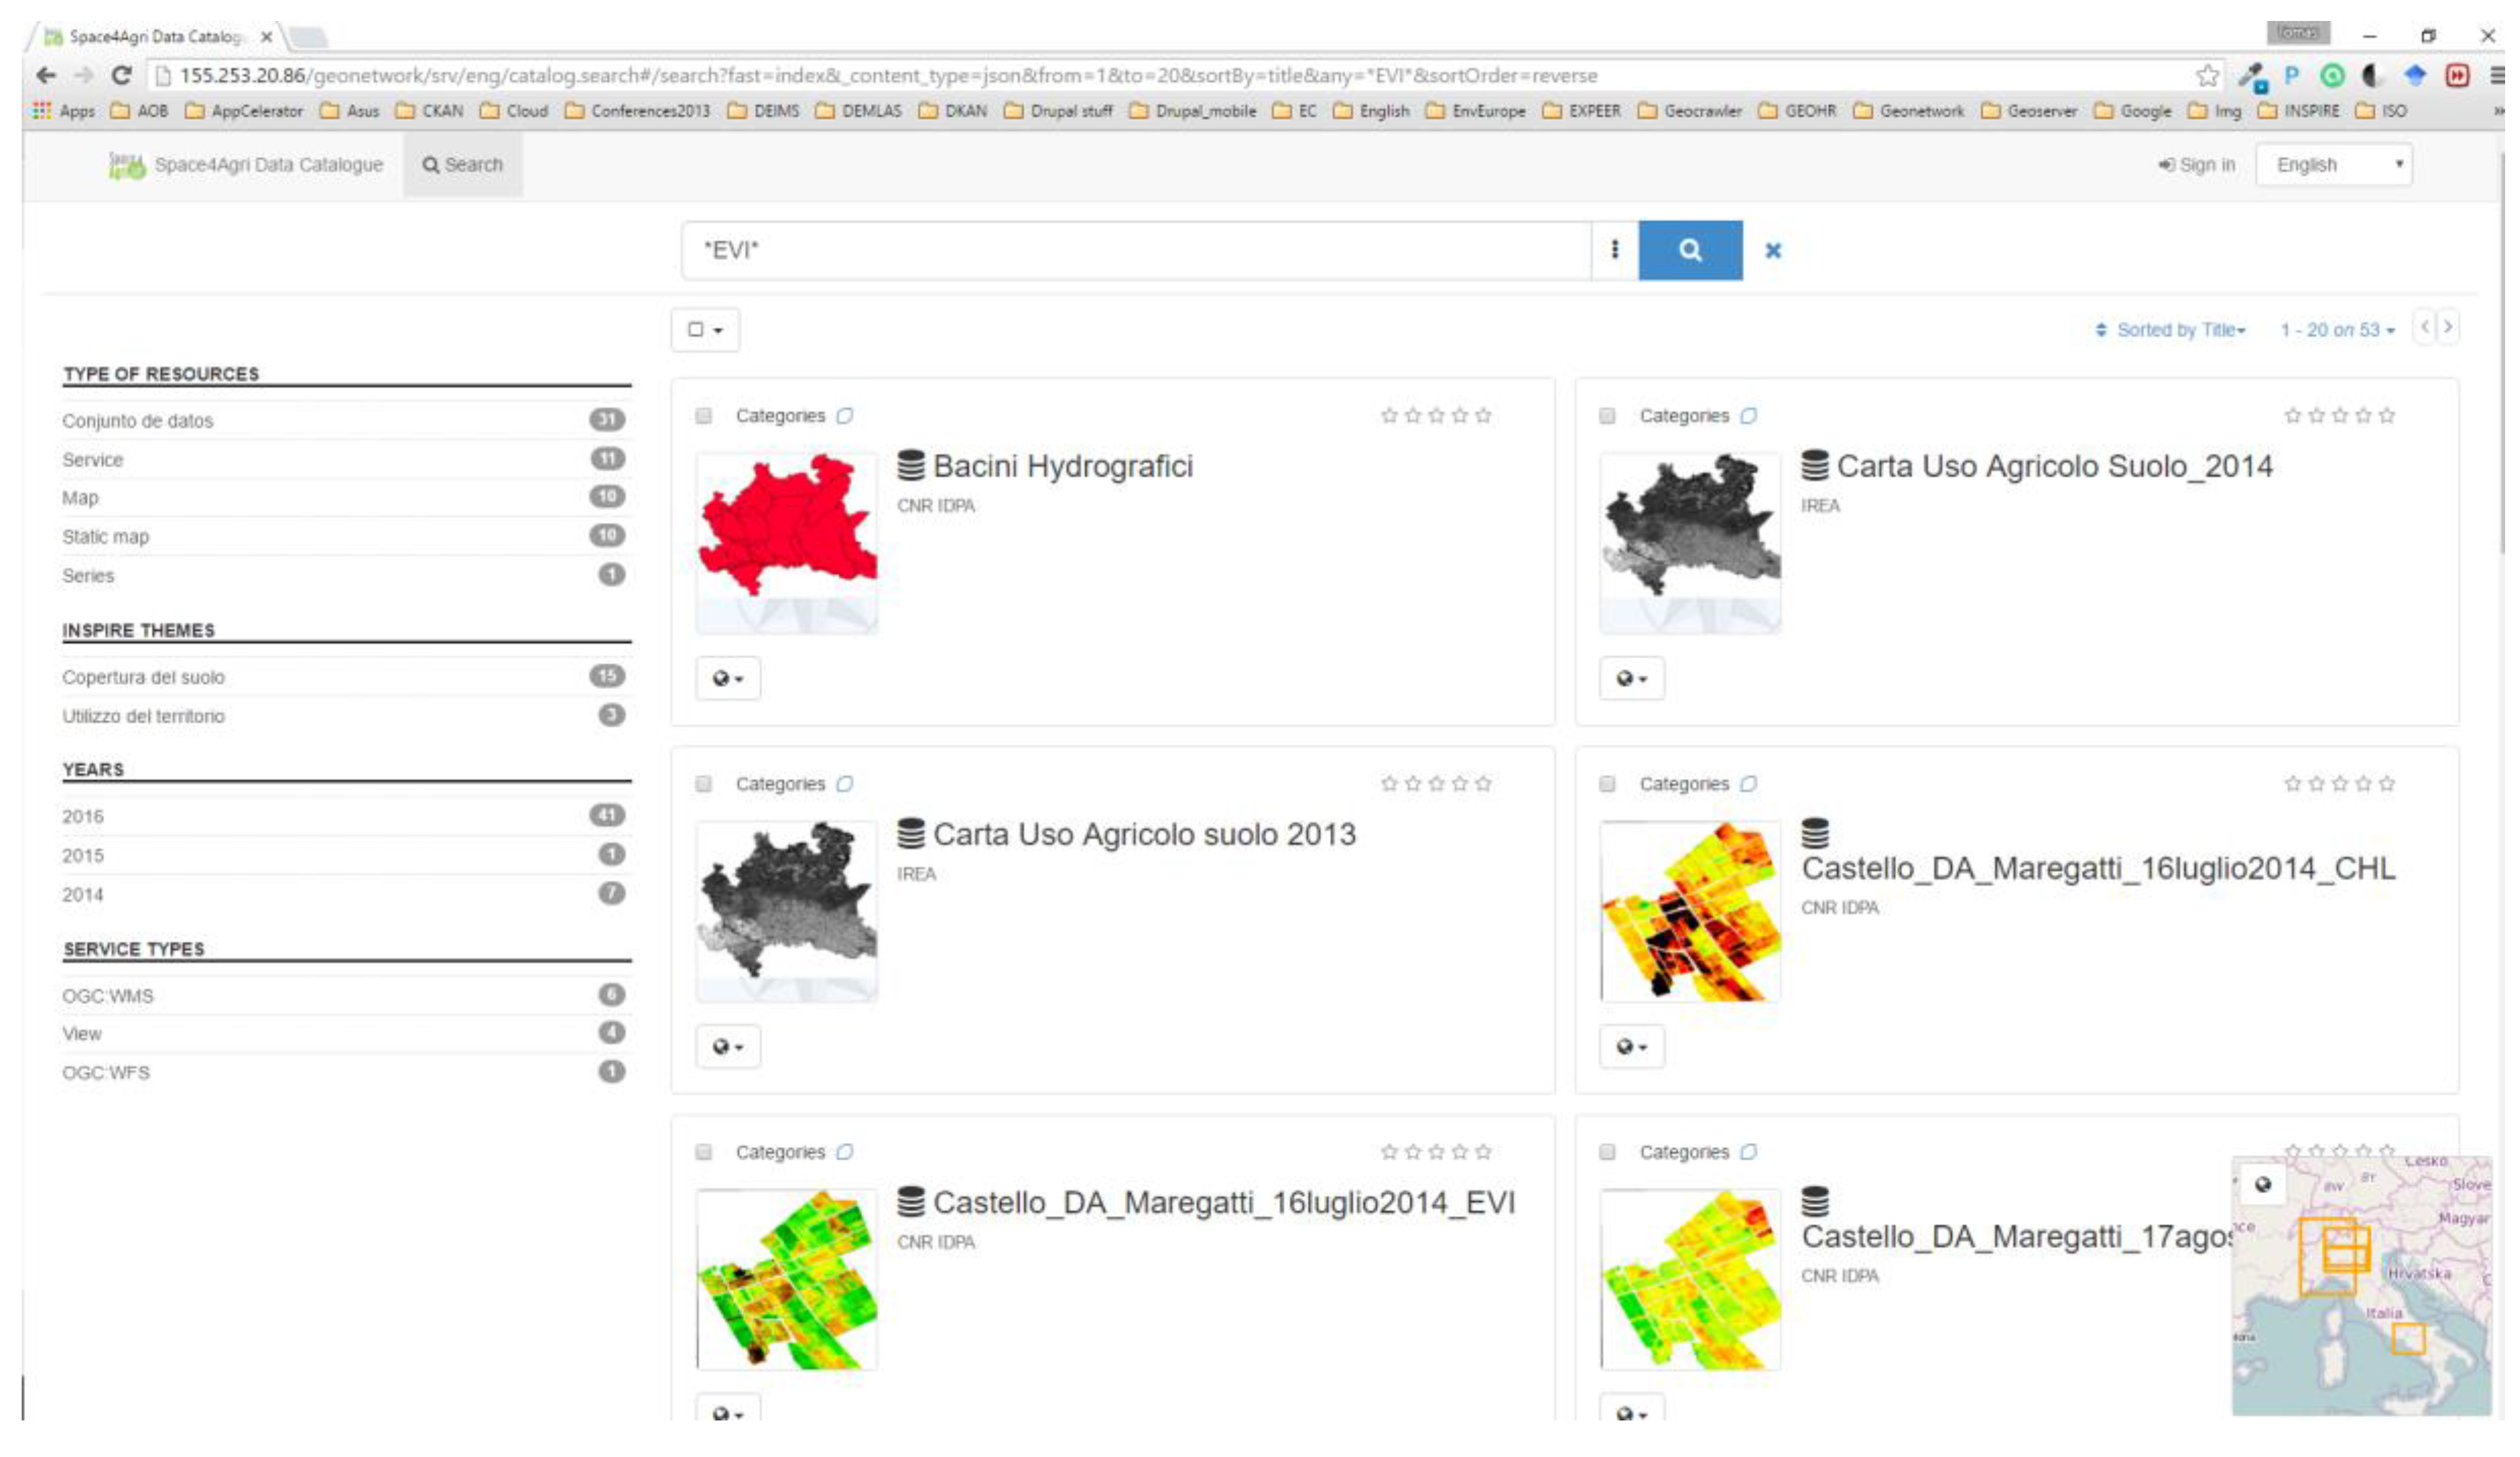
4.4.1. The Catalogue Service Access Point

Several versions of Graphic User Interface of the GeoNetwork catalogue service are made available to the end users allowing distinct levels of interaction. In the simplest one, the end user can specify a query by a free keyword and in the most advanced one the users can specify controlled keywords in specific metadata fields. In addition, published metadata are discoverable by external tools via an application programming interface defined by OGC CSW standard [40].
In the S4A GeoNetwork catalogue, the metadata records are divided into categories based on the data theme (NDVI, EVI, APP, etc.) and resource type (dataset, series or service). Harvesting tasks are set up to flag each generated metadata record with associated category type. Such configuration allows the end users to browse the metadata based on the category together with the free text and other advanced search operators. An example of a discovery process performed in GeoNetwork catalogue by using advanced search operators is displayed in Figure 9.
For example, by querying the catalogue service with the keyword “NDVI” one obtains as a results the number of datasets (343), series (8) and services (1) available for the data theme NDVI_MODIS. The temporal extent of the data is 2011–2015 and the semantic extent is represented by a set of free keywords or originating from controlled vocabularies. In addition, each dataset and series is described by INSPIRE metadata fields as lineage, conditions and limitation on access and use, technical information such as update frequency, format, positional accuracy, etc.
The updating process of metadata stored in the S4A catalogue is ensured by periodic execution of harvesting tasks defined for each WMS service operating on datasets for the individual data themes. Currently the configuration executes the harvesting tasks each day, one task after another, starting at midnight and executing consequent task each half an hour.

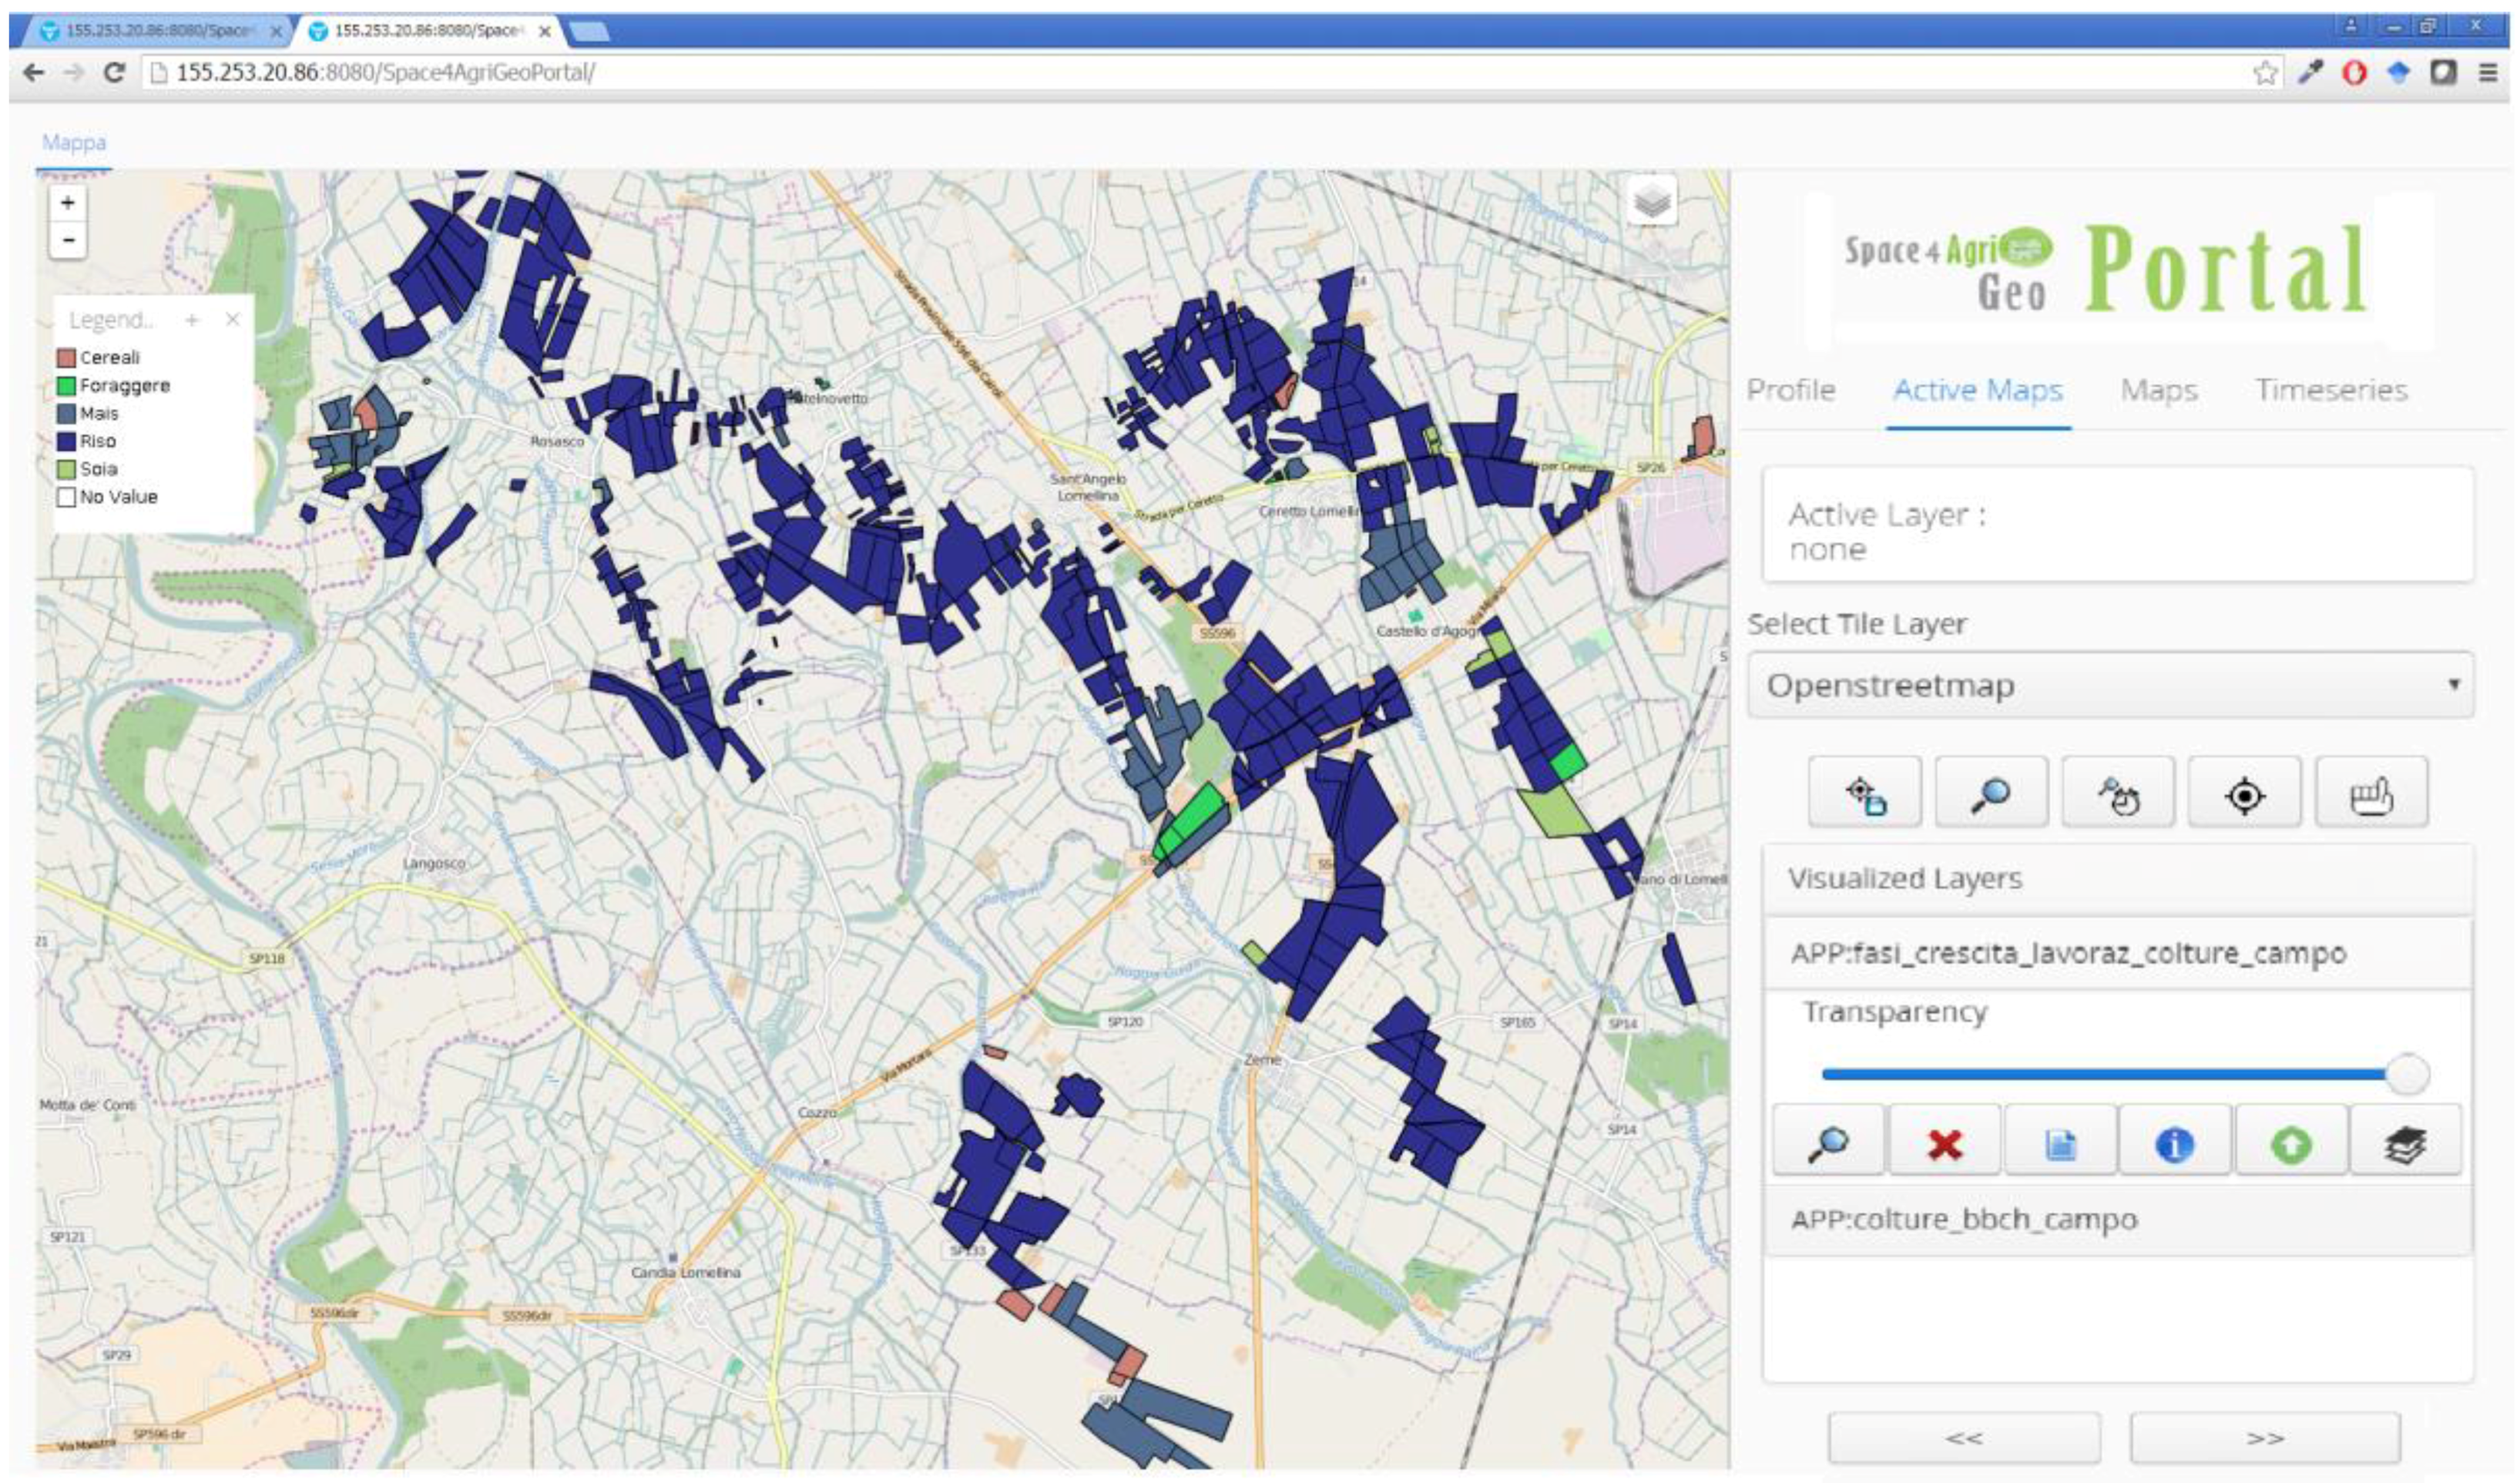
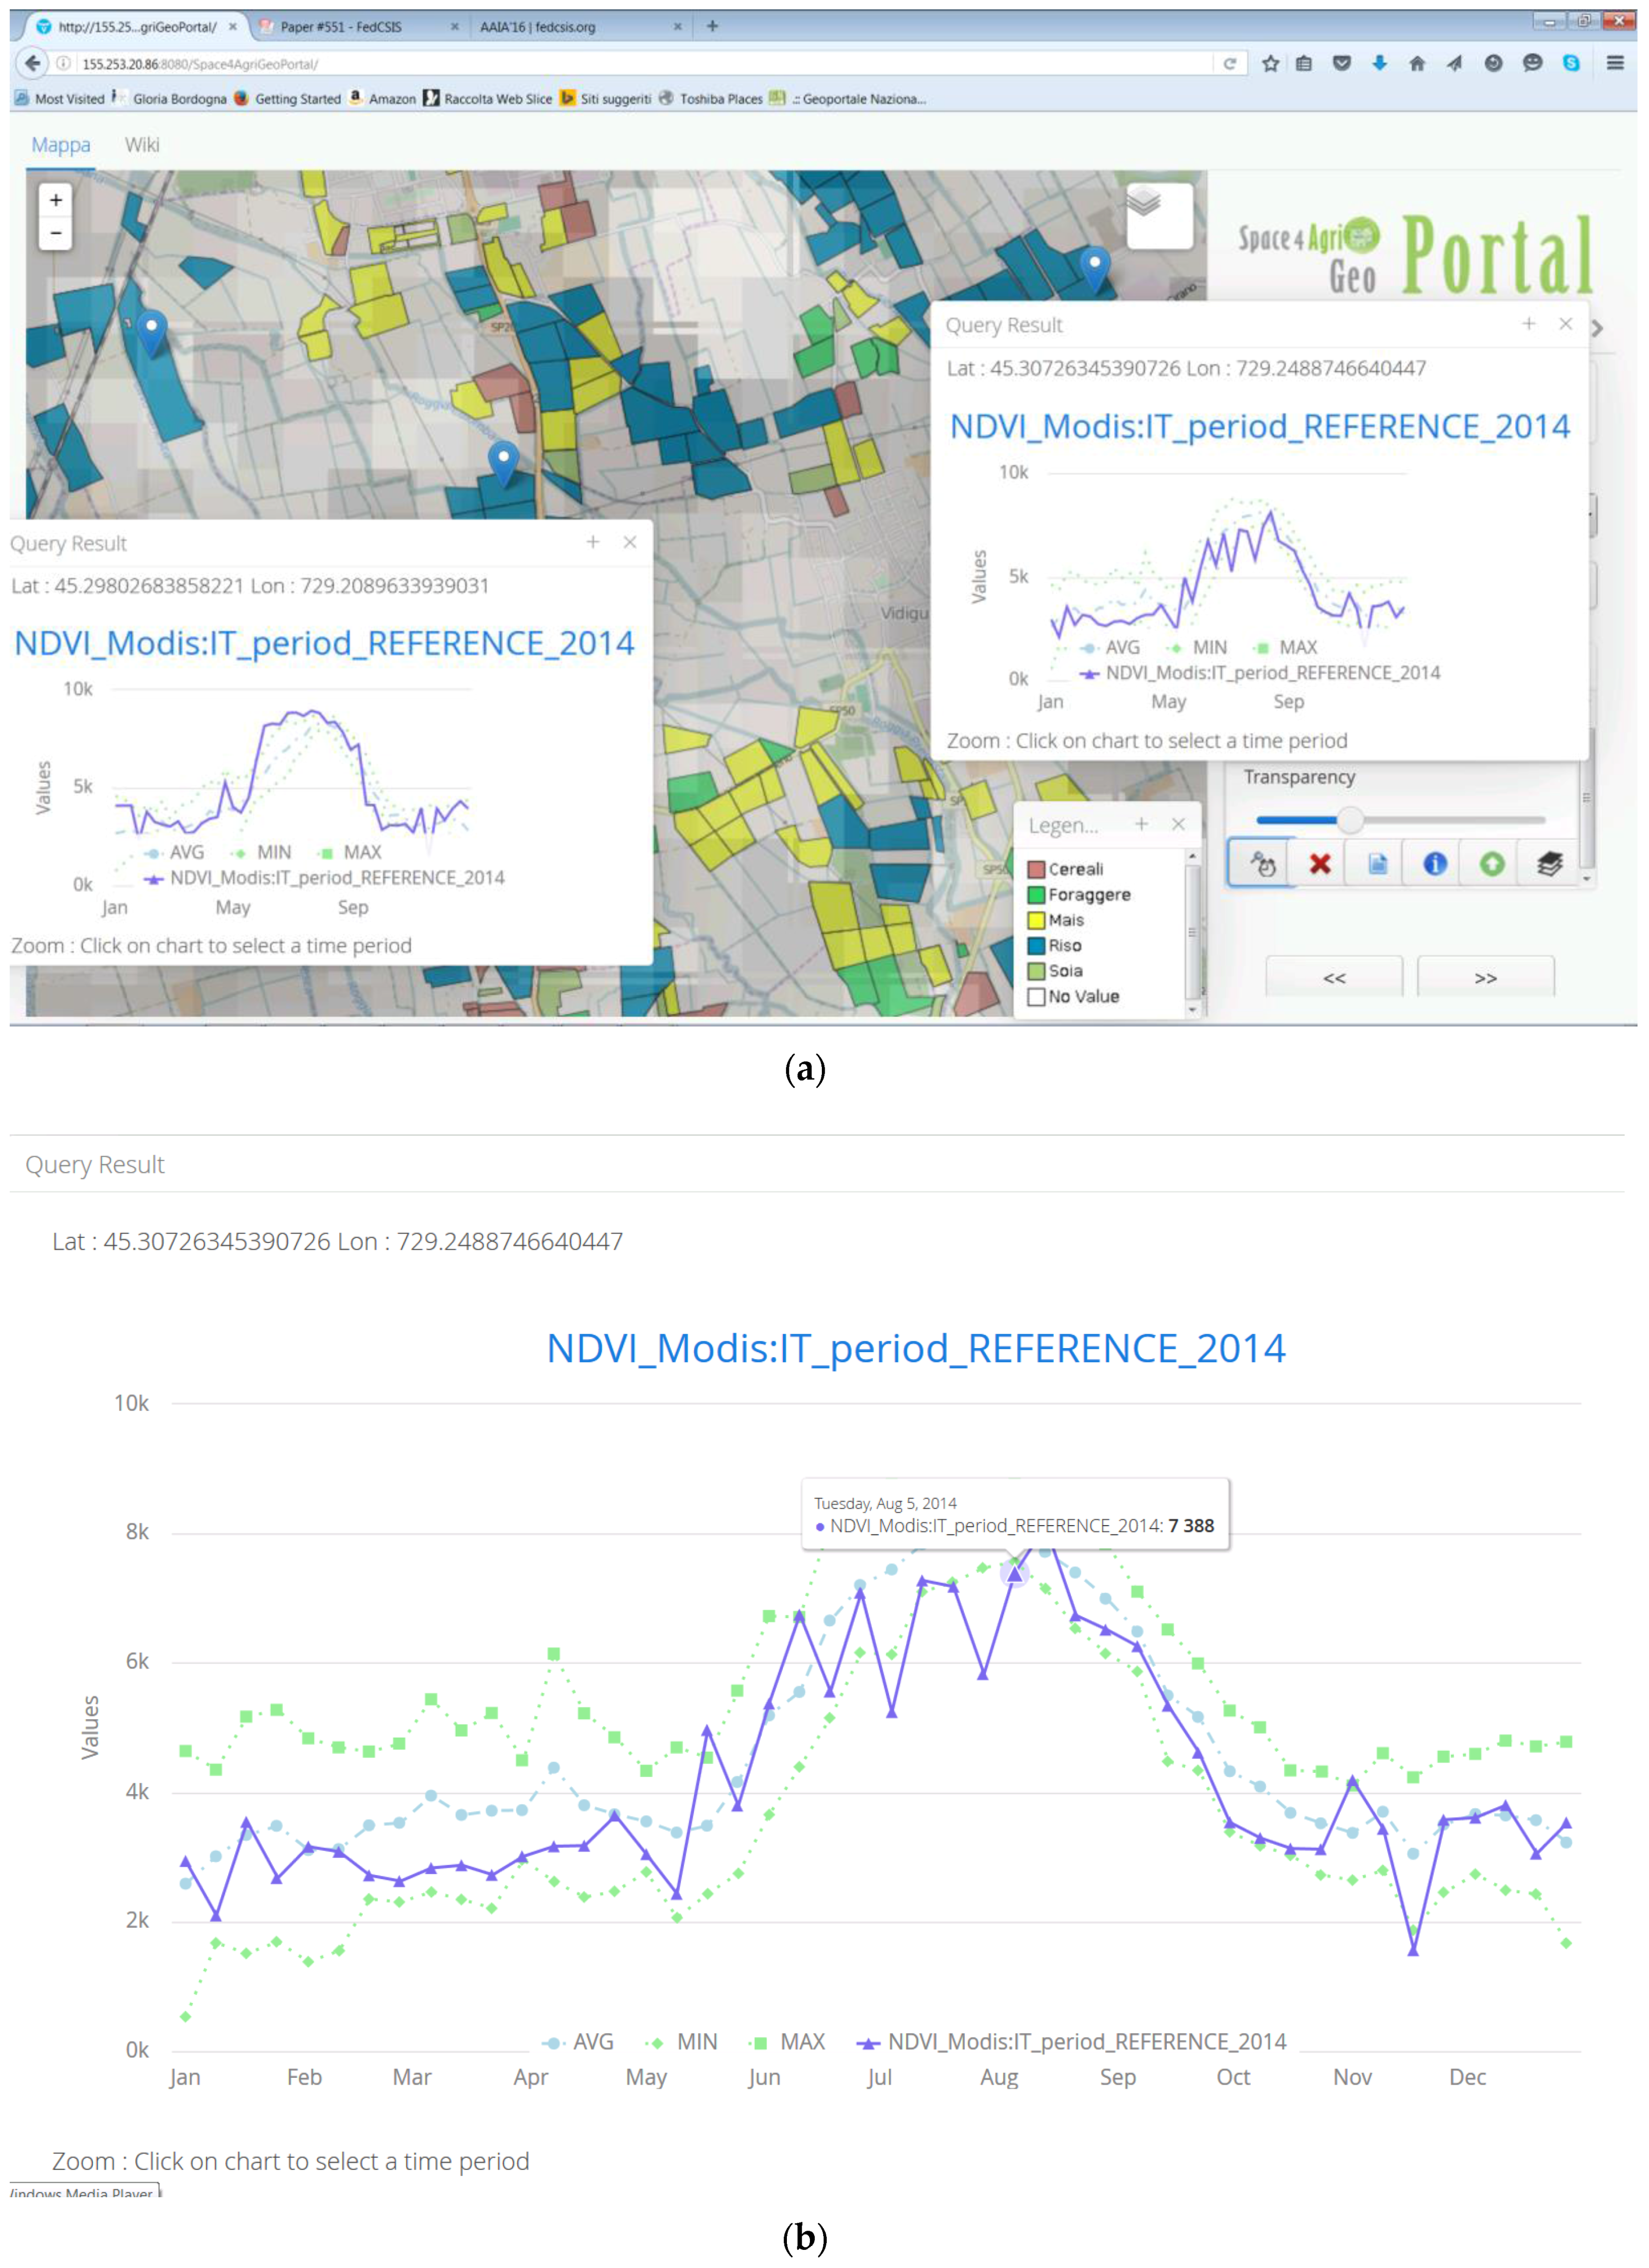
4.4.2. The Customizable Geoportal Access Point

The S4A customizable geoportal has been designed to suit both regional operators and local farmers and different GD data are provided. The regional operator in charge of crop monitoring needs to analyze time series of remote sensing indices (e.g., NDVI) within specific agronomic districts in conjunction with farmers’ declarations, available in SIARL database, and in-situ observations created by field operators. On the contrary, farmers are mainly interested in analyzing information relative to their own estate, or nearby fields, to find out possible dis-homogeneous growth of crops among fields or spatial anomalies within field indicators and also to identify position of potential infestations pointed out by others farmers/field operator in nearby fields.
The S4A geoportal, although being open access, thus not requiring any registration, provides the possibility to register in order to have, with an associated personal profile, personalized access and visualization facilities. Besides common registered users, specific roles can be authorized to access and analyze restricted information and to perform specific operations.
The main novelties of the geoportal are its efficient implementation of standard Web services, its intelligent and effective query/answering facilities, and its customization facilities.
S4A geoportal allows a fast and automatic access to all GD and time series, served by any provided end point node, and presents the GD sets and time series in an order that depends on the preferences of the user, possibly stored in the user profile. The system allows to add other end points providing OGC standard Web services and open GD datasets one could contextually analyze. Efficiency of the requests is achieved by storing in a database on the server side the information of the get capabilities results returned by the end point nodes.
As far as the customization facilities, a user can register and store information in the user profile to personalize the list of active layers and their visualization style. The user can save the preferred background map and default active layers to be visualized at any connection; he/she can also choose the geographic area to visualize at each connection by setting the personal bounding box. These preferences will remain active for subsequent connections to the geoportal with the same user’s credential and until a new modification will occur.
The query/answering facilities are related with the easiness of interaction for analyzing the data associated with the active layers. They are evaluated by means of OGC Web services as WMS, WMS-T and WFS. The WMS-T functionality is used to manage spatio-temporal queries providing, as answers, diagram representations of the temporal variation of some parameter/index, such as the vegetation indices (e.g., NDVI), in specific points of the displayed geographic area (see Figure 10) or averaged over an agronomic district within a desired temporal timespan.
Just by one mouse click on a position in the maps’ visualization pane, the user can perform multiple point queries to all active overlaid layers, in a transparent way, without the need to bother about the format of the single layers, which can include both vector and raster layers and time series. Depending on the knowledge of the layer format (raster or vector), that is returned as attribute by the “get capability” request, the point query is translated into either a WMS, a WMS-T or a WFS request by the geoportal parser. The WFS request is submitted to vector layers by providing as parameter the punctual location selected by the user: the spatial inclusion of the geographic coordinates corresponding to this punctual location within the boundaries of the objects in the vector layers is evaluated and the attribute values associated with the object satisfying the inclusion are retrieved. In the case of raster layer and time series, the selected punctual location identifies a pixel in the image, or time series of images, which allows the user to retrieve the pixel values. The geoportal returns the pixel values of the selected positions for the raster layers and the table of attributes for the polygon containing the selected position for the vector layers. This way, one can contextually analyze multisource heterogeneous information: for example, the operator of the agronomic authority of Lombardy Region (DG AGRI or regional agencies like ERSAF or ARPA) can retrieve information on the crop type associated to the cadastral parcel containing the selected position by the use of the Smart App and cross validate it with the farmer’s declarations from the authoritative SIARL database. The knowledge provided by the tag of the phenological stage of the crop, also created by the use of the Smart App together with the analysis of the NDVI value at the same date, can be exploited by the researcher to derive the NDVI signature of the crop phenological status, which can be useful to train automatic classifiers [48].
Another query/answering facility of the geoportal is the automatic recognition of additional relevant contextual information for a specific queried layer or time series. More specifically, the geoportal exploits the knowledge, provided by sending requests to the Web GIS end point, about the long term average (LTA) of values of the same parameter represented in a queried layer to enrich the answer to the user. For example, if the displayed graph is an NDVI time series from MODIS data, it has associated the LTA for the available period (2003–2013) as contextual information. In such a case, when the time series is queried in a selected position, the result is reported in the form of a graphic diagram showing the temporal variation of the NDVI (blue lines in Figure 10) together with the temporal variation of the LTA and standard deviations of the same parameter (green dotted lines in Figure 10).
Finally, as far as the S4A application automatic processes are activated each time a new layer (e.g., an NDVI layer) is added to a time series so as to compare the values of the current layer with the LTA of the same parameter. The result of the comparison is a “status” map which displays in different colors the pixels that have the value of the parameter far above (>2 sigma), and far below (<2 sigma) the average, which may hint to exceptional and anomalies in crop growth.

5. Related Works

The concept of SDI started to be defined in relation with having an international standard for sharing and exchanging GD at global, national and regional levels. Al Gore motivated the need of SDIs where the Earth could be seen as a three dimensional-multi resolution planet, geo referenced for the visualization of social and physical information [5]. An overview of the state of the art in developed and developing countries of the adoption and implementation of SDI is reported in [3]. It seems that most countries in Europe and America have satisfied the digital earth vision of 2020 requirements meanwhile the SDI concept has changed with the idea of including also the sharing of geo-sensors and human generated georeferenced data (VGI) [49]. In this respect, the Sensor Web Enablement (SWE) standard has been defined by OGC to allow interoperability and metadata encodings that enable real time integration of heterogeneous sensor webs into SDIs.
One of the main issues in SDI is the concept of interoperability that is referred both to data and services. The issue of data interoperability arises due to the heterogeneous nature of GD, which can have different format, i.e., syntax, different structure, i.e., schemas, different semantics, i.e., conflicts of names due to distinct meanings in distinct contexts, distinct updating characteristics, and volumes which demand distinct storage and indexing strategies. The issue of service interoperability is related to both providing an effective discovery of huge amount of GD sets and time series, i.e., it has to do with automating the metadata creation, and the integration of heterogeneous GD in terms of both composition and coordination of services to provide complex functionalities.
Although at present, the main available web services in SDI is WMS, the trend is to supply many stand-alone Web geo services. In the case of need for a complex service a manual composition of a chain of predefined geo services has to be performed [50]. The future challenge is the (semi)-automatic composition of arbitrary services in order to obtain flexible complex services based on the basic available ones. This is not a trivial task due to the heterogeneity of GD. In this respect, S4A geoportal provides complex querying facilities that are obtained by the composition and coordination of distinct web services (WMS, WMS-T and WFS) in a transparent way to the user.
Some research works have already addressed these problems and proposed solutions.
The most comprehensive research on metadata automation is reported in [10]. In this paper, a survey of the research works exploring the background for the automation of metadata of GD in two main areas is reported: digital library and information science community, and the GD community. Metadata extraction and harvesting were acknowledged in both communities as two key methods for automating spatial metadata creation and updating [10]. Researchers in [7,8,9,51] address automatic generation of metadata by metadata inference, the ability to infer complete metadata description, ascending or descending through aggregation relations. In [8], the authors discussed on-going developments for semi-automatic metadata extraction from well-known imagery and cartographic data source, where internal metadata were collected automatically and the user could then choose to add external metadata, and to publish the final metadata record to catalogues. The research work of [34] proposes automatic generation of semantics-enabled GD metadata generated, validated, and propagated during the materialization of a virtual data product. In [39], an open source package named get-it has been developed to allow practitioners of public authorities and research institutions to easily deploy their GD and to support them in the manual creation of correspondent metadata semantically enriched by exploiting contextual information on the theme, source, author, and organization. Recently, [52] developed (Semi-) Automatic Metadata Extraction Tool extracting information from non-spatial (pdf, doc, and txt) and spatial resources (Shapefiles, Feature Classes (File Geodatabase and Personal Geodatabase), SDE Feature Classes, GRID and TIFF) to promote geoportal applications as geographic knowledge portals. Our proposed semi-automatic metadata creation and deploy workflow has been designed and developed by combining these last two approaches, i.e., by using the tool get-it [39] to create a metadata template for each type of product in a folder, and then by adding some metadata fields by extracting information from the products content such as date of creation and bounding box.
As far as the interoperability of crowdsourced georeferenced information from social networks, some approaches based on Web service architecture have been proposed such as [11], where a Web 2.0 Broker (W2B) mediates between client applications and backend Web 2.0 services to provide the discovery and retrieval of information across different crowd-sourcing services. An application of the W2B Broker for integrating SDI and VGI for an application to the real estate management and marketing is described in [53]. Nevertheless, this approach faces the problem of collecting VGI from existing social networks to enable their interoperable management, while in our proposal we address the issue of creating native interoperable VGI: no similar solution has been formulated for a smart App that natively deploys on the Web the created data with standard Wed services.
Finally, as far as complex spatial analysis functionalities of geoportals based on standard Web services, no proposal provides integrated querying and analysis facilities of both vector and raster GD in a transparent way to the user. As in traditional GIS, users must be aware of the GD format, and depending on it, must choose distinct analysis function to analyze the GD.
One example of SDI is the estation processing server, developed by using open source software at the Joint Research Centre for automating the acquisition, processing, OGC compliant sharing and visualization of Earth Observation data products by a common access point [54]. However, compared to our proposed design, estation aims at sharing and querying in an integrated framework VGI and EO data products by focusing on EO data processing. Indeed, it performs in an automatic way those operations that a technician usually carries out manually to create EO data products (such as the downloading of data, the data pre-processing including projection, cropping of the image to the area of interest, cloud contamination removal), leaving only the analysis and interpretation of the results to the environmental expert.
Although both EMMA geoportal of estation SDI and the S4A geoportal provide ad hoc data query facilities to visualize time series of thematic products through an interactive charting tool, the S4A geoportal provides additional query facilities compliant with the principle of data independence in database management systems [13], i.e., users interact with GD and time series independently of their actual format, and the geoportal is in charge of translating the user’s query into proper requests.
Another SDI developed for precision farming in Tokachi region of Hokkaido Japan, named FieldTouch, is described in [55]. FieldTouch integrates multi-scale sensor data for field monitoring, provides functionality for recording farmers’ agricultural practices, e.g., fertilizer management, integrates satellite image time series for monitoring vegetation status, field sensor data from nodes record soil moisture and temperature data at different soil depths, and meteorological variables, e.g., rainfall, solar radiation, wind, etc. provided by a weather observation network. Sensor data are managed by “cloudSense” backend service serving meta-data and data to FieldTouch via Sensor Observation Service. However, one difference is that VGI on agricultural practices is created by the farmers through the user-interface of the system, and not via a smart app as in our case. Moreover, although both rely on remotely sensed data products, such as maps of NDVI, to highlight spatial and temporal variability of crop vigor for farmer intervention, the tools to support the detection of possible anomalies in crop growth are different. FieldTouch includes a simulation tool that contains calibrated crop model parameters derived from long-term agronomic experiments, to estimate crop conditions based on weather scenarios and agriculture practices. While S4A SDI provides query and graph facilities to help the farmer in identifying potential anomalies, by showing the graph of the time variation of NDVI contextually to the long term average variation of the NDVI in a selected area of interest.

6. Conclusions and Future Works

The work presented in this paper resulted in a prototypal SDI architecture for creating, managing and analyzing on the Web multisource heterogeneous GD sets and time series. These datasets have been developed within the S4A project [26,27] for demonstrating the feasibility of a low cost platform to support the Lombardy’s agricultural sector. Heterogeneous refers to GD formats (raster and vector), semantics, and spatio-temporal resolution, and multisource comprises authoritative sources, human sensors and remote sensing image derived products.
In one year, more than 430 datasets, concerning crop type and crop conditions, were made available on the Web through the OGC services by metadata published in an online SDI catalogue. The datasets cover several data themes, such as NDVI from Landsat OLI/TM and NASA-MODIS images, Landsat EVI and NDFI, more than 5000 VGI reports created by field operators and volunteers by means of the S4A Smart App, and agricultural data from authoritative databases enriched by data collected in-situ.
The approach reported in this paper offered an easy way of sharing and analyzing the GD information resources within and beyond the project stakeholders’ community. The architectural solution and implementation we propose has several advantages with respect to current approaches:
  • It is scalable, since it decentralizes the publishing of GD sets and time series on several Web GIS server nodes depending on their information sources, so that new nodes can be added as new sources or more GD to deploy become available.
  • Its implementation is low cost since it is mainly implemented on OGC standard open software, namely Geoserver nodes installations for GD deploy and Geonetwork for metadata management, running in virtual machines deployed on “low-cost” work stations with 16 GB of memory, 1 TB of disk space, four core CPU and price below 1000 EUR.
  • It is fully compliant with OGC standards so that the deployed GD can be discovered and accessed by third party OCG compliant clients.
  • It preserves current daily habits of data producers so as to minimize the additional burden for metadata handling by automating the workflows for the deployment of heterogeneous multisource GD sets and time series and for metadata completion. The only task that is required to data producers is to tag the GD sets and time series to be published by placing them in appropriate folders, whose structure and naming conventions is defined by them, and to keep the comprehensive template metadata record updated in each folder.
  • It provides complex spatial analysis functions developed by orchestrating standard Web services to ease current workflows of spatial analysis which require the user to be aware of the GD formats and structure.
The prototypal version of the S4A SDI is operating and actually supports remote sensing researchers and agronomists in their daily activity. The S4A smart application and SDI have been introduced to volunteer farmers and students of agronomic high schools as potential stakeholders in order to provide them with an initial test-bed of the platform as well as to support the educational process [56].
The first user evaluation of the proposed framework has been carried out by the remote sensing experts using the platform, mainly CNR-IREA researchers, who discovered advantages of having their data published through a GD node to ease their daily activity; thus, they tend to provide more data for publishing almost on a daily basis. As an example, instead of searching for GD in the file system of the data server (e.g., IREA institute data server has a capacity of 100 TB and more than 90% of this space is used), they can use the S4A GD catalogue for searching data of their interest and can invoke OGC services to access the data directly within their usual tools (e.g., GIS clients such as QGIS and ArcMap) [48]. The data available through the S4A platform may significantly support regional administration in the verification process: farmers’ declaration versus early stage crop maps resulting from the analysis of heterogeneous data sources, including remote sensing products, in-situ observations collected by mobile devices and monitoring data such as meteorological information. As a future activity, it is necessary to perform an economic impact assessment of the novel workflows that can be implemented by the use of the GD sets and time series to carry out agronomic practices and administrative controls and decisions [56]. The evaluation should not only verify the amounts of the savings of expenses in the public sector by the massive adoption of the proposed solution, but also estimate both the gaps that still need to be filled and relative investments to be undertaken in order to promote this SDI to an operational service.

Acknowledgments

The research work described in the paper was carried out within the project S4A, jointly funded by Regione Lombardia and CNR, under contract No. 18091/RCC, 05/08/2013. The authors are also very grateful to the Ritmare Flagship Project, funded by the Italian Ministry of University and Research, for providing the EDI MD editor used to create representative metadata records for individual data themes in alignment with INSPIRE and RNDT metadata profiles.

Author Contributions

Gloria Bordogna and Tomas Kliment jointly prepared the manuscript that was revised by the other co-authors. Gloria Bordogna was the principal investigator for the design and development of the SDI. Tomas Kliment developed the overall workflow for GD and metadata deploy, while Luca Frigerio developed both the Smart App and backend and the project personalized geoportal. Pietro Alessandro Brivio was the leader of the S4A project, and contributed together with Daniela Stroppiana and Mirco Boschetti to define the use cases of both the S4A Mobile App and S4A geoportal, while Alberto Crema was the main on field tester and reviewer of both the S4A App and data and metadata publication workflow.

Conflicts of Interest

The authors declare no conflict of interest. The founding sponsors had no role in the design of the study; in the collection, analyses, or interpretation of data; in the writing of the manuscript, and in the decision to publish the results.

Abbreviations

The following abbreviations are used in this manuscript:
APPSmart Application for Smart mobile devices
GDGeospatial Data, i.e., Georeferenced geographic data in the form or vector maps orf georeferenced images
GISGeographic Information System
IREAInstitute for the Electromagnetic Sensing of the Environment
NDVINormalized Difference Vegetation Index
OGCOpen Geospatial Consortium
SDISpatial Data Infrastructure
VGIVolunteered Geographic Information
WFSWeb Feature Service
WMSWeb Map Service
WMS-TWeb Map Service-Time

References

  1. Scharl, A.; Tochtermann, K. (Eds.) The Geospatial Web: How Geobrowsers, Social Software and the Web 2.0 are Shaping the Network Society; Springer: London, UK, 2007.
  2. Sanderson, M.; Kohler, J. Analyzing geographic queries. In Proceedings of the 2004 Workshop on Geographic Information Retrieval SIGIR, Sheffield, UK, 25–29 July 2004.
  3. Tuma, A.; Ahmad, A. Geographic information system and spatial data infrastructure: A developing societies’ perception. Univ. J. Geosci. 2014, 2, 85–92. [Google Scholar]
  4. Goodchild, M.F. Citizens as sensors: The world of volunteered geography. GeoJournal 2007, 69, 211–221. [Google Scholar] [CrossRef]
  5. Craglia, M.; Goodchild, M.F.; Annoni, A.; Camara, G.; Gould, M.; Kuhn, W.; Mark, D.; Masser, I.; Maguir, D.; Eliang, S.; et al. Next-generation digital earth: A position paper from the vespucci initiative for the advancement geographic information science. Int. J. Spat. Data Infrastruct. Res. 2008, 3, 146–167. [Google Scholar]
  6. The European Parliament and the Council of the European Union. Directive 2007/2/EC of the European Parliament and of the Council of 14 March establishing an Infrastructure for Spatial Information in the European Community (INSPIRE). Available online: http://eur-lex.europa.eu/legal-content/EN/ALL/?uri=CELEX:32007L0002 (accessed on 10 October 2014).
  7. Trilles, S.; Díaz, L.; Gil, J.; Huerta, J. Assisted generation and publication of geospatial metadata. In Proceedings of the 15th AGILE International Conference on Geographic Information Science: Bridging the Geographic Information Sciences, Avignon, France, 24–26 April 2012; pp. 105–110.
  8. Díaz, L.; Martín, C.; Gould, M.; Granell, C.; Manso, M.A. Semi-automatic metadata extraction from imagery and cartographic data. In Proceedings of the IEEE International Geoscience and Remote Sensing Symposium, Barcelona, Spain, 23–28 July 2007; pp. 3051–3052.
  9. Nogueras-Iso, J.; Zarazaga-Soria, F.J.; MuroMedrano, P.R. Geographic information metadata for spatial data infrastructures. Resour. Interoper. Inf. Retr. 2005. [Google Scholar] [CrossRef]
  10. Olfat, H. Automatic Spatial Metadata Updating and Enrichment. Master’s Thesis, The University of Melbourne, Melbourne, Vic, Australia, 2013. [Google Scholar]
  11. Diaz, L.; Granell, C.; Huerta, J.; Gould, M. Web 2.0 Broker, A standards-based service for spatio-temporal search of crowd-sourced information. Appl. Geogr. 2012, 35, 448–459. [Google Scholar] [CrossRef]
  12. Pebesma, E. Spacetime: Spatio-temporal data in R. J. Stat. Softw. 2012, 51, 1–30. [Google Scholar] [CrossRef]
  13. Rigaux, P.; Scholl, M.; Voisard, A. Spatial Databases with Applications to GIS; Morgan Kaufmann Publisher: Burlington, MA, USA, 2002. [Google Scholar]
  14. Villa, P.; Reitz, T.; Gomarasca, M. The HUMBOLDT project: Implementing a framework for geo-spatial data harmonization and moving towards an ESDI. In GeoInformation in Europe; Gomarsca, M.A., Ed.; IOS Press: Amsterdam, The Netherlands, 2007; pp. 29–36. [Google Scholar]
  15. The European Parliament and the Council of the European Union: Directive 2003/98/EC of the European Parliament and of the Council of 17 November 2003 on the re-use of public sector information. Available online: http://eur-lex.europa.eu/LexUriServ/LexUriServ.do?uri=OJ:L:2003:345:0090:0096:en:PDF (accessed on 10 October 2014).
  16. SmartOpenData. Available online: http://www.smartopendata.eu/ (accessed on 10 October 2014).
  17. Smart Open Data. SDI4Apps Developers Blog. Available online: http://www.smartopendata.eu/news/sdi4apps-developers-blog (accessed on 10 October 2014).
  18. OpenGeo. Available online: http://suite.opengeo.org/dashboard/ (accessed on 10 October 2014).
  19. OSGeo community. Available online: http://www.osgeo.org/ (accessed on 10 October 2014).
  20. Zuiderwijk, A.; Janssen, M. Open data policies, their implementation and impact: A framework for comparison. Gov. Inf. Q. 2014, 31, 17–29. [Google Scholar] [CrossRef]
  21. Mayer-Schönberger, V.; Cukier, K. Big Data: A Revolution That will Transform How We Live, Work, and Think; Houghton Mifflin Harcourt: Boston, MA, USA, 2013. [Google Scholar]
  22. Jaffe, J. Web at 25, W3C at 20: An opportunity to reflect and look to the future. IEEE Internet Comput. 2014, 18, 74–78. [Google Scholar] [CrossRef]
  23. Béjar, R.; Lopez-Pellicer, F.J.; Nogueras-Iso, J.; ZarazagaSoria, F.J.; Muro-Medrano, P.R. A protocol for machinereadable cache policies in OGC web services: Application to the EuroGeoSource information system. Environ. Model. Softw. 2014, 60, 346–356. [Google Scholar] [CrossRef]
  24. Sui, D. Opportunities and impediments for open GIS. Trans. GIS 2014, 18, 1–24. [Google Scholar] [CrossRef]
  25. Ivánová, I.; Morales, J.; de By, R.A.; Beshe, T.S.; Gebresilassie, M.A. Searching for spatial data resources by fitness for use. J. Spat. Sci. 2013, 58, 15–28. [Google Scholar] [CrossRef]
  26. Space4Agri Project. Available online: http://space4agri.irea.cnr.it/it (accessed on 12 May 2016).
  27. Kliment, T.; Bordogna, G.; Frigerio, L.; Stroppiana, D.; Crema, A.; Boschetti, M.; Sterlacchini, S.; Brivio, P.A. Supporting a regional agricultural sector with Geo & mainstream ICT—The case study of space4agri project. Agris Online Pap. Econ. Inform. 2014, 6, 69–80. [Google Scholar]
  28. PostGreSQL. Available online: http://www.postgresql.org (accessed on 12 May 2016).
  29. PostGIS. Available online: http://www.postgresql.org/ (accessed on 12 May 2016).
  30. GeoServer. Available online: http://geoserver.org/ (accessed on 12 May 2016).
  31. GeoNetwork. Available online: http://www.geonetwork.it (accessed on 12 May 2016).
  32. QGIS. Available online: http://www.qgis.org (accessed on 12 May 2016).
  33. Rouse, J.W.; Haas, R.H.; Schell, J.A.; Deering, D.W. Monitoring vegetation systems in the Great Plains with ERTS. In Proceedings of the Third Earth Resources Technology Satellite-1 Symposium, Washington, DC, USA, 10–14 December 1973; pp. 309–317.
  34. Huete, A.R.; Liu, H.; Batchily, K.; van Leeuwen, W. A comparison of vegetation indices over a global set of TM images for EOS-MODIS. Remote Sens. Environ. 1997, 59, 440–451. [Google Scholar] [CrossRef]
  35. Gamon, J.A.; Surfus, J.S. Assessing leaf pigment content and activity with a reflectometer. New Phytol. 1999, 143, 105–117. [Google Scholar] [CrossRef]
  36. Boschetti, M.; Nutini, F.; Manfron, G.; Brivio, P.A.; Nelson, A. Comparative analysis of normalised difference spectral indices derived from MODIS for detecting surface water in flooded rice cropping systems. PLoS ONE 2014, 9, e88741. [Google Scholar] [CrossRef] [PubMed]
  37. Bordogna, G.; Kliment, T.; Frigerio, L.; Carrara, P. Volunteered geographic information and spatial data infrastructures to promote s-low resources: The case study of the “Orti di Bergamo” smart application. In Centrality of Territories; Casti, E., Burini, F., Eds.; Sestante Edizioni Publisher: Bergamo, Italy, 2015; pp. 165–182. [Google Scholar]
  38. BBCH Ontology Definition. Available online: http://wiki.plantontology.org/index.php/Growth_Stages_Ontology_Principles (accessed on 10 October 2014).
  39. Fugazza, C.; Basoni, A.; Menegon, S.; Oggioni, A.; Pavesi, F.; Pepe, M.; Sarretta, A.; Carrara, P. RITMARE: Semantics aware harmonisation of data in Italian marine research. Procedia Comput. Sci. 2014, 33, 261–265. [Google Scholar] [CrossRef]
  40. Voges, U.; Senkler, K. OpenGIS Catalogue Services Specification 2.0. 2-ISO Metadata Application Profile; OGC Document Ref. Number OGC07-006r1; Open Open Geospatial Consortium (OGC): Wayland, MA, USA, 2007. [Google Scholar]
  41. Whiteside, A. OGC Web Services Common Specification; Open Geospatial Consortium (OGC): Wayland, MA, USA, 2007. [Google Scholar]
  42. ESRI Shapefile Technical Description: An ESRI White Paper—July 1998. Available online: https://www.esri.com/library/whitepapers/pdfs/shapefile.pdf (accessed on 12 May 2016).
  43. Open Street Map Project. Available online: http://www.openstreetmap.org (accessed on 12 May 2016).
  44. Ticheler, J.; Hielkema, J.U. Geonetwork opensource internationally standardized distributed spatial information management. OSGeo J. 2007, 2, 1–6. [Google Scholar]
  45. Zhou, D.P.; Xie, K.L. Lucene search engine. Comput. Eng. 2007, 33, 95–96. [Google Scholar]
  46. Space4Agri Project Geo-Catalogue service. Available online: http://155.253.20.86/geonetwork/srv/eng/catalog.search (accessed on 12 May 2016).
  47. Space4Agri Project Geo-portal. Available online: http://155.253.20.86:8080/Space4AgriGeoPortal/ (accessed on 12 May 2016).
  48. Villa, P.; Stroppiana, D.; Fontanelli, G.; Azar, R.; Brivio, P.A. In-season mapping of crop type with optical and X-band SAR data: A classification tree approach using synoptic seasonal features. Remote Sens. 2015, 7, 12859–12886. [Google Scholar] [CrossRef]
  49. Craglia, M.; De Bie, K.; Jackson, D.; Pesaresi, M.; Remetey-Fülöpp, G.; Wang, C.; Annoni, A.; Bian, L.; Campbell, F.; Ehlers, M.; et al. Digital Earth 2020: Towards the vision for the next decade. Int. J. Digit. Earth 2012, 5, 4–21. [Google Scholar] [CrossRef]
  50. Vaccari, L.; Shvaiko, P.; Marchese, M. A geo-service semantic integration in spatial data infrastructures. Int. J. Spat. Data Infrastruct. Res. 2009, 4, 24–51. [Google Scholar]
  51. Yue, P.; Gong, J.; Di, L.; He, L. Automatic geospatial metadata generation for earth science virtual data products. Geoinformatica 2012, 16, 1–29. [Google Scholar] [CrossRef]
  52. Vockner, B.; Richter, A.; Mittlböck, M. From geoportals to geographic knowledge portals. ISPRS Int. J. Geo-Inf. 2013, 2, 256–275. [Google Scholar] [CrossRef]
  53. Salajegheh, J.; Hakimpou, F.; Esmaeily, A. Developing a web-based system by integrating VGI and SDI for real estate management and marketing. Int. J. Arch. Photogramm. Remote Sens. Spat. Inf. Sci. 2014, 40, 231–236. [Google Scholar] [CrossRef]
  54. Clerici, M.; Combal, B.; Pekel, J.F.; Dubois, G.; van’t Klooster, J.; Skøien, J.O.; Bartholomé, E. The eStation, an earth observation processing service in support to ecological monitoring. Ecol. Inform. 2013, 18, 162–170. [Google Scholar] [CrossRef]
  55. Honda, K.; Ines, A.V.M.; Yui, A. Agriculture information service built on geospatial data infrastructure and crop modelling. In Proceedings of the 2014 International Workshop on Web Intelligence and Smart Sensing, Saint Etienne, France, 1–2 September 2014.
  56. L’Astorina, A.; Tomasoni, I.; Basoni, A.; Carrara, P. Commentary beyond the dissemination of earth observation research: Stakeholders’ and users’ involvement in project co-design. J. Sci. Commun. 2015, 14, 1–10. [Google Scholar]
Figure 1. Architecture of the Space4Agri (S4A ) Spatial Data Infrastructure (SDI).
Ijgi 05 00073 g001
Figure 2. Workflow of the in-situ data created by means of the S4A Smart App.
Ijgi 05 00073 g002
Figure 3. Schema of the GD base containing the in-situ observations.
Ijgi 05 00073 g003
Figure 4. Schematic representation of the workflow designed to automate the process of GD and metadata publishing within the SDI implemented in the S4A project (source: own processing).
Ijgi 05 00073 g004
Figure 5. S4A geoportal showing a GD layer of in-situ observations of crop types created by the use of the S4A Smart App (source: own processing).
Ijgi 05 00073 g005
Figure 6. EVI 2014 time series layer: An example of a time series raster data published automatically on GeoServer Web GIS server deployed in S4A-SDI for the year 2014; the EVI vegetation index shown by each image is assumed to be a proxy of vegetation biomass. From left top to right down, individual datasets produced for a certain time period of the year 2014 and which define the final 2014 series layer (source: own processing).
Ijgi 05 00073 g006
Figure 7. Example of VGI reports created with the S4A Smart APP and automatically published as WMS layers and WFS features. (a) screenshots of the S4A Smart APP: the top center panel shows the main menu depicting six icons associated with the possible choices of VGI reports one can create (a picture; a free textual annotation; one can send locally stored VGI items previously created; a crop sowing date; a BBCH stage; an agro-practice observation); the other panels show the lower level menus of the APP for the distinct types of VGI reports. Distinct layers of VGI reports: (b) crop typologies, (c) agro-practices, (d) free textual annotations and pictures, respectively. (Source: own processing).
Ijgi 05 00073 g007aIjgi 05 00073 g007bIjgi 05 00073 g007c
Figure 8. GD set of agricultural parcels from map of cadastral parcels and subset with extended data collected by field operators and verified by researchers and/or regional operator published as WMS layer and WFS features (source: own processing).
Ijgi 05 00073 g008
Figure 9. Discovering the GD layers available for the theme NDVI_MODIS and INSPIRE metadata of a series NDVI MODIS for year 2013 (Source: own processing).
Ijgi 05 00073 g009
Figure 10. (a) S4A geoportal screenshot showing the answer of two spatio-temporal queries over a time series of NDVI for the year 2014, derived by processing MODIS source data, represented in the form of diagram: the diagrams display the temporal variation of NDVI in the selected points (pixels) within rice cultivated fields identified by pins on the geographic area. (b) and (c) are the diagrams shown in (a) in which one can better appreciate the difference of NDVI variation in the two selected points: the blue line is the variation of the NDVI during year 2014 for the a pixel contextually mapped with the average (light blue dotted line), maximum (upper green dotted line) and minimum (lower green dotted line) long term variation of the NDVI for the same pixel (computed over the period 2003–2013). (source: own processing).
Ijgi 05 00073 g010aIjgi 05 00073 g010b
Table 1. Key role factors favoring SDI development.
Legislation and new strategiesEuropean Directive 2007/2/EC-INSPIRE- and 2003/98/EC—“PSI Directive” [6,15]
Standardization activitiesWorld Wide Consortium (W3C) and Open Geospatial Consortium (OGC) recommendations for improving interoperability of GD on the Web (e.g., SmartOpenData [16] and SDI4Apps [17] projects)
Increasing trend of available free and open softwareOpen software for GD management (OpenGeo [18], OSGeo community [19])
Decreasing trend of market prices for hardware resourcescloud computing services and Service-Oriented Architectures (SOA)
Table 2. XSL fragment for automatic metadata generation for NDVI GD.
<!--
ROUTING TO SPACE4AGRI NDVI WMS SERVICE—DATASET TEMPLATES
-->
<xsl:when test="contains(/WMT_MS_Capabilities/Service/Title,'NDVI:')">
	<xsl:apply-templates select="." mode="NDVI">
		<xsl:with-param name="NDVI_Name" select="$Name"/>
		<xsl:with-param name="NDVI_uuid" select="$uuid"/>
		<xsl:with-param name="NDVI_lang" select="$lang"/>
		<xsl:with-param name="NDVI_topic" select="$topic"/>
		<xsl:with-param name="NDVI_maxCRS" select="$maxCRS"/>
	</xsl:apply-templates>
</xsl:when>
<!--
ROUTING TO GEONETWORK DEFAULT WMS SERVICE TEMPLATE
-->
<xsl:otherwise>
	<xsl:apply-templates/>
</xsl:otherwise>

