QRA-Grid: Quantitative Risk Analysis and Grid-based Pre-warning Model for Urban Natural Gas Pipeline

Abstract
:1. Introduction
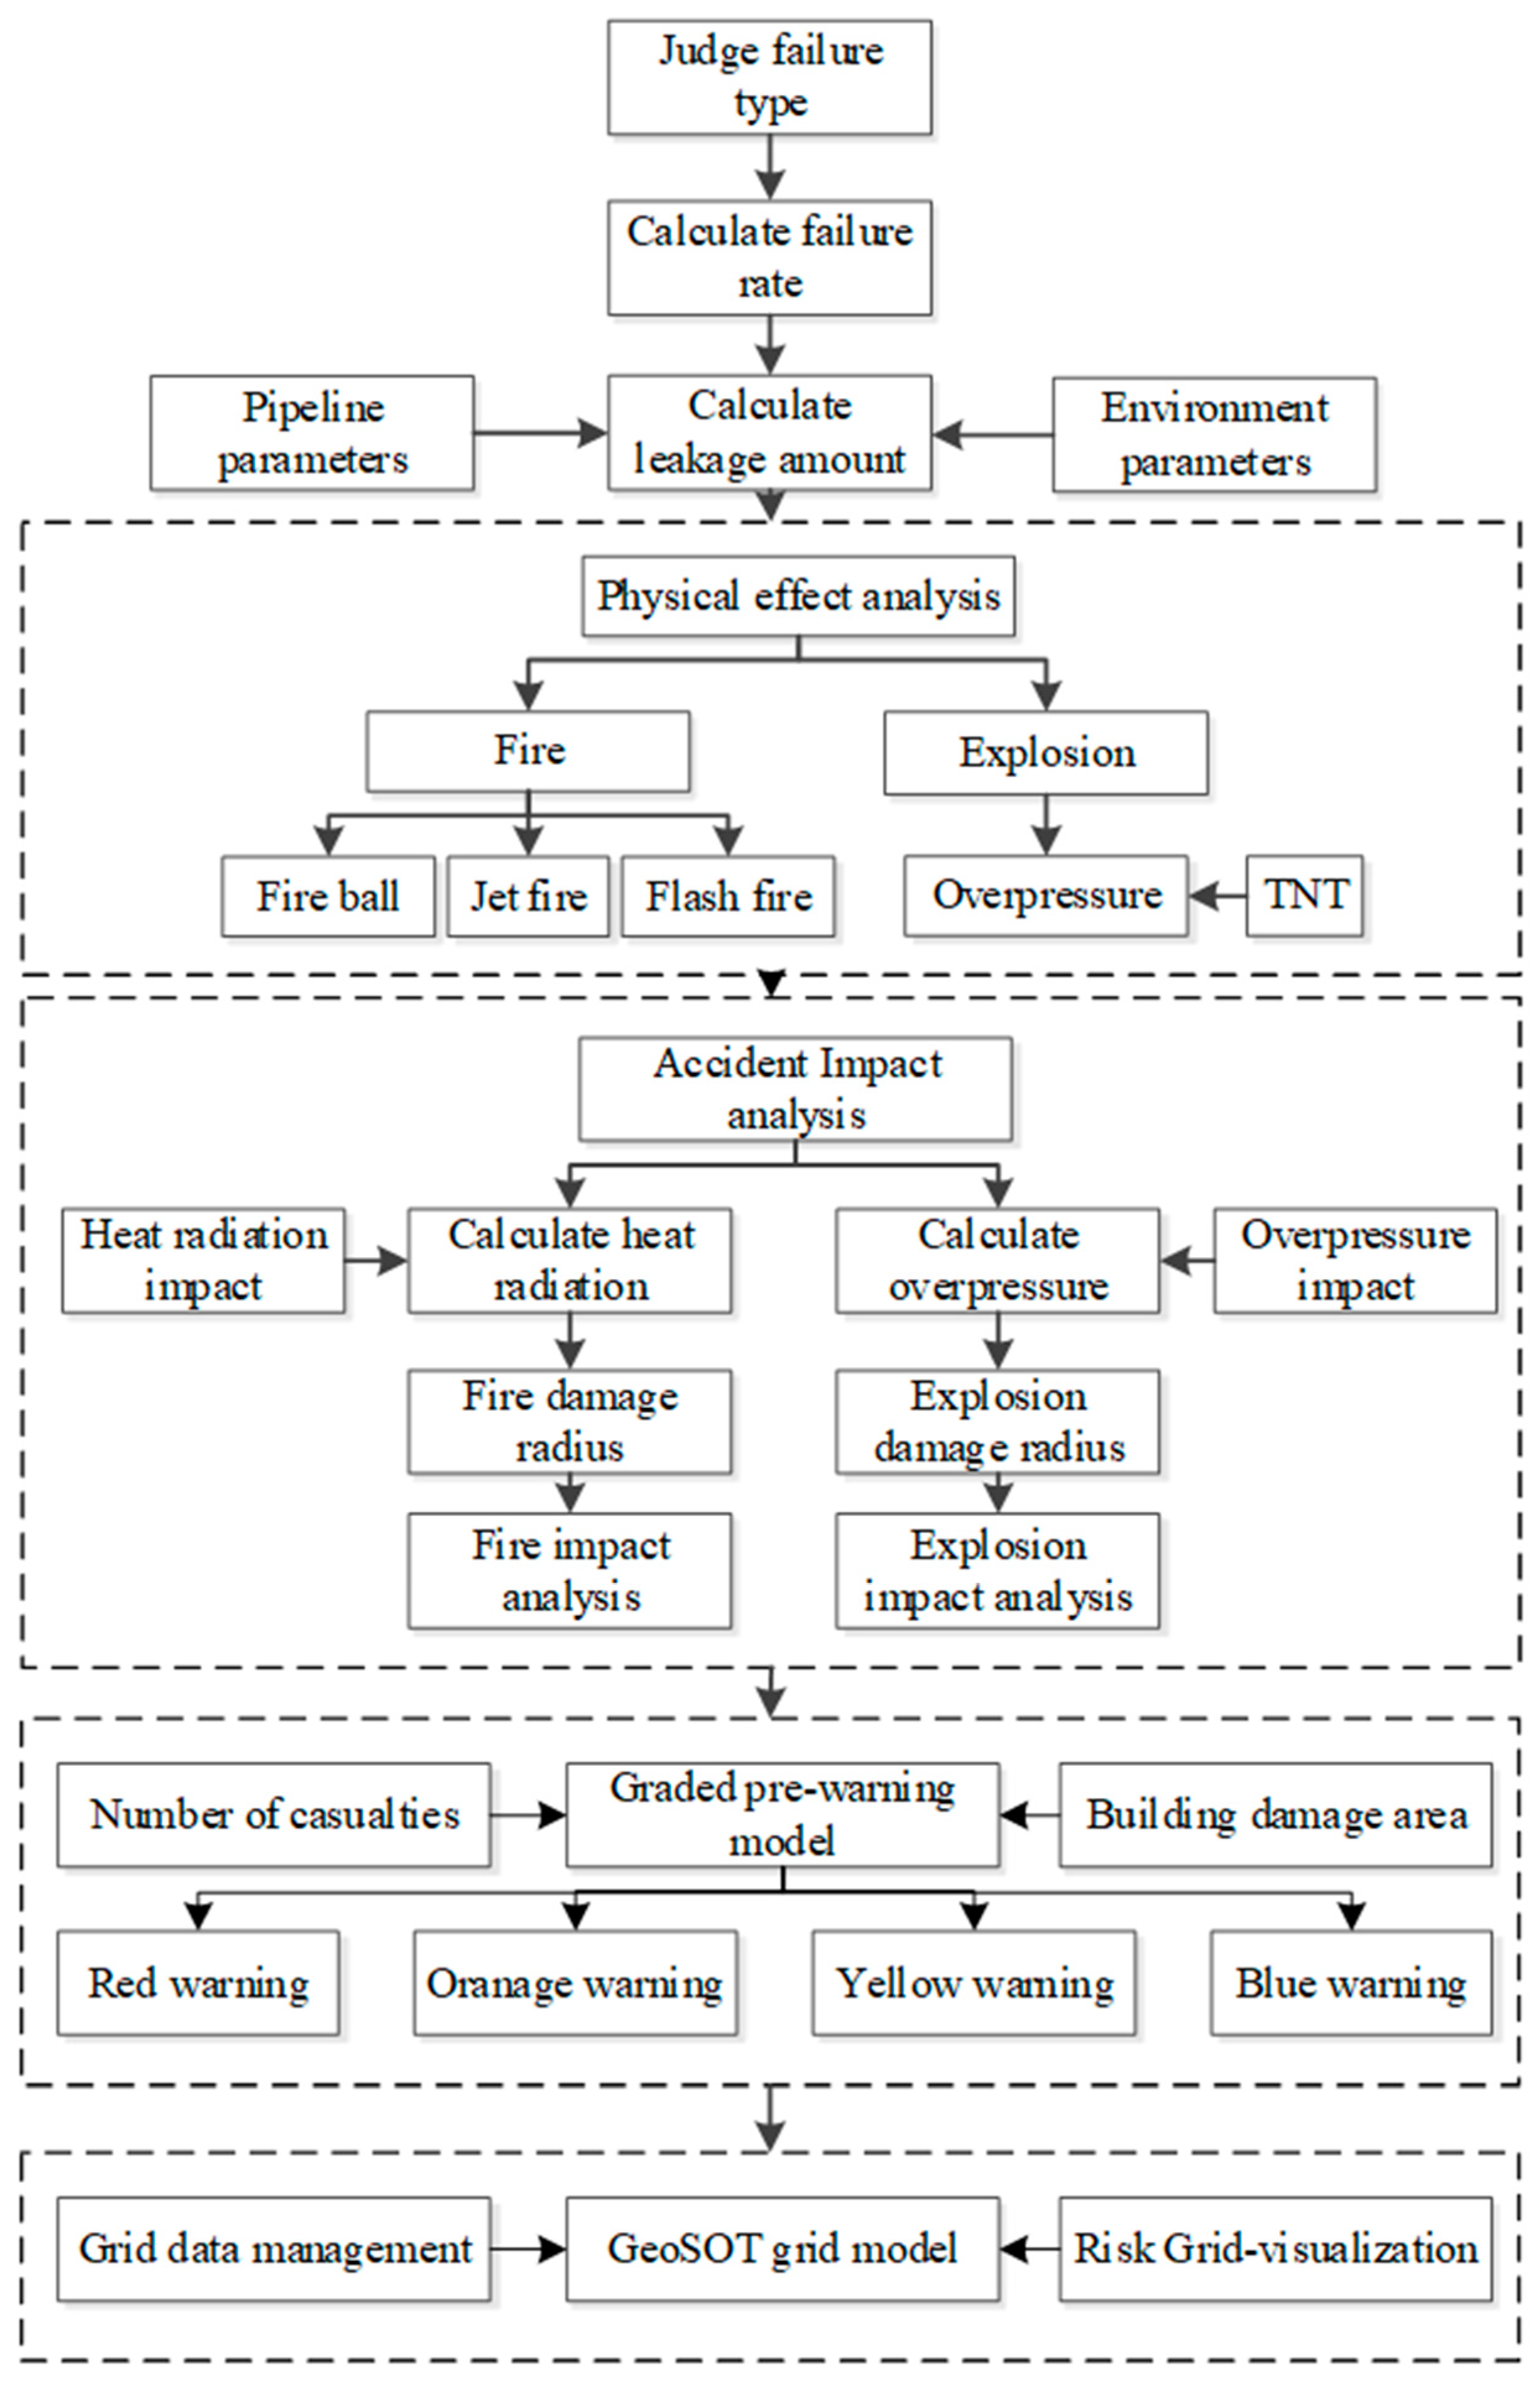
2. Methods
2.1. Quantitive Risk Analysis
2.1.1. Calculation of Failure Rate
2.1.2. Calculation of Leakage Amount
2.1.3. Physical Effect Analysis
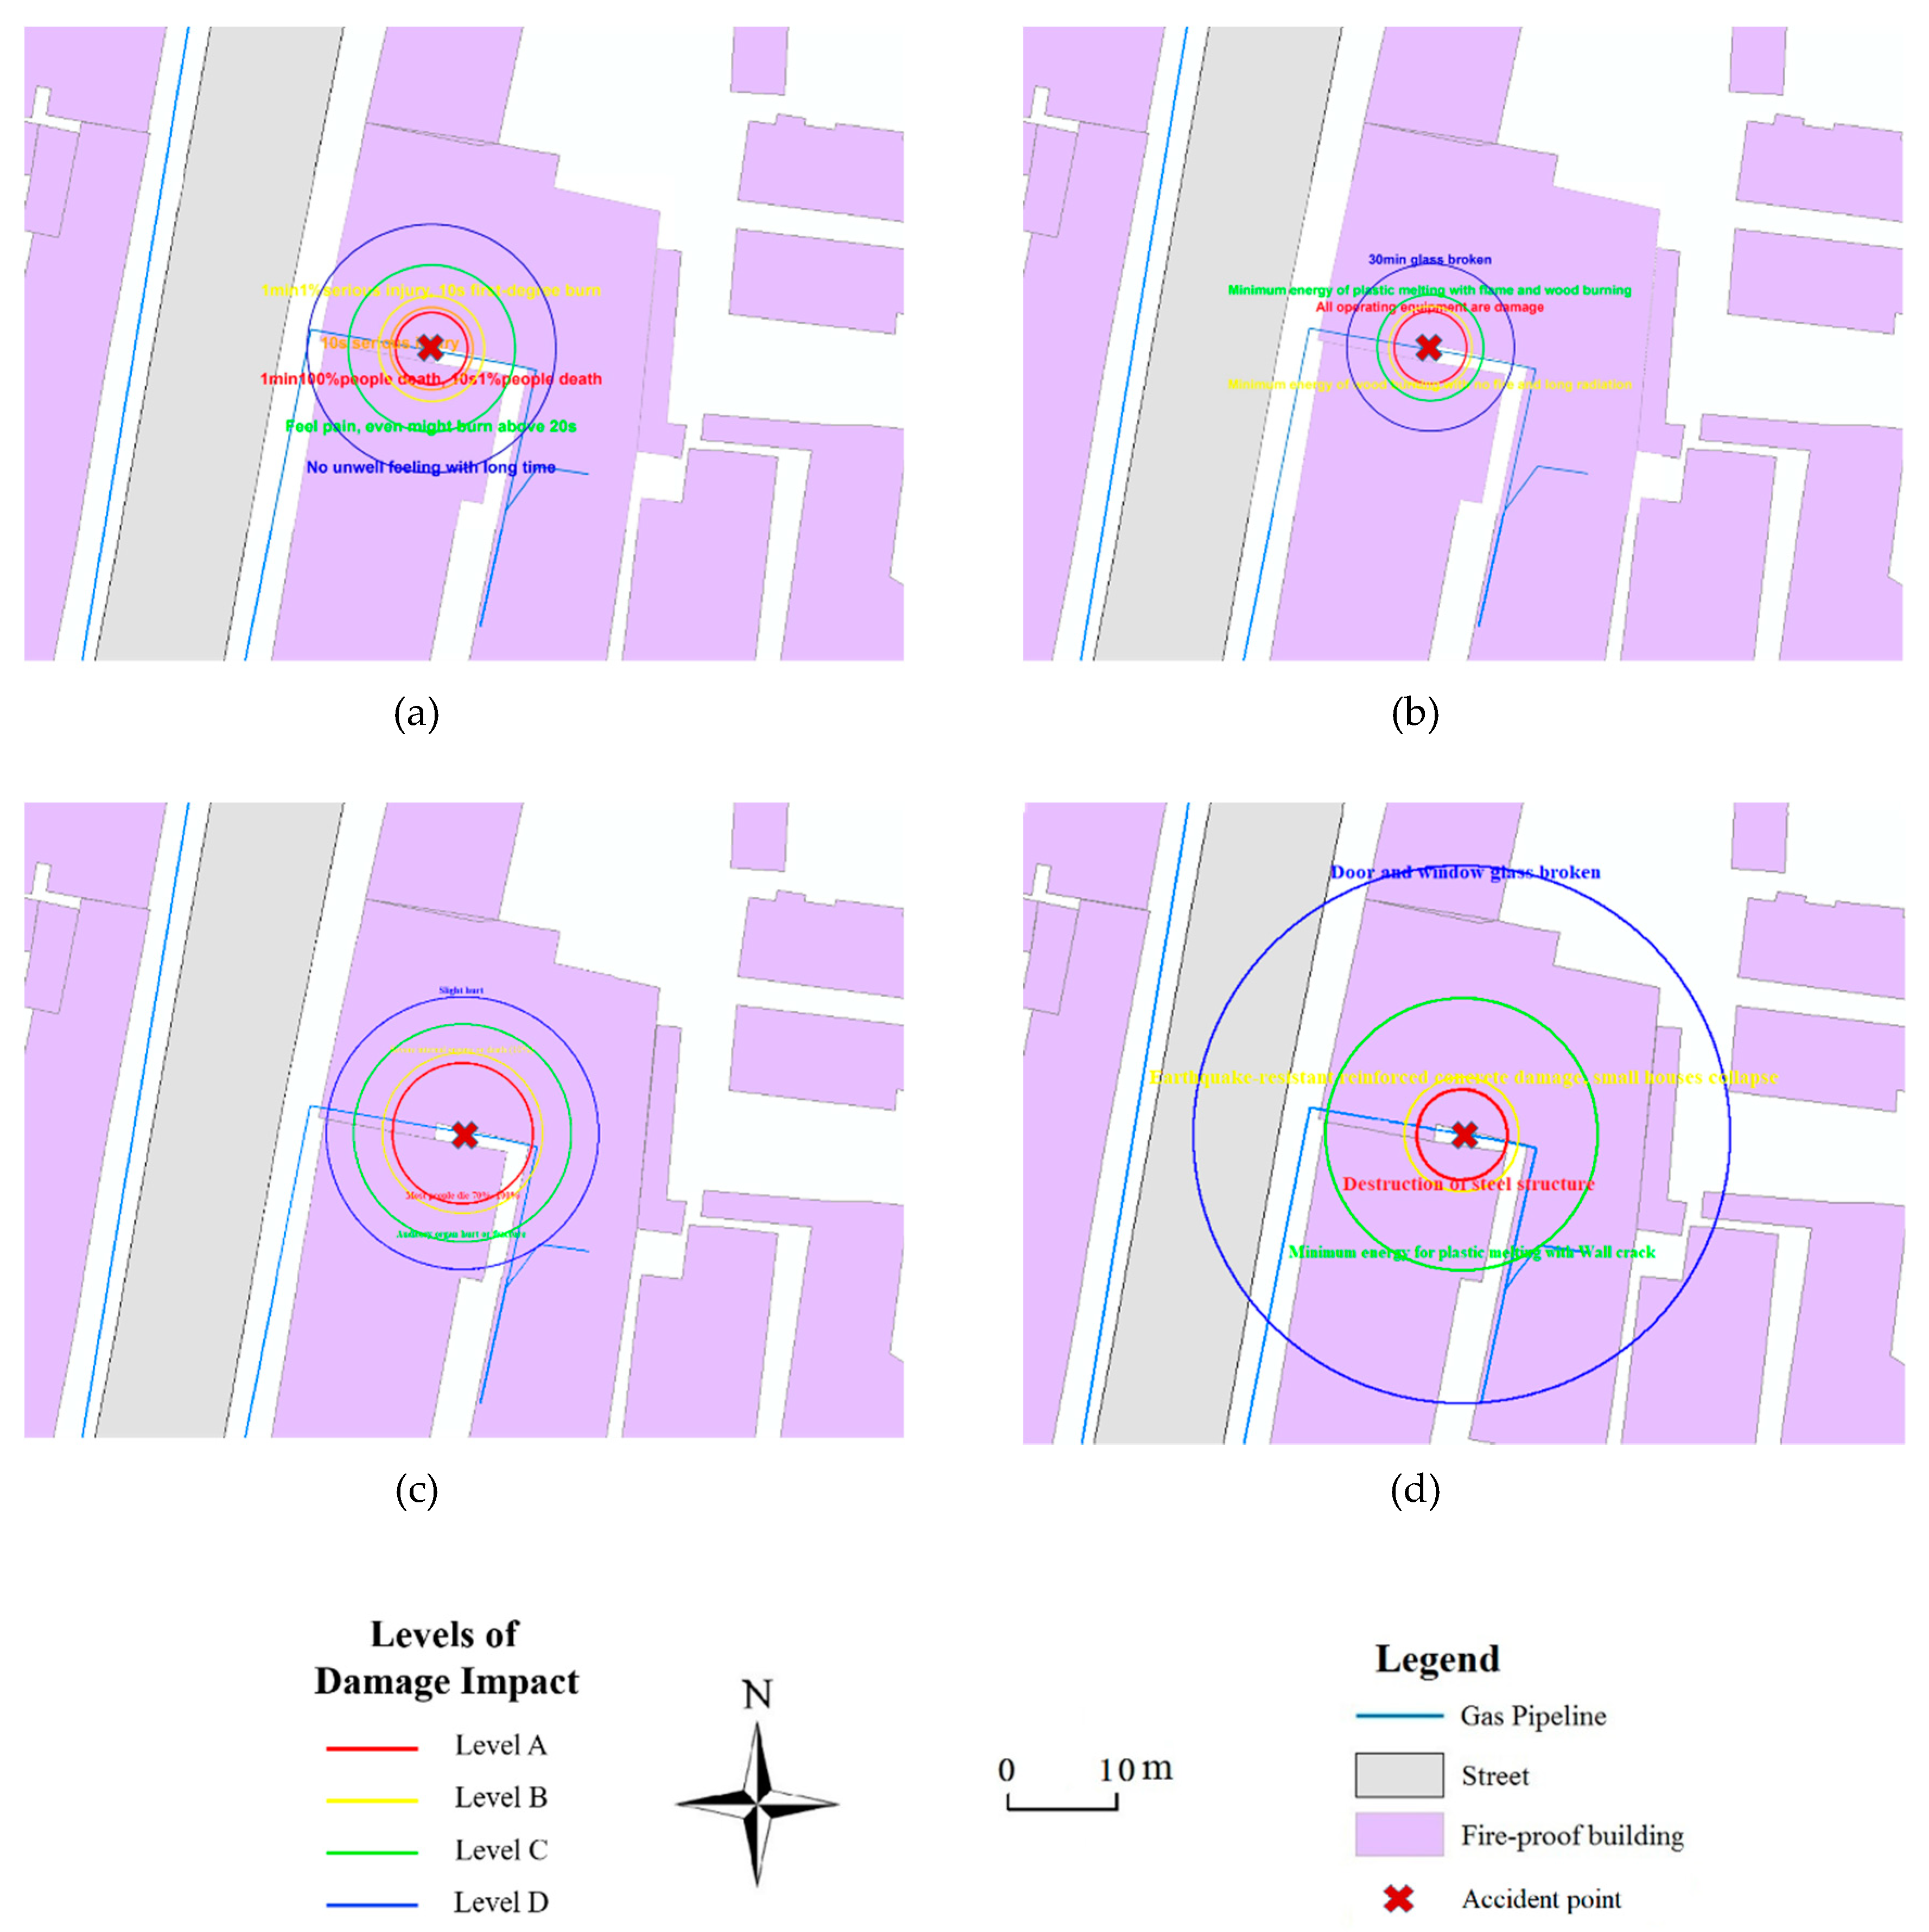
2.1.4. Accident Impact Analysis
2.2. Pre-Warning Model
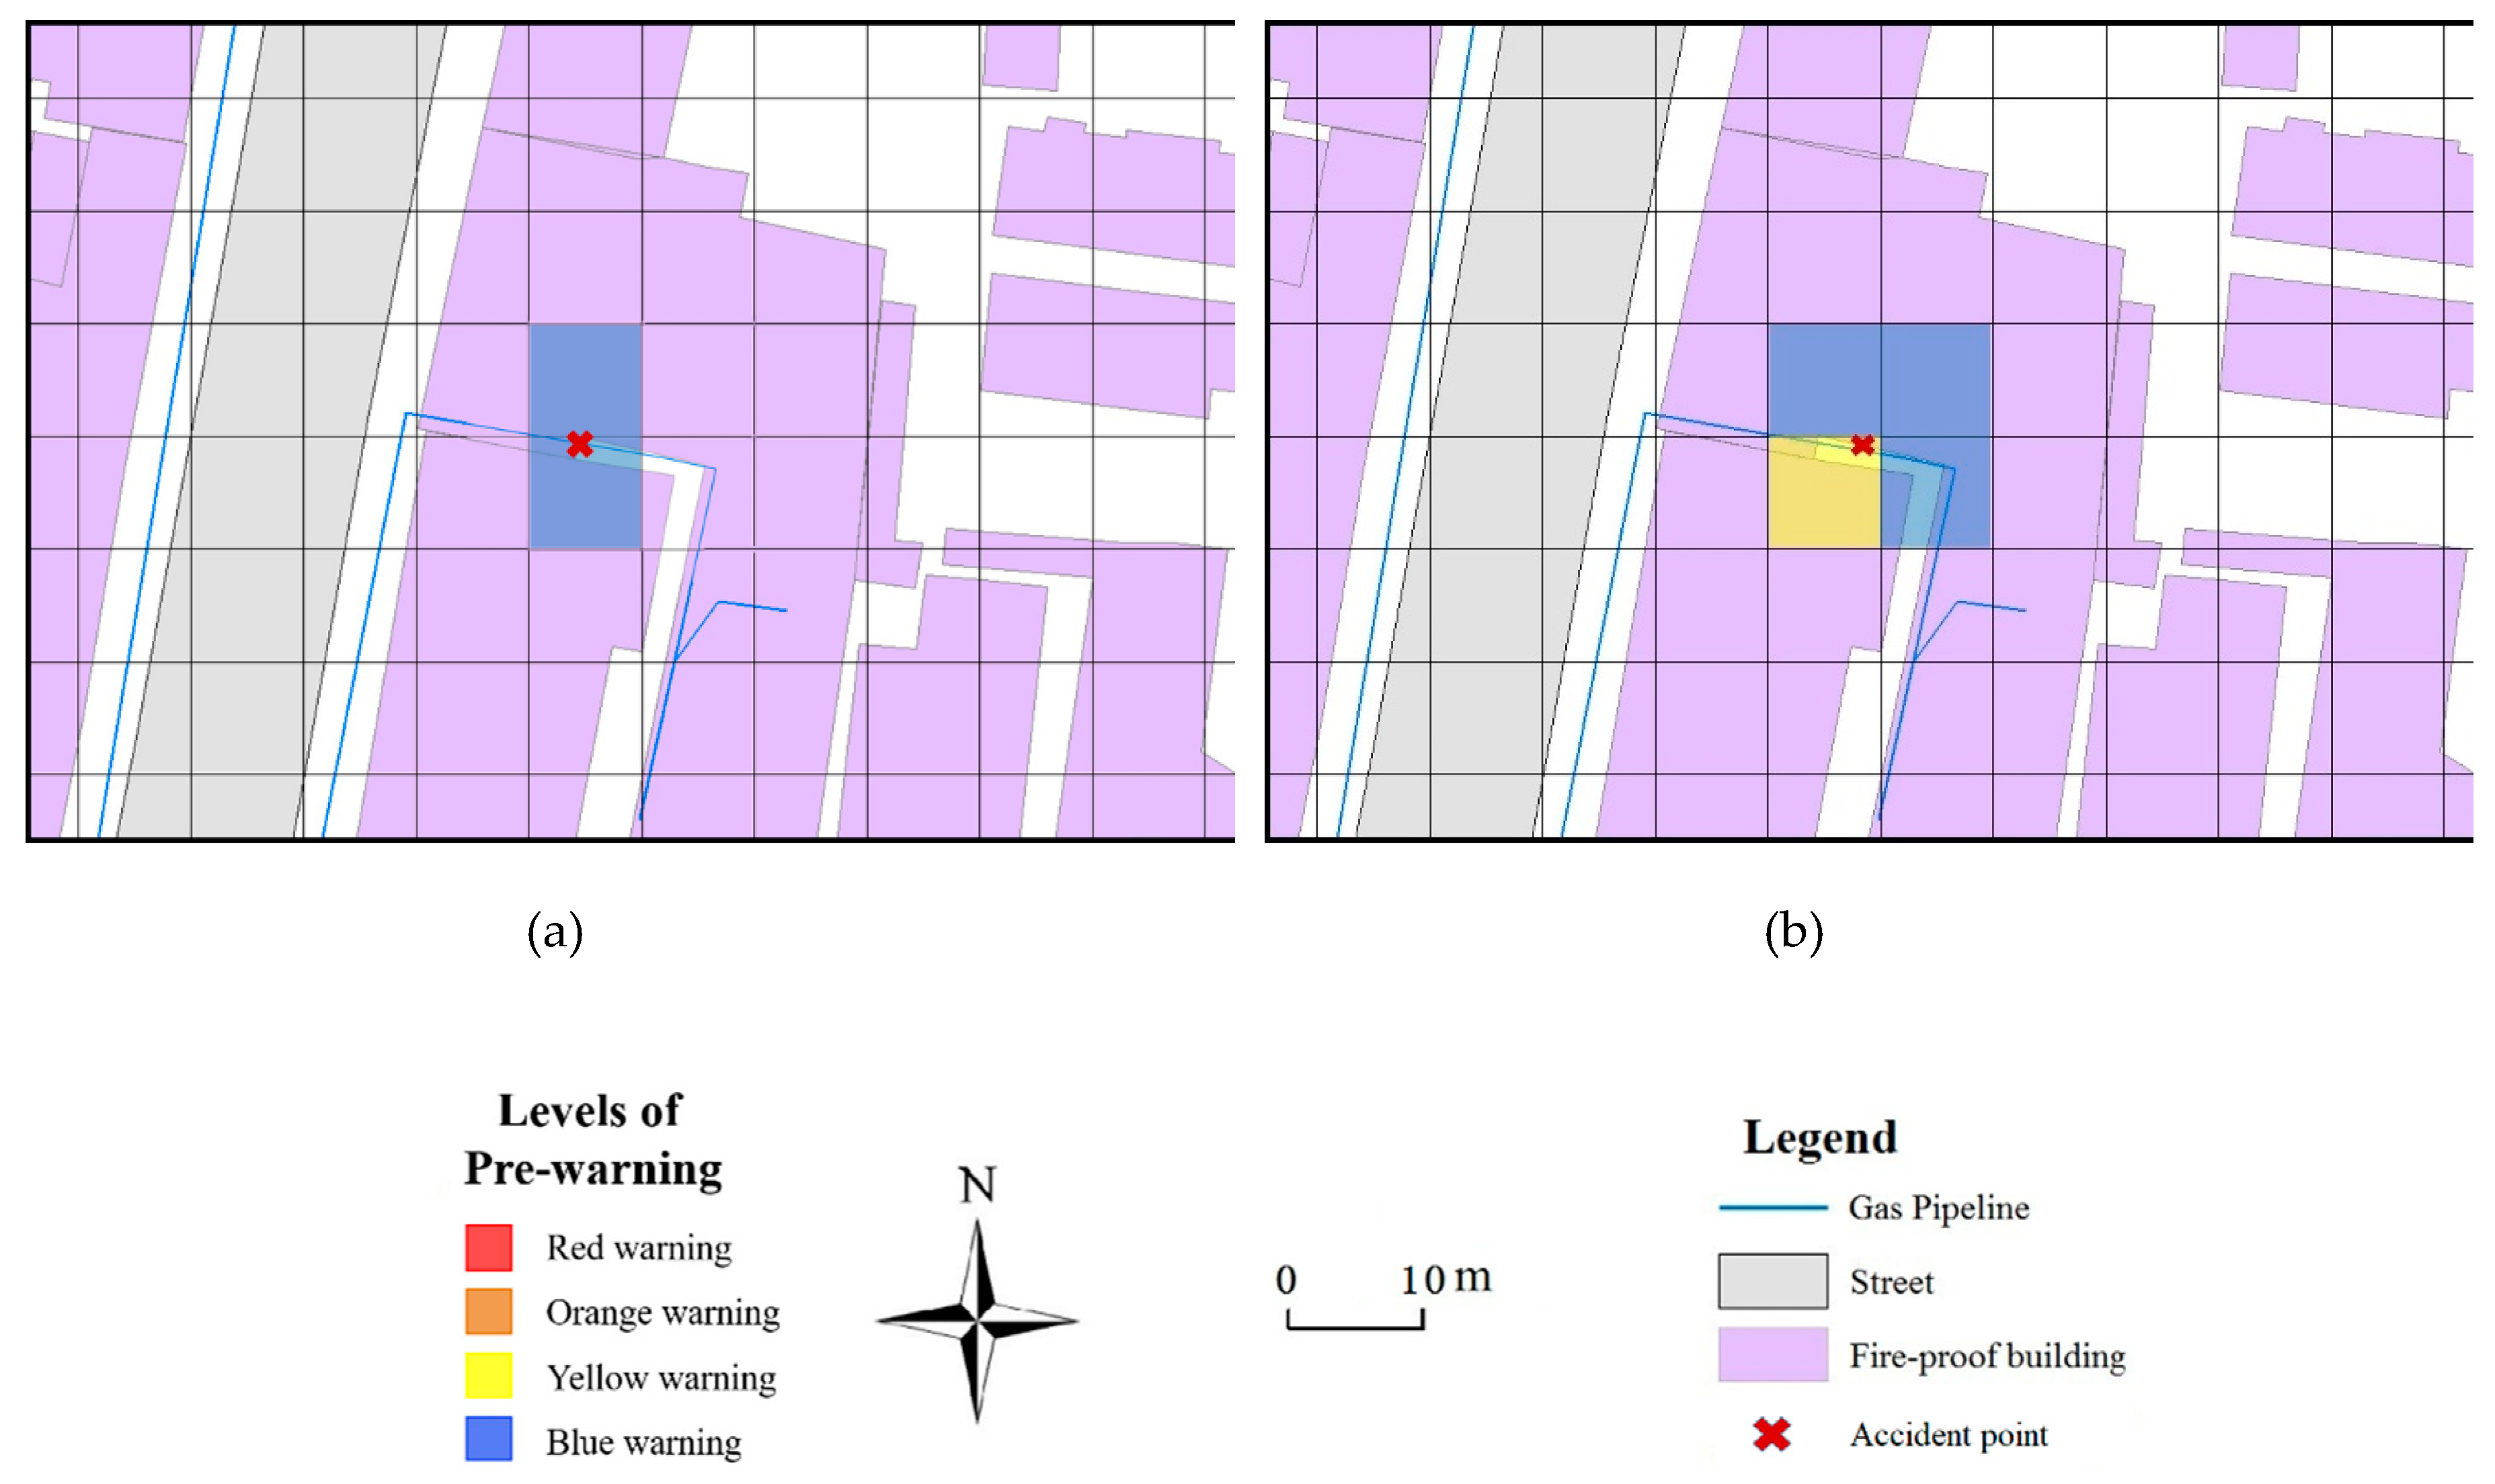
2.2.1. Graded Pre-Warning Model
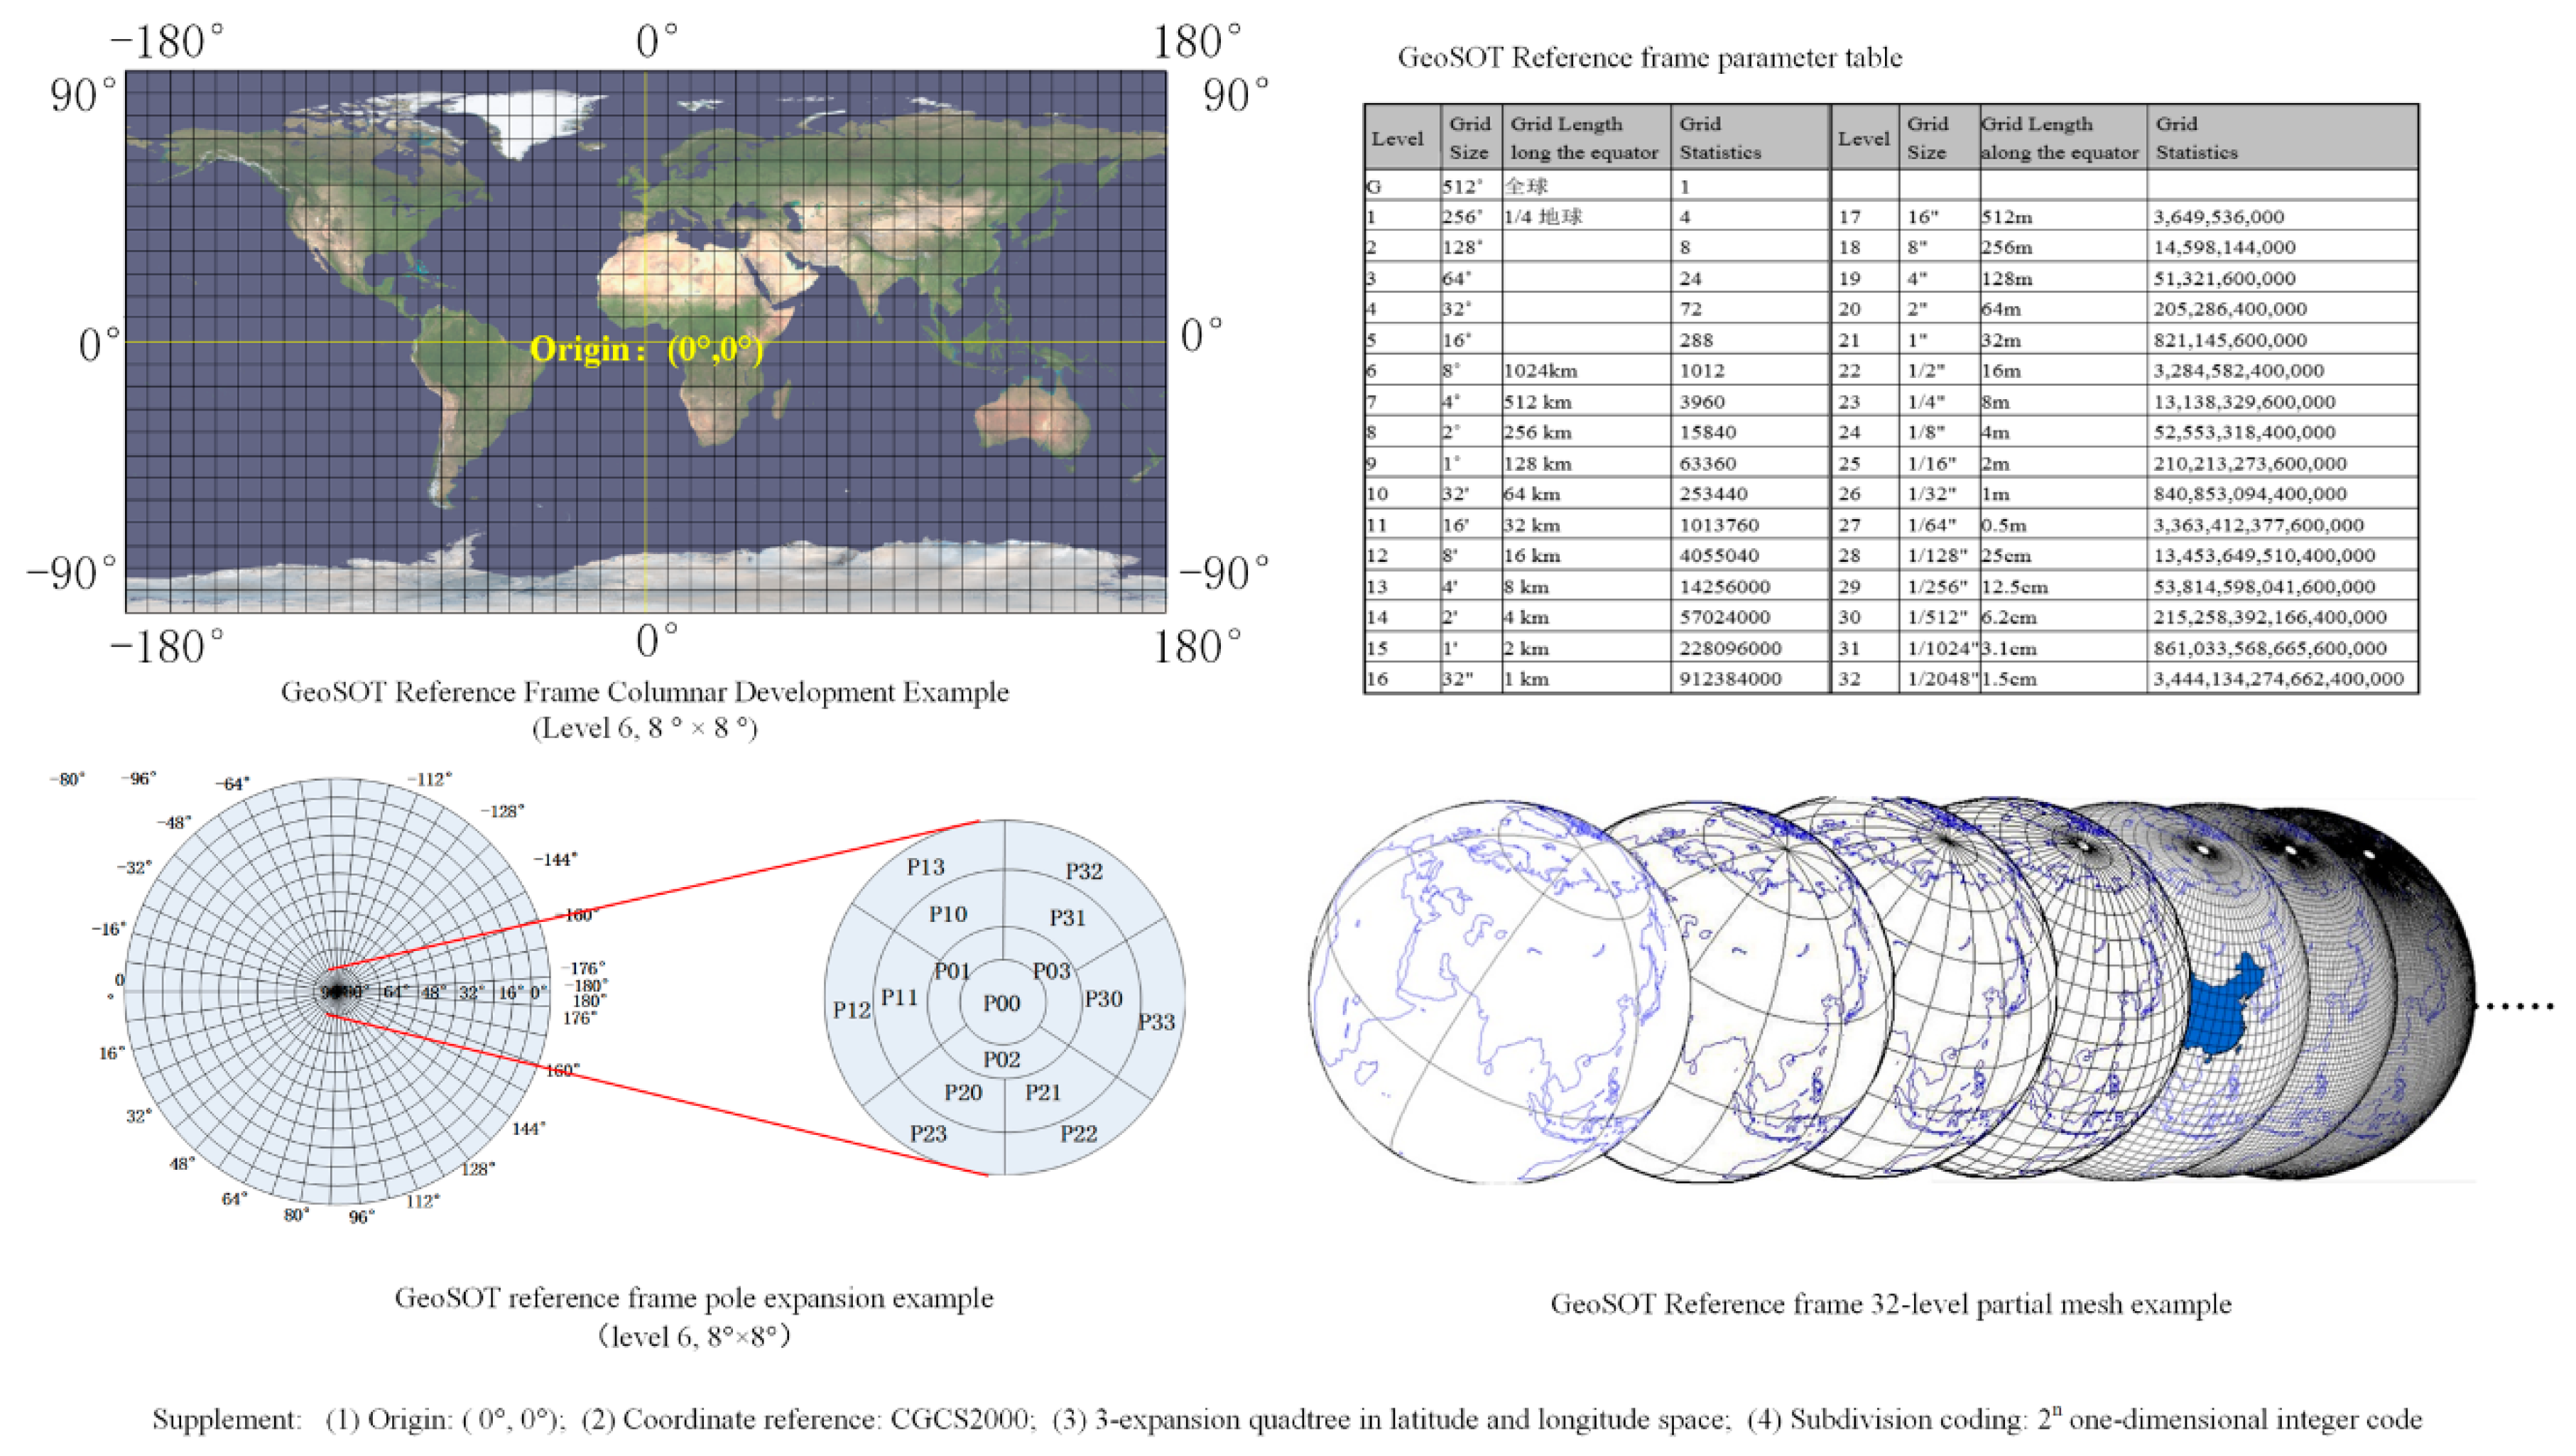
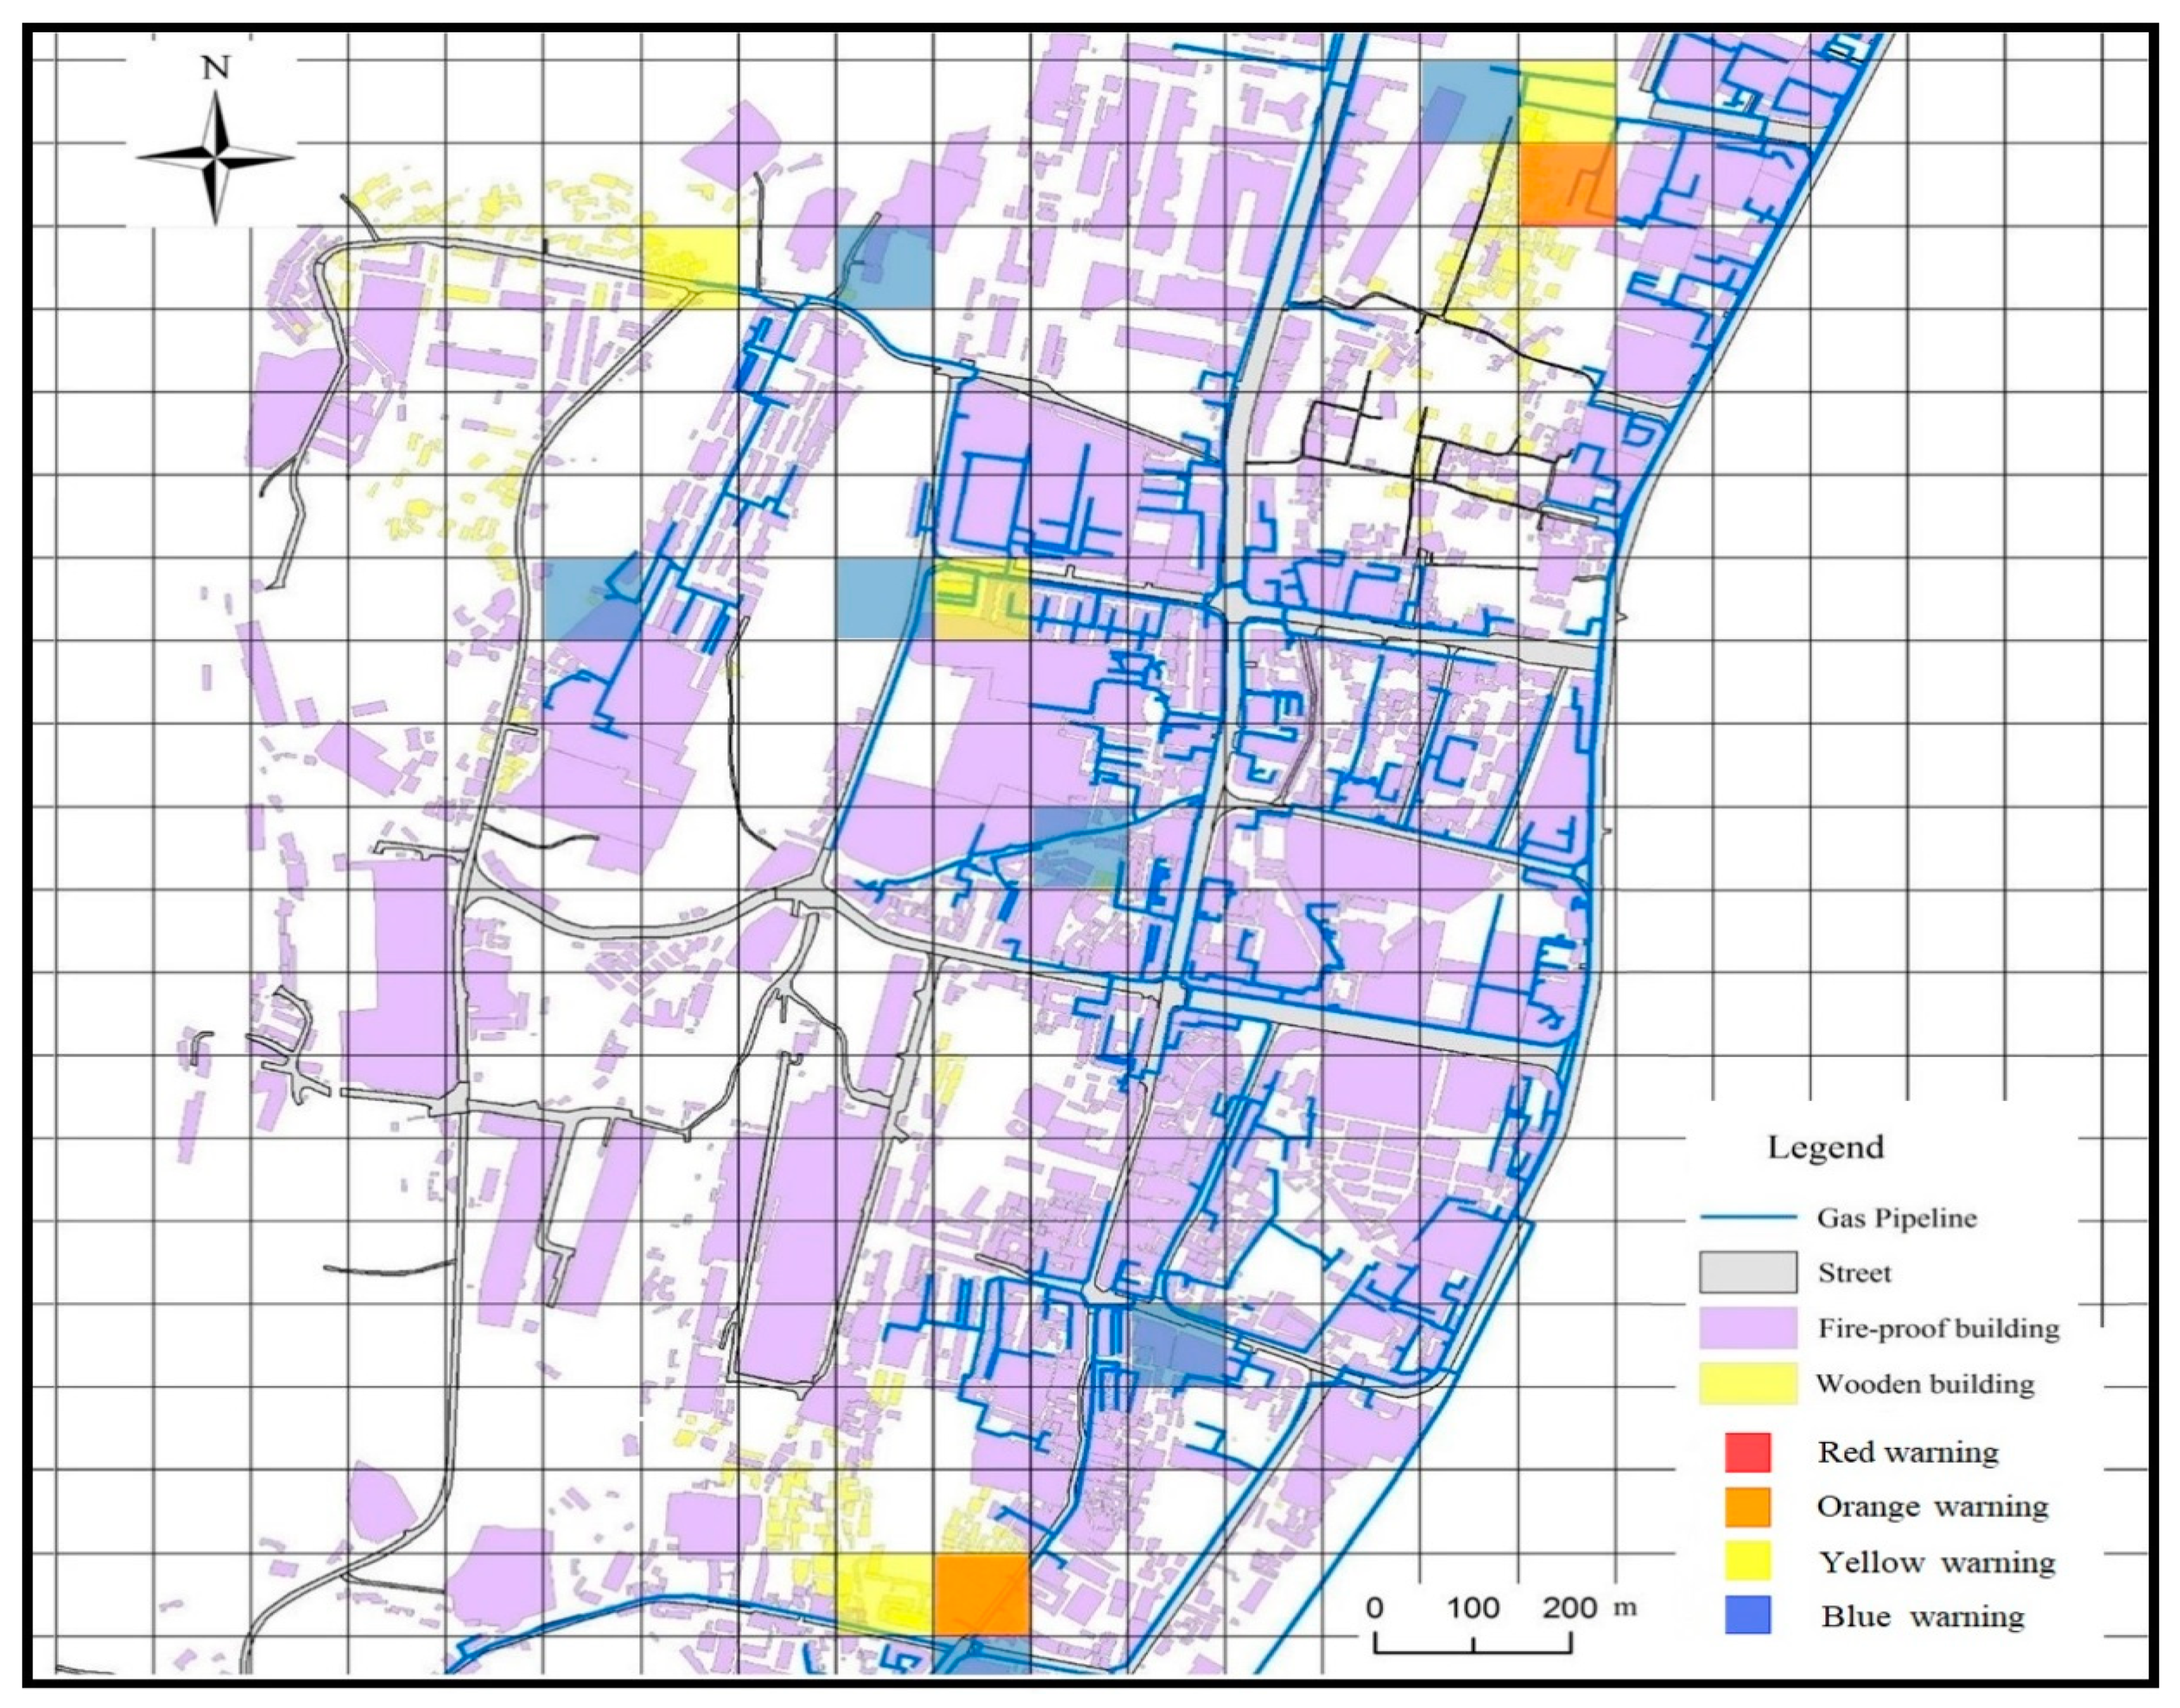
2.2.2. Grid-Based Warning Map
3. Experiments
3.1. Experiments Design
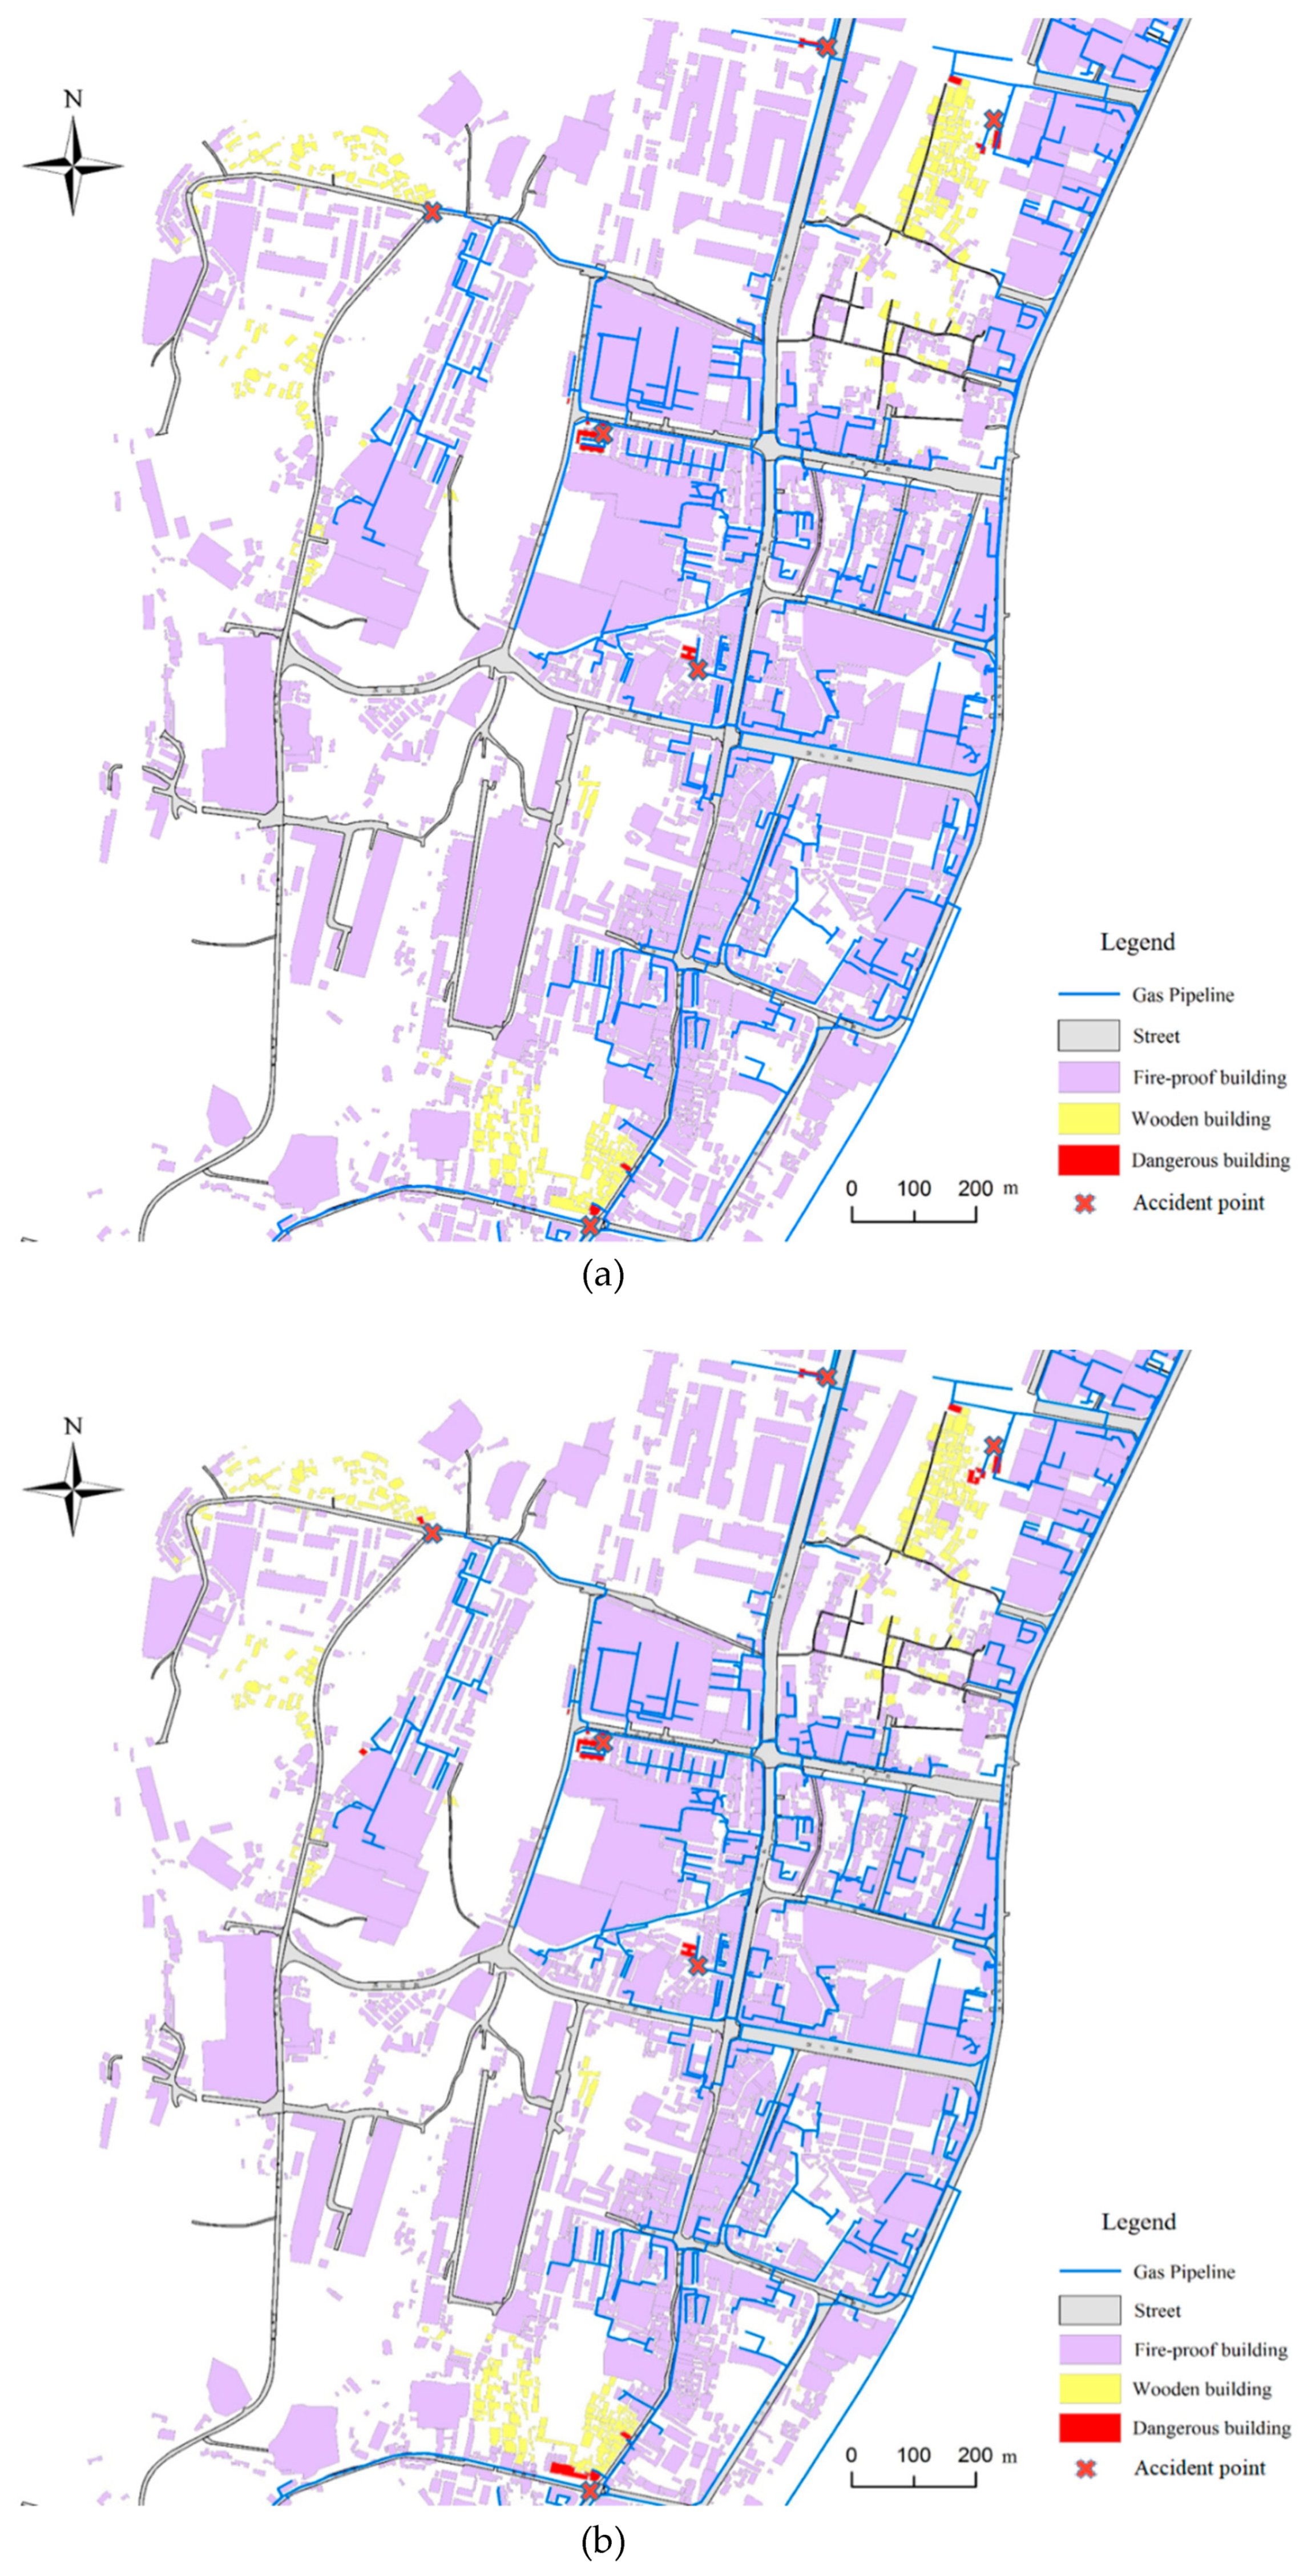
3.2. Experiments
3.3. Analysis of Experiment Results
4. Conclusions
Author Contributions
Acknowledgments
Conflicts of Interest
References
- Jo, Y.D.; Ahn, B.J. A method of quantitative risk assessment for transmission pipeline carrying natural gas. J. Hazard. Mater. 2005, 123, 1–12. [Google Scholar] [CrossRef] [PubMed]
- Han, Z.Y.; Weng, W.G. Comparison study on qualitative and quantitative risk assessment methods for urban natural gas pipeline network. J. Hazard. Mater. 2011, 189, 509–518. [Google Scholar] [CrossRef] [PubMed]
- ASME B31.8 S 2001. Supplement to B31.8 on Management System of Gas Pipeline; ASME B31.8-2001: New York, NY, USA, 2001. [Google Scholar]
- Cagno, E.; Caron, F.; Mancini, M.; Ruggeri, F. Using AHP in determining the prior distributions on gas pipeline failures in a robust Bayesian approach. Reliab. Eng. Syst. Saf. 2000, 67, 275–284. [Google Scholar] [CrossRef]
- Bonvicini, S.; Leonelli, P.; Spadoni, G. Risk analysis of hazardous materials transportation: Evaluating uncertainty by means of fuzzy logic. J. Hazard. Mater. 1998, 62, 59–74. [Google Scholar] [CrossRef]
- Dong, Y.; Yu, D. Estimation of failure probability of oil and gas transmission pipelines by fuzzy fault tree analysis. J. Loss Prev. Process Ind. 2005, 18, 83–88. [Google Scholar] [CrossRef]
- Hawdon, D. Efficiency, performance and regulation of the international gas industry—A bootstrap DEA approach. Energy Policy 2003, 31, 1167–1178. [Google Scholar] [CrossRef]
- Han, Z.Y.; Weng, W.G. An integrated quantitative risk analysis method for natural gas pipeline network. J. Loss Prev. Process Ind. 2010, 23, 428–436. [Google Scholar] [CrossRef]
- Brian, G.; Mike, Z. Basics of Risk Analysis, Assessment and Management; Banff Pipeline Workshop: Banff, AB, Canada, 1995. [Google Scholar]
- Wright, G.; Pearman, A.; Yardley, K. Risk perception in the UK oil and gas production industry: Are expert loss-prevention managers’ perceptions different from those of members of the public? Risk Anal. 2000, 20, 681–690. [Google Scholar] [CrossRef] [PubMed]
- DeWolf, G.B. Process safety management in the pipeline industry: Parallels and differences between the pipeline integrity management (IMP) rule of the Office of Pipeline Safety and the PSM/RMP approach for process facilities. J. Hazard. Mater. 2003, 104, 169–192. [Google Scholar] [CrossRef] [PubMed]
- Yin, Y.; Lin, G. Study on analysis of the consequence of city gas fire accident. In Proceedings of the 2010 IEEE International Conference on Advanced Management Science (ICAMS 2010), Chengdu, China, 9–11 July 2010; pp. 494–496. [Google Scholar] [CrossRef]
- Veenendaal, B.; Brovelli, M.A.; Li, S. Review of web mapping: Eras, trends and directions. ISPRS Int. J. Geo-Inf. 2017, 6, 317. [Google Scholar] [CrossRef]
- Ohori, K.A.; Ledoux, H.; Biljecki, F.; Stoter, J. Modeling a 3D city model and its levels of detail as a true 4D model. ISPRS Int. J. Geo-Inf. 2015, 4, 1055–1075. [Google Scholar] [CrossRef]
- Jo, Y.D.; Ahn, B.J. Analysis of hazard areas associated with high-pressure natural-gas pipelines. J. Loss Prev. Process Ind. 2002, 15, 179–188. [Google Scholar] [CrossRef]
- Dong, Y.H.; Gao, H.L.; Zhou, J.; Feng, Y. Dong, Evaluation of gas release rate through holes in pipelines. J. Loss Prev. Process Ind. 2002, 15, 423–428. [Google Scholar] [CrossRef]
- Kang, Y.; Lv, P.F.; Pang, L. Evaluation of Risk Field Intensity for Leakage Accidents of Urban Gas Pipelines. Saf. Environ. Eng. 2016, 23, 166–169. [Google Scholar] [CrossRef]
- Yin, Y.L.; Lin, G.L.; Fu, C.; Chen, W.K. Study on the building of the gas pipeline network early warning system in Tianjin based on GIS. China Saf. Sci. J. 2009, 19, 104–108. [Google Scholar] [CrossRef]
- Han, Z.Y.; Weng, W.G. An overview of quantitative risk analysis methods for natural gas pipelines. China Saf. Sci. J. 2009, 19, 154–164. [Google Scholar] [CrossRef]
- OGP (Oil & Gas Producers). Risk Assessment Data Directory: Major Accidents; Report No. 434e17; International Association of Oil & Gas Producers: London, UK, 2010; pp. 2–3. [Google Scholar]
- OGP (Oil & Gas Producers). Risk Assessment Data Directory: Vulnerability of Humans; Report No. 434e14.1; International Association of Oil & Gas Producers: London, UK, 2010; pp. 3–5. [Google Scholar]
- OGP (Oil & Gas Producers). Risk Assessment Data Directory: Vulnerability of Plant/Structure; Report No. 434e15; International Association of Oil & Gas Producers: London, UK, 2010; pp. 4–5. [Google Scholar]
- Fu, C. Research on Crisis Management of Urban Gas Pipeline System. Ph.D. Dissertation, Tianjin University, Tianjin, China, 2009; pp. 146–147. [Google Scholar]
- Cheng, C.Q.; Tong, X.C.; Chen, B.; Zhai, W.X. A subdivision method to unify the existing latitude and longitude grids. ISPRS Int. J. Geo-Inf. 2016, 5, 161. [Google Scholar] [CrossRef]
- Qi, K.; Cheng, C.Q.; Hu, Y.N.; Fang, H.Q.; Ji, Y.; Chen, B. An improved identification code for city components based on Discrete Global Grid System. ISPRS Int. J. Geo-Inf. 2017, 6, 381. [Google Scholar] [CrossRef]
- Li, W.; Han, Y.; Liu, Y.; Zhu, C.; Ren, Y.; Wang, Y.; Chen, G. Real-time location-based rendering of urban underground pipelines. ISPRS Int. J. Geo-Inf. 2018, 7, 32. [Google Scholar] [CrossRef]
- Yao, X.; Mokbel, M.; Ye, S.; Li, G.; Alarabi, L.; Eldawy, A.; Zhu, D. LandQv2: A MapReduce-based system for processing arable land quality big data. ISPRS Int. J. Geo-Inf. 2018, 7, 271. [Google Scholar] [CrossRef]


| Radiation Intensity (kw/m2) | Impact on People | Impact on Buildings/Equipment | Influence Division |
|---|---|---|---|
| 37.5 | 1 min, 100% people die; 10 s, 1% people die; | All operating equipment are damaged | A |
| 25 | 10 s, serious injury | Minimum energy for wood burning with no fire and long radiation | B |
| 12.5 | 1 min, 1% people suffer serious injury; 10 s, first-degree burn | Minimum energy for plastic melting with flame | C |
| 4 | Feel pain, even burns, above 20 s | 30 min, glass broken | D |
| The Threshold ΔP that the Human Body can withstand (0.1 MPa) | Impact on People | Influence Division |
|---|---|---|
| 1.0 | Most people die 70%~100% | A |
| 0.75 | Severe internal organs or death (10%) | B |
| 0.40 | Auditory organ hurt or fracture | C |
| 0.25 | Slight hurt | D |
| The Threshold ΔP that Buildings/Equipment can withstand (0.1 MPa) | Impact on Buildings/Equipment | Influence Division |
|---|---|---|
| 2.5 | Destruction of steel structure | A |
| 1.5 | Earthquake-resistant reinforced concrete damage, small houses collapse | B |
| 0.25 | Minimum energy for plastic melting with Wall crack | C |
| 0.06 | Door and window glass broken | D |
| Name | ID | Data Type | Can be Null |
|---|---|---|---|
| Pipeline number | OBJECTID | int | N |
| Shape | Shape | geometry | N |
| Pipeline diameter | Diameter | double | N |
| Pipe length | Length | double | N |
| Nearby information description | Description | string | Y |
| Install date | Install_date | date | Y |
| Repair date | Repair_date | date | Y |
| Buried depth | Depth | double | Y |
© 2019 by the authors. Licensee MDPI, Basel, Switzerland. This article is an open access article distributed under the terms and conditions of the Creative Commons Attribution (CC BY) license (http://creativecommons.org/licenses/by/4.0/).
Share and Cite
Li, S.; Cheng, C.; Pu, G.; Chen, B. QRA-Grid: Quantitative Risk Analysis and Grid-based Pre-warning Model for Urban Natural Gas Pipeline. ISPRS Int. J. Geo-Inf. 2019, 8, 122. https://0-doi-org.brum.beds.ac.uk/10.3390/ijgi8030122
Li S, Cheng C, Pu G, Chen B. QRA-Grid: Quantitative Risk Analysis and Grid-based Pre-warning Model for Urban Natural Gas Pipeline. ISPRS International Journal of Geo-Information. 2019; 8(3):122. https://0-doi-org.brum.beds.ac.uk/10.3390/ijgi8030122
Chicago/Turabian StyleLi, Shuang, Chengqi Cheng, Guoliang Pu, and Bo Chen. 2019. "QRA-Grid: Quantitative Risk Analysis and Grid-based Pre-warning Model for Urban Natural Gas Pipeline" ISPRS International Journal of Geo-Information 8, no. 3: 122. https://0-doi-org.brum.beds.ac.uk/10.3390/ijgi8030122