Article

Method of Selecting a Decontamination Site Deployment for Chemical Accident Consequences Elimination: Application of Multi-Criterial Analysis

by
Václav Talhofer
1 and
Šárka Hošková-Mayerová
2,*
1
University of Defence, Department of Military Geography and Meteorology, Kounicova 65, 662 10 Brno, Czech Republic
2
University of Defence, Department of Mathematics and Physics, Kounicova 65, 662 10 Brno, Czech Republic
*
Author to whom correspondence should be addressed.
ISPRS Int. J. Geo-Inf. 2019, 8(4), 171; https://0-doi-org.brum.beds.ac.uk/10.3390/ijgi8040171
Submission received: 26 February 2019 / Revised: 21 March 2019 / Accepted: 31 March 2019 / Published: 2 April 2019

Abstract

:
Multi-criterial analysis under the current use of digital geographic data is a quite common method used to evaluate the influence of the geographic environment on a planned or ongoing activity. The advantage of this method is a possibility of complex evaluation of all influences as well as a possibility to observe how the individual influences manifest in the final result. Its critical moment is establishing the structure of individual factors that influence the given activity, setting their weights and, subsequently, a choice of a suitable user function. The article provides guidelines how to set the individual decision-making criteria including setting their weights, and the application of the resulting user function in GIS environment with regards to the problem solved. Furthermore, the influence of change in weights of criteria on the complete result of the analysis is discussed. This article documents detailed studies that show how the results of solutions can differ in the same analytical task based on change in the weights of individual criteria. These studies are documented on a model example of a chosen suitable place for the deployment of decontamination center. Finally, the article describes possibilities of further development of the model solution, with the aim to make it a verified tool that may be implemented in the systems of command in Fire Rescue Service units and Chemical Troops units of the Czech Army.

1. Introduction

Information support of the Rescue System units, as well as Armed Forces, uses control systems for their activities that are mainly based on information and communications systems technologies. All systems require sufficient information support for the needs of quick and maximally effective decision-making. That is the reason for implementing procedures using digital geographic data (DGD) as a basic background for localization of subjects and objects of a critical situation in an area where the situation is taking place. This data, however, is also used as a source of information for modelling the impacts of current or expected actions on the complete situation, for projecting future intentions and their planning etc. In all cases, it is necessary to have the knowledge of the quality of the used DGD and of the influence of this quality on the complete decision-making process [1].
Within decision-making processes, commanders and staff may follow—and they often do—their own intuition and experience, for which they basically do not need any detailed analytical background. However, in case of operations of a larger extent solved in larger areas, they cannot work without so-called structured decision-making processes that are based on standing operational procedures (SOP) and on the rules of their use [2,3]. Decision-making processes in the environment of information and communication technologies (ICT) are above all structured processes. These processes often use the method of multi-criterial analysis (MCA). It is also true for procedures during which the influences of geographic environment on the performed activity are analysed, or when influences of the performed activity on the geographic environment are analysed [4,5]. The whole procedure of MCA is influenced by the choice of individual factors, by defining criteria for their evaluation, by the methodology used for setting weights of these criteria and, finally, also by the choice of a suitable form of the resulting user function.
In order to perform such analyses, it is necessary to have corresponding DGD that enable the subjects of the decision-making processes (commanders and staff) to evaluate the influence of geographic environment on the fulfillment of tasks. This is an evaluation of factors of geographic environment, i.e., the evaluation of influence of partial elements of this environment on the performed activity, and subsequently the evaluation of the complete influence of the environment. For these analyses, it is possible to use general tools for work with DGD that are a part of large program systems, e.g., ArcGIS [6]. Partial analyses of individual factors, as well as the complete analysis, may be carried out as process models whose output are raster files, in which the value of a raster cell is a classified influence of a partial factor or all factors on the given activity. Such raster files are usually called a cost map.
The output of the MCA application are partial cost maps for the individual criteria and a resulting cost map that is created using the given user function. Partial cost maps for the individual criteria and the resulting cost map are limited not only by the process used for their creation, but also by the quality of the used data.
A cost map as a product of MCA is a result of modelling over geographic data, and that is why it can never be the only basis for making decisions. The importance of the MCA is that above all it reduces individual approaches to the evaluation of the influence of geographic environment on the given activity. By an implementation of MCA into SOP for solving the assigned task, the commander gets objective information about the influence of the geographic environment on the given task. The importance of the cost map then lies especially in the characteristics of the given space in terms of suitable and unsuitable conditions for the given activity.
The quality of MCA strongly depends on the structure of criteria, system of their evaluation, methodology of setting their weights, as well as on the choice of their user function form. Even though there are general guidelines how to use the multi-criterial analysis in decision-making processes, it will always depend on the concrete process for which MCA is used. That is why it is essential to make a thorough analysis of the concrete process in terms of interfering factors that influence the solution, and to furthermore evaluate the mutual interactions of factors, and to set objectivized criteria and their weights to them that correspond to their importance for the complete solution. The last step is to set up suitable user functions. The resulting MCA must be thoroughly verified by an independent test, e.g., [7].
The aim of the following text is to show possibilities of the use of DGD when solving a specific (model) case, using SOP and MCA application during the solution of a crisis situation. As a model example, the authors chose the task of selecting a decontamination site deployment to eliminate chemical accident consequences. This is designed to carry out decontamination of civilians after being contaminated by toxic substances. The result of the analysis is an evaluated potential of the countryside for the deployment of this site in terms of realization of input requirements that enable the commander of rescue units to increase efficiency of the whole decision-making process, and subsequently to also increase efficiency of the used forces and equipment designated for the operation.
The text structure is chosen in such a way that it shows the theoretical basis of the use of MCA, and its practical application in GIS environment, including the presentation of how the change in MCA parameters influences the result of the complete analysis. The model example is not a final and verified application, but only a case study for the Fire Rescue Service and Chemical Troops units of the Czech Army.

2. Multi-Criterial Analysis in Decision Making Process

Multi-criterial analysis is a general tool that takes into consideration various points of view on the given problem [8]. These points of view looked at using factors that influence the complete state of result. Its advantage is that it works with factors that can be measurable as well as non-measurable. In order to make it possible to work with both kinds of factors (i.e., with measurable as well as with non-measurable), these factors are expressed with the help of criteria. Possible alternatives are then evaluated according to several criteria, while the alternative evaluated the best according to one criterion is usually not the best evaluated according to another criterion.
Criteria may be quantitative or qualitative. Quantitative criteria are usually expressed in natural grades, while for qualitative criteria a suitable scale is introduced, e.g., classification scale or a scale such as: very high, high, average, low, and very low. At the same time the direction of a better evaluation is defined, i.e., if maximal or minimal value is better, i.e., increasing or decreasing values. Approaches to multi-criterial decision-making vary according to the character of a set of variants or a set of allowable solutions. With regards to the fact that the individual criteria are in their nature either maximizing or minimizing, it is necessary even before the beginning of the evaluation to transfer them to only one type, i.e., either all criteria to be maximizing or minimizing.
Standard techniques of multi-criterial decision-making are considered to be non-spatial, because their basic presumption is homogeneity of the studied environment. However, if the methods of a multi-criterial analysis are used when working with spatial (geographic) data, this presumption is unreal because the concrete values of the evaluation criteria change in space.
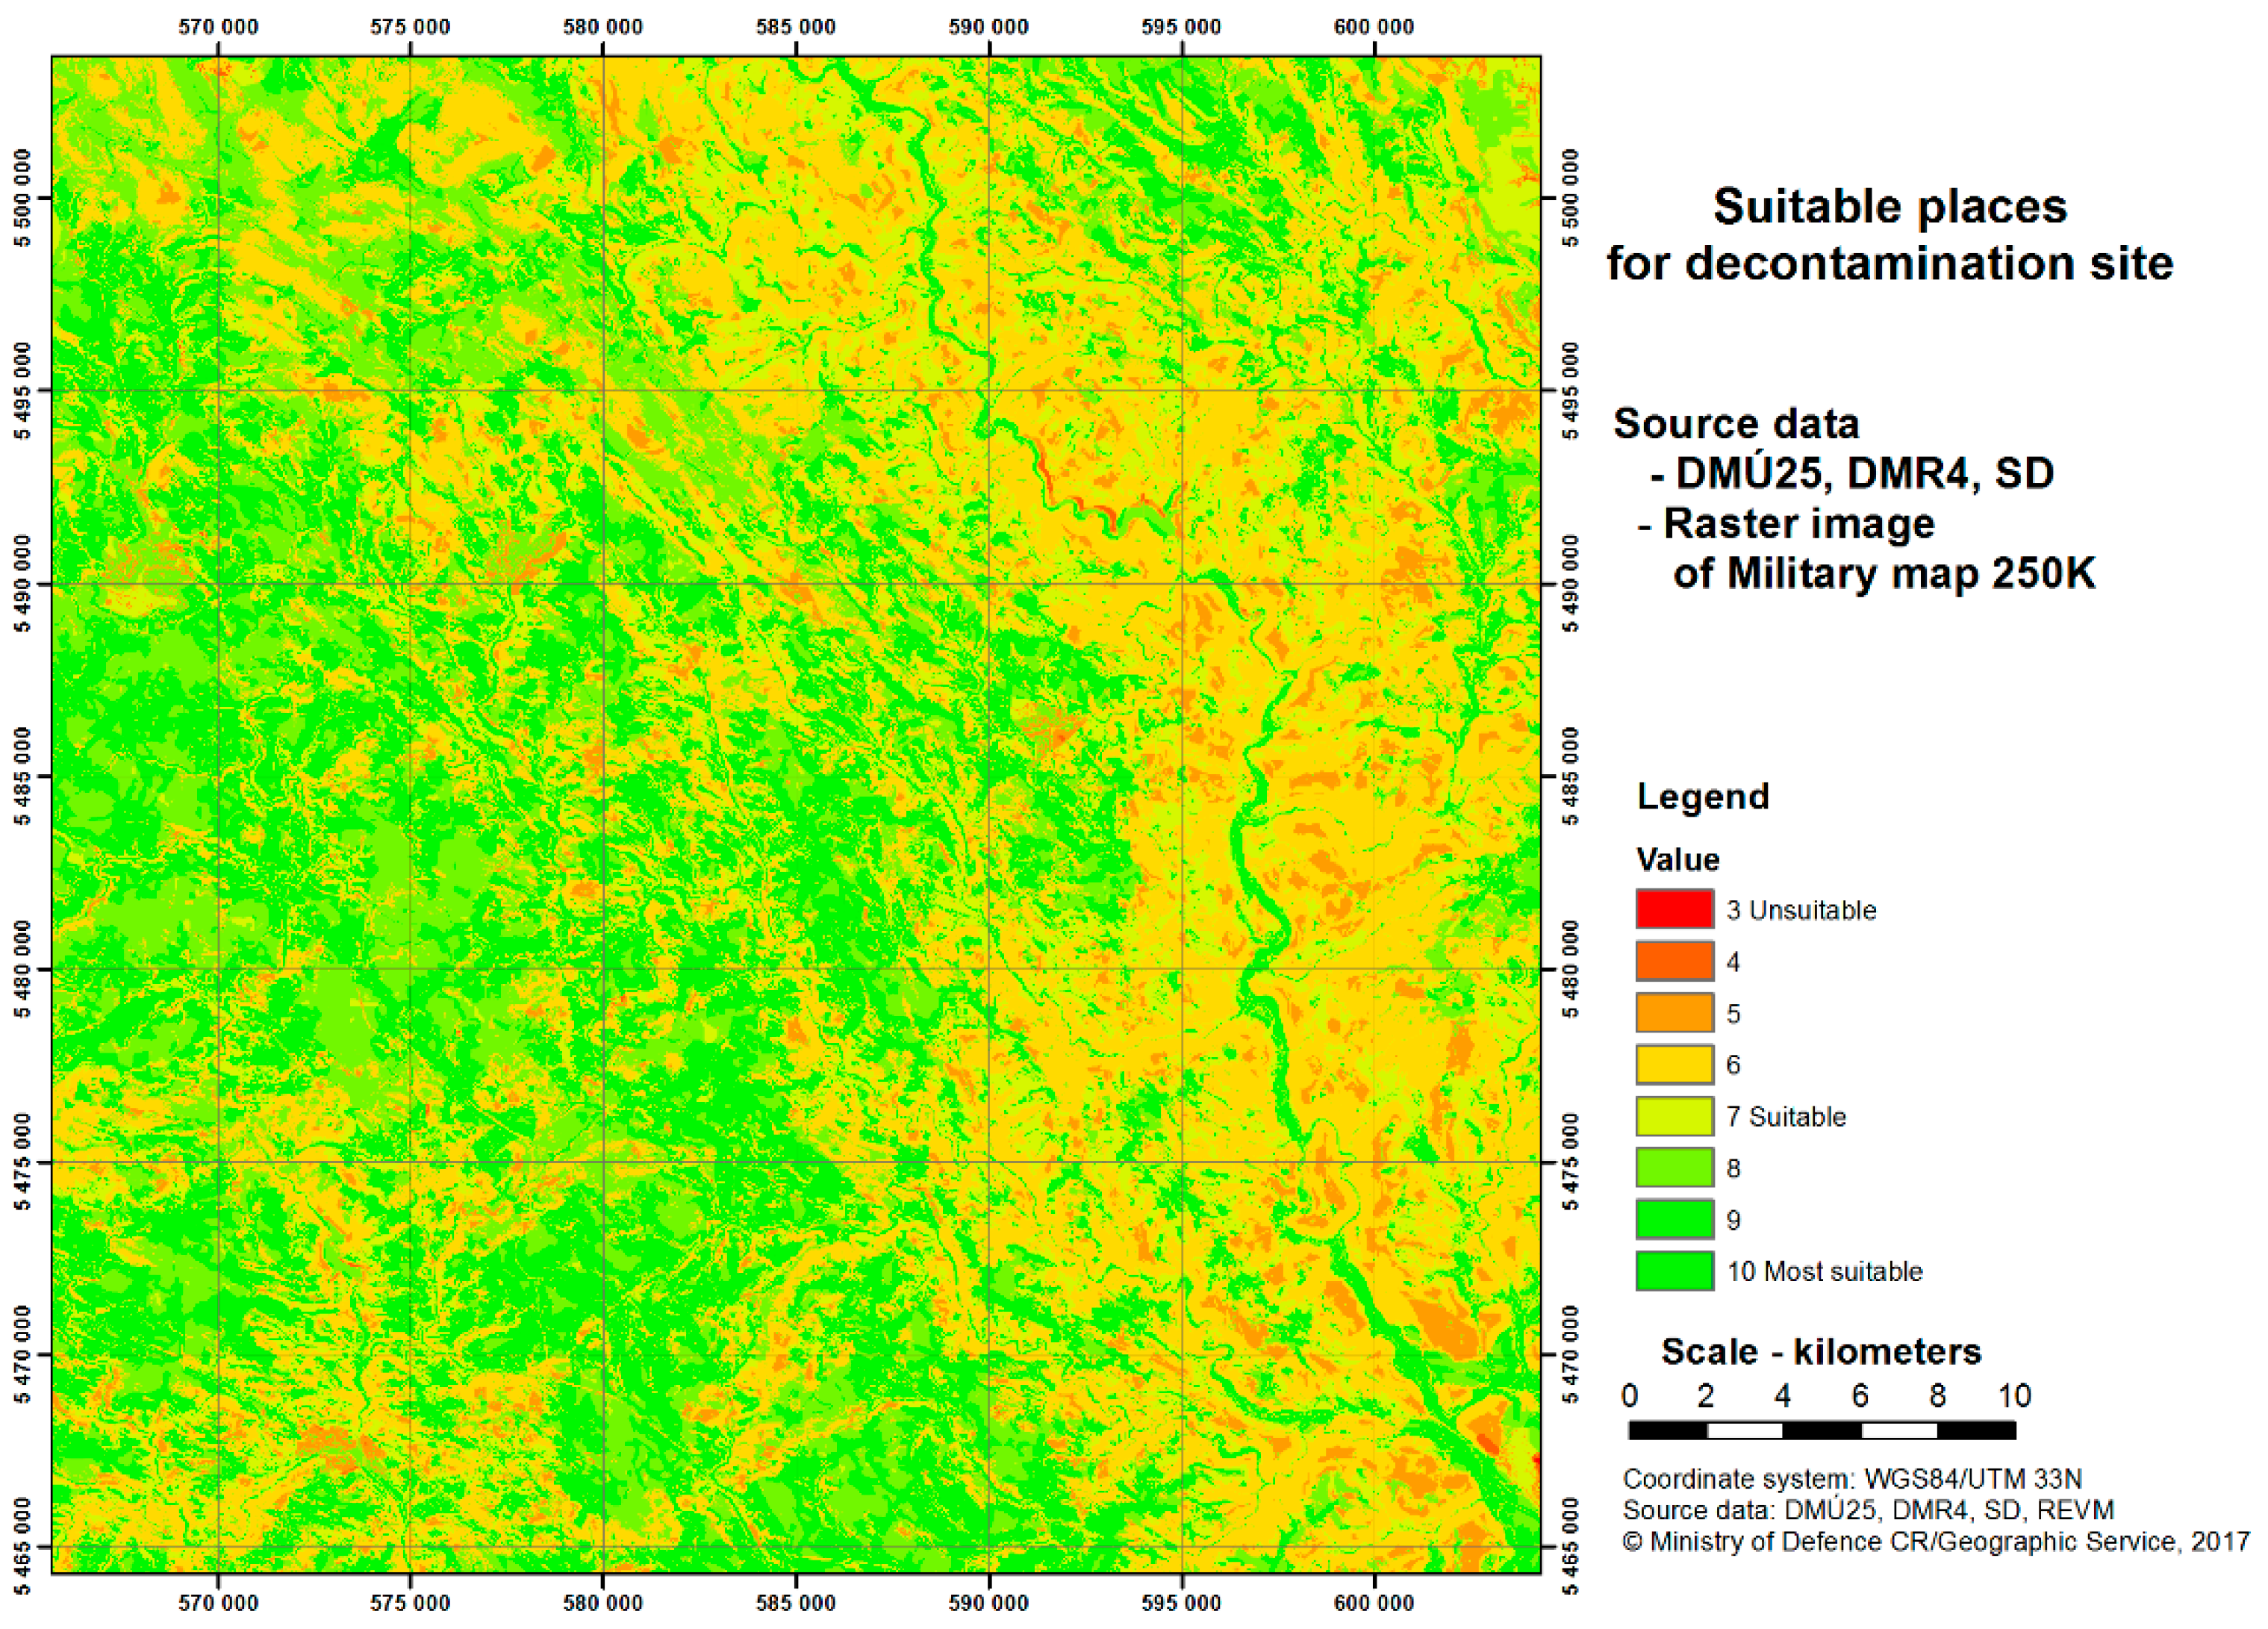
A spatial multi-criterial decision-making analysis then represents a significant deviation from the conventional multi-criterial decision-making analysis due to the presence of the spatial element. The spatial multi-criterial decision-making analysis requires data both corresponding to the evaluation criteria as well as geographic localization of alternatives. Data are processed with the help of GIS tools and multi-criterial decision-making. The spatial multi-criterial decision-making analysis is a process that combines and transforms geographic data into a resulting decision that is usually visualized in the form of raster files, in which the value of each pixel corresponds to the resulting value of the multi-criterial analysis. These values are often called cost, and the complete raster file is then called a cost map.
The methods of a multi-criterial analysis are used in the preparation of background for decision-making to prepare and control operations of units that move in real terrain. Therefore, it is largely used, e.g., within the rescue units of the Integrated Rescue System or in the Armed Forces. Results of such analyses are then implemented in the control systems. If the control system is based on technologies of information and communication systems (ICT), then also the MCA results are transferred to the control system in an electronic form within online or even offline connection.
The resulting cost map can be projected separately. However, it is usually consider as a thematic layer displayed on a raster image of topographic map, and then the cartographic rules for thematic mapping must be accepted [9,10].

2.1. Methodology of Procedure of Spatial MCA Realization

As it was mentioned in the introduction, decision-making is a process that involves a large number of activities, starting with a recognition of the task, ending with a formulation of the resulting recommendation. It has been proven that the quality of decision-making relies on the order in which the individual activities are done. All decision-making tasks begin with a task recognition and definition. The content of the task is thus actually a discovery of the difference between the current and required state of things.
Once the task is defined, it is followed by forming evaluation criteria. This step involves finding all goals that describe all parts relating to the decision-making task and finding all means for reaching of these goals. The found means are called attributes. Ratio scales for all attributes should be set in this step, too. Each criterion should be complex, measurable, unambiguous, and comprehensible.
Evaluation criteria are connected by geographic objects and relations among them and that is why they may be displayed in the form of criterial maps. There are two kinds of criterial maps—a map evaluating criteria and a map of restrictions. Maps evaluating criteria display a certain attribute that may be used for an evaluation of an alternative. These maps are also introduced as attribute maps. A map of restrictions displays restrictions of attribute values. Both criterial maps are analytical.
For a spatial multi-criterial analysis, each criterion should be displayed with the help of map layers. The analysis requires the values contained in the individual layers to be convertible into unified units. An example of the simplest conversion of rough data into standardized units is a linear scale transformation. Each value of a set of values is divided by the highest value of the set. The higher the standardized value, the more positive value of a criterion. Most real decision-making tasks have their restrictions that are given by characteristics and the quality of the used DGD.
Creation (formulation) of alternatives follows? The basic rule that is necessary to keep when creating alternatives is to make them reach evaluation criteria of decision-making tasks as best as possible.
The level of importance of the given criterion is expressed by the criterion weight. One of the basic methods how to assign weights is the ranking of criteria according to importance. Weights must be normalized so that their sum equals 1. Weights of criteria may be calculated, e.g., with the help of ranking or criteria evaluation. One of the simplest methods is a method using ranking and sum. Based on this, the normalized weight of wj j-criterion is defined as follows:
w j = n r j + 1 j n r j + 1 ,
where n is a number of criteria (k = 1, 2, …, n), and rj is a position of ranking of j-criterion.
As each person or a group of people involved in the decision-making process has specific priorities, it is logical that the results of the analysis will always be unique.
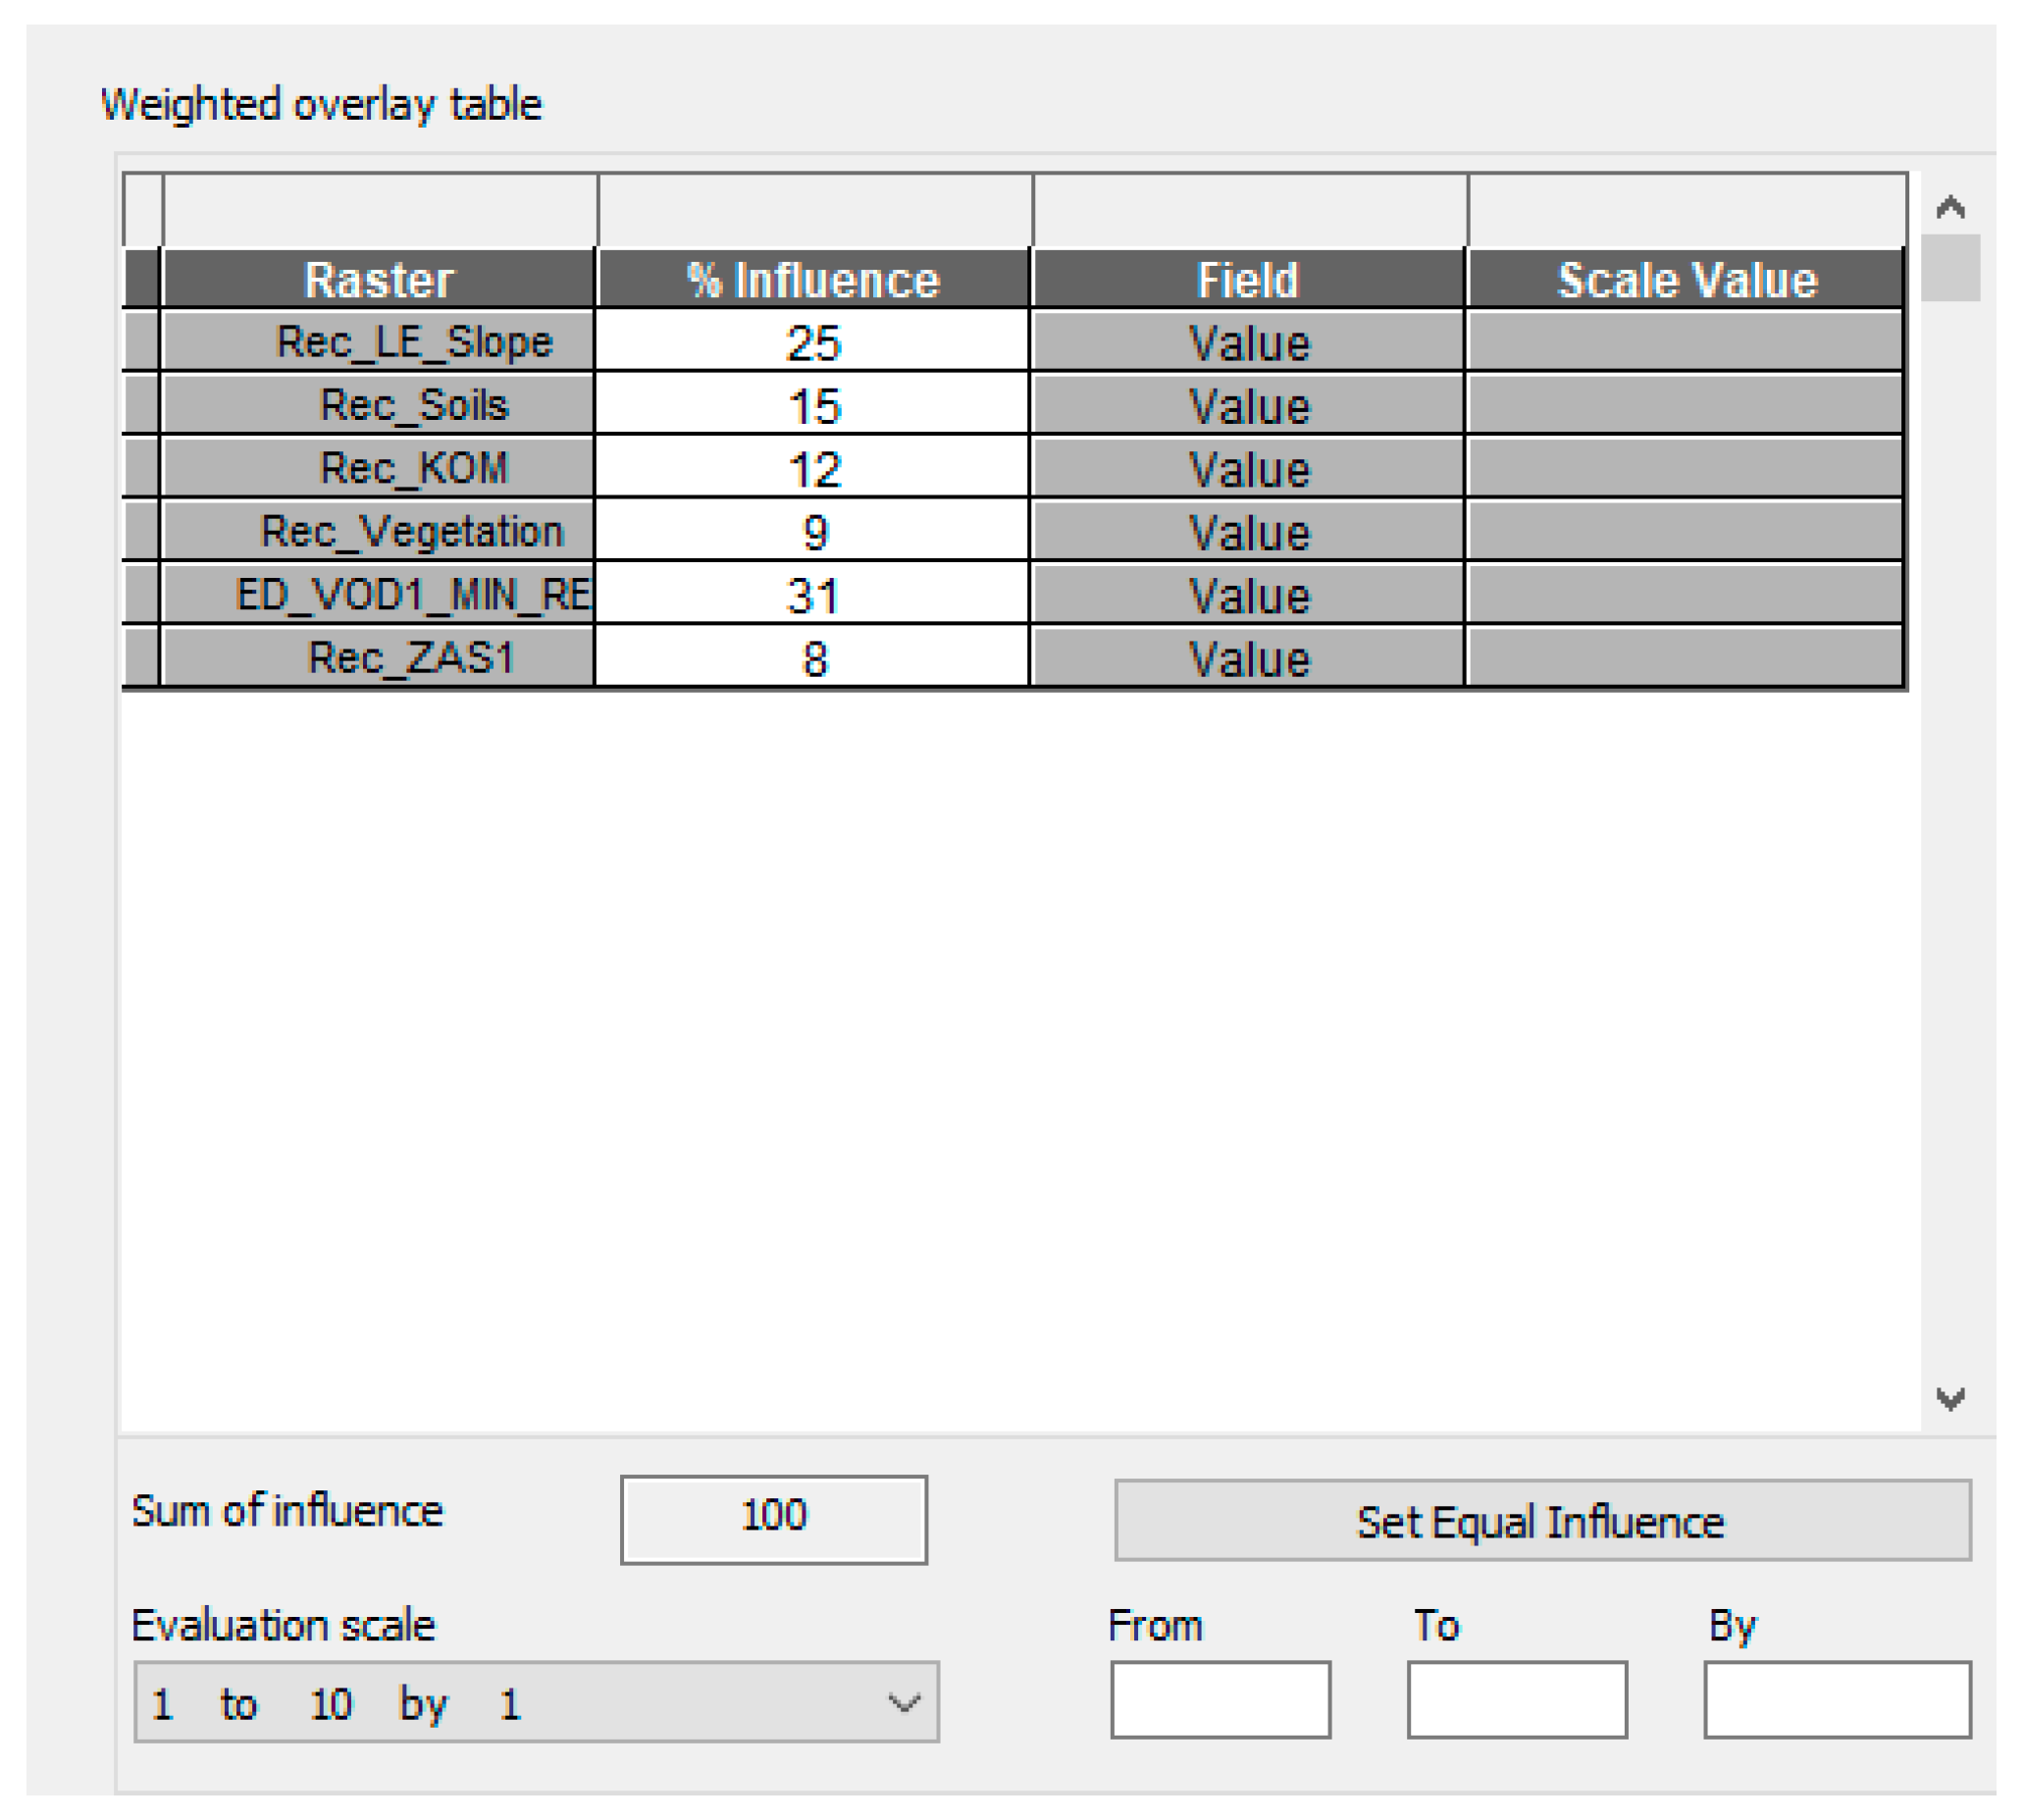
In order to get the complete evaluation, the alternatives must be unified in terms of the used units and value scales. This is done with the help of a suitable decision-making rule or a unifying function. Decision-making rules define how to rank the alternatives from the most suitable to the least suitable one. For spatial multi-criterial analysis, one of frequently used methods is simple additive weighting (SAW). Multi-criterial decision-making technique consists of assigning each alternative a sum of values, each one associated to the corresponding evaluation criterion, and weighted according to the relative importance of the corresponding criterion. In particular, the method is based on weighted average concept. The weights are assigned to each criterion and then the criterion is multiplied by the weight. Then all criteria are added up together and the alternative with the highest value is marked as the most suitable. Since a criterion is represented with the help of map layers, the method of overlay is used, in map algebra language it is a function LocalSum.
Setting the weights of criteria is one of the key problems of all models that use multi-criterial analysis. Weights of the individual criteria may significantly influence—and they do—the result of the decision-making process. Among the methods based on pairwise comparisons we can name the analytic hierarchy process (AHP) method [11,12] or the DEMATEL method [13] and the best worst method (BWM).
Moreover, in a recently published article [14], a new multi-criteria problem solving method—the full consistency method (FUCOM)—was proposed. The model implies the definition of two groups of constraints that need to satisfy the optimal values of weight coefficients. This new method was tested on several numerical examples from the literature, and the obtained results show that FUCOM provides better results than the BWM and AHP methods, when the relation between consistency and the required number of the comparisons of the criteria are taken into consideration.
However, the example is only a part of a case study. The authors used the simple additive weighting method. Now they are already working with the results of the article [14] and they are trying to use this new method for verification of their conclusion and/or obtaining better results of MCA in a way that the subjective influence when setting criteria will be subdued.
The next step in the whole procedure is a sensitivity analysis whose aim is to set the robustness of the complete solution. The sensitivity analysis sets whether the recommended alternative to the decision is sensitive to changes in input data. Its goal is to identify the efficiency of the change in input data (geographic data or priority of those who do the analysis) and what changes it induces in the results, recommendations and consequences. If the changes do not have a significant influence on the analysis results, then the ranking of alternatives is considered to be robust. If it is not the case, it is possible to use the newly acquired information and go a few steps back. The sensitivity analysis may help the researcher to better understand the task and the individual elements, and thus contribute to the choice of the best variant of the decision.
The last step of the analysis is a formulation of a recommendation for future proceeding. This recommendation should be based on the previous steps and may be supplemented also with an analysis of possible consequences of a concrete decision.

2.2. Application of Multi-Criterial Analysis for Solution of a Concrete Geographic Problem

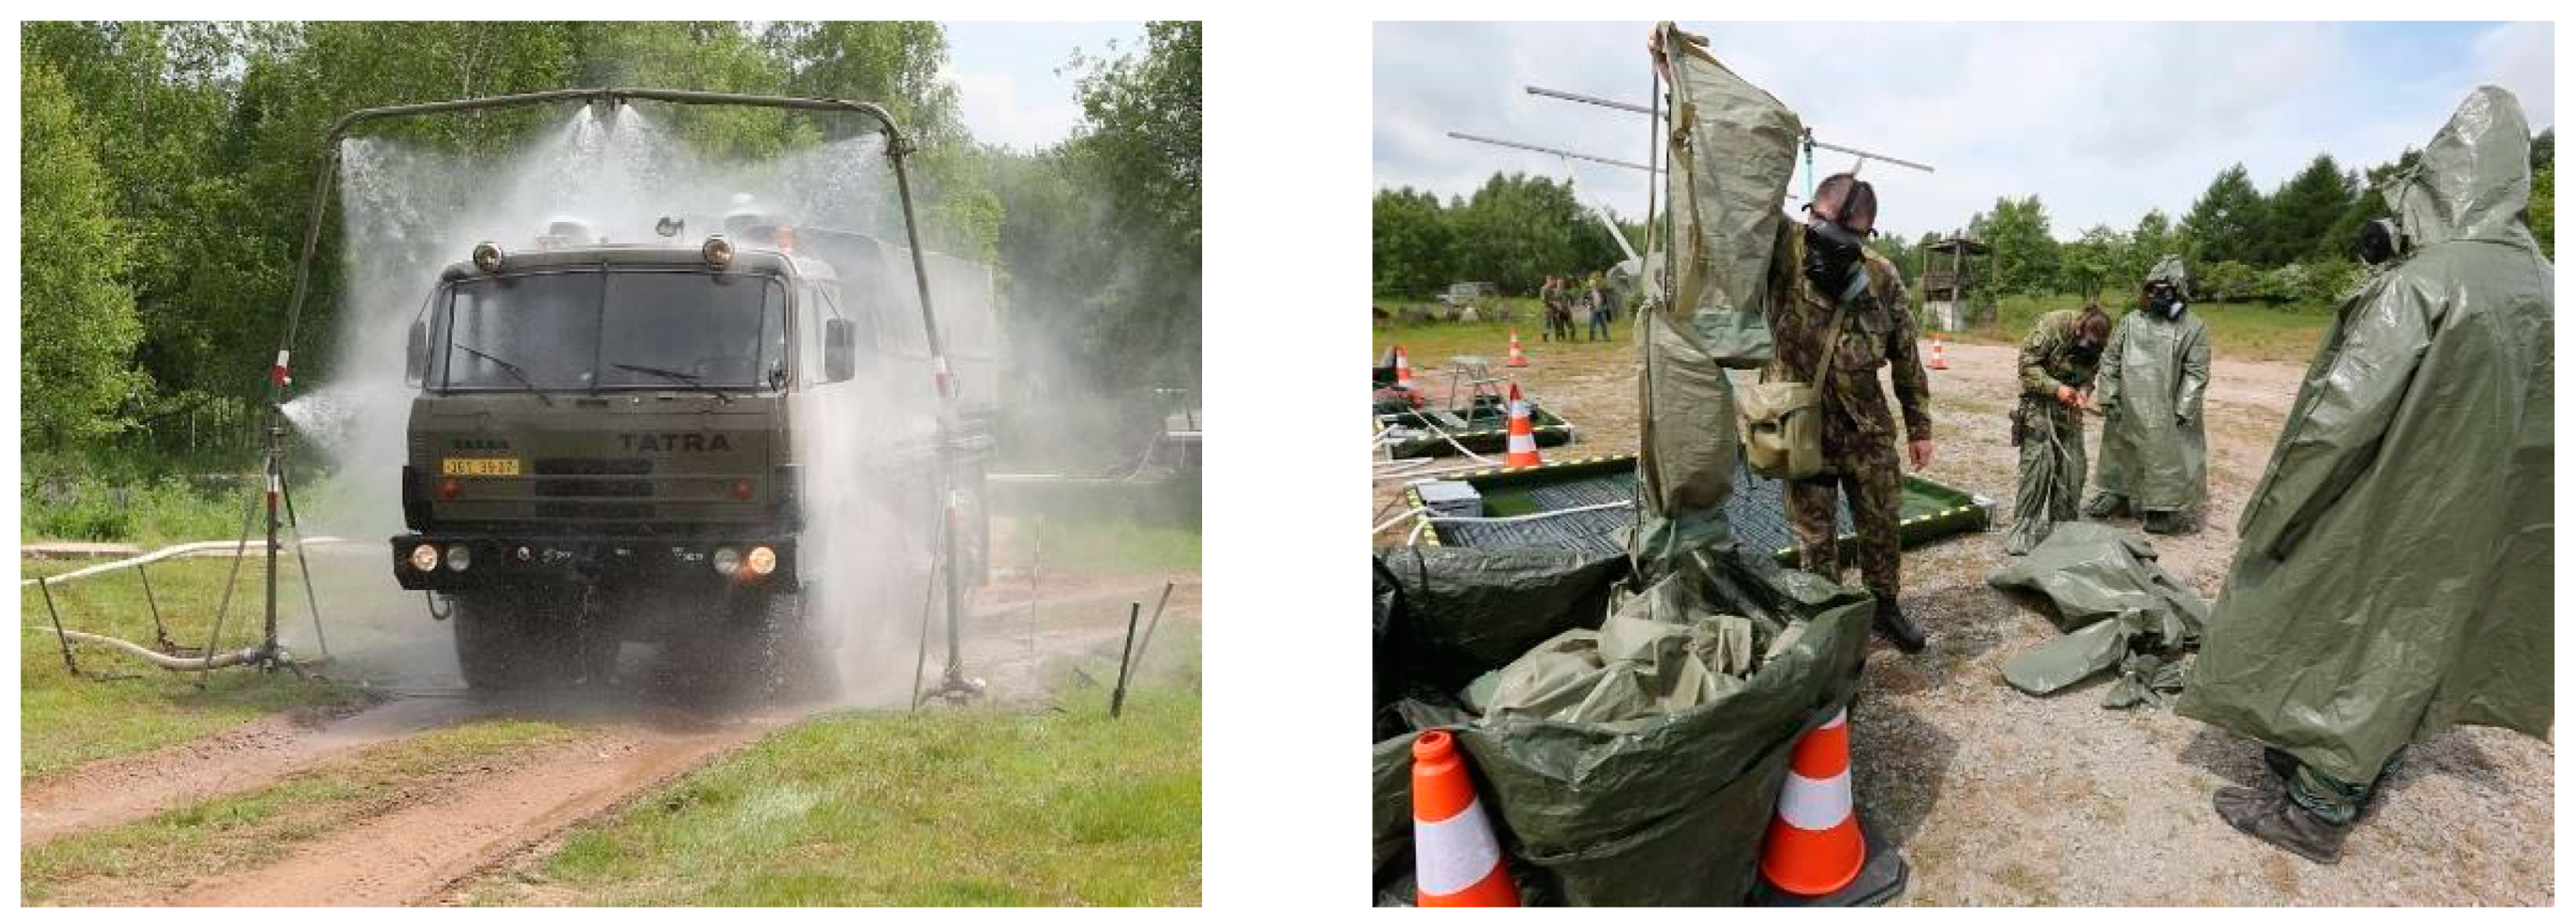
In order to illustrate the previously mentioned theory, the authors chose a simple example of searching for a suitable deployment location of a standardly understood place of decontamination designed to realize decontamination of civilians and vehicles after being contaminated by toxic substances. The example is based on a real standing operational procedure that is used by the rescue units, and in a similar way also by the decontamination units of Chemical Troops of the Armed Forces. For the purposes of this article, the procedure was simplified so as to show the applied methodology of MCA and its application in a solution of a spatially analytical task. In the figures below, there are examples of a decontamination site acquired during exercise in 2015 (Figure 1).
When decontaminating and removing the consequences of mass destruction weapons abuse and dangerous industrial substances abuse, one of the decisive factors of the operation’s success rate is an evaluation of the influence of geographical environment on the activities related to the fulfilling of the task [16,17]. The geographical environment may accelerate, or on the contrary postpone, the time of initiation of the action and its completion time, thus influencing the whole operational effectiveness of the combat activity. Therefore, it is essential for the intervention commander—or the Chemical Troops unit—to have accurate and detailed information about the geographic environment, especially in a case when the action must be carried out in a vast area that is not known and explored in advance. Such an action may be, for example, decontamination of civilians after the use of weapons of mass destruction, or a consequence of leakage of dangerous industrial substances after an industrial infrastructure device accident, or an extensive use of extermination agents causing the occurrence of biological contamination [18,19,20]. Among the background information that a commander may get is also the evaluation of the influence of the geographical environment on a specific activity that shall be carried out within the decontamination action. A suitable method when evaluating the influence of geographical environment is a multi-criterial analysis and use of digital geographic data. The paper presents the methodology of the use of multi-criterial analysis using digital geographic data and gives guidelines how to set the individual decision-making criteria, including setting their weights and application of the resulting utility value function in GIS environment with regards to the solved problem. It also evaluates the influence of change in criteria weights on the complete final result of the analysis. There are detailed studies of differences in solution results of the same analytical task with changed weights of the individual criteria, and these studies are documented on a model example. Finally, this paper describes possibilities of further development of the model solution with the aim to transform it into a verified tool that may be included into the control system of Fire Rescue System and units of Chemical Troops of the Czech Army.
The model situation describes a case when there was a chemical substance leakage into the environment in a given space with the dimensions of 40 × 40 km [21]. It is considered to be such a toxic substance that it requires individual protection before the process of decontamination begins. This means it must be present in the terrain and will thus require planning, organization, and fulfillment of tasks of decontamination of terrain [22,23,24]. Based on monitoring of the meteorological situation in the place of incident (leakage, accident), an impact area and an endangered area were defined [25,26]. Apart from these spaces, it is necessary to find suitable places for the deployment of decontamination site (DS) according to the following conditions [27]:
  • slope inclination up to 5°;
  • sustainable soil for the movement of special chemical equipment in the long-term;
  • as close as possible to paved communications;
  • away from forests;
  • as close as possible to water sources;
  • with regards to possible contamination of unaffected population should be away from resident areas;
  • area of approx. 2.5 km2;
  • abundance of water source; and
  • with suitable access and exit communications.
The abovementioned conditions are established as optimal. The choice of a particular area then depends on the size and shape of the selected area and the variability of the slopes. An on-site survey is required before the deployment techniques and technologies for the decontamination are used.
In case there is no water source in the chosen locality, it is necessary to plan the transport of water from the nearest water source with the help of special chemical equipment that uses a special add-on on a standard chassis of a truck, under the following conditions:
  • as short driving distance to a given water source as possible;
  • the vehicle must get to the source to the distance of maximum 10 m as it is not equipped with longer suction hoses for pumping of water;
  • passable terrain for a vehicle, also in case it will need to move in terrain with full tanks; and
  • limited heights of banks due to the limited suction height.
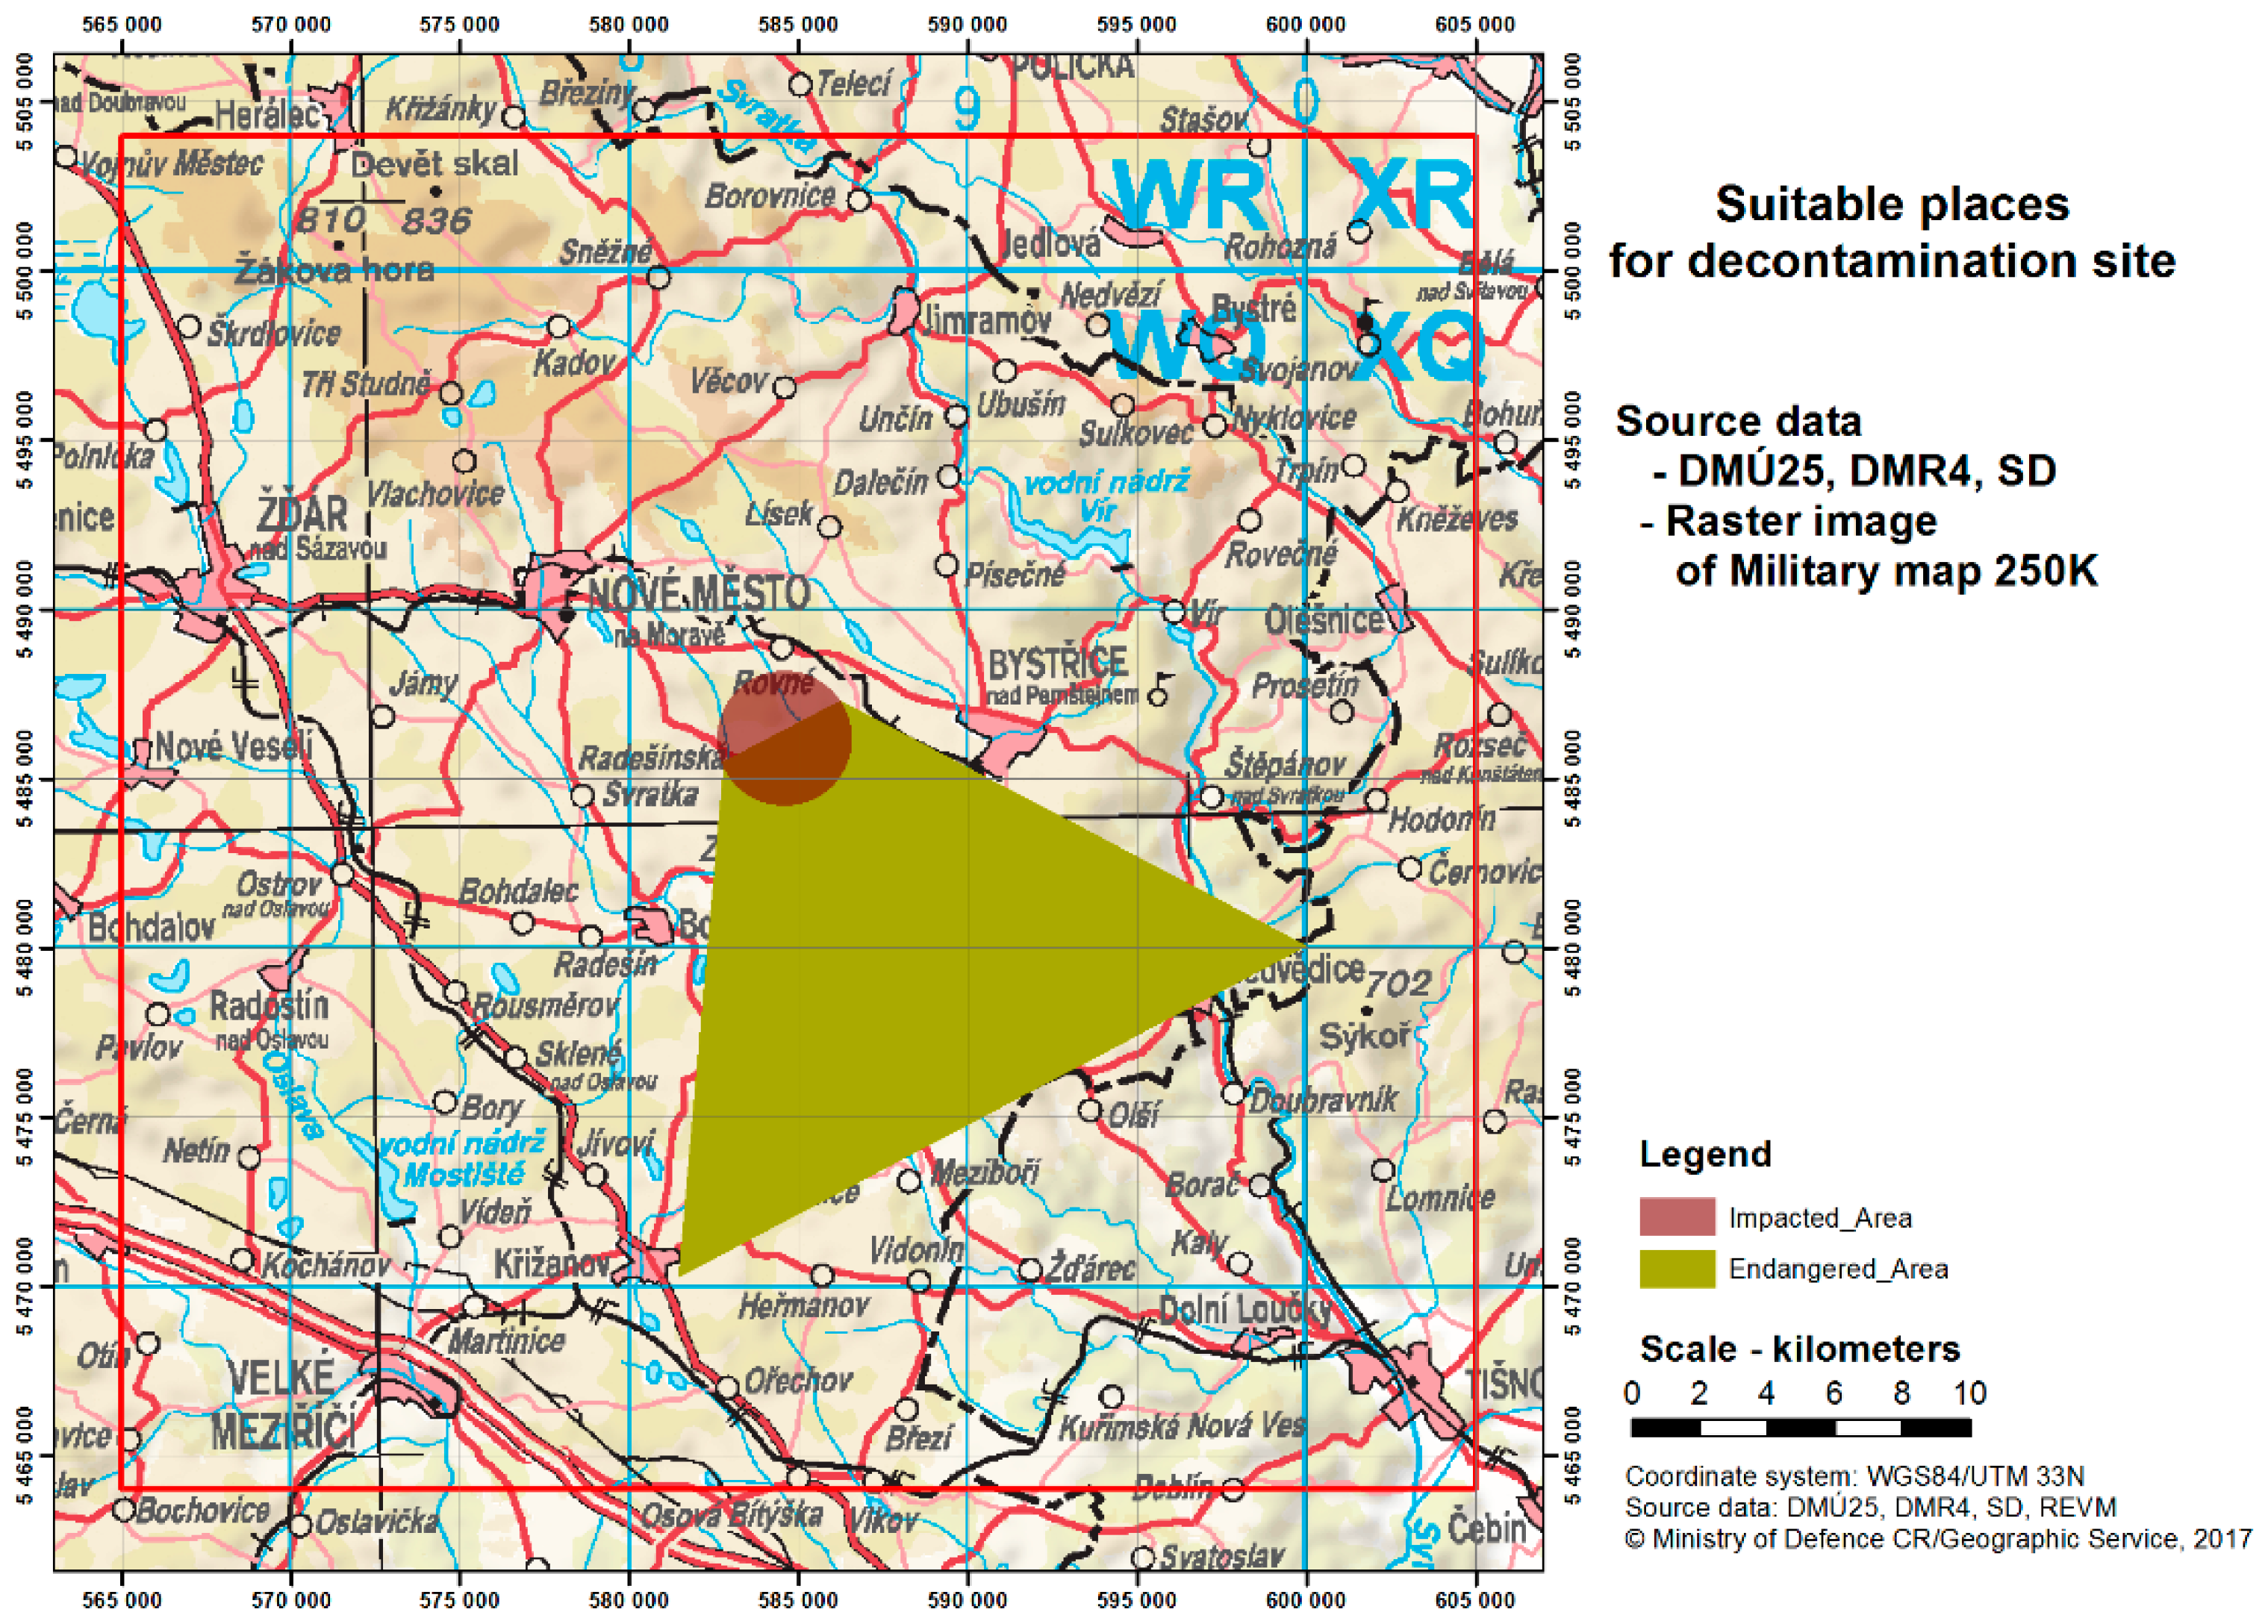
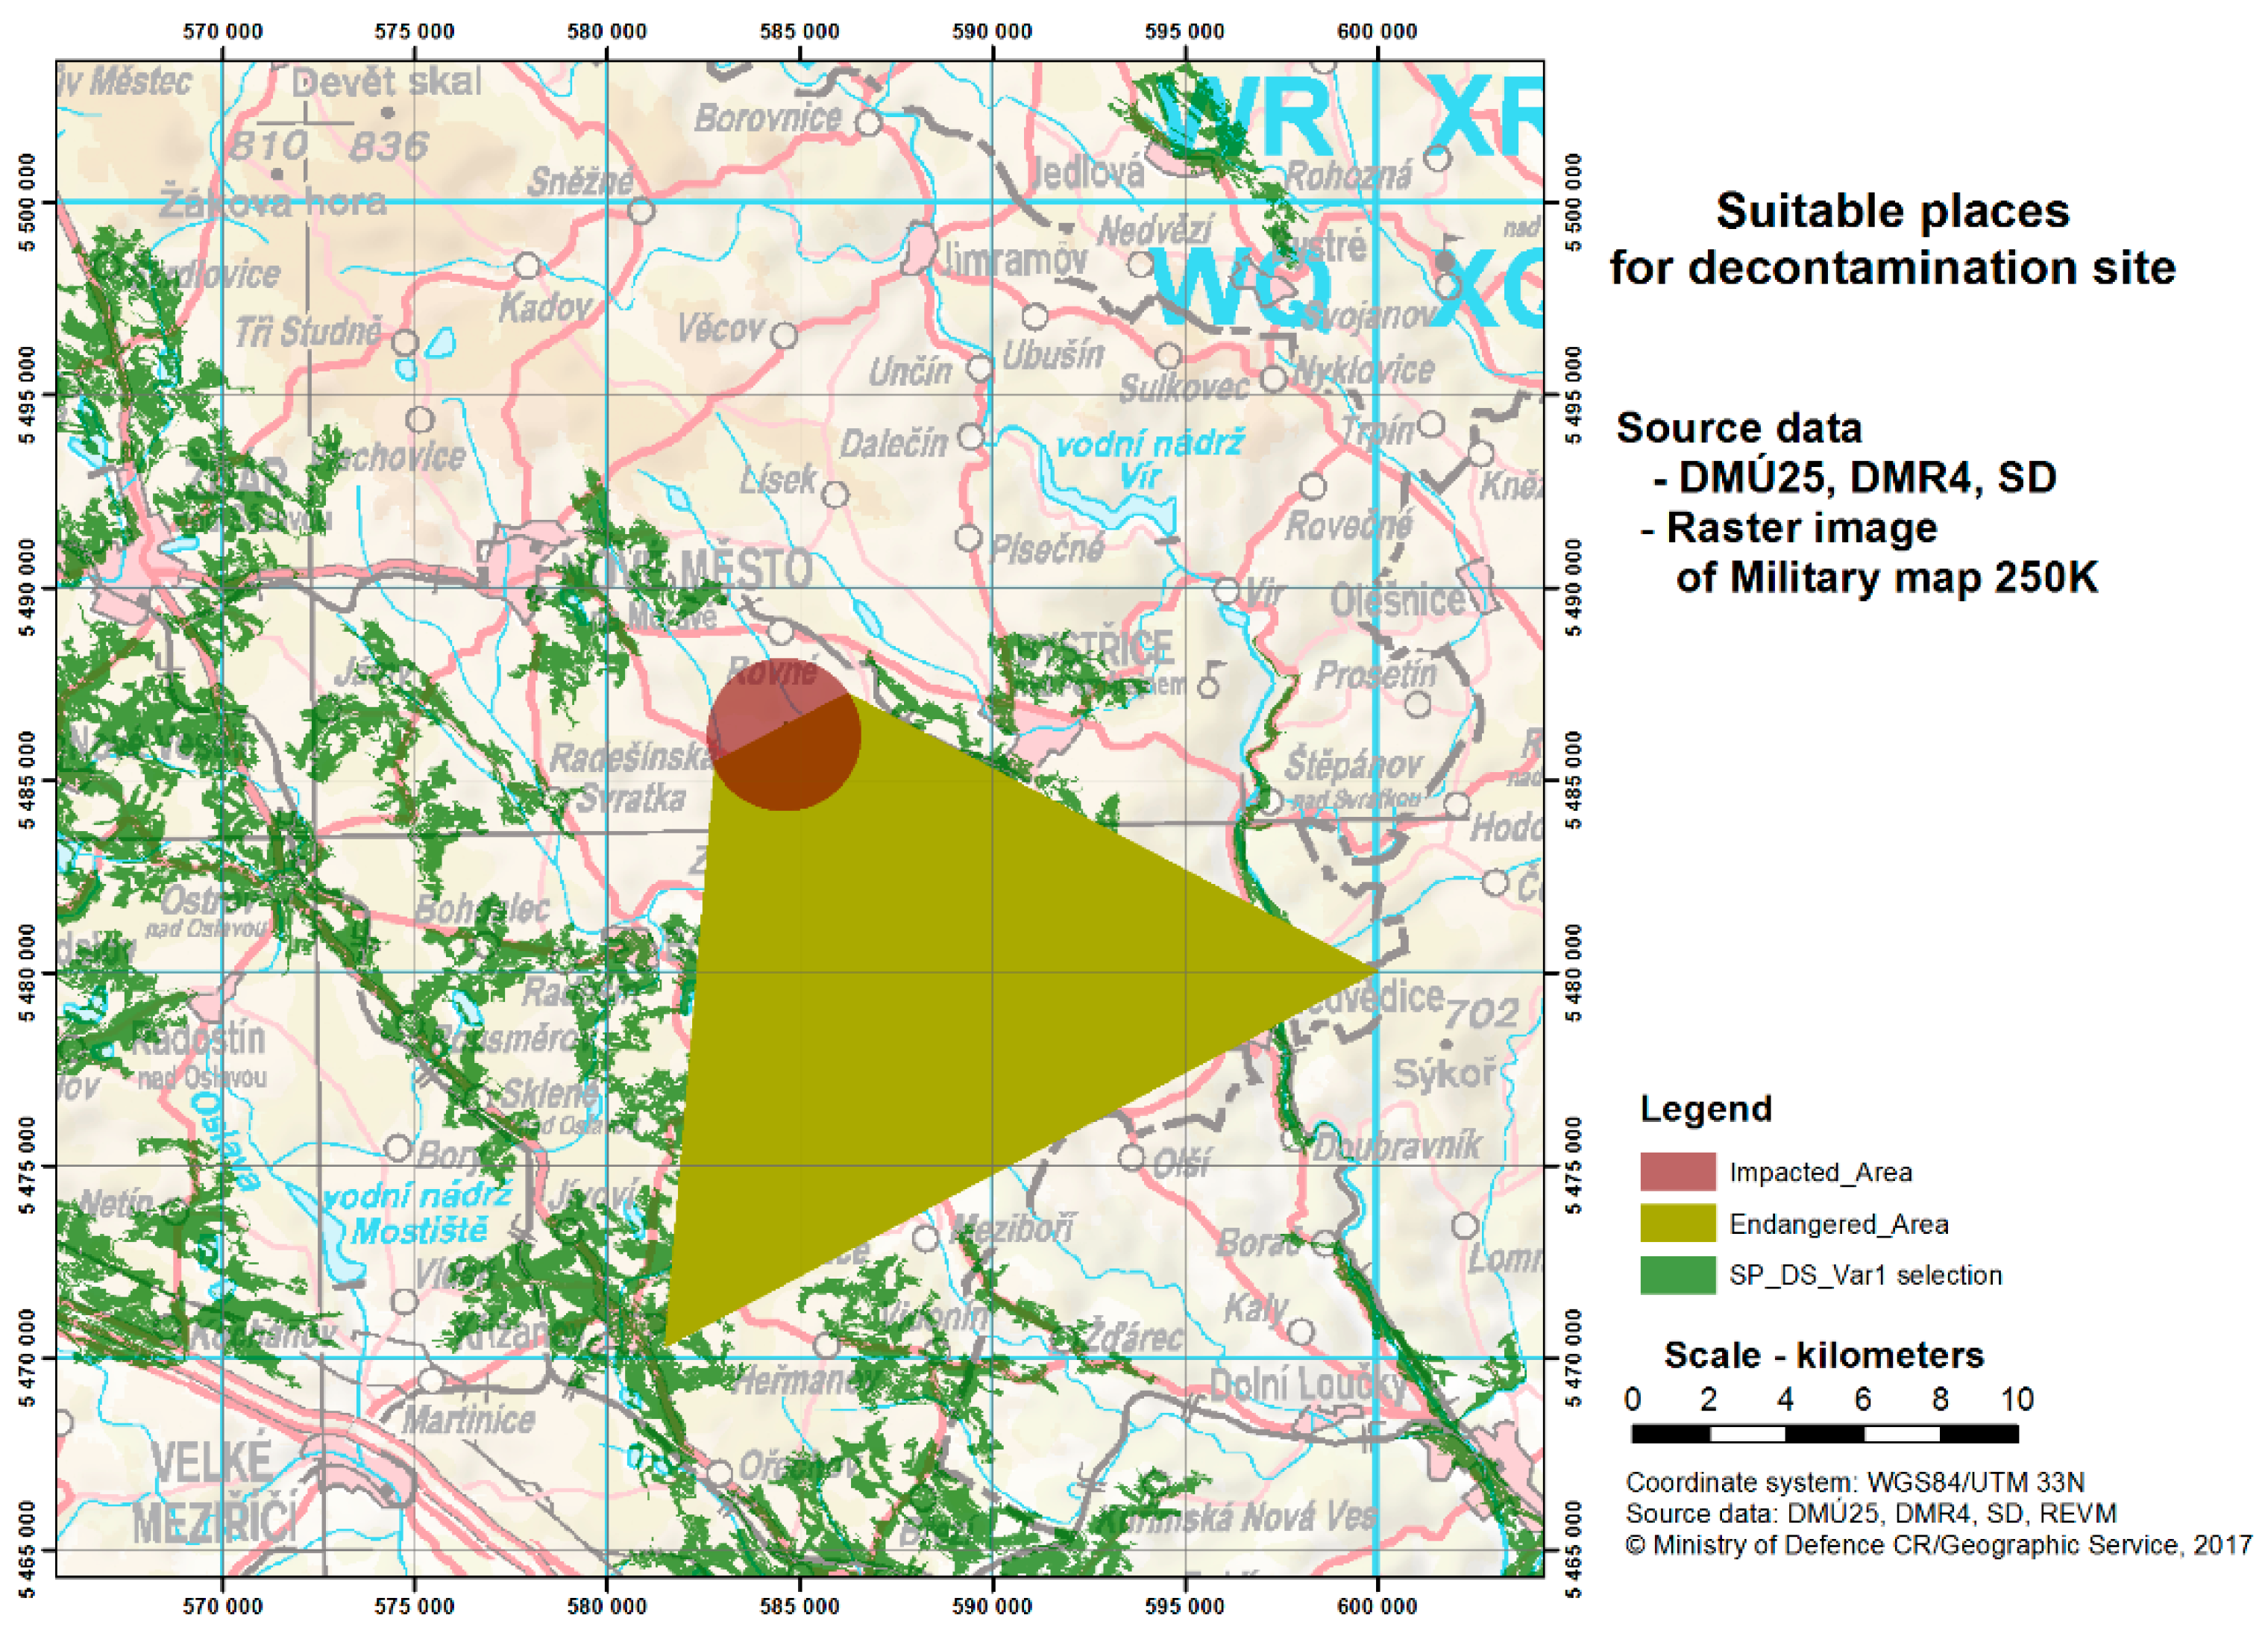
A model space in the central part of Bohemian–Moravia Highlands was chosen for the model situation. The intervention anti-chemical unit is hypothetically dislocated in Žďár nad Sázavou on the northwest border of the secured area (Figure 2).
A geographical problem is to select suitable places in the given locality outside the impacted and endangered area where it would be possible to place the mentioned decontamination site so that in the given area this facility was functional and the terrain configuration would not restrict it or restrict it in an acceptable way [27,28,29,30]. The following text provides a description of the procedure when solving this model example.
The goal of the solution (task definition) was to search for places that meet conditions for the given space. These conditions are minimal dimensions of an area for distribution of elements (workplaces) of DS, maximal inclination of slopes, soil able to bear movement of equipment, corresponding distance from communications, water bodies, resident areas, and it must be away from forests and, at the same time, away from the contaminated and endangered areas.
First of all, it was necessary to understand the factors that influence the complete solution of the problem and form these structures into a clear structure. With the individual factors, it was necessary to choose evaluation criteria and set their weights. In this case, the choice of a suitable place was influenced by factors of terrain elevation, its soil surface, communication conditions, vegetation cover, hydrological conditions, resident areas, and area of DS [31,32]. Even though water sources are also evaluated in terms of their abundance within SOP, this evaluation was not considered in the model example due to complicated access to relevant data. That is why this factor was not included in the analysis.
While solving the model example, it was required that the chosen space would be in a relatively flat terrain, on a suitable soil that is sufficiently bearable for the used equipment, within the reach of communications, in a treeless area and close to substantial water sources, and also far enough from resident areas. The individual factors were evaluated by measurable or classifiable criteria. The following criteria were used in the following example (Table 1):
In case the water source was located outside the proposed workplace, it was also necessary to evaluate the possibilities for the transport of water from the nearest water source. A multi-criterial analysis was also used to model the possibilities of transport. However, this analysis is already a part of the solution for terrain passability described, for instance, in [1,32].
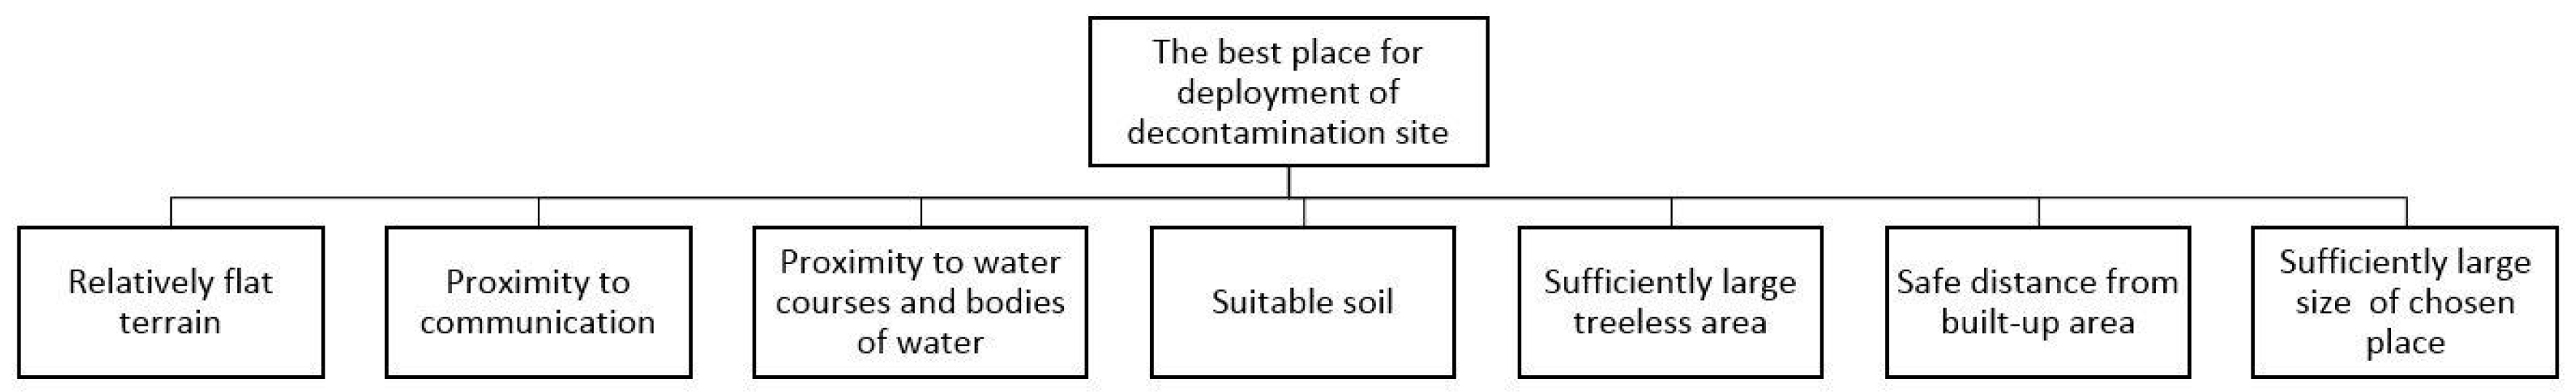
When solving a real situation, interactions among the individual factors must also be searched for. In this simplified example, however, it was not necessary, apart from one exception in the last factor (size of the chosen area), to evaluate mutual relations among the individual factors, as the individual factors are independent of each other. Their influence on the solution of the problem may be therefore determined separately. That is why the complete hierarchy of the process solution conditions could be expressed in the form of a hierarchical scheme (Figure 3).
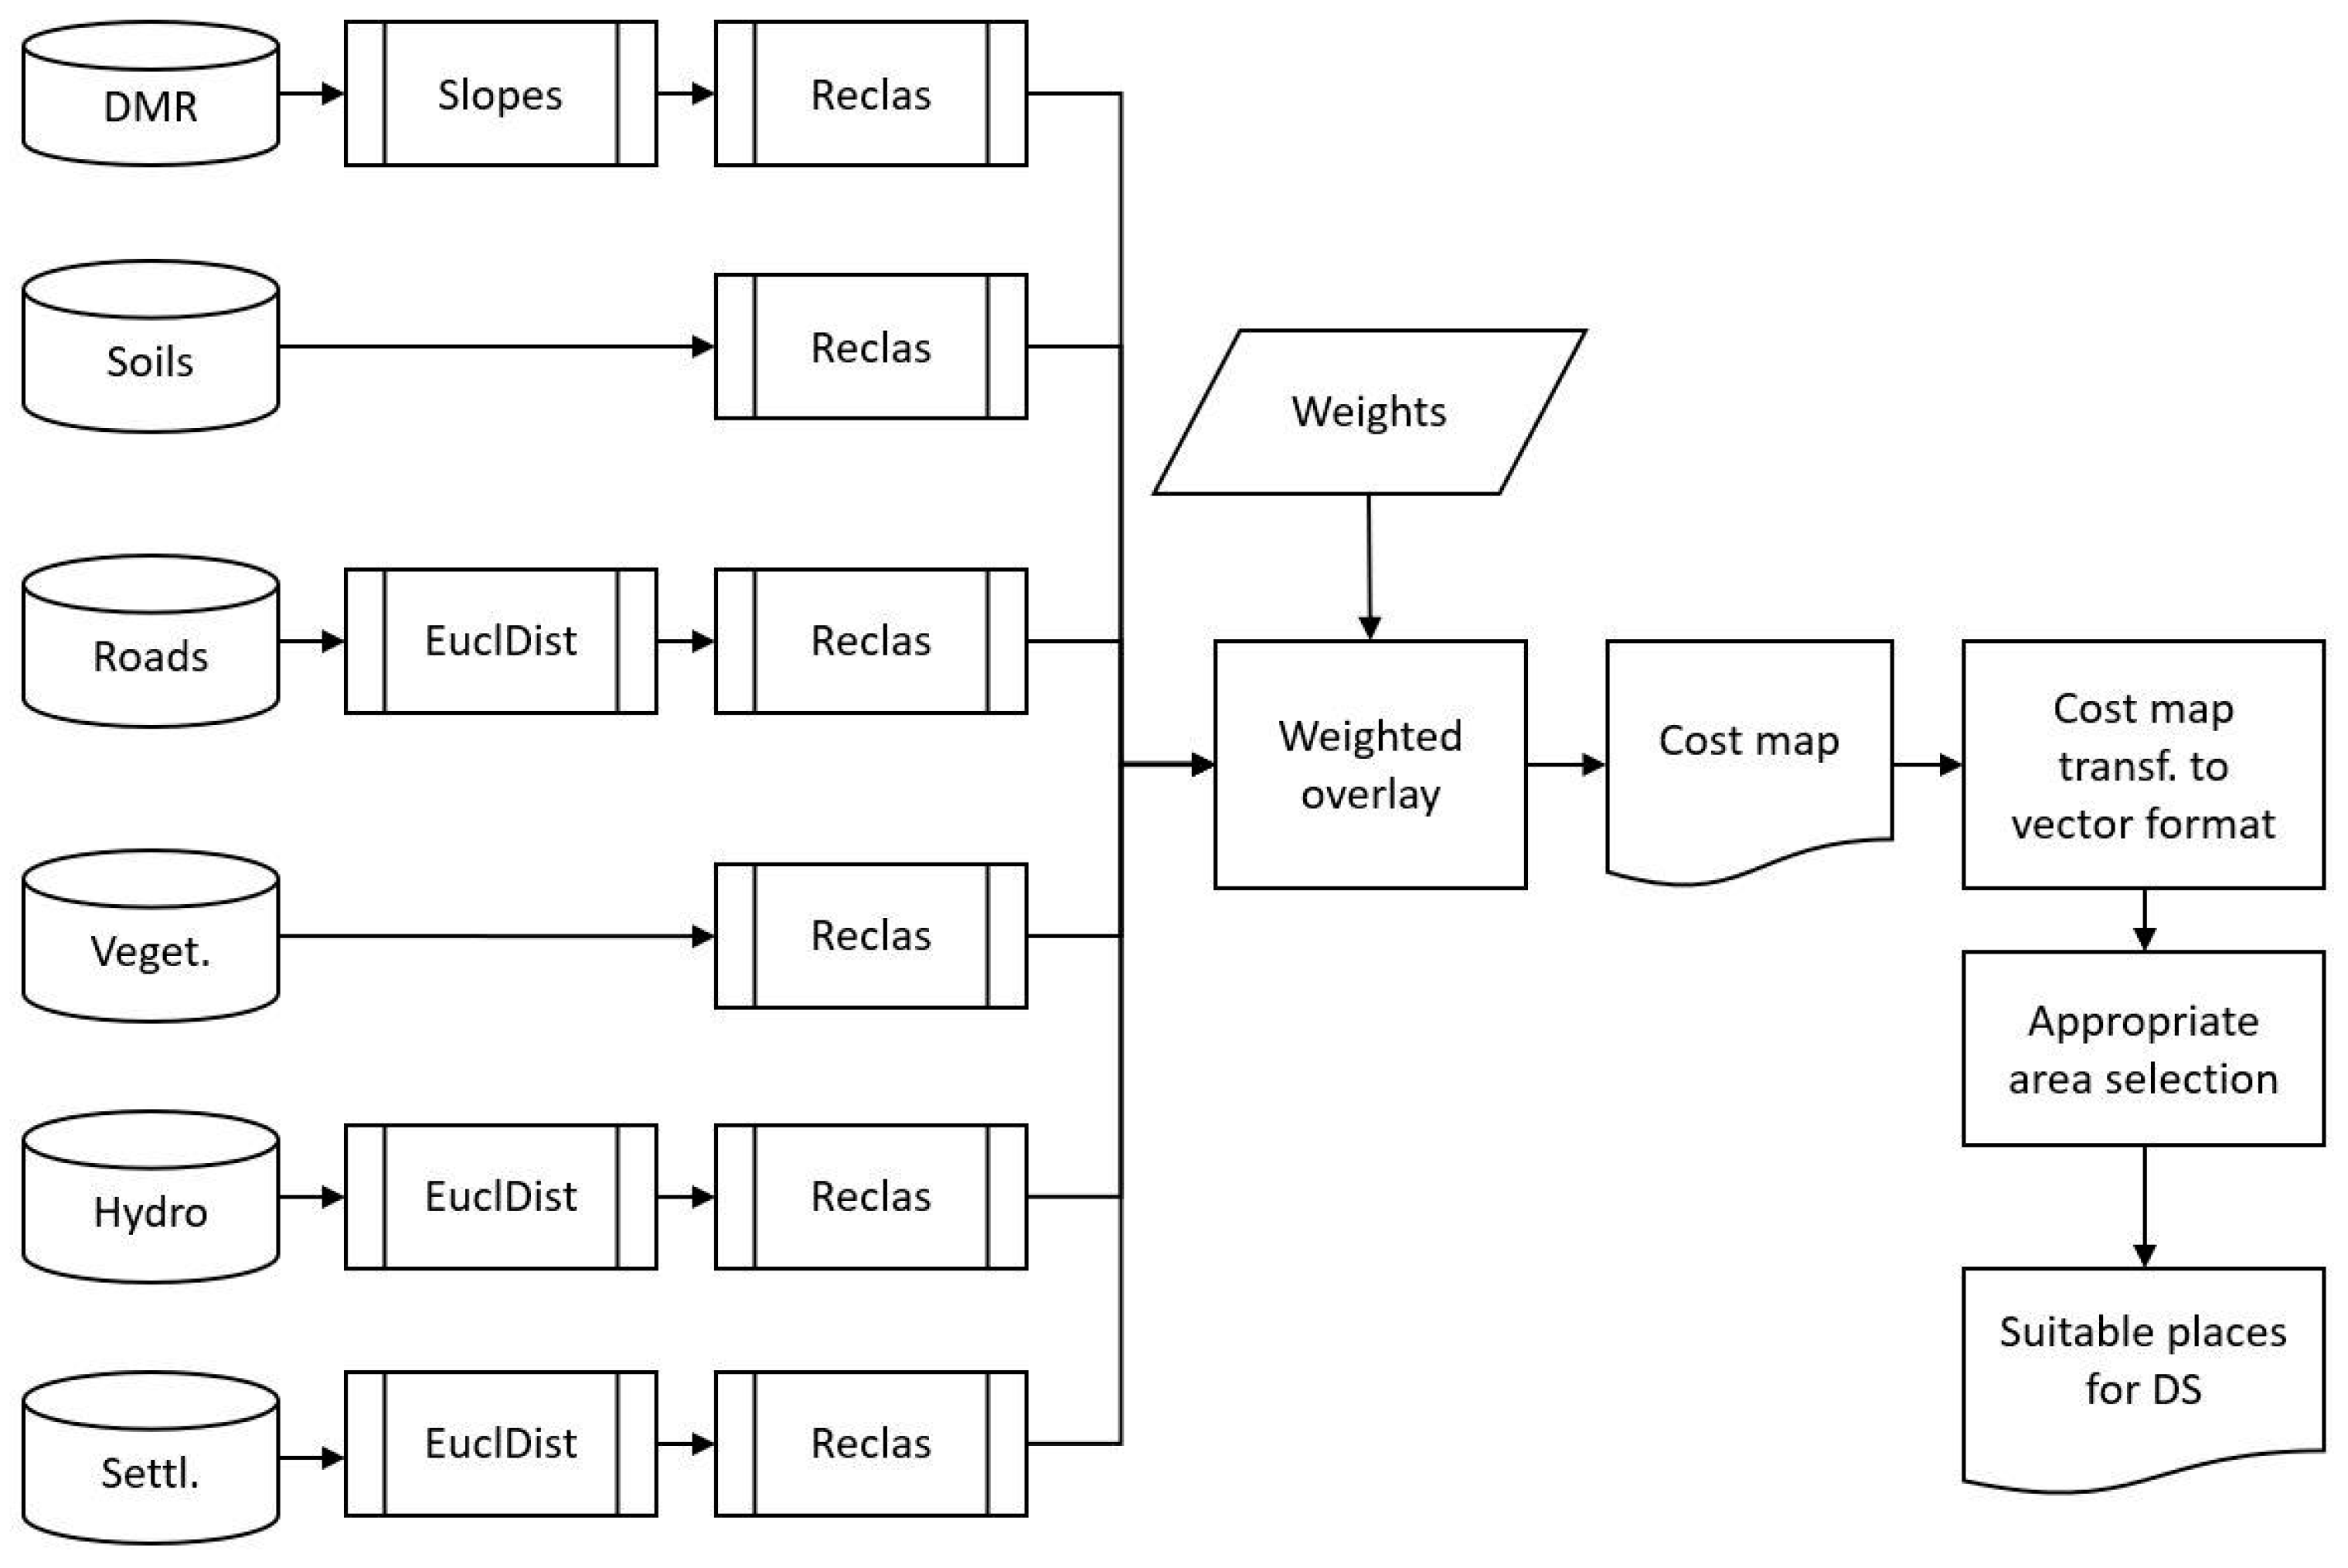
The influence of the individual factors may be evaluated from various data which, however, should be of the same qualitative characteristics if possible, especially the level of detail (LOD) for geometry as well as for their attributes. The used data layers may be of vector, as well as raster format, containing necessary data in various data types. That is why it is essential to identify how these data will be used for each evaluation criterion. For each evaluation criterion, minimal values of criteria are set to positively evaluate the given factors in the complete solution model of solution of the given problem. The whole procedure of the factor influences evaluation may be processed in the form of process models.
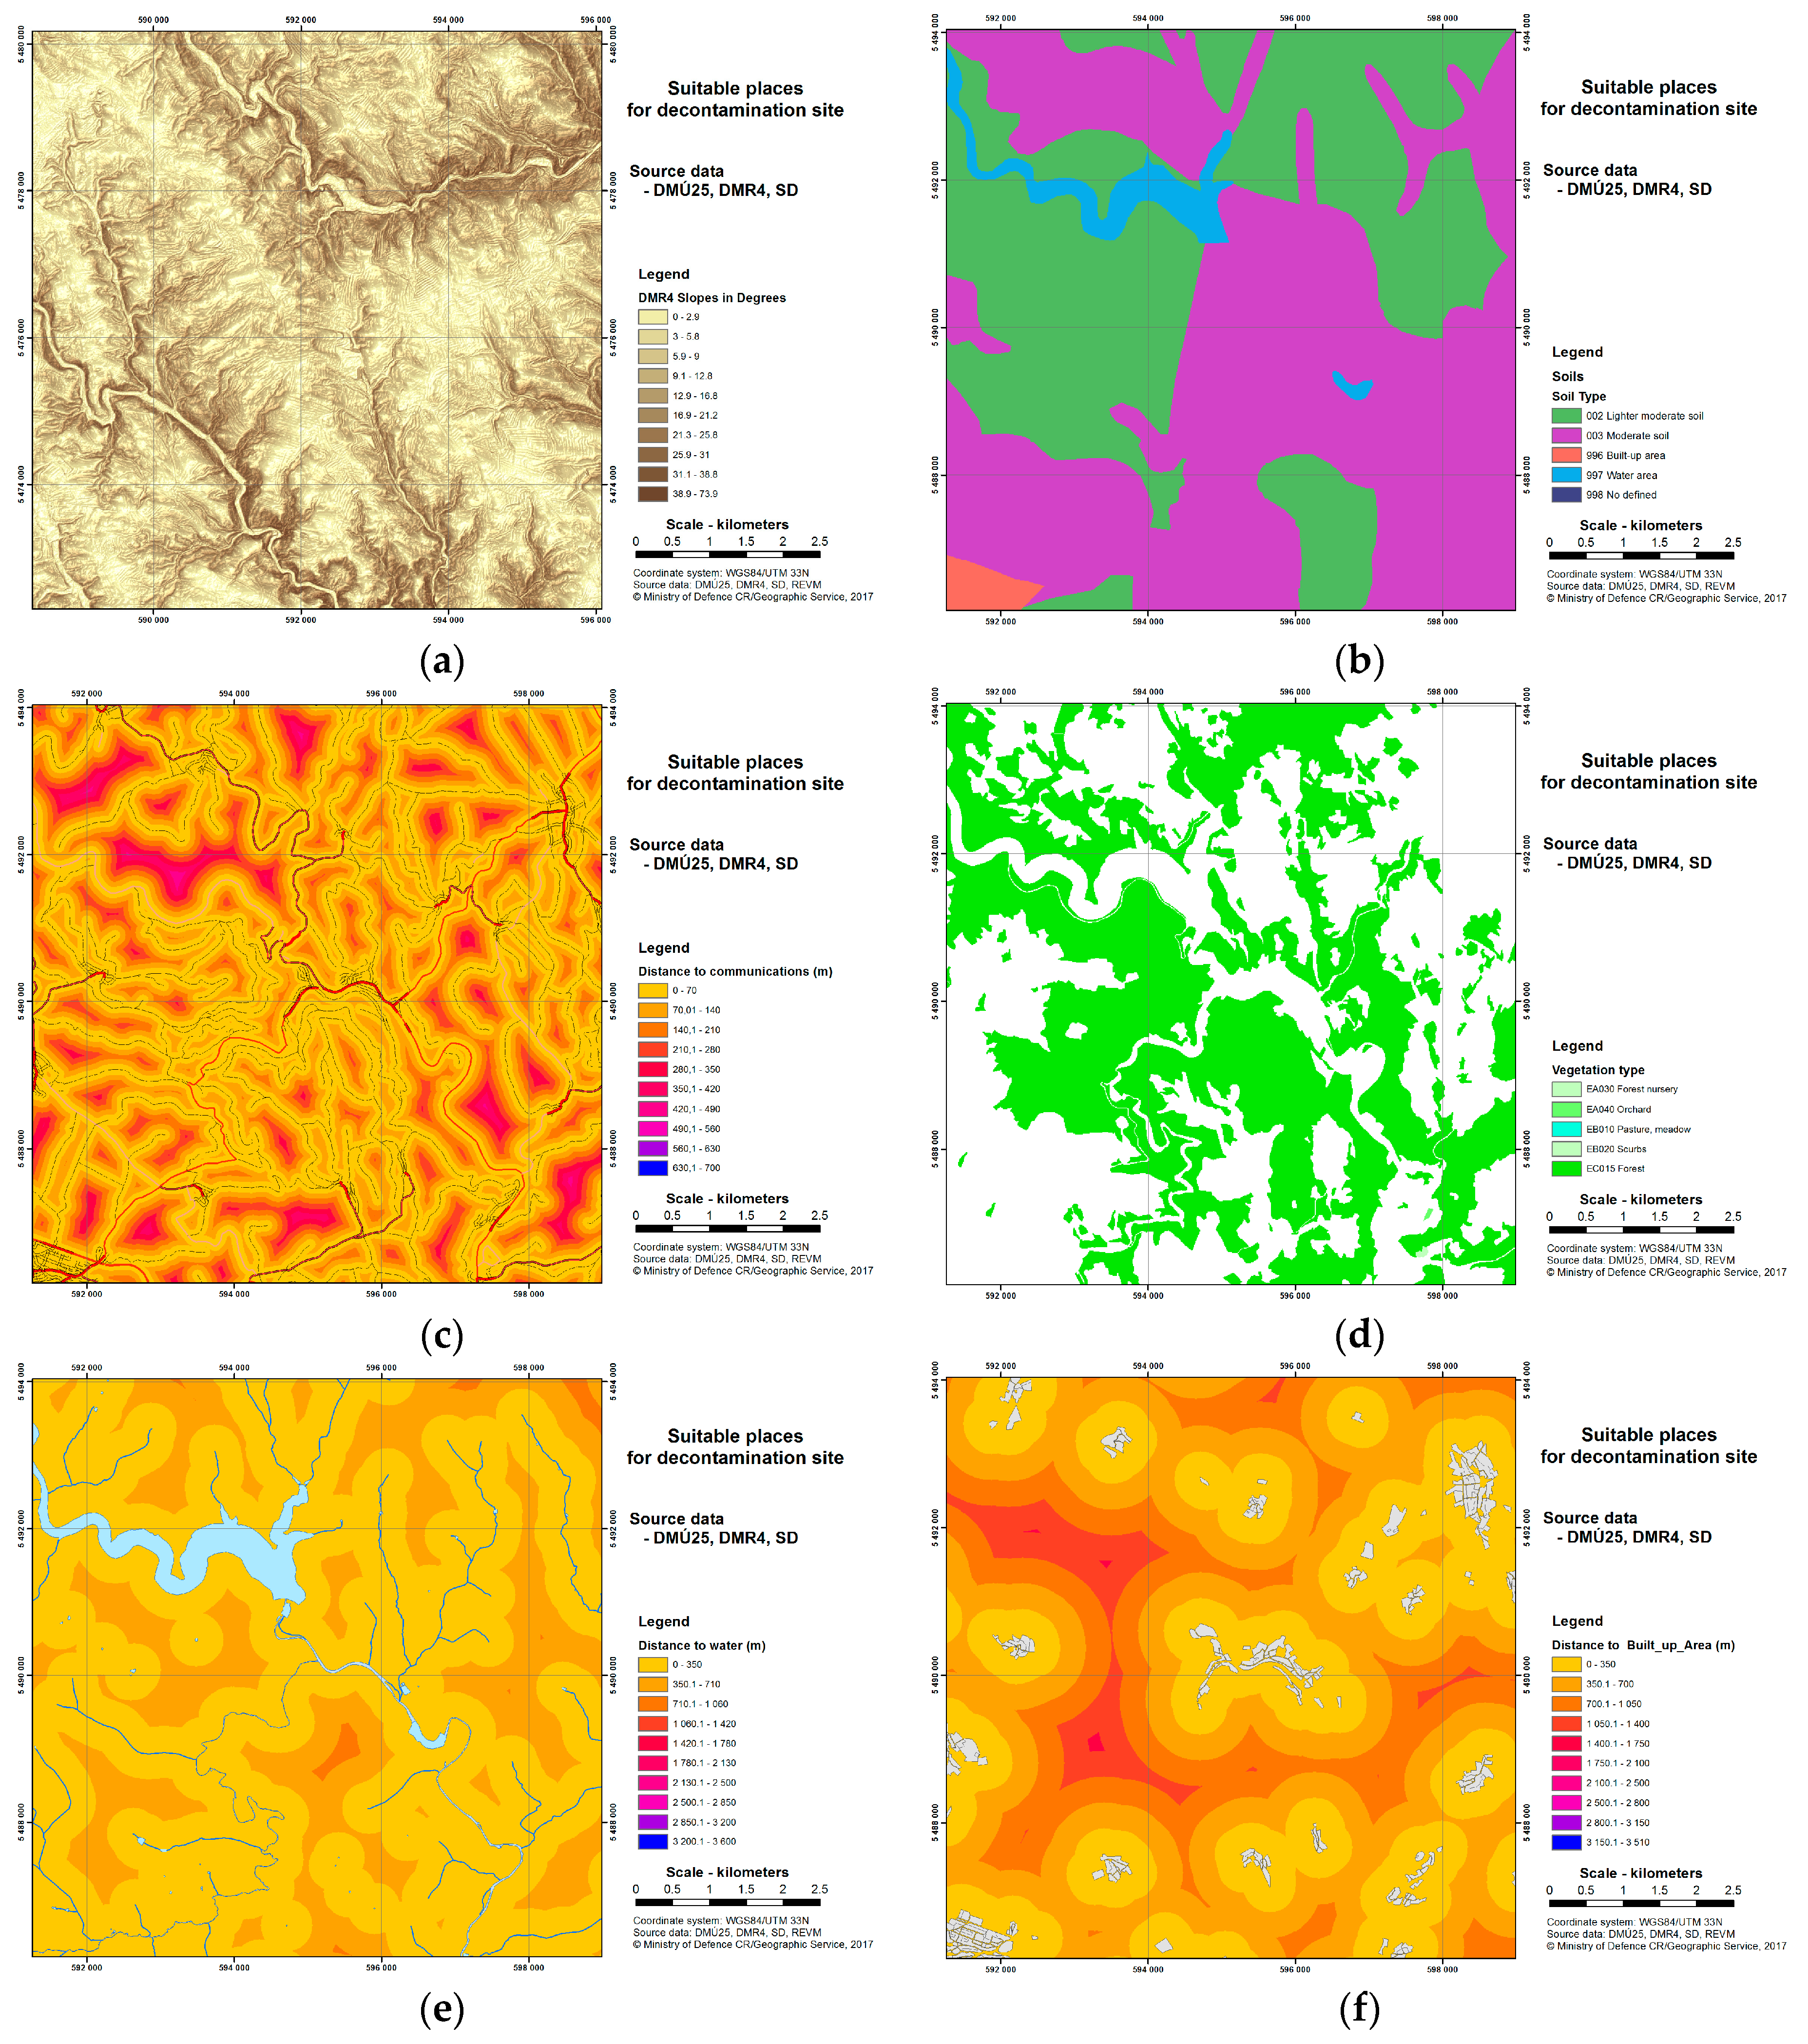
The first factor—the factor of terrain elevation—deals with the requirement for relatively flat terrain. When searching for suitable localities, it is necessary to create a map of relief inclination [33]. The process model will then contain a calculation of slopes inclination, where the input data layer will be a digital elevation model.
The second factor deals with a soil type. In the place of decontamination site, there will be a large number of people and vehicles moving on a surface that will also be wetted by rinse water (contaminated water is captured so that there is no threat to the environment and after the decontamination it is ecologically disposed of). It is necessary to decide what soil, in terms of soil type, is suitable for the activity in the given space [34]. As the most suitable it seems to set a hierarchy from the most to the least suitable one. For the evaluation itself, it is possible to use typing of soil types contained in the digital soil map.
The third factor deals with the distance of communications from the potential places of DS dislocation. For DS, it is important to be—if possible—within the reach of the communication network and for the vehicles to move on an unpaved surface as little as possible. That is why it is necessary to create a map of distances to the nearest communication. Therefore, the model will contain a process of distance calculation for which the input data layer will be a communication network.
The fourth factor deals with the influence of vegetation, especially of forest covers. For the deployment of DS, continuous treeless area with given minimal dimensions and area is ideal. In this step, a map of treeless areas with information about their size will be created. Therefore, the model must contain a process of search for treeless areas whose input data will be a layer of vegetation.
The fifth factor deals with the distance from suitable water sources. Technologies used in DS require a large amount of water for the preparation of decontamination blends and then also for rinsing of especially decontaminated vehicles. The most suitable places are, therefore, localities which have the needed source within the reach of suction hoses of units designed for decontamination.
If there are no water sources in the place, then it is essential to find these sources in the nearest surroundings of DS. That is the reason the next step is to create a map of distances from surface water sources. The model will contain a process of calculation of distances to water sources for which the input data layer will be a layer of waters.
The sixth factor evaluates the influence of resident areas. DS should be located outside of resident areas in order to avoid secondary contamination of civilians. Thus, the model must contain a process for searching distances from settlements for which a layer of built-up area will be its input data.
The last factor is a corresponding size of area. This factor is evaluated at the end of the complete analysis, when all preceding factors have been evaluated and when it is possible to say what dimensions the suitable localities should have. Suitable localities are sorted according to their value from a cost map and at the same time according to the size of a continuous area with a given cost range of all cells inside. The resulting cost map works as input data for this process.
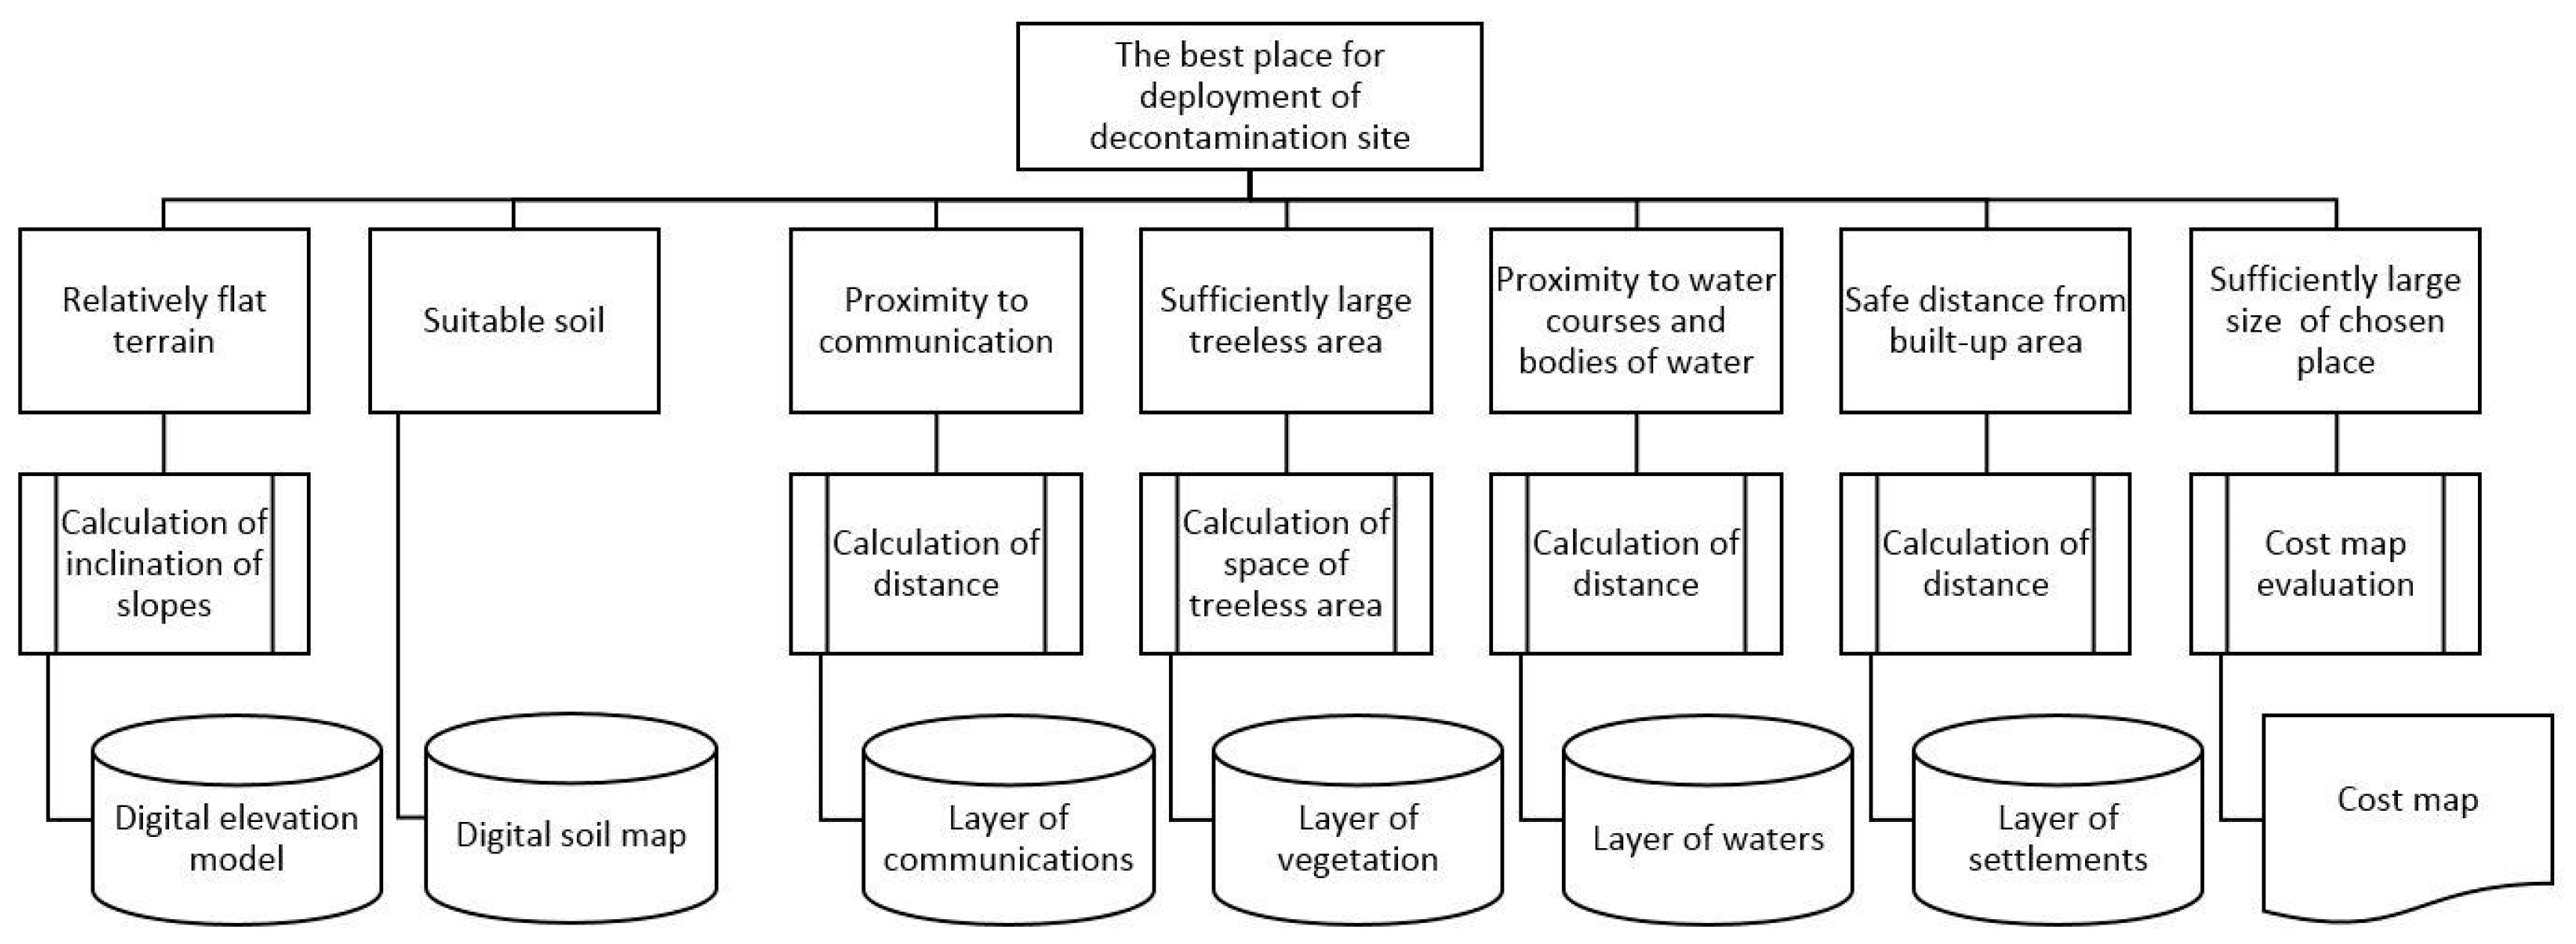
Based on an analysis of factors and criteria of their evaluation, a process scheme was created. It contains basic conditions as well as input data, processes, and outputs (Figure 4).

3. Obtained Results

The multi-criterial analysis itself was realized when evaluating the individual factors influence on the suitability assessment of the given space for the DS deployment, i.e., a search for alternatives.

3.1. Setting of Weights of Factors

Based on an expert estimation of seven workers who deal with conditions of decontamination in real life, the importance of the individual factors influence—with the exception of the corresponding size of a chosen area—was set as a normalized value (Table 2). Expert estimation was gained from a guided discussion with the above-mentioned workers. Finally, all participants completed a questionnaire in which they ranked the importance of the individual factors using Equation (1). A similar example of the use of expert evaluation can be found in [35].

3.2. Realization of the Analysis

For the model example, it was used: position model DMÚ25 [36], elevation model DMR4 [37] and Purpose-built Soil Database—PSD [38]. All analysis were done using program system ArcGIS 10.4.1 [6] including additional modules (Extensions). For all calculations it was chosen to use geodetic coordinate system WGS84 and projection UTM33N. When it was used with raster files, the pixel size of 10 m was used [39].
In the phase of the realization of the analysis, a choice of suitable tools for partial analyses of influences of the individual factors and for the evaluation of the complete influence of all factors was considered. Furthermore, classification of acquired information was also considered so that it was possible to classify this information in a unified evaluation scale.
The whole procedure of the solution can be shown on a simple flow chart (Figure 5).
The tool Slope was used for the calculation of slope inclinations. The calculation gave a raster file of slope inclinations, in which the slope inclination is given as a value of the given pixel. A tool for calculation of Euclidean distance was used for the calculation of distance, whose output is again a raster field. The value of each pixel in this field is a Euclidean distance of a pixel centre from the nearest source, e.g., communication, water course, body of water, forest, etc. The following pictures show examples of cutouts from a raster layer of slope inclinations (Figure 6a), distance to communications (Figure 6c), distance to waters (Figure 6e), and to built-up areas (Figure 6f).
For the analysis of soil suitability codes of soil type from a database of soils [38] were used which contains classifications of soil types according to Table 3.
Flat objects of soil types were transformed by a conversion function from a vector format into a raster file, in which the value of a pixel is a code of soil type. The result of such transformation is obvious from a picture (Figure 6b). Similarly, a raster file from a vector layer of vegetation was taken, in which a value of a pixel is a code of vegetation type given in the table (Table 4). An example of visualized data can be seen in the picture (Figure 6d).
Values of pixels in all input layers were changed into a raster file by a method of their transformation. That is why it was necessary to set a way of usage of these values in terms of their influence on the complete analysis. One of the ways how to reach this is to assign number values to classes in each map layer, i.e., reclassify them.
During reclassification the values of pixels of each layer were divided depending on the extent of suitability for the given purpose. The division was done in a way so that the original values were put into ten classes where numbers 1–10 were new values of the individual pixels. Number 10 represented the best value and number 1 on the contrary the worst value. Based on the character of the raster file content, the method of automatic or manual scaling was chosen.
Automatic scaling into 10 levels of suitability was chosen with all layers that reached the value of Euclidean distance. In case of slope inclination with regards to the condition for the activity of DS only two levels were chosen: 10 for places with slope inclination up to 5° and 1 for other values. With respect to the directive [27] all the terrain less than or equal to 5° is equally appropriate for DS.
Manual scaling was chosen for classification of enumeration (nominal) value, i.e., for the reclassification of types of soil and vegetation. In the model example in terms of soils, places with light soil are suitable, or also lighter moderate soil, less suitable are places with moderate, stronger moderate, and strong soil [34,40]. Unsuitable places are those where in terms of surface coverage there are identified built-up areas outside of villages and bodies of water. The used values are given in the table (Table 5).
Reclassification of vegetation was done similarly. In terms of vegetation type, the suitable places are without forest cover, acceptable are pastures and meadows, and also bush covers. Forest covers, including forest nurseries, orchards, and vineyards, are considered unsuitable [41,42]. These values are added in the table (Table 6).
In reclassified classes the individual pixels have the same influence on the result and they differ only internally by their value. However, since each individual evaluation criterion has its own weight (Table 2), it is necessary to apply these weights in the final multi-criterial analysis. By the application of MCA in the GIS environment a so-called cost map is calculated. It is created by a combination of the partial reclassified files. The input criteria are multiplied by the weights and then added together. For the calculation itself it is possible to use tools of map algebra or weighted overlay (Figure 7). The final result of a process model is shown in the next picture (Figure 8).
The resulting cost map only presents potential of the countryside for the deployment of decontamination site. The intervention commander, however, needs information about the size of available areas with the required characteristics that lie outside the impacted and endangered area. That is why it is necessary to transform the cost map from a raster into vector format. This transformation provides polygons whose attribute will be a value of suitability for deployment of DS and at the same time also areas of these polygons.
In the next step, all polygons with the highest value suitability and at the same time with a corresponding area for deployment of DS which are larger or equalled 2.5 km2 are chosen. If such areas are not found, it is necessary to decrease the requirement for the level of suitability and make a required choice again according to area.
The final step of the complete analysis is to choose from those potential places that are inside the impacted and endangered zone. Only then this analysis gives the intervention commander the information about possibilities of deployment of DS and then it is his/her decision which places to choose with regards to the whole situation in the secured space.
The mentioned steps were applied to the model example. After the transformation of the cost map into a vector format required polygons were provided. However, in the subsequent analysis it turned out that none of the areas with a higher value of suitability for the deployment of DS—which was 10—did not meet the requirements regarding its dimensions. That is why the requirement for suitability was decreased and it was searched for places that had the value of suitability 9–10. From these chosen polygons function Erase removed such polygons that lay inside of the impacted or endangered zone. The result of the complete analysis can be seen for the complete range of secured area (Figure 9) and then also in detail (Figure 10).
Based on the detail review of the resulting analysis it is possible to identify that the chosen areas do not meet 100% of all original requirements due to the features of MCA itself but also due to the quality of the source geographic data and methods of their reclassification. If the model example was to apply in real life, it would be necessary to verify the results of the analysis for the quality of used DGD and methodology of MCA. During this verification it is necessary to observe the influences of a change in quality of the source DGD on the carried out analysis as well as influences of a change in weights of the individual criteria in the MCA itself and the used decision-making rule or unifying function. The final verification of the suggested procedure, however, shall be realized directly in the real environment.
Due to the extent of the text, the following paragraph deals only with the methodical approach to the evaluation of an influence of a change in weights of criteria of a multi-criterial analysis. Other characteristics of the analysis did not change.

3.3. Influence of A Change in Weights of Criteria of MCA on a Spatial Analysis

In order to prove the sensitivity of the solution to the choice of priorities of the individual factors, weights of the individual factors were set based on consulting workers dealing with the theory of decontamination and their experience. The original normalized values of factor weights found based on expert estimation of workers who deal with conditions of decontamination in practice were stated in a table (Table 2). This table was complemented with new weights that reflected the attitude of decontamination theoreticians. Weights of factors by theoreticians were set exactly the same way as weights of factors set by eleven experts. Both groups of weights are given in the table (Table 7) where the groups are marked as “Weight of factor—Experts” for the workers from practice, and “Weight of factor—Theoreticians” for the workers from the field of theory.
Using the weights by theoreticians, a new multi-criterial analysis according to the same process model that was described in paragraph 3.1 was made. The result of the MCA was again a cost map with potential of a countryside for the deployment of DS.
The next step compared both cost maps, with weights by experts from practice as well as with theoreticians’. For the comparison only areas with a maximal possible potential for the deployment of DS were chosen (i.e., the value of suitability 10, then 9 and, subsequently, 8). The sizes of the gained areas were compared by consistency, then areas identical in both variants were searched for.
As it was already stated, in the first variant areas whose value of suitability was 9–10 were chosen. Their complete size was 220.0 km2, which accounts for 13.75% of the complete area of the area of responsibility (AOR). In the second variant that worked with theoreticians’ weights, however, there were no corresponding spaces found with the same values of suitability as with the experts. That was the reason why it was necessary to decrease the requirement for suitability by one level, it means to value 8.
The new range of values of suitability 8–10 corresponded—according to experts—to an area of 264.0 km2, which accounts for 16.50% of the complete area of AOR and the size of the area chosen according to the theoreticians was 340.6 km2, i.e., 21.29% of the complete area of AOR. The area of all corresponding places that were chosen by experts as well as theoreticians was 226.4 km2, which is 14.15% of the complete area of AOR. Both selections and common areas are shown in the pictures (Figure 11a–c, and Figure 12).
The values of weights of criteria by experts and theoreticians differed at five out of six criteria. The resulting analyses enable to study how the differences in the evaluation of influence of the individual factors manifested on the complete result of the MCA, but it is not obvious how the changes in the individual weights contributed to the complete change of analysis result. Multi-criterial analysis, however, enables to study also the influence of a change in the weight of two or several criteria on the complete result. This analysis may be used for instance when evaluating the influence of changes in characteristics of the used equipment in relation to its changed performance in practice which is for example dealt with in the application of value analysis [1].
In order to find out a partial influence in the change of weights on the complete result of MCA, weights of two most important factors were changed, i.e., factor of terrain relief and waters. The mentioned changes may be caused, e.g., by the use of equipment with better driving conditions in terrain, which induces a decrease of weight of criterion of slope inclination. On the contrary, climate changes in Central Europe in the last decade have been causing lack of surface water and that is why the importance of water factor is increased. The values of the changed weights are shown in the table in column “Weight of factor—Variant 3” (Table 8).
The same multi-criterial analysis was conducted with the weights of variant 3 and its results were compared with the results of the previous two analyses, while again only corresponding areas with the size larger or equalled to 2.5 km2 and value of suitability 8–10 were compared.
By the change of these weights of factors of terrain relief and waters with consideration of values of area suitability 8–10, the resulting suitable area reduced to 219.3 km2, which accounts for 13.71% of the complete area of AOR. Such a result is logical and expected as the influence of waters prevailed over the influence of terrain relief. The final comparison of all results waited in finding an intersection of all corresponding areas from all three variants. All three variants cross on an area of 129.1 km2, which is 8.07% of the complete area of the secured space. The intersection in the secured area is shown in the picture (Figure 12).

4. Discussion

Solving the model example showed possibilities provided by digital geographic data and spatial analyses when realizing geographical support of decision-making processes, it is especially necessary to solve expert tasks on an area of large extent. It also showed an approach for the use of general theory of multi-criterial analysis when solving spatial analyses. Methodical procedures were exactly presented and documented while analysing a geographic problem and the way of its solution following the requirements of future users of the solution result. Furthermore, procedures of application of MCA for the solution of a geographical problem while preparing background for the whole decision-making process were explained and also the article introduced the way of evaluation of a change in the influence of partial factors on the complete result of MCA.
Solving the model example at the same time documented the possibilities to use geographic analyses based on MCA in geographical support of decision-making processes. Both units that are primarily designed for the protection of civilians and soldiers still for these and similar analyses use mainly paper maps or simple analyses processed over scanned maps.
The case study has proved that if they used analyses performed over digital geographical data with the application of methods of multi-criterial analysis, the whole decision-making process would become more effective. Subsequently, it would also lead to the increase of efficiency when employing forces and equipment that are designated for the given intervention, in the model example for the deployment and use of decontamination sites. The increase of efficiency may be summarized in the following points:
  • The intervention commander gets objectivized information about the potential of the countryside in the secured space in terms of completing his/her expert task;
  • Objectivized information then saves time in making a decision because the commander does not have to deal with spaces that are not suitable or not enough suitable for the task;
  • Objectivized information then also saves time for the units of radiation and chemical research that only need to go through the chosen suitable spaces; and
  • The intervention commander may react more flexibly to the changing conditions that manifest by the change of factor weights.
The solution of the model example, however, could not possibly cover all aspects that would be necessary to consider in the real conditions. Current meteorological conditions and their influence on the ability of soil to bear equipment were not considered (e.g., rainfall, air humidity, temperature, cloudiness, and length of sunshine). Furthermore, wind speed and direction were not considered, either. They have a decisive influence on the spread of dangerous substances in the air and the size of the impacted area.
The solution did not include conditions for the transport of material and especially water from water sources. So the solution did not deal with the questions of terrain passability even though this solution is basically functional for various military equipment [40,41,42].
Within the solution of the model example neither the influence of the quality of source data on the result of the spatial analysis was evaluated. The solution used input data in the quality that is declared in the descriptions of the used data models [36,38]. For the real use it would be necessary to evaluate the influence of the standard quality of source data in terms of their use and define which data characteristics do not correspond to the given task and in what ways it would be necessary to improve their parameters. Simultaneously, it would be necessary to evaluate how the influence of a change in data quality manifests on the complete result of the spatial analysis [1].
The results of the analyses as a case study for Fire rescue system and chemical troops of the Czech Army were verified only with the use of independent data source from the production of the Czech State Administration of Land Surveying and Cadastre, Land Survey Office [37] and the Geographic Service of the Army of the Czech Republic [36]. For the verification of the partial cost maps earlier prepared studies concerning the quality of positional and elevation data were used, such as [1,43,44]. The resulting potential areas for the deployment of site were verified by the comparison to the reality with the help of Orthophoto of the Czech Republic [37]. This visual comparison was done together with experts of the NBC Defence Institute of the University of Defence, who evaluated the result of the case study as relevant and suitable for further development.

5. Conclusions

This contribution certainly could not cover all issues that occur while solving problems of geographical support of command and control systems. Its main goal was to show the problems of using digital geographical data within the solution of analytical tasks with applying of multi-criterial analysis. At the same time, a way how to continue in solving the task was indicated.
The whole final solution would also have to be verified by stress tests with workers who solve similar situations in practice, and also directly in terrain. It would be necessary to verify the results of analyses directly on the selected places and then to verify the whole model in terrain tests with the equipment and its operators.
It is necessary to deal with the mentioned problems in the next development of the solution so that there was a verified tool ready for use in practice.

Author Contributions

Conceptualization, Václav Talhofer and Šárka Hošková-Mayerová; Methodology, Václav Talhofer and Šárka Hošková-Mayerová; Software, Václav Talhofer; Validation, Formal Analysis, Investigation, Resources, Václav Talhofer and Šárka Hošková-Mayerová; Data Curation, Šárka Hošková-Mayerová; Writing-Original Draft, Václav Talhofer and Šárka Hošková-Mayerová; Writing-Review & Editing, Šárka Hošková-Mayerová; Visualization, Václav Talhofer; Project Administration, Šárka Hošková-Mayerová; Funding Acquisition, Šárka Hošková-Mayerová.

Funding

This research was funded by the Ministry of Defence of the Czech Republic. Project name: “Development of the methods of evaluation of environment in relation to defense and protection of the Czech Republic territory” (Project code NATURENVIR) and project “Development of basic and applied research developed in the long term by the departments of theoretical and applied bases of FMT” (project code: DZRO K-217).

Conflicts of Interest

The authors declare no conflict of interest.

References

  1. Talhofer, V.; Hošková-Mayerová, Š.; Hofmann, A. Quality of Spatial Data in Command and Control System; Studies in Systems, Decision and Control, 168; Springer International Publishing: Cham, Switzerland, 2018; p. 192. [Google Scholar] [CrossRef]
  2. Aringhieri, R.; Carello, G.; Morale, D. Supporting decision making to improve the performance of an Italian Emergency Medical Service. Ann. Oper. Res. 2016, 236, 131–148. [Google Scholar] [CrossRef]
  3. Amico, P.D.; Di Martino, F.; Sessa, S. A GIS as a Decision Support System for Planning Sustainabel Mobility in a Case-Study. In Multicriteria and Multiagend Decision Making with Applications to Economics and Social Sciences, Studies in Fuzziness and Soft Computing; Ventre, A., Maturo, A., Hoskova-Mayerova, S., Kacprzyk, J., Eds.; Springer: Berlin/Heidelberg, Germany, 2013; pp. 115–128. [Google Scholar] [CrossRef]
  4. Maliene, V. Specialised property valuation: Multiple criteria decision analysis. J. Retail Leis. Prop. 2011, 9, 443–450. [Google Scholar] [CrossRef]
  5. Malczewski, J. GIS and Multicriteria Decision Analysis; John Wiley: New York, NY, USA, 1999. [Google Scholar]
  6. Esri. ArcGIS User Documentation; Esri: Redlands, CA, USA, 2013. [Google Scholar]
  7. Pamučar, D.; Božanic, D.; Randelovic, A. Multi-criteria decision making: An example of sensitivity analysis. Serb. J. Manag. 2017, 12, 1–27. [Google Scholar] [CrossRef]
  8. Fiala, P.; Jablonsky, J.; Manas, M. Multicriteria Decision Making; Prague University of Economics: Prague, Czech Republic, 1997. (In Czech) [Google Scholar]
  9. Buttenfield, B.P.; McMaster, R.B. Map Generalization: Making Rules for Knowledge Representation; Longman Scientific & Technical, Ed.; Longman: Essex, UK, 1991; p. 37. [Google Scholar]
  10. Kovarik, V.; Marsa, J. Specifics of thematic map production within geospatial support at a politico-strategic level. Geogr. Tech. 2014, 9, 52–65. [Google Scholar]
  11. Božanic, D.; Tesic, D.; Milicevic, J. A hybrid fuzzy AHP-MABAC model: Application in the Serbian Army—The selection of the location for deep wading as a technique of crossing the river by tanks. Decis. Mak. Appl. Manag. Eng. 2018, 1, 143–164. [Google Scholar] [CrossRef]
  12. Božanic, D.; Pamučar, D.; Bojanic, D. Modification of the analytic hierarchy processes (AHP) method using fuzzy logic: Fuzzy AHP approach as a support to the decision making process concerning engagement of the group for additional hindering. Serb. J. Manag. 2015, 10, 151–171. [Google Scholar] [CrossRef]
  13. Pamučar, D.; Božanic, D.; Lukovac, V.; Komazec, N. Normalized weighted geometric bonferroni mean operator of interval rough numbers—Application in interval rough DEMATEL-COPRAS. Facta Univ. Ser. Mech. Eng. 2018, 16, 171–191. [Google Scholar] [CrossRef]
  14. Pamučar, D.; Stevič, Ž.; Sremac, S. A New Model for Determining Weight Coefficients of Criteria in MCDM Models: Full Consistency Method (FUCOM). Symmetry 2018, 10, 393. [Google Scholar] [CrossRef]
  15. Ústecký_Denik. Soldiers in Tisa practice decontamination after a crash (InCzech). 3 June 2015. Available online: https://ustecky.denik.cz/zpravy_region/foto-vojaci-v-tise-nacvici-dekontaminaci-po-havarii-20150603.html (accessed on 15 February 2019).
  16. Samuel, A.D.; Brejea, R.; Domuta, C.; Bungau, S.; Cenusa, N.; Tit, D.M. Enzymatic Indicators of Soil Quality. J. Environ. Prot. Ecol. 2017, 18, 871–878. [Google Scholar]
  17. Samuel, A.D.; Tit, D.M.; Melinte (Frunzulica), C.E.; Iovan, C.; Purza, L.; Gitea, M.; Bungau, S. Enzymological and Physicochemical Evaluation of the Effects of Soil Management Practices. Rev. Chim. 2017, 68, 2243–2247. [Google Scholar]
  18. Samuel, A.D.; Bungau, S.; Tit, D.M.; Melinte (Frunzulica), S.E.; Purza, L.; Badea, G.E. Effects of long term application of organic and mineral fertilizers on soil enzymes. Rev. Chim. 2018, 69, 2608–2612. [Google Scholar]
  19. Bungau, S.; Tit, D.M.; Fodor, K.; Cioca, G.; Agop, M.; Iovan, C.; Nistor Cseppento, D.C.; Bumbu, A.; Bustea, C. Aspects regarding the pharmaceutical waste management in Romania. Sustainability 2018, 10, 2788. [Google Scholar] [CrossRef]
  20. Gitea, M.A.; Bungau, S.; Gitea, D.; Purza, L.; Nemeth, S.; Samuel, A.D.; Badea, G.; Tit, D.M. The consequences of excessive chemicalization on fruits quality. Rev. Chim. 2018, 69, 1303–1308. [Google Scholar]
  21. Bitta, J.; Pavlíková, I.; Svozilík, V.; Jančík, P. Air Pollution Dispersion Modelling Using. ISPRS Int. J. Geo-Inf. 2018, 7, 489. [Google Scholar] [CrossRef]
  22. Otrisal, P.; Obsel, V.; Buk, J.; Svorc, L. Preparation of Filtration Sorptive Materials from Nanofibers, Bicofibers, and Textile Adsorbents without Binders Employment. Nanomaterials 2018, 8, 564. [Google Scholar] [CrossRef]
  23. Prikryl, R.; Otrisal, P.; Obsel, V.; Svorc, L.; Karkalic, R.; Buk, J. Protective Properties of a Microstructure Composed of Barrier Nanostructured Organics and SiOx Layers Deposited on a Polymer Matrix. Nanomaterials 2018, 8, 679. [Google Scholar] [CrossRef]
  24. Svorc, L.; Strezova, I.; Kianickova, K.; Stankovic, D.M.; Otrisal, P.; Samphao, A. An advanced approach for electrochemical sensing of ibuprofen in pharmaceuticals and human urine samples using a bare boron-doped diamond electrode. J. Electroanal. Chem. 2018, 822, 144–152. [Google Scholar] [CrossRef]
  25. Prochazka, J.; Prochazkova, D. Problems of mobile risks in territory. In Safety and Reliability—Safe Societies in a Changing World; Taylor & Francis Group: London, UK, 2018; p. 1783. [Google Scholar]
  26. Otrisal, P.; Florus, S.; Barsan, G.; Mosteanu, D. Employment of Simulants for Testing Constructive Materials Designed for Body Surface Isolative Protection in Relation to Chemical Warfare Agents. Rev. Chim. 2018, 69, 300–304. [Google Scholar]
  27. FRS GD. Decontamination, Decontamination Site (In Czech); Metodical Worksheet, ed.6L; Ministry of Interior—Fire Rescue Service of the Czech Republic: Prague, Czech Republic, 2017; p. 4.
  28. Otrisal, P.; Florus, S.; Svorc, L.; Barsan, G.; Mosteanu, D. A New Colorimetric Assay for Determination of Selected Toxic Vapors and Liquids Permeation through Barrier Materials Using the Minitest Device. Rev. Mater. Plast. 2017, 54, 748–751. [Google Scholar]
  29. Bekesiene, S.; Kleiza, V.; Malovikas, A. Military Specialist Preparation Features in Nowadays Environment. In Inteligent Technologies in Logistics and Mechatronics Systems: ITEMS 2009; Kaunas Univ Technol Panevezys Inst: Kaunas, Lithuania, 2009; pp. 158–163. [Google Scholar]
  30. Petrea, N.; Ginghina, R.; Pretorian, A.; Petre, R.; Barsan, G.; Otrisal, P.; Mosteanu, D.E. Experimental Survey Regarding the Dangerous Chemical Compounds from Military Polygons that Affect the Military Health and the Environment. Rev. Chim. 2018, 69, 1640–1644. [Google Scholar]
  31. Hofmann, A.; Hoskova-Mayerova, S.; Talhofer, V.; Kovarik, V. Creation of models for calculation of coefficients of terrain passability. Qual. Quant. 2015, 49, 1679–1691. [Google Scholar] [CrossRef]
  32. Rybansky, M.; Vala, M. Relief impact on transport. In Proceedings of the ICMT’09: International Conference on Military Technologies, Brno, Czech Republic, 5–6 May 2010; pp. 551–559. [Google Scholar]
  33. Hubacek, M.; Kovarik, V.; Kratochvil, V. Analysis of influence of terrain relief roughness on DEM accuracy generated from LIDAR in the Czech Republic territory. Int. Arch. Photogramm. Remote Sens. Spat. Inf. Sci. 2016. [Google Scholar] [CrossRef]
  34. Hubacek, M.; Almasiova, L.; Dejmal, K.; Mertova, E. Combining Different Data Types for Evaluation of the Soils Passability. In Rise of Big Spatial Data, Lecture Notes in Geoinformation and Cartography; Ivan, I., Singleton, A., Horák, J., Inspektor, T., Eds.; Springer International Publishing: Ostrava, Czech Republic, 2017; pp. 69–84. [Google Scholar] [CrossRef]
  35. Gigovic, L.; Pamučar, D.; Bajic, Z.; Milicevic, M. The combination of expert judgment and GIS-MAIRCA analysis for the selection of sites for ammunition depot. Sustainability 2016, 8, 372. [Google Scholar] [CrossRef]
  36. MoD-GeoS. Catalogue of the Topographic Objects DMU25; Ministry of Defence of the Czech Republic, Geographic Service: Dobruska, Czech Republic, 2010.
  37. CUZK. State Administration of Land Surveying and Cadastre, Land Survey Office, 2010. Available online: http://geoportal.cuzk.cz/ (accessed on 1 October 2017).
  38. Novák, P. Soil Database (Účelová Databáze PŮDY, Příručka Uživatele—In Czech); Vojenský Zeměpisný Ústav: Praha, Czech Republic, 2000. [Google Scholar]
  39. Pokonieczny, K.; Mościcka, A. The influence of the shape and size of the cell on developing military passability maps. ISPRS Int. J. Geo-Inf. 2018, 7, 261. [Google Scholar] [CrossRef]
  40. Hubacek, M.; Almasiova, L.; Brenova, M.; Bures, M.; Mertova, E. Assessing Quality of Soil Maps and Possibilities of Their Use for Computing Vehicle Mobility. In Central Europe Area in View of Current Geography; Masaryk University: Brno, Czech Republic, 2016; pp. 99–110. [Google Scholar]
  41. Rybansky, M.; Hofmann, A.; Hubacek, M.; Kovarik, V.; Talhofer, V. Modelling of cross-country transport in raster format. Environ. Earth Sci. 2015, 74, 7049–7058. [Google Scholar] [CrossRef]
  42. Talhofer, V.; Hofmann, A.; Kratochvíl, V.; Hubáček, M.; Zerzán, P. Verification of Digital Analytical Models: Case Study of the Cross-Country Movement. In Proceedings of the 2015 International Conference on Military Technologies (ICMT), Brno, Czech Republic, 19–21 May 2015. [Google Scholar]
  43. Kubíček, P.; Šašinka, Č.; Stachoň, Z. Vybrané kognitivní aspekty vizualizace polohové nejistoty v geografických datech (in Czech, Selected Cognitive Issues of Positional Uncertainty in Geographical Data). Geogr. Sborník České Geogr. Společnosti. 2014, 119, 67–90. [Google Scholar]
  44. Sanderson, M.; Stickler, G.; Ramage, S. Spatial Data Quality and the Open Source Community. OSGeo J. 2007, 2, 4. [Google Scholar]
Figure 1. Examples of the decontamination site [15].
Ijgi 08 00171 g001
Figure 2. Area of responsibility (modelled example).
Ijgi 08 00171 g002
Figure 3. Hierarchy of the conditions of the process scheme.
Ijgi 08 00171 g003
Figure 4. Scheme of the selection process model of a suitable place for decontamination site deployment.
Ijgi 08 00171 g004
Figure 5. Flow chart of the whole process.
Ijgi 08 00171 g005
Figure 6. (a) Cutout of a raster layer of inclination of slopes analyzed from the raster digital elevation model (DMR4). (b) Cutout of a raster layer of soil types. (c) Cutout of a raster layer of Euclidean distance to communications. (d) Cutout of a raster layer of vegetation types. (e) Cutout of a raster layer of Euclidean distance to waters. (f) Cutout of a raster layer of Euclidean distance to built-up area.
Ijgi 08 00171 g006
Figure 7. Example of setting weights of entry layers with weighted overlay.
Ijgi 08 00171 g007
Figure 8. Cost map for an evaluation of suitable places for the deployment of the decontamination site from data of DMU25, DMR4, and SD.
Ijgi 08 00171 g008
Figure 9. Suitable places for deployment of decontamination site—resulting analysis.
Ijgi 08 00171 g009
Figure 10. Suitable places for deployment of decontamination site; resulting analysis in detail; background map; and military topographic map, scale: 50,000.
Ijgi 08 00171 g010
Figure 11. (a) Potential places of the deployment of DS—experts’ weights. (b) Potential places of the deployment of DS—theoreticians’ weights. (c) Common areas of potential places of the deployment of DS.
Ijgi 08 00171 g011
Figure 12. Intersection of all three researched variants for possible deployment of DS.
Ijgi 08 00171 g012
Table 1. Evaluation criteria for the choice of a suitable place for a decontamination site dislocation.
FactorEvaluation Criterion
Relief of terrainInclination of slopes
Soil typeClassification of soil types
Communication relationsDistance from the nearest communication
VegetationSize of treeless area
WatersDistance from the nearest water course and body of water
Built-up areaOut of built-up area
Area of decontamination siteSize (minimal size) of chosen area
Table 2. Weights of factors and evaluation criteria.
FactorEvaluation CriterionWeight of Factor
Relief of terrainInclination of slopes0.25
Soil typeClassification of soil types0.15
Communication relationsDistance from the nearest communication0.12
VegetationSize of treeless area0.09
WatersDistance from the nearest water course and body of water0.31
Built-up areaOut of built-up area0.08
Area of decontamination siteSize (minimal size) of chosen areaNot set in the first evaluation
Table 3. Codes of soil types according to [38].
CodeSoil Type
001Weak soil (sandy)
002Lighter moderate soil (loam-sandy)
003Moderate soil (loam)
004Stronger moderate soil (clay-loam)
005Strong soil (clay)
996Built-up area
997Water area
998Not defined
Table 4. Codes of vegetation types [36].
CodeVegetation Type
EA030Forest nursery
EA040Orchard
EA050Vineyard
EB010Pasture, meadow
EB020Scrubs
EC015Forest
NoDataNo vegetation
Table 5. Codes of soil types and their suitability for deployment of DS.
CodeSoil TypeSuitability Coefficient
001weak soil (sandy)10
002lighter moderate soil (loam-sandy)10
003moderate soil (loam)9
004stronger moderate soil (clay-loam)8
005strong soil (clay)7
996built-up area1
997water area1
998not defined1
Table 6. Codes of vegetation types and their suitability for deployment of DS.
CodeVegetation TypeSuitability Coefficient
EA030Forest nursery1
EA040Orchard1
EA050Vineyard1
EB010Pasture, meadow7
EB020Scrubs6
EC015Forest1
NoDataNo vegetation10
Table 7. Weights of factors and evaluation criteria—experts and theoreticians.
FactorEvaluation CriterionWeight of Factor—ExpertsWeight of Factor—Theoreticians
Relief of terrainInclination of slopes0.250.20
Soil typeClassification of soil types0.150.10
Communication relationsDistance from the nearest communication0.120.15
VegetationSize of treeless area0.090.09
WatersDistance from the nearest water course and body of water0.310.28
Built-up areaOut of built-up area0.080.18
Area of decontamination siteSize (minimal size) of chosen areaNot set in the first evaluationNot set in the first evaluation
Table 8. Weights of factors and evaluation criteria—experts and theoreticians.
FactorEvaluation CriterionWeight of Factor—Expert Weight of Factor—Theoretician Weight of Factor—Variant 3
Relief of terrainInclination of slopes0.250.200.15
Soil typeClassification of soil types0.150.100.15
Communication relationsDistance from the nearest communication0.120.150.12
VegetationSize of treeless area0.090.090.09
WatersDistance from the nearest water course and body of water0.310.280.41
Built-up areaOut of built-up area0.080.180.08
Area of decontamination siteSize (minimal size) of chosen areaNot set in the first evaluationNot set in the first evaluationNot set in the first evaluation

