Article

Mapping with Stakeholders: An Overview of Public Participatory GIS and VGI in Transport Decision-Making

1
Department of Civil Engineering and Architecture, University of Catania, 95125 Catania, Italy
2
Department of Electrical Electronic and Computer Engineering, University of Catania, 95125 Catania, Italy
*
Author to whom correspondence should be addressed.
ISPRS Int. J. Geo-Inf. 2019, 8(4), 198; https://0-doi-org.brum.beds.ac.uk/10.3390/ijgi8040198
Submission received: 22 February 2019 / Revised: 1 April 2019 / Accepted: 20 April 2019 / Published: 24 April 2019

Abstract

:
Transport decision-making problems are typically spatially based and involve a set of feasible alternatives with multiple evaluation criteria. Besides, transport decisions affect citizens’ quality of life, as well as specific interests of general stakeholders (e.g., transport companies), thus needing a participatory approach to decision-making. Geographic Information Systems (GIS) have the ability to visualize spatial data and represent the impact of location based transport alternatives, thus helping experts to conduct robust assessments. Moreover, with the recent diffusion of Volunteered Geographic Information (VGI) and development of Public Participatory GIS (PPGIS) platforms, the process can be enhanced thanks to the collection of a large amount of updated spatial data and the achievement of an active community participation. In this study, we provide an overview based on a structured literature review of the use of VGI and PPGIS in transport studies, exploring the fields of application, role played by GIS, level of public involvement and decision stage at which they are applied. From the overview’s results, we propose a general framework for the evaluation of transport alternatives using GIS from a multiple stakeholder point of view; the main conclusion is the usefulness of the integration between Public Participation, GIS and quantitative evaluation methods, in particular Multi Criteria Decision Analysis, in order to foster technically sound and shared decisions.

1. Introduction

Transport is fundamental to economic growth, allowing cities to be connected and accessible for both passengers and freight. However, transport causes many negative externalities, a few of them being CO2 emissions, responsible for Climate Change, pollution and accidents [1,2]. Tackling the challenges of modern cities requires an integrated global approach where transport planning and decision-making should be driven by the idea that a sustainable transport system improves the quality of life [3].
Decision-making in the transport sector is a complex issue. This is because one has to take into account multiple and often conflicting environmental, social and economic criteria to evaluate different alternatives. This points to the need for using sound methodologies to assess alternatives from multiple viewpoints. In this respect, Multicriteria Decision Analysis (MCDA) is widely used to assess transport alternatives, allowing us to include in a comparative assessment of alternative projects their contributions to different evaluation criteria, even if they are assessed by heterogeneous measures (monetary, physical and linguistic) [3,4]. Moreover, alternative impacts and criteria importance are usually assessed by decision-makers with expert support, while it is fundamental to take into account the opinions of a set of individuals or groups (stakeholders, interest groups, citizens) with generally conflicting ideas, preferences and objectives. In this respect, technically sound solutions are needed, but, at the same time, transport decision-makers have to engage with private and public sector groups, inform them on the capacity of the project/plan to be economically sound, guarantee equity improvement, act on long term implications and respond to aspirations of different groups in society and their greatest concerns—such as Climate Change and a Green Economy [5].
Finding the best trade-off between a solution based on consensus building and one based on technical evaluations is a key issue in the evaluation of transport scenarios, in particular with increased attention paid in the last years to the important role of public participation in transport planning [6].
It is important to use adequate methods and tools that can help stakeholders and citizens participating in the decision-making process, making them understand the problem under discussion, and the potential multiple impacts of alternatives [7]. Since transport problems are typically spatially based and involve a set of feasible alternatives with multiple evaluation criteria, Geographic Information Systems (GIS) can be powerful tools to support experts conducting robust assessments, and to allow stakeholders and citizens to easily visualize the impacts of spatially based transport alternatives.
The term Public Participatory GIS (PPGIS) originated at two meetings of the National Centre for Geographic Information and Analysis (NCGIA) as the next generation of GIS that would provide technical advancements in social and political contexts [8] and should be more inclusive to nonofficial voices [9]. The resulting definition of PPGIS focused on pragmatic approaches to engage the public in applications of GIS with the goals of improving the transparency of and influencing government policy [10].
The main conceptual and theoretical foundations of PPGIS is that it is a spatial process, which always makes use of a map; it is scale dependent, in terms of data, participants’ location and issues to be treated; it offers an opportunity for decision-makers to propose a transparent decision-making process [11]. When it comes to transport strategies, most people want to know how they will be affected in their daily lives. Therefore, an appropriate method to answer the question might be to focus on a map and identify the policies relevant to a particular location. Considering that most of the public concern about the impacts of projects on the places where they live involves spatial entities, the use of GIS has a great potential for facilitating informed public involvement. In particular, the spatial dimension of transport related decisions gives GIS an important role in analyzing such problems.
Besides, the huge diffusion of Internet has introduced new trends in mapping and greater democratization of the access to spatial data and maps. The coupling between GIS and the Web has improved the shared use of GIS in three ways [12,13,14]:
  • Access and dissemination of spatial data, with the introduction of Geography Markup Language (GML), a data codification and transmission mechanism, the Scalable Vector Graphics (SVG), to improve the quality of the reproduction on the web, OGC geospatial web services and Spatial Data Infrastructures (SDIs), mechanisms with some specifics to improve accessibility and recover of spatial data [15].
  • Exploration and geo-visualization of spatial data, with the introduction of maps for structuring the debate and achieving different levels of agreement among decision-making process actors: in a Web environment with GIS capability the map becomes dynamic, interactive and accessible to a wider number of users as a visual communication tool.
  • Data elaboration, analysis and modeling, with the introduction of integrated tools between Web GIS and services to process data with intuitive interfaces, making modeling possible for both experts and general public users.
The shift of decision-making processes towards PPGIS-based approaches has the potential to foster high levels of public involvement. Through the Internet, GIS systems may face and develop democratization on the accessibility of spatial data and transparency of decision-making: in this way, technology can contribute to greater democratic participation in planning processes [16,17,18,19,20]. Besides, the use of internet forums as alternative to conventional meetings has the potential to break down barriers to participation by removing some psychological elements that can affect citizens when they express their views at meetings. One of the main advantages is that planning meetings are not limited by geographical location: access to information about the issues under discussion is available from any place with access to the web. Information is also available at all times of the day, avoiding the problems associated with the organization of meetings, opening up opportunities for more people to take part to a public consultation. Moreover, with a web-based system, the public is provided with access to interactive online planning documents can help the audience to focus on particular places, rather than wade through a long document to find the policies that may have implications for their lives [21].
The “public” involved is anyone with an interest in a particular issue regarding the scenarios under considerations [22]. In transport planning, they can be simply categorized in three classes: experts (i.e., key informants), stakeholders (e.g., institutions, groups, environmental associations, transport companies) and citizens (singles or in groups) [23].
In general, it can be very difficult to engage people in the process at the right time. The involvement process can be both top-down or bottom-up: PPGIS technology can enable a bottom-up approach from grassroots community groups. The participatory map in PPGIS is a fundamental tool that gives an overview of issues and proposals reported by different users. It democratizes the teaching and use of GIS, which is made accessible and comprehensible by a wider range of communities and social groups; it makes citizens participate in space planning and decision-making; it allows the inclusion of public values in decision support systems; it describes the spatial perceptions of the public and the meanings that belong to these places.
Recently, the new approach of Volunteered Geographic Information (VGI), which can be described as the use of the web to create, assemble, and disseminate geographic information voluntarily provided by individuals [24], has emerged as an improvement of PPGIS in terms of speed, scale, and representativeness [25]. The creation of such a public database and applications from the Geoweb have led web-based participation to a more dynamic and collaborative level, also in the field of transport, where applications such as Openstreetmap (https://www.openstreetmap.org), Strava (https://www.strava.com/), Stravametro (https://metro.strava.com/) and Waze (https://www.waze.com) have nowadays become sources of information and data with a big potential to be processed for studies and transport researches.
Based on this premise, the aim of this study is twofold, i.e., to: (1) understand how PPGIS and VGI have been used so far in the transport field; (2) propose an overall framework for their inclusion in transport planning with some recommendations.
In order to address the first objective, we conducted a systematic review of scientific works dealing with the increasing use of PPGIS and VGI in the field of transport. The decision to limit the analysis to the transport decision-making domain is attributable to their quite recent use in this field. Under this respect, it becomes useful to explore their evolution in the last years, the actual research gap and potential of application. The overview includes all types of research (articles, conference papers, reports, books) dealing with infrastructure projects, technologies and strategic decisions and policies concerning transport. Starting from the results of the review, we propose a framework for technical analyses that would allow public participation throughout the different phases of the transport decision-making process.
This is particularly relevant and needed in transport decision-making, due to a lack of comprehensive knowledge and systematization of innovative spatial evaluation tools to support public participation in transport planning. Some guidelines related to online tools to support participation can be found, especially in gray literature (see, e.g., reference [26]), but there is not an overall framework that relates the use of them with the different decision-making phases and actors involved, especially in transport planning.
The remainder of the paper is organized as follows: in Section 2, we describe the structure of the overview, the search strategy and we provide some statistical analysis of results. In Section 2, we try to provide answers for the research guiding questions. In Section 3, we propose a PPGIS-MCDA based framework for the evaluation of transport projects. Finally, Section 4 contains conclusions with possible future research streams.

2. Guidelines through the Overview

The structure of the review is organized in 3 phases:
  • Description of the aim of overview;
  • Delineation of the search strategy;
  • Summary of key findings.

2.1. Aim/Question of Overview:

The review is intended to address the four following questions, i.e.,:
  • Which subjects or kind of decisions are studied? In particular, an analysis of the transport studies per main categories and a distribution in sub-categories will be conducted.
  • How is the GIS used to involve the participants? Based on the opportunity and level of use of the GIS tools by the participants.
  • Who is the “public” involved in the study? This question aims at knowing the type of involvement in the study, if limited to a small group of users or to a large community.
  • What is the stage of the transport decision-making process when GIS is used? This question aims at knowing whether VGI and PPGIS are suitable for use during the entire decision-making process or only in some of its phases.

2.2. Search Strategy

A search of scientific papers was conducted by consulting the following databases and academic research engines:
The search strategy involved the indication of the following keywords in search engines and database, using the Boolean AND operator, if possible, or by successive categorization: Public Participatory GIS AND transport, PPGIS AND transport, Volunteered geographic information AND transport, VGI AND transport.

2.3. Summary of Key Findings

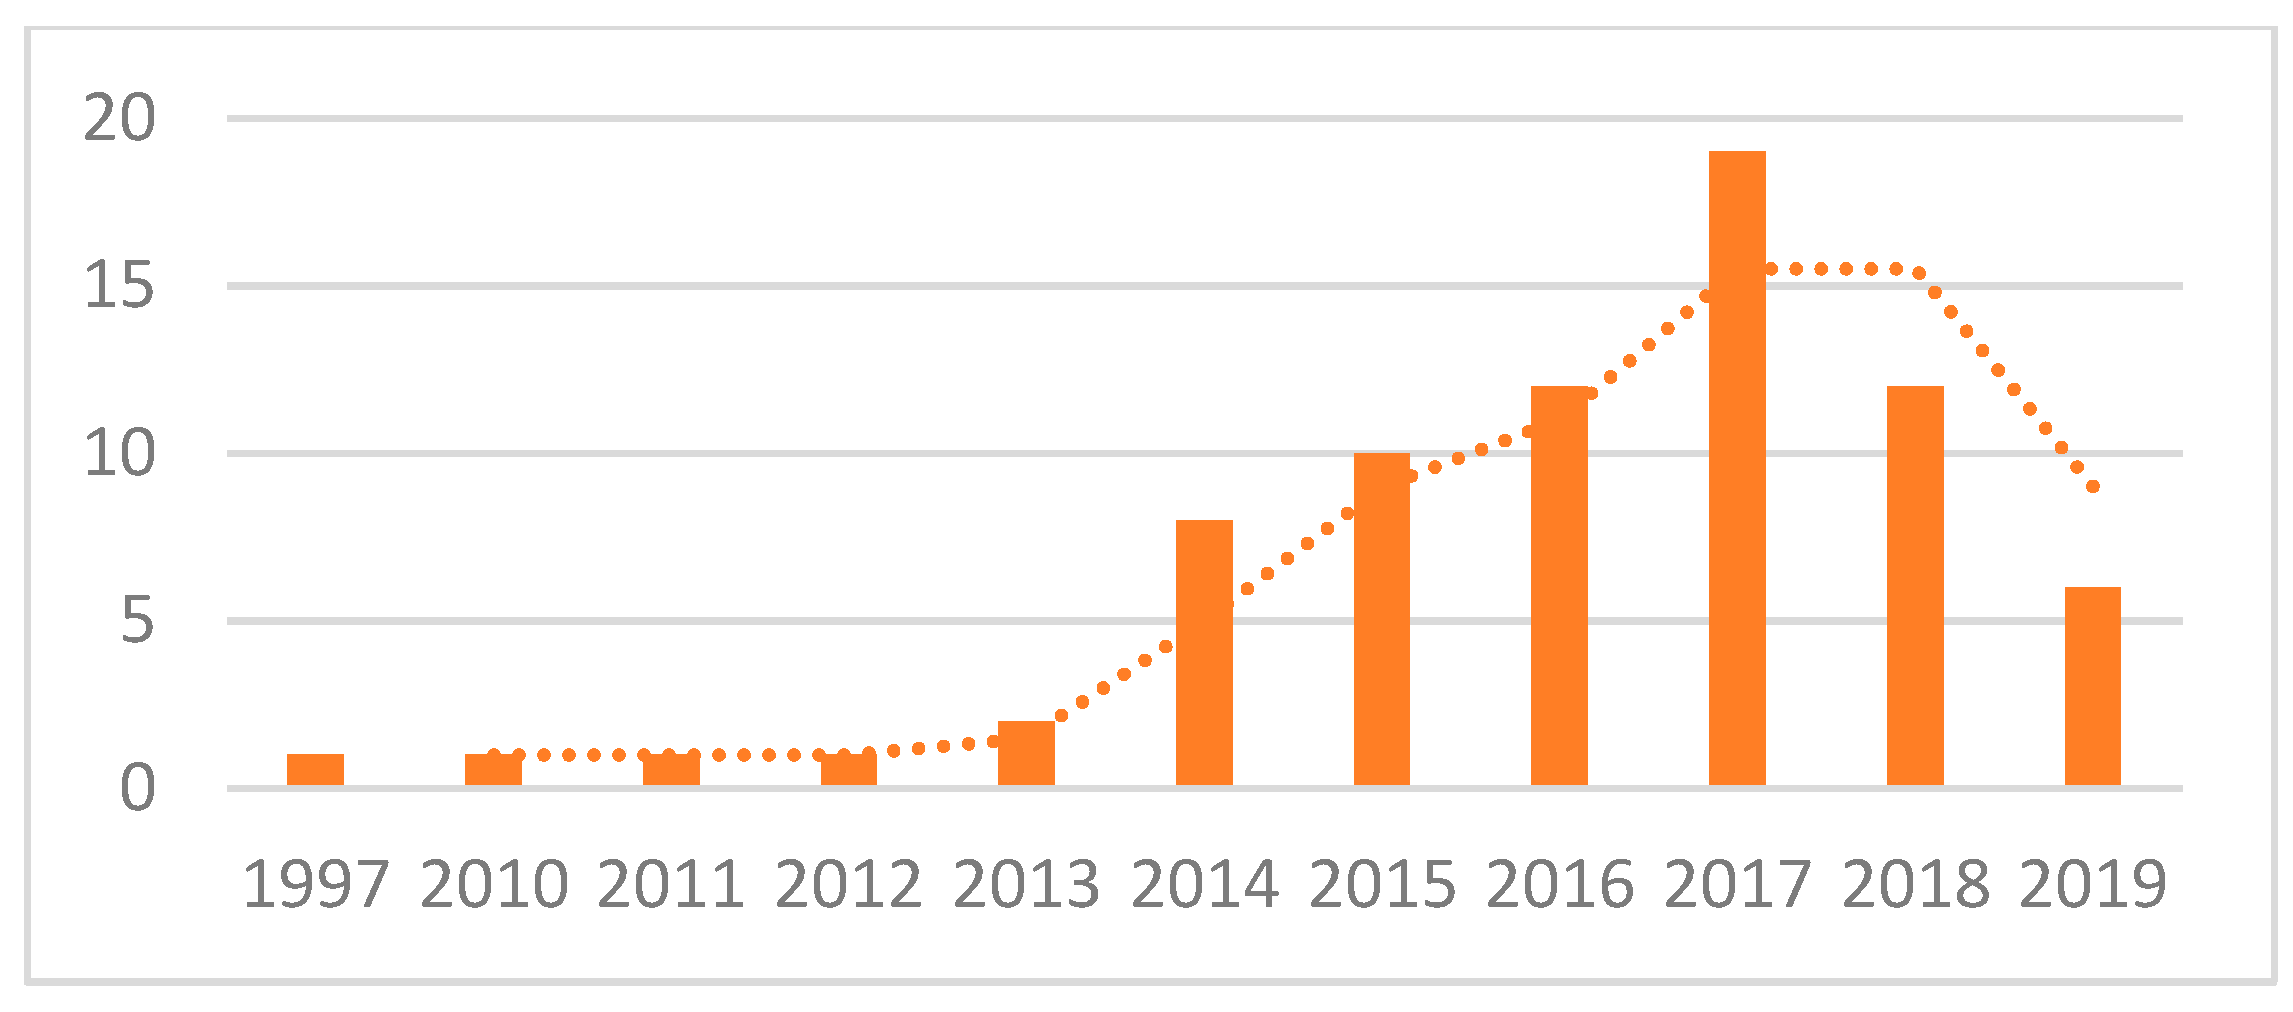
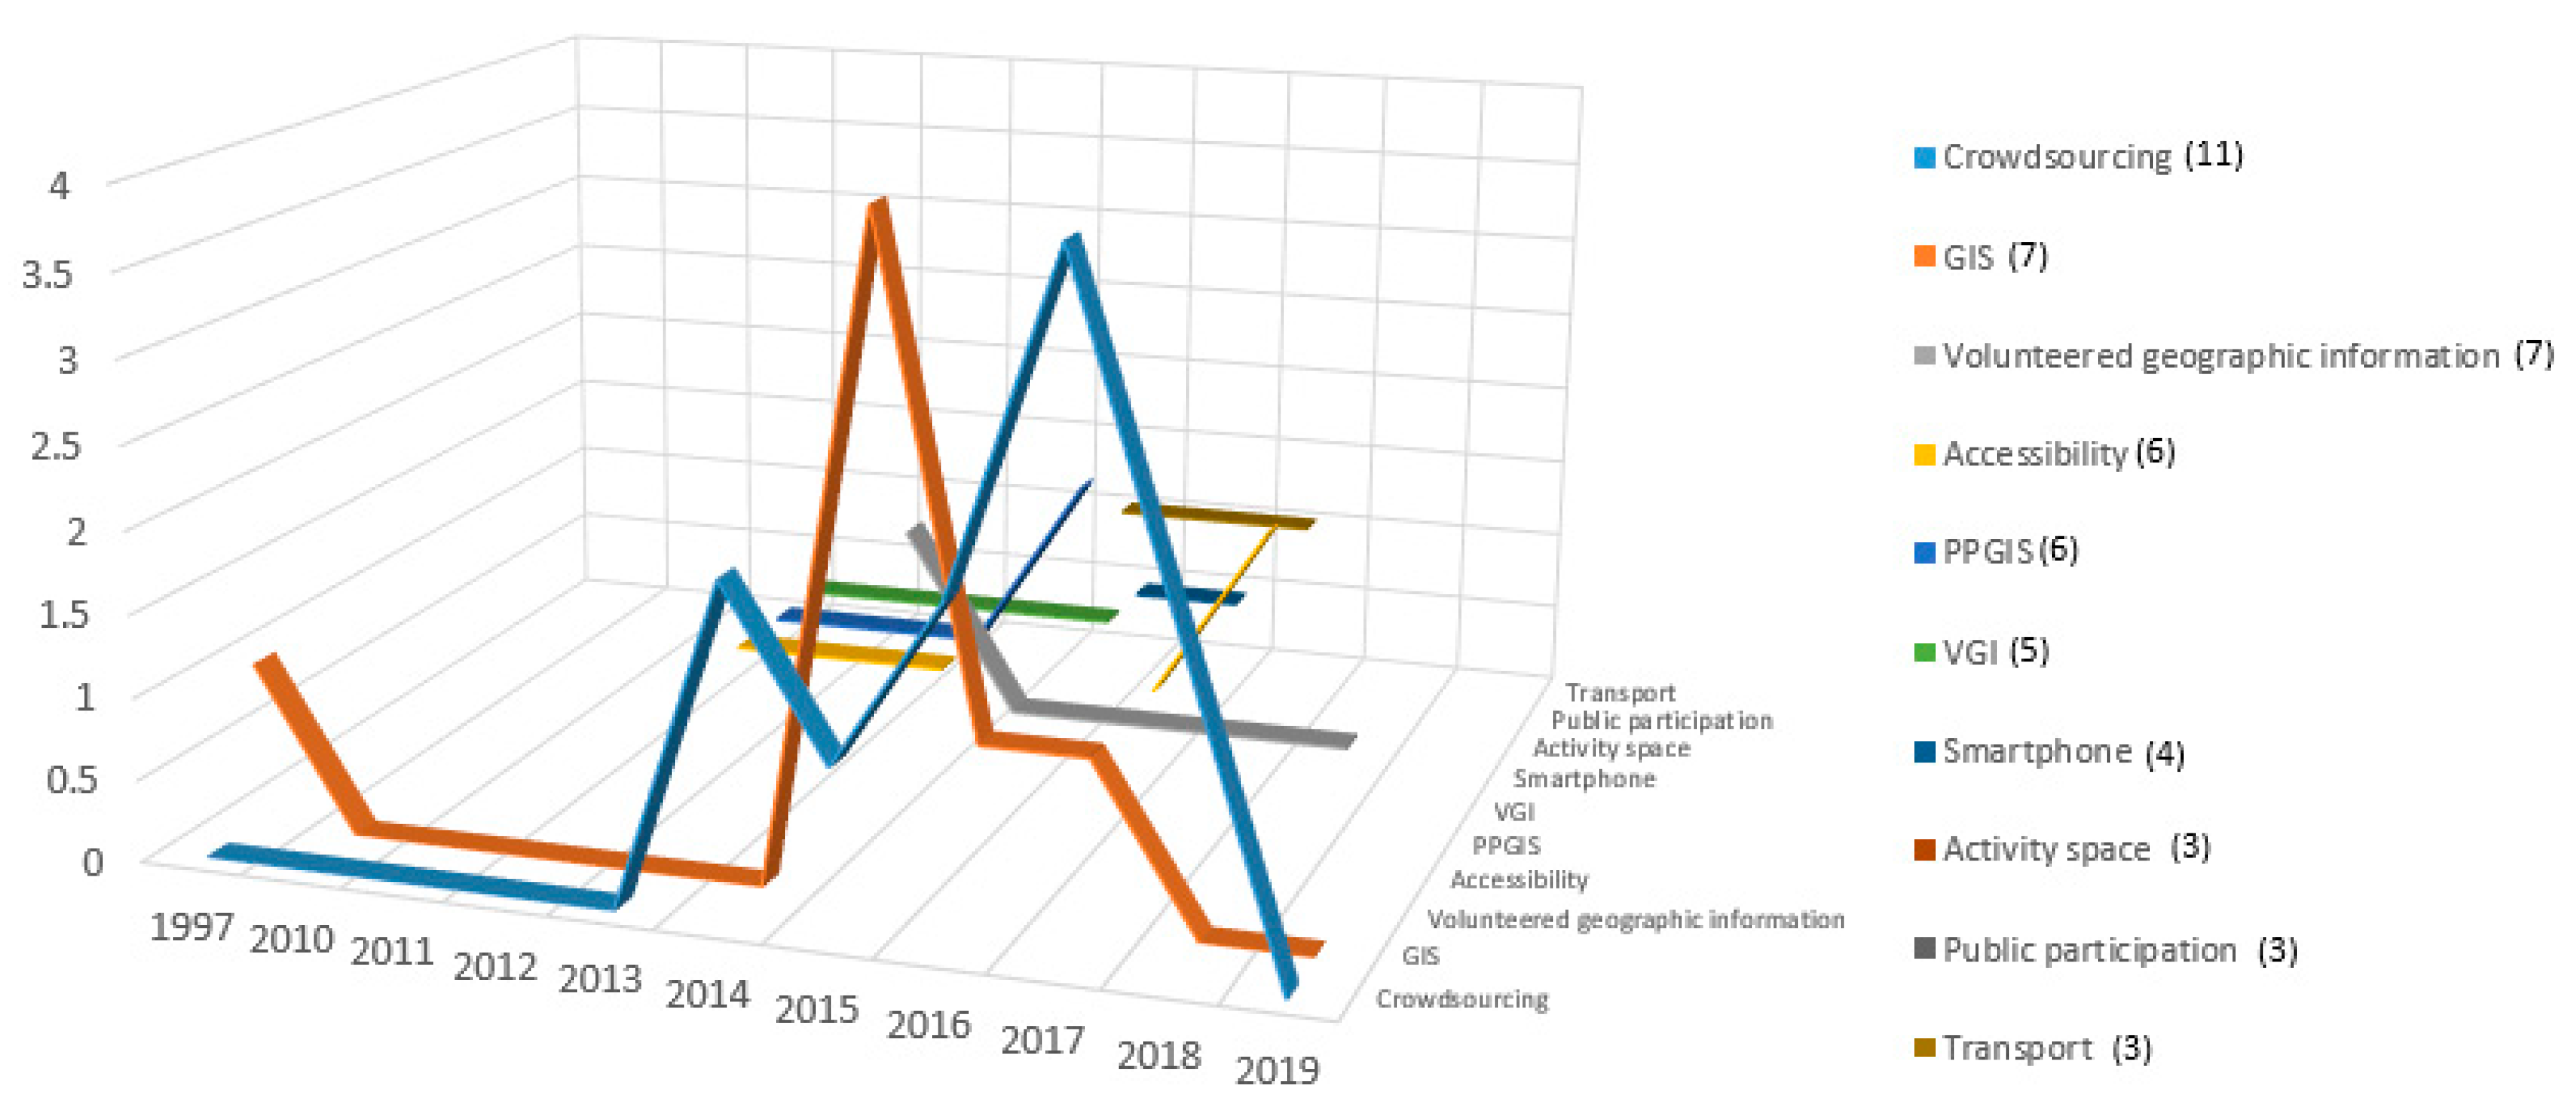
2.3.1. Statistical Analysis

The research produced a selection of 81 documents: after an analysis of the entire text of the publication a total of 73 publications in line with the research objectives were chosen for in-depth analysis and were collected in an excel database. The range of publication years of the works analyzed is between 1997 and 2019, including the works already published to date (Figure 1). The only article published in 1997 [27] is a pioneering work on spatial group choice that could not rely on today’s technologies for creating and modifying spatial data by non-expert users. Therefore, it can be said that a continuous and growing scientific production on the issues related to PPGIS in the field of transport can be placed starting from 2010.
Keyword analysis can support the identification of the main areas of application since they are used by the authors to help indexers, search sources and consequently readers to find relevant papers; they generally represent the content of the manuscript and are quite specific to subject’s field or sub-field. From the analysis of the keywords of the papers of the review (Figure 2), conducted through pivot tables, beyond the terms included in the search strategy (GIS, VGI, PPGIS, Crowdsourcing and Transport), the words “Accessibility” [28,29,30,31,32,33], Smartphone [34,35,36,37,38] and “Activity Space” [39,40,41] emerge.
In particular, GIS are fundamental to visualize the impact of transport solutions in terms of accessibility, and there is a growing literature on transport studies related to this topic [42,43,44,45]. Besides, combining crowdsourcing, sensing and open data can foster accessible and smart city development, e.g., by providing personalized paths to users with special needs [46]. Crowdsourcing has also been used as a tool to foster public participation in the early stages of transport decision-making in sustainable mobility planning processes by eliciting citizen spatially located ideas and opinions (see, e.g., https://www.pumsroma.it/partecipa/proposte-cittadini/?to=naviga, in Italian).

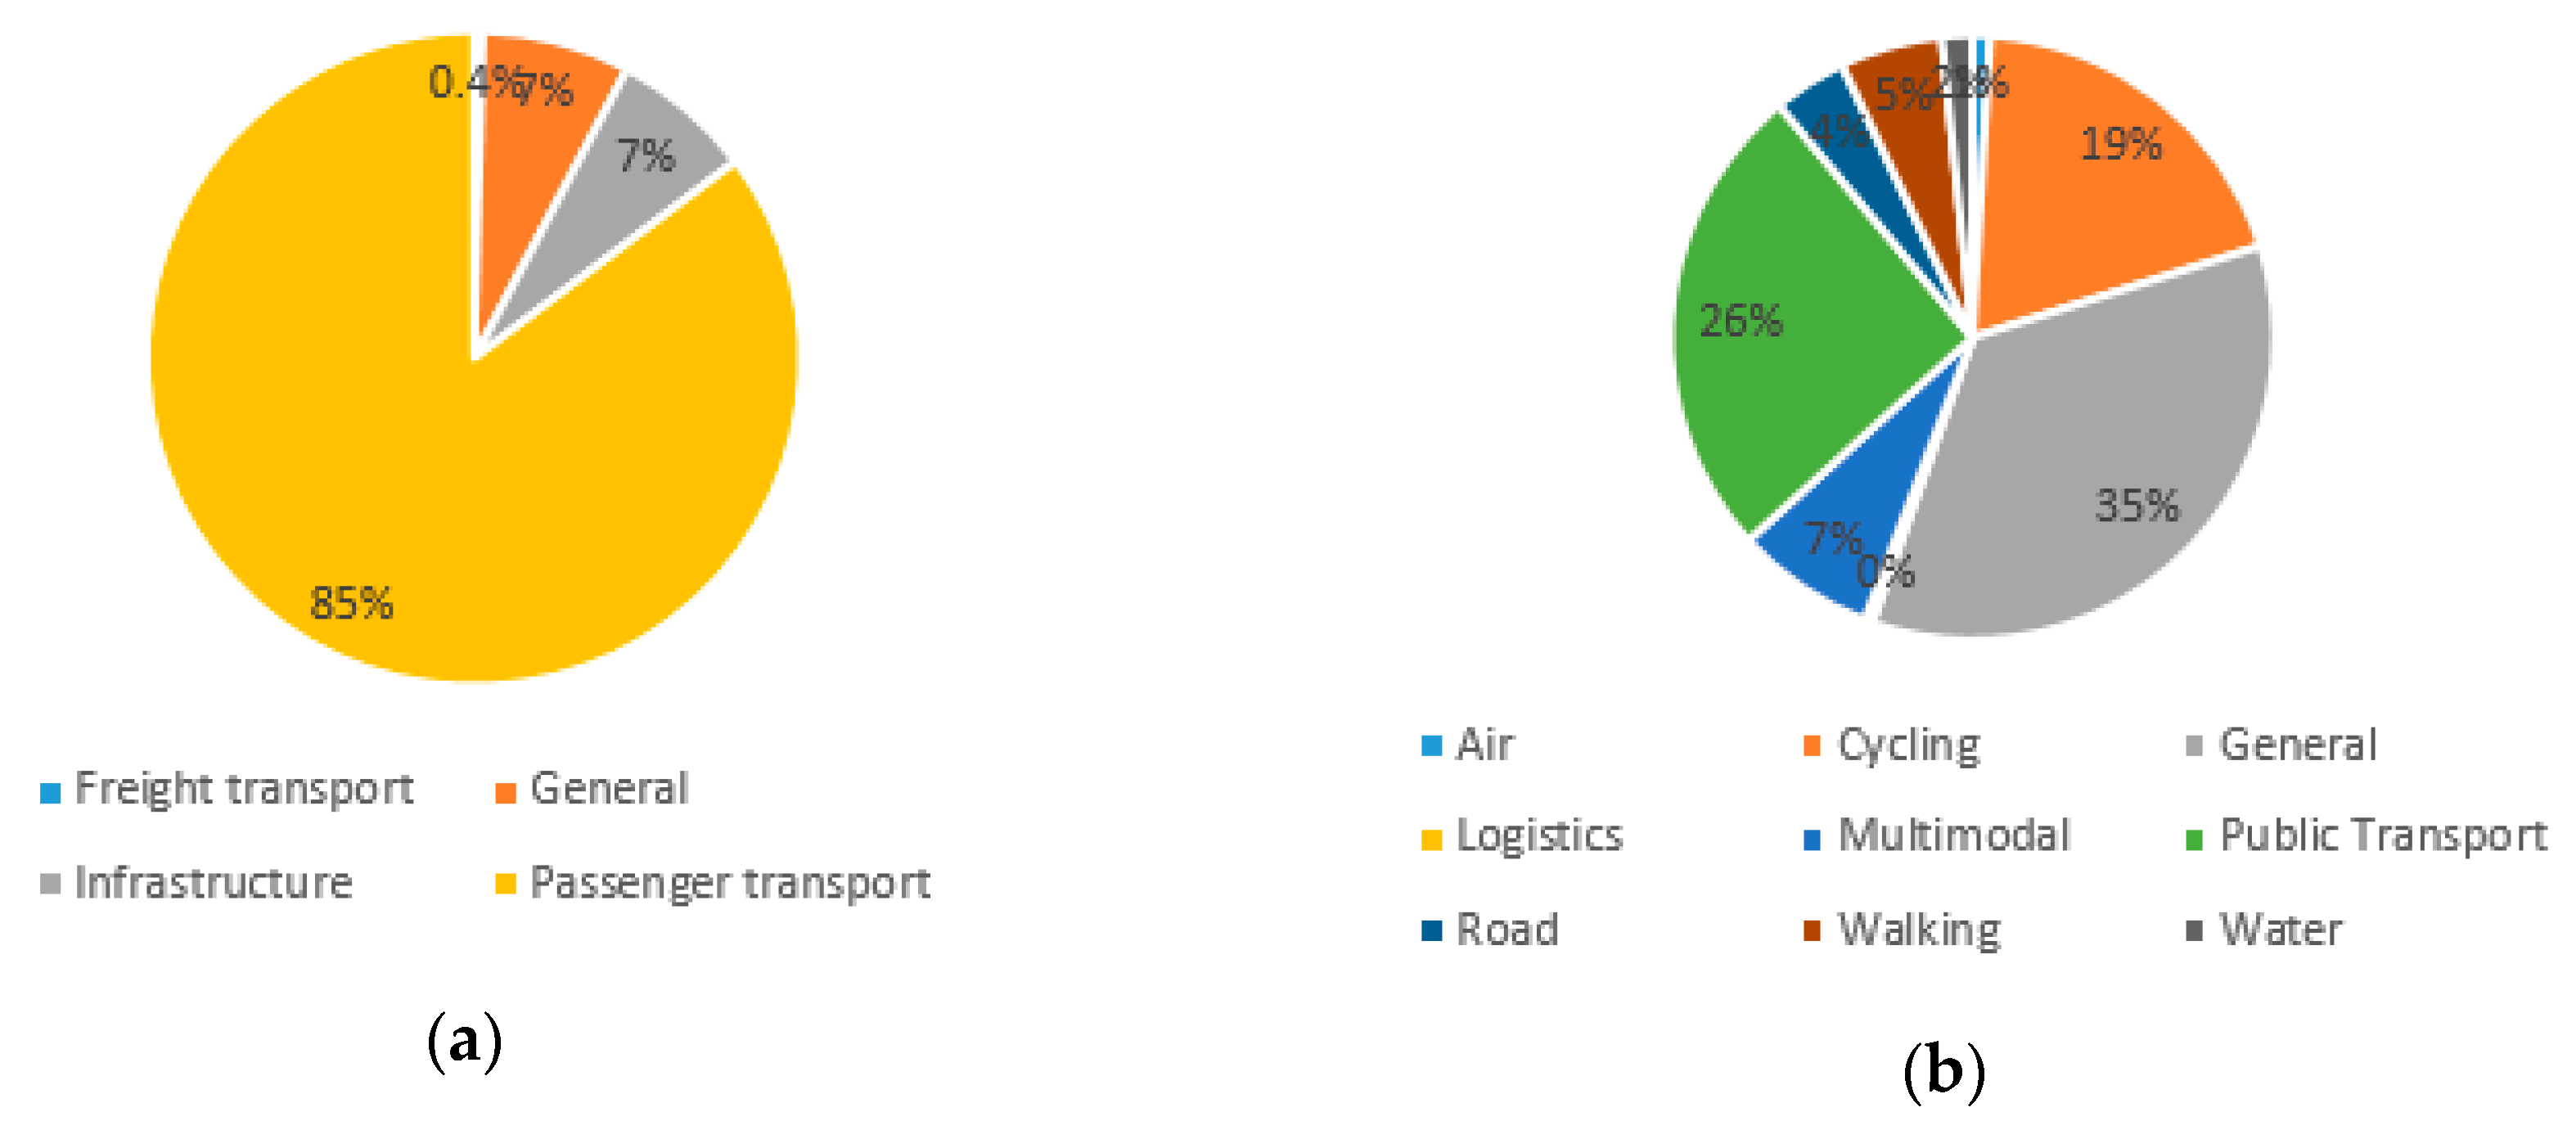
2.3.2. Main Topics and Transport Mode Analysis

The work subjects of the review are classified according to the topic dealt with in four major categories according to the studies topic (Figure 3a): Passenger, Freight, Infrastructure and General: 78% of the articles analyzed are studies relating to passenger transport, 9% to infrastructure, 12% to general issues, while only 1% relates to freight transport. In terms of transport mode (Figure 3b), one third of the studies can be classified in the general category, followed by cycling (18%), multimodal transport (16%), public transport (14%), walking (9%), while the remaining categories get percentages below 5% (Air 2%, Logistics 1%, Water 4%, Road 3%).
This opens good opportunities for unexplored sectors like freight transport, which relevance and impacts are important but, sometimes, underestimated [47]. In this respect, crowdsourcing coupled with GIS data could provide good opportunity to improve the efficiency of logistics, especially in a city context, where citizens can be directly involved in the freight delivery process, i.e., via “crowdshipping” [48]. This implies deliveries via the crowd, i.e., by considering that any trip people perform to satisfy personal objectives can become a vector for shipping freight using the usually available spare load capacity [49].

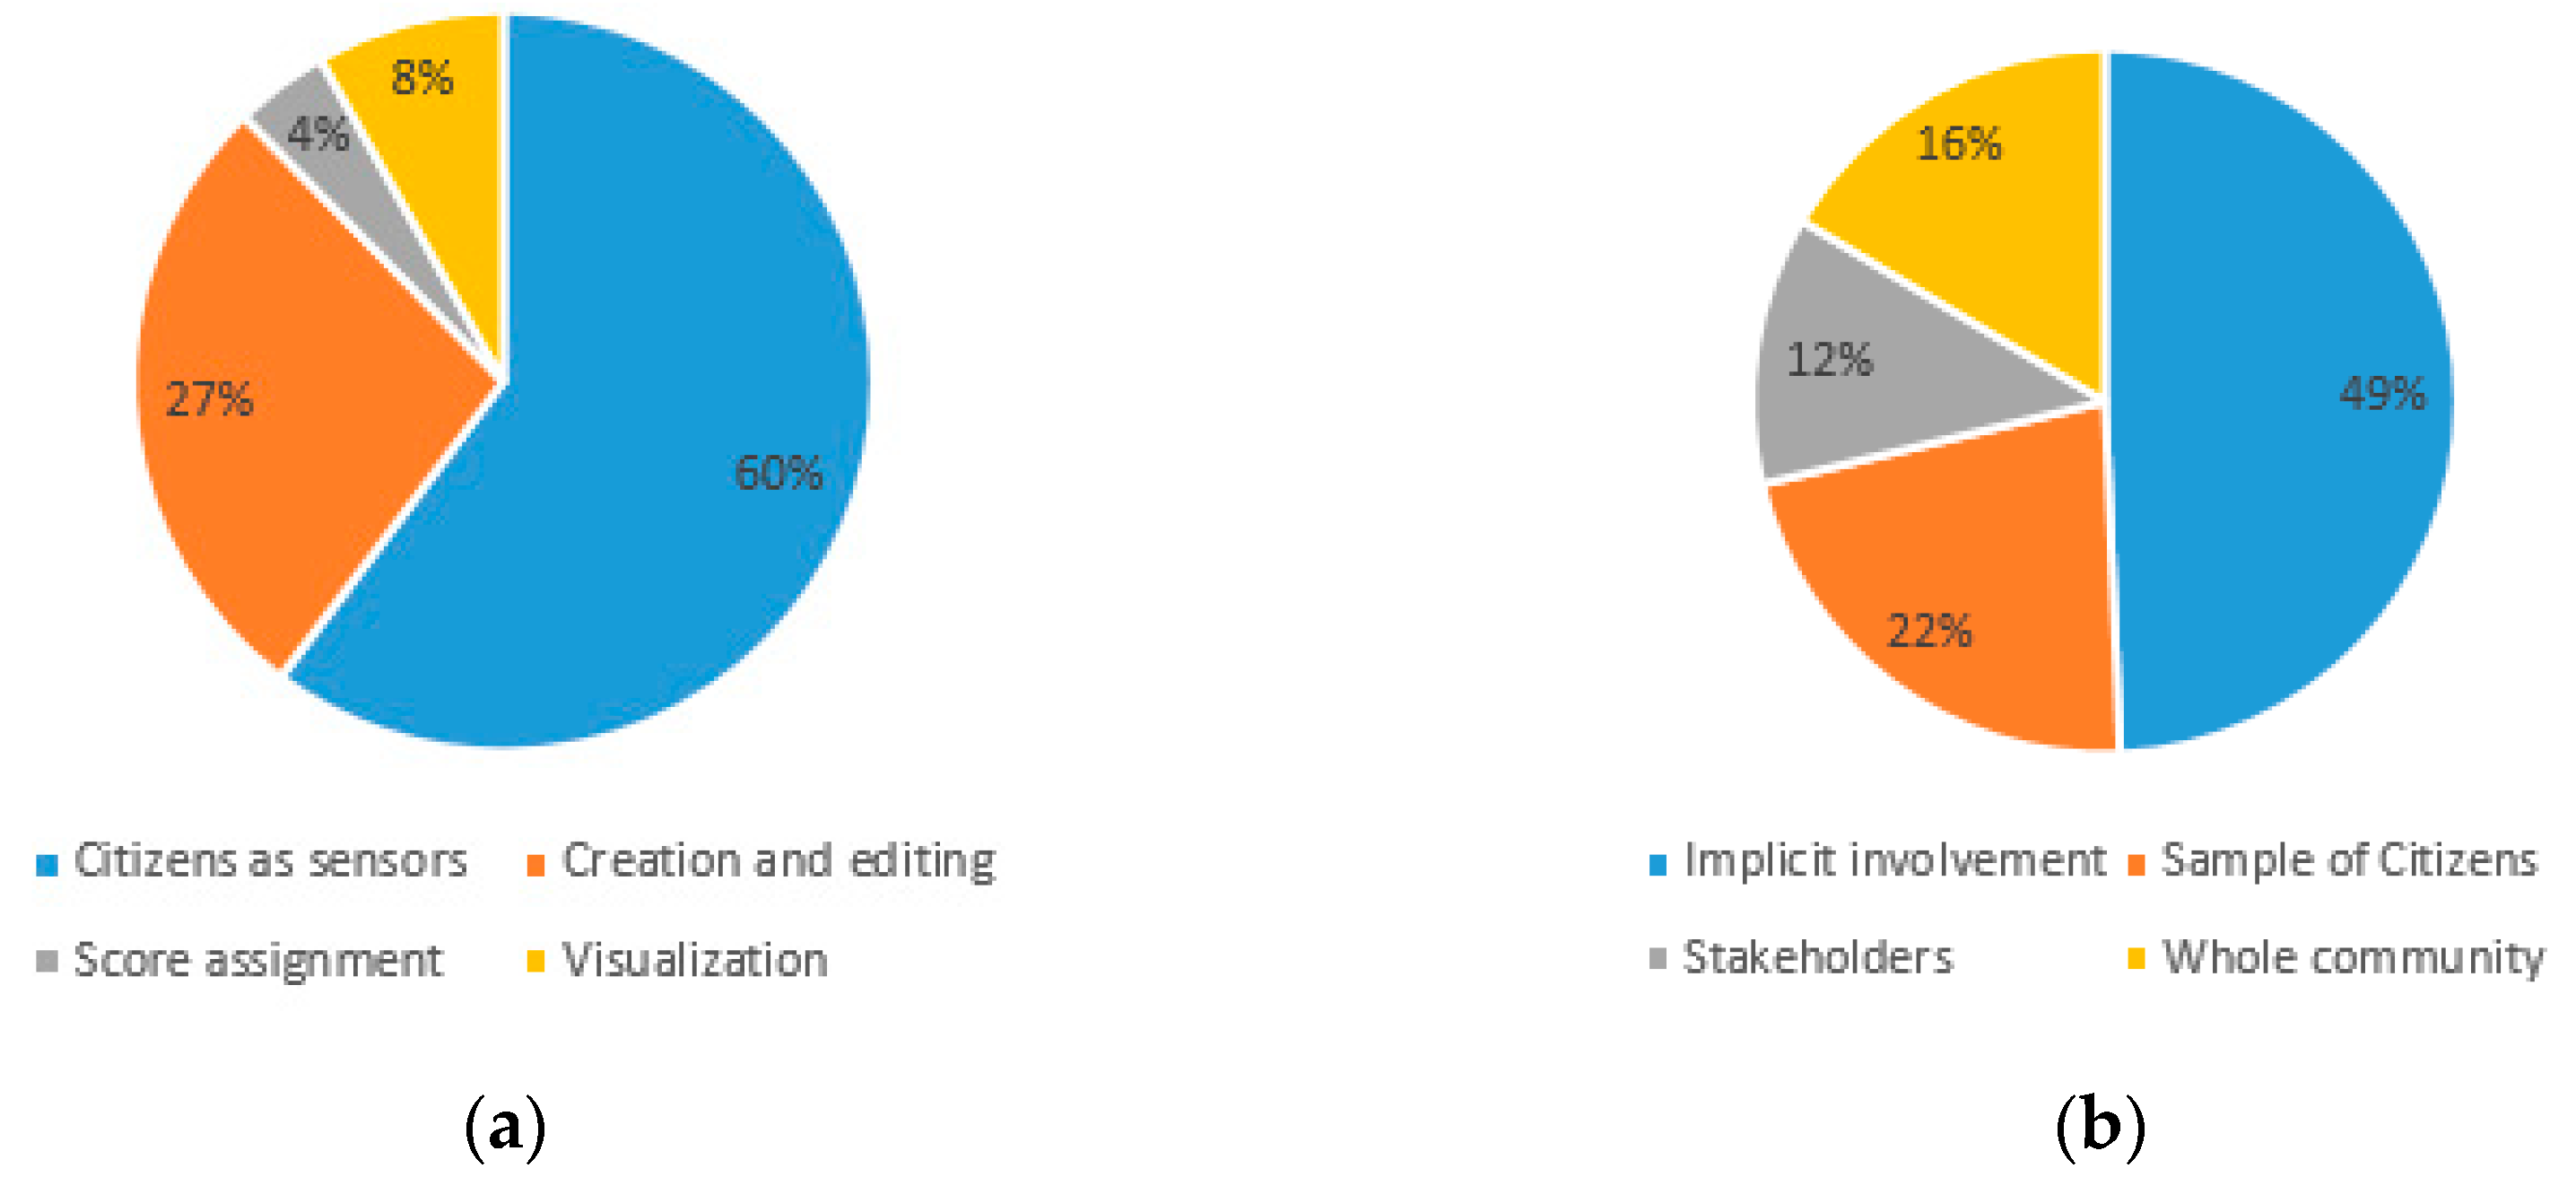
2.3.3. Use of GIS and Type of Involvement

The studies analyzed revealed different levels of use by users, in terms of direct or indirect involvement in the creation of geographical data (Figure 4a).
More than the half of the articles (54%) include the participation of “citizens as sensors”: before the beginning of the study, participants gave their consent to the digital tracking of their position, speed, direction of travel and time information through the GPS and Accelerometer of a mobile device. Alternatively, they provided post-trip geographical information through an application not necessarily associated with the study. This type of data are those typically deriving from the registration of users to platforms such as Twitter [50], Foursquare [51,52], Strava and Strava Metro [39,53,54,55,56] or Waze, and generically to other applications that, through geolocation, process traffic data and information on transport systems, such as Openstreetmap [32,57,58,59,60]. A third of the analyzed papers foresees the active participation of users in the use of GIS through the creation and modification of spatial data: in these cases, a WebGIS application, generally created for the purposes of the study, is used by participants to draw paths, areas and points of interest [61,62].
Finally, in some studies, an easy use of GIS emerges: PPGIS has been used by participants to assign satisfaction scores to locations or to predefined types of locations (6%) [63,64,65], or it has been simply used as a visualization tool that allows an interaction by users mostly related to data display (8%) (see Figure 5 for an example) [27,28,66,67].
For what concerns the users involved in the study (defined as Type of Involvement, Figure 4b), 44% of the studies foresees “implicit” involvement, i.e., participants gave the consent for the use of their data in a phase prior to the study, but they are not informed about the aim of the study and about progress and results. This high percentage is related to the widespread use of data and VGI from the previously mentioned applications and platforms. 21% of studies involved a sample of citizens, either as representative of an entire community or to test the instrument before a wider dissemination; finally, 17% of the paper involved stakeholders as actors in a decision-making process and, with the same percentage, there are studies involving entire communities in the participation process. The high percentage of studies with an “implicit” involvement shows that the potential of PPGIS as a tool for public participation in transport decision-making processes has not been fully explored so far.

2.3.4. Stage of the Transport Decision-Making Process

A classification for stages of decision-making in transport planning has been performed, based on three main elements, i.e.,: (1) individuation of impacts, (2) identification of indicators and (3) comparison of alternatives [68]. These stages in turn refer to six macro-activities [69], i.e.,: Identification of objectives, constraints and project types; Present situation analysis; Alternative system project formulation; Project analysis and technical assessment; Comparison of alternative solution (evaluation); Choice and implementation. Additionally, an “Other” category has been added for studies not strictly fitting in one of the aforementioned categories.
More than the half of the studies (55%) deal with the identification of project types and the present situation analysis, due to the spatial GIS component providing an essential aid in definition of physical constraints. Research focused on: the building of comprehensive urban networks through VGI data [32,51]; road and traffic condition analysis through crowdsourcing [70,71,72,73]; analysis of vehicle behavior [74] and investigation of travel patterns [52,75,76,77], with an extensive use of SoftGIS, an internet-based approach which relies on collecting, analyzing and delivering soft knowledge produced by the residents and other local actors in a certain area through interactive maps [29,41,78,79,80,81]; urban connectivity assessment [82] and general analysis of urban public transport and sustainable mobility aspects through smartphones [37,83,84,85,86,87,88]. Crowdsourcing techniques have been extensively used in studies related to non-motorized mobility, such as cyclist spatial patterns identification [39,53,54,56,58,71], their socio-economic analysis [89] and environmental related problems [55,90] or the identification of peculiar elements of the pedestrian network to improve the walking experience of vulnerable people [29,55,57]. PPGIS has also been used in the maritime field for the analysis of conflicts, social values and preferences in marine environments [63,64,65]; finally, it has been applied in airport contexts for the study of noise contours [91] and modeling flight trajectories with publicly available flight data [92].
Several studies (23%) have also focused on the use of PPGIS in the field of project analysis and technical assessment, with the evaluation of quality and efficiency of public transport services [67,93,94,95]; validation of evacuation systems in the event of an emergency [50,59]; design and evaluation of paths for non-motorized mobility [33,40,55,84,87,96].
Comparison of alternative solutions has been carried out by the 10% of the scholars, e.g., to evaluate accessibility patterns [97], site suitability [27,28] and, in general, for transport system alternatives [66].
Finally, some scholars have dealt with broader issues (12%), e.g., focusing on computer programming related to VGI in the field of transport [98], the interaction with agent-based modeling [99,100], a proposal for an user-based solution of the imbalance problem in bike sharing systems [101] and, more in general, analysis of the potentials and challenges of the use of PPGIS and VGI in the field of transport [30,35,96,102,103,104,105].

2.3.5. Conclusions

Our analysis showed how PPGIS and VGI have been increasingly used in the last years in different phases of transport decision-making processes related to different issues. This means that they can be considered a valid aid for transport decision-makers. However, one can notice that there are some elements that need to be addressed, i.e.,: (i) participation is generally implicit (i.e., participants are not directly involved in the decision-making process), (ii) there are still unexplored fields of applications (e.g., freight), and (iii) these tools are typically used in the first phases of transport decision-making (i.e., identification of project types and present situation analysis). This means that we are still far being able to use them as comprehensive planning support tools.
Under this context, it is important to understand how to use them in all the phases of participatory planning, also by coupling them with evaluation methods that allow including—in a transparent way—alternative impacts and criteria importance, while taking into account stakeholders’ needs and preferences. This is important to bridge the gap between technical analysis (fairly understandable by non-experts) and stakeholder-driven evaluations towards well-thought-out decisions in transport planning.
This paves the way for the proposal of an evaluation framework to support the decision-making process, able to allow public participation in the assessment of transport scenarios, while at the same time ensuring technical quality of the final decision. The framework should include evaluation methods able to analyze monetary and non-monetary parameters as well as usually non-comparable criteria in a way that is easily understandable for all decision-makers, such as MCDA techniques.

3. Three “Ingredients” for Performance and Consensus Based Decisions: A Framework for Transport Decision-Making

In recent years, MCDA has been widely used in the evaluation of territorial policies, due to the complexity of the issues and the inadequacy of traditional methods to capture all the possible impacts, such as in the case of cost–benefit analysis [106]. It has also been extended to group decisions (group MCDA—GMCDA), including the viewpoint of multiple stakeholders, allowing them to participate in the evaluation of alternatives and criteria [6,66,107,108].
The integration between GIS and MCDA can be thought of as a process that transforms and combines geographical data and value judgments to obtain information for decision-making [109]. A spatial multicriteria analysis, through a GIS-based MCDA, therefore provides, for the evaluation of the project alternatives, both value judgments and spatial data [110].
The integration of MCDA methods in a Participatory WebGIS provides an interactive tool that allows users to explore digital maps, deepen their awareness of the problem at stake and voice different opinions on spatial decision problems. Thanks to an integrated system, such as a PPGIS, individuals who are uncomfortable to express their opinion and preferences in public can do so in an independent environment; consequently, a wider and more complete representation can be reached, overcoming the limits of face-to-face meetings. Moreover, PPGIS-MCDA systems have the potential to stimulate a “bottom-up” approach to the spatial decision-making process by providing public access to data and models.
Based on these premises, three main tools can be deducted as “ingredients” of the “receipt” to try to avoid the failure of transport policies, projects and plans [111], i.e.,: (1) Public Participation, (2) GIS, and (3) MCDA which, if fully integrated, have the potential to foster a good social acceptability and robustness of decisions. This can be represented by a triangle of integration of GIS, Public Participation and MCDA in the transport decision-making process (Figure 6). The highest the level of integration of the three components, the more the decision-making process would take advantage of a tool supporting the evaluation of the alternatives for both technical performances and degree of consensus.
Besides, considering the three abovementioned stages of transport decision-making—(1) individuation of impacts, (2) identification of indicators and (3) comparison of alternatives, based on our literature analysis, it is possible to evaluate the contribution of each of the three factors—GIS, MCDA, Public Participation—and of their integration in each phase of the process (Figure 7).
Step 1. Individuation of impacts. In the first step, effects and impacts that are relevant for the decision-makers in relation to the objectives of the intervention are identified. A transport project/plan can have multiple objectives (social, economic, environmental), and it is not easy to address all of them. As an example, limiting car traffic in an urban context can reduce congestion and improve air quality, but it could increase social exclusion and barrier effects if access to the zone is not guaranteed by other modes of transport (e.g., public transport). Public participation in this phase could be useful to define objectives, by identifying the stakeholders that can be affected by the decisions to be made and that can give a contribution. A GIS analysis of the study area can play the role of defining spatial constraints and inhibiting spatially unfeasible alternatives; a PPGIS could allow the inclusion of VGI data from citizens that, in their various forms, such as photos, videos, audios, or textual statements, can constitute a basis to build the state of the art. Besides, in-depth interviews with “key informants” can be useful to enrich the information obtained via VGI and define the decision-making structure [112].
Finally, according to the results obtained, the most appropriate MCDA techniques to assess the alternatives are chosen [113]. As an example, if the goal of the decision-making process is to establish a priority of investments, a widely used method like Analytic Hierarchy Process (AHP) can be used, since it allows us to obtain a ranking of alternatives based on pairwise comparisons of couples of elements of the decision-making problem (e.g., objectives, criteria, alternatives) [1]. Other methods allow finding the “best” solution by measuring the distance from the ideal and the worst ones (e.g., TOPSIS) [113].
Step 2. Identification of indicators. Indicators are needed to assess the impact of each alternative and provide an overall evaluation from a multi-stakeholder multi-criteria point of view. Both spatial (e.g., km of a linear infrastructure as a measure of the barrier effect) and non-spatial (e.g., management cost of a transport service) indicators can be defined and needed to assess the alternatives. GIS can allow an easy visualization of the spatial effects of alternatives. Besides, if combined with MCDA, they can be used to visualize how the weights associated to each objective (and indicator) modify the final assessment results. Under this respect, they could be easily understood also by non-experts, and become useful when different stakeholders are involved in the weight assignment process via Group MCDA techniques. The phase of identification and evaluation of indicators is particularly important and must be conducted by appropriately combining stakeholder (subjective) views with objective measurements and technical estimations. Stakeholder evaluations are performed via MCDA, allowing weights to be assigned to each indicator (and related objective) according to the relevance it has for each stakeholder. Weight assignment can also be extended to the general public, e.g., via an online questionnaire, allowing a more inclusive process. However, global results should be carefully managed due to the heterogeneity of opinions of a potentially large number of participants.
Step 3. Comparison of alternatives. When comparing alternatives, through PPGIS it will be possible for stakeholders to be informed on the spatial impacts of the different scenarios. Stakeholder preferences can be mathematically aggregated if they are similar or, alternatively, a consensus vote can be proposed. The latter option is generally preferred [66]. In fact, it can pave the way for discussion among stakeholders aimed at finding a consensus on a shared decision. It is noteworthy that the use of VGI and PPGIS to collect stakeholder preferences can give raise to contradictory opinions. Understanding how to tackle these opinions would be challenging. In this respect, the evaluations performed via GIS-based group MCDA techniques can represent the starting point of a consensus building process, fostering interaction via face-to-face meetings, or digitally, via web-based platforms, or anonymously, as done with the Delphi method. It is a practice for the convergence of opinions, based on: an “iterative structure”, meaning that stakeholders are called to express their opinions in more rounds; “anonymity”, since they can only communicate with a facilitator, in order to avoid bias due to leadership and reciprocal influence; “asynchronous communication”, with the possibility for them to interact remotely and in different times. In this case, a combination of the Delphi method with MCDA techniques should be applied to support consensus building among stakeholders [107].
The final decision in charge of the decision-maker(s) should be based both on the results of participation (i.e., consensus based ranking), and of technical and spatial analysis, allowing us to assess the feasibility and impacts of the proposed solution (“performance based ranking”).

4. Conclusions and Future Research

This paper focused on the increasing use of PPGIS and VGI in transport decision-making and their potential developments as participatory spatial tools to support the overall transport planning process.
A structured literature review was performed to critically analyze the state of the art practices. 73 studies were considered valid for the analysis and it was found that continuous scientific production on this issue in the transport sector is quite recent and can be placed in the last ten years. Most of the studies have passenger transport as their field of application and in particular mobility in urban areas. The development of technologies and their widespread implementation on smartphones has led to a wide use of data coming from VGI provided by the members of the communities and their consequent implicit participation in the analysis of the current situation and the creation of project constraints. At the same time, studies dealing with active participation of communities in decision-making processes through PPGIS shows that it can be considered as a good tool to support public participation in transport planning. However, PPGIS and VGI are still not included in the overall participatory transport planning process. In general, participation is implicit (i.e., participants are not directly involved in the decision-making process), there are unexplored fields of applications (e.g., freight), and these tools are typically used in the first phases of transport decision-making (i.e., identification of project types and present situation analysis). This means that we are still far from their use as comprehensive planning support tools, while acknowledging their potential to bridge the gap between technical analysis (fairly understandable by non-experts) and stakeholder-driven evaluations.
Based on the review’s results and analysis, a framework of integration of GIS, MCDA and Public Participation into a scenario evaluation procedure has been presented. This could allow public participation in the assessment of transport design scenarios while at the same time ensuring technical quality of the final decision.
Future studies could address questions and gaps that come out from this research.
A first one is the identification of participants to the decision-making process: depending on the decision, the choice of the stakeholders to be involved must be taken, being aware that wide public involvement can increase the threats to spatial data quality in the case of VGI. The variety of their origins and the different forms in which they can be presented may indeed affect their reliability and appropriateness and influence the decision-making process: so it is important to verify their quality through appropriate indicators for geographic information data, such as positional, thematic and temporal accuracy, completeness, logical consistency and usability [114].
When dealing with multiple heterogeneous actors, Social Network Analysis techniques could allow us to quantify the social importance of the different individuals in the stakeholders’ network [6].
Besides depending on the actors involved in the decision-making process, other techniques can be introduced to support the procedure. As an example, stated preference surveys enhanced by GIS by providing respondents with maps and other spatial and non-spatial information in graphical form may be used to increase respondents’ understanding of decision scenarios.
A further and important development of the research is the modeling of the proposed framework within a unique tool that is able to integrate all the provided procedures.
Finally, findings of this study pave the way for future research in supporting transport decision-making processes taking advantages of new technologies; in this respect, this research can be considered as a first step of a procedure that could support a more diffuse involvement of stakeholders in order to foster consensus and robustness of decisions.

Author Contributions

Conceptualization, Nadia Giuffrida; Funding acquisition, Giuseppe Inturri and Matteo Ignaccolo; Investigation, Nadia Giuffrida and Michela Le Pira; Methodology, Nadia Giuffrida; Supervision, Giuseppe Inturri and Matteo Ignaccolo; Writing—original draft, Nadia Giuffrida and Michela Le Pira; Writing—review & editing, Nadia Giuffrida, Michela Le Pira, Giuseppe Inturri and Matteo Ignaccolo.

Funding

This work has been partially financed by the University of Catania within the project “Piano della Ricerca Dipartimentale 2016–2018” of the Department of Civil Engineering and Architecture and the project “Piano per la Ricerca 2016–2018—Linea di intervento 2” of the Department of Electric, Electronic and Computer Engineering.

Conflicts of Interest

The authors declare no conflict of interest.

References

  1. EC—European Commission. Roadmap to a Single European Transport Area-Towards a Competitive and Resource Efficient Transport System. White Paper, Communication; EC: Brussels, Belgium, 2011; p. 144. [Google Scholar]
  2. Caprì, S.; Ignaccolo, M.; Inturri, G.; Le Pira, M. Green walking networks for climate change adaptation. Transp. Res. Part D 2016, 45, 84–95. [Google Scholar] [CrossRef]
  3. Le Pira, M. Towards Participatory Decision-Making Processes in Transport Planning: An Agent-Based Approach. Ph.D. Thesis, University of Catania, Catania, Italy, 2015. Available online: http://dspace.unict.it/handle/10761/3934 (accessed on 23 April 2019).
  4. Greco, S.; Figueira, J.; Ehrgott, M. Multiple Criteria Decision Analysis; Springer: New York, NY, USA, 2016. [Google Scholar]
  5. Hoksing, J.; Mudu, P.; Dora, C. Health Co-Benefits of Climate Change Mitigation—Transport Sector; World Health Organization: Geneva, Switzerland, 2011; ISBN 978 92 4 150291 7. [Google Scholar]
  6. Le Pira, M.; Inturri, G.; Ignaccolo, M.; Pluchino, A. Dealing with the complexity of stakeholder interaction in participatory transport planning. In Advanced Concepts, Methodologies and Technologies for Transportation and Logistics; (AISC, volume 572); Zak, J., Hadas, Y., Rossi, R., Eds.; Springer International Publishing: Chanm, Switzerland, 2018; pp. 54–72. [Google Scholar] [CrossRef]
  7. Le Pira, M. Transport planning with stakeholders: An agent-based modelling approach. Int. J. Transp. Econ. 2018, 45, 15–32. [Google Scholar]
  8. Sieber, R. Public participation geographic information systems: A literature review and framework. Ann. Assoc. Am. Geogr. 2006, 96, 491–507. [Google Scholar] [CrossRef]
  9. Obermeyer, N.J. The evolution of public participation in GIS. Cartogr. Geogr. Inf. Sci. 1998, 25, 65–66. [Google Scholar] [CrossRef]
  10. Schroeder, P. Criteria for the Design of a GIS/2. Specialists’ meeting for NCGIA Initiative 19: GIS and society, Summer 1996. Available online: http://www.spatial.maine.edu/~schroedr/ppgis/criteria.html (accessed on 29 January 2006).
  11. Kingston, R.; Smith, R.S. Who Are the Public and What Are They Participating in? World Universities Public Participation GIS Seminar Series. Available online: http://www.ppgis.manchester.ac.uk/downloads/WUN_GISc_PPGIS_Seminar.pdf (accessed on 23 April 2019).
  12. Plewe, B. GIS Online: Information Retrieval, Mapping, and the Internet; OnWord Press: Santa Fe, NM, USA, 1997. [Google Scholar]
  13. Green, D.; Bossomaier, T. Online GIS and Spatial Metadata; Taylor & Francis: London, UK, 2002. [Google Scholar]
  14. Peng, Z.R.; Tsou, M.H. Internet GIS: Distributed Geographic Information Services for the Internet and Wireless Networks; John Wiley & Sons: Hoboken, NJ, USA, 2003; p. 720. [Google Scholar]
  15. Peng, Z.R.; Zhang, C. The roles of geography markup language, scalable vector graphics, and web feature service specifications in the development of internet geographic information systems. J. Geogr. Syst. 2003, 6, 95–116. [Google Scholar] [CrossRef]
  16. Carver, S. Developing Web-based GIS/MCE: Improving access to data and spatial decision support tools. In Spatial Multicriteria Decision-Making and Analysis; Thill, J.C., Ed.; Ashgate: Aldershot, UK, 1999; pp. 49–75. [Google Scholar]
  17. Carver, S.; Peekham, R. Using GIS on the Internet for planning. In Geographical Information and Planning; Stillwell, J., Geertman, S., Openshaw, S., Eds.; Springer: Berlin, Germany, 1999; pp. 371–390. [Google Scholar]
  18. Dragićević, S. The potential of web-based GIS. J. Geogr. Syst. 2004, 6, 79–81. [Google Scholar] [CrossRef]
  19. Dragićević, S.; Balram, S. A web GIS collaborative framework to structure and manage distributed planning processes. J. Geogr. Syst. 2004, 6, 133–153. [Google Scholar] [CrossRef]
  20. Miller, C.C. A beast in the field: The Google Maps mashup as GIS/2. Cartographica 2006, 41, 187–199. [Google Scholar] [CrossRef]
  21. Biazzo, I.; Monechi, B.; Loreto, V. Universal scores for accessibility and inequalities in urban areas. arXiv 2018, arXiv:1810.03017. [Google Scholar]
  22. Cascetta, E.; Pagliara, F. Public engagement for planning and designing transportation systems. Pro. Soc. Behav. Sci. 2013, 87, 103–116. [Google Scholar] [CrossRef]
  23. Le Pira, M.; Ignaccolo, M.; Inturri, G.; Pluchino, A.; Rapisarda, A. Modelling stakeholder participation in transport planning. Case Stud. Transp. Policy 2016, 4, 230–238. [Google Scholar] [CrossRef]
  24. Goodchild, M.F. Citizens as sensors: the world of volunteered geography. GeoJournal 2007, 69, 211–221. [Google Scholar] [CrossRef]
  25. Verplanke, J.; McCall, M.K.; Uberhuaga, C.; Rambaldi, G.; Haklay, M. A shared perspective for PGIS and VGI. Cartogr. J. 2016, 53, 308–317. [Google Scholar] [CrossRef]
  26. Institute for Local Government. A Local Official’s Guide to Online Public Engagement. Available online: https://www.ca-ilg.org/sites/main/files/file-attachments/a_local_officials_guide_to_online_public_engagement_0.pdf (accessed on 23 April 2019).
  27. Nyerges, T.L.; Montejano, R.; Oshiro, C.; Dadswell, M. Group-based geographic information systems for transportation improvement site selection. Transp. Res. Part C Emerg. Technol. 1997, 5, 349–369. [Google Scholar] [CrossRef]
  28. Case, C.; Hawthorne, T.L. Served or unserved? A site suitability analysis of social services in Atlanta, Georgia using geographic Information systems. Appl. Geogr. 2013, 38, 96–106. [Google Scholar] [CrossRef]
  29. Laatikainen, T.; Tenkanen, H.; Kyttä, M.; Toivonen, T. Comparing conventional and PPGIS approaches in measuring equality of access to urban aquatic environments. Landsc. Urban Plan. 2015, 144, 22–33. [Google Scholar] [CrossRef]
  30. Stewart, A.F. Mapping transit accessibility: Possibilities for public participation. Transp. Res. Part A Policy Pract. 2017, 104, 150–166. [Google Scholar] [CrossRef]
  31. Oloo, F. Mapping rural road networks from Global Positioning System (GPS) trajectories of motorcycle taxis in Sigomre area, Siaya County, Kenya. ISPRS Int. J. Geoinf. 2018, 7, 309. [Google Scholar] [CrossRef]
  32. Gil, J. Building a multimodal urban network model using openstreetmap data for the analysis of sustainable accessibility. In OpenStreetMap in GIScience; Springer: Cham, Switzerland, 2015; pp. 229–251. [Google Scholar]
  33. May, A.; Parker, C.J.; Taylor, N.; Ross, T. Evaluating a concept design of a crowd-sourced ‘mashup’ providing ease-of-access information for people with limited mobility. Transp. Res. Part C Emerg. Technol. 2014, 49, 103–113. [Google Scholar] [CrossRef]
  34. Piao, B.; Aihara, K.; Kinoshita, A.; Takasu, A.; Adachi, J. Estimating road surface condition using crowdsourcing. In Information Search, Integration, and Personlization; Kotzinos, D., Laurent, D., Petit, J.M., Spyratos, N., Tanaka, Y., Eds.; Springer: Cham, Switzerland, 2017; pp. 66–81. [Google Scholar]
  35. Semanjski, I.; Gautama, S. Crowdsourcing mobility insights—Reflection of attitude based segments on high resolution mobility behaviour data. Transp. Res. Part C Emerg. Technol. 2016, 71, 434–446. [Google Scholar] [CrossRef]
  36. Shin, D.; Aliaga, D.; Tunçer, B.; Arisona, S.M.; Kim, S.; Zünd, D.; Schmitt, G. Urban sensing: Using smartphones for transportation mode classification. Comput. Environ. Urban Syst. 2015, 53, 76–86. [Google Scholar] [CrossRef]
  37. Gu, W.; Jin, M.; Zhou, Z.; Spanos, C.J.; Zhang, L. Metroeye: Smart tracking your metro trips underground. In Proceedings of the 13th International Conference on Mobile and Ubiquitous Systems: Computing, Networking and Services (ACM, 2016), Hiroshima, Japan, 28 November–1 December 2016; pp. 84–93. [Google Scholar]
  38. Park, S.; Bang, Y.; Yu, K. Techniques for updating pedestrian network data including facilities and obstructions information for transportation of vulnerable people. Sensors 2015, 15, 24466–24486. [Google Scholar] [CrossRef] [PubMed]
  39. Griffin, G.P.; Jiao, J. Where does bicycling for health happen? Analysing volunteered geographic information through place and plexus. J. Transp. Health 2015, 2, 238–247. [Google Scholar] [CrossRef]
  40. Laatikainen, T.E.; Haybatollahi, M.; Kyttä, M. Environmental, individual and personal goal influences on older adults’ walking in the helsinki metropolitan area. Int. J. Environ. Res. Public Health 2019, 16, 58. [Google Scholar] [CrossRef] [PubMed]
  41. Kajosaari, A.; Hasanzadeh, K.; Kyttä, M. Residential dissonance and walking for transport. J. Transp. Geogr. 2019, 74, 134–144. [Google Scholar] [CrossRef]
  42. Giuffrida, N.; Ignaccolo, M.; Inturri, G.; Rofè, Y.; Calabrò, G. Investigating the correlation between transportation social need and accessibility: The case of Catania. Transp. Res. Proc. 2017, 27, 816–823. [Google Scholar] [CrossRef]
  43. Giuffrida, N.; Inturri, G.; Caprì, S.; Spica, S.; Ignaccolo, M. The impact of a bus rapid transit line on spatial accessibility and transport equity: The case of Catania. Transport Infrastructure and Systems. In Proceedings of the AIIT International Congress on Transport Infrastructure and Systems, TIS 2017, Rome, Italy, 10–12 April 2017; pp. 753–758. [Google Scholar]
  44. Ignaccolo, M.; Inturri, G.; Giuffrida, N.; Torrisi, V. Public transport accessibility and social exclusion: Making the connections. In Proceedings of the International Conference on Traffic and Transport Engineering (ICTTE), Belgrade, Serbia, 24–25 November 2016. [Google Scholar]
  45. Inturri, G.; Ignaccolo, M.; Le Pira, M.; Caprì, S.; Giuffrida, N. Influence of accessibility, land use and transport policies on the transport energy dependence of a city. Transp. Res. Proc. 2017, 25, 3273–3285. [Google Scholar] [CrossRef]
  46. Mirri, S.; Prandi, C.; Salomoni, P.; Callegati, F.; Campi, A. On combining crowdsourcing, sensing and open data for an accessible smart city. In Proceedings of the 8th International Conference on Next Generation Mobile Apps, Services and Technologies, NGMAST 2014, Oxford, UK, 10–12 September 2014; pp. 294–299. [Google Scholar]
  47. Gatta, V.; Marcucci, E.; Le Pira, M. Smart urban freight planning process: Integrating desk, living lab and modelling approaches in decision-making. Eur. Transp. Res. Rev. 2017, 9, 32. [Google Scholar] [CrossRef]
  48. Marcucci, E.; Le Pira, M.; Carrocci, C.S.; Gatta, V.; Pieralice, E. Connected shared mobility for passengers and freight: Investigating the potential of crowdshipping in urban areas. In Proceedings of the 5th IEEE International Conference on Models and Technologies for Intelligent Transportation Systems, MT-ITS 2017, Naples, Italy, 26–28 June 2017; pp. 839–843. [Google Scholar]
  49. Gatta, V.; Marcucci, E.; Nigro, M.; Patella, S.; Serafini, S. Public transport-based crowdshipping for sustainable city logistics: Assessing economic and environmental impacts. Sustainability 2019, 11, 145. [Google Scholar] [CrossRef]
  50. Kusumo, A.N.L.; Reckien, D.; Verplanke, J. Utilising volunteered geographic information to assess resident’s flood evacuation shelters. Case study: Jakarta. Appl. Geogr. 2017, 88, 174–185. [Google Scholar] [CrossRef]
  51. Yang, B.; Zhang, Y.; Lu, F. Geometric-based approach for integrating VGI POIs and road networks. Int. J. Geogr. Inf. Sci. 2014, 28, 126–147. [Google Scholar] [CrossRef]
  52. Sun, Y.; Li, M. Investigation of travel and activity patterns using location-based social network data: A case study of active mobile social media users. ISPRS Int. J. Geoinf. 2015, 4, 1512–1529. [Google Scholar] [CrossRef]
  53. Sun, Y.; Mobasheri, A. Utilizing crowdsourced data for studies of cycling and air pollution exposure: A case study using strava data. Int. J. Environ. Res. Public Health 2017, 14, 274. [Google Scholar] [CrossRef]
  54. McArthur, D.P.; Hong, J. Visualising where commuting cyclists travel using crowdsourced data. J. Transp. Geogr. 2019, 74, 233–241. [Google Scholar] [CrossRef]
  55. Sun, Y.; Moshfeghi, Y.; Liu, Z. Exploiting crowdsourced geographic information and GIS for assessment of air pollution exposure during active travel. J. Transp. Health 2017, 6, 93–104. [Google Scholar] [CrossRef]
  56. Jestico, B.; Nelson, T.; Winters, M. Mapping ridership using crowdsourced cycling data. J. Transp. Geogr. 2016, 52, 90–97. [Google Scholar] [CrossRef]
  57. Szell, M. Crowdsourced quantification and visualization of urban mobility space inequality. Urban Plan. 2018, 3, 1–20. [Google Scholar] [CrossRef]
  58. Sultan, J.; Ben-Haim, G.; Haunert, J.H.; Dalyot, S. Extracting spatial patterns in bicycle routes from crowdsourced data. Trans. GIS 2017, 21, 1321–1340. [Google Scholar] [CrossRef]
  59. Kunwar, B.; Simini, F.; Johansson, A. Large scale pedestrian evacuation modeling framework using volunteered geographical information. Transp. Res. Proc. 2014, 2, 813–818. [Google Scholar] [CrossRef]
  60. Novack, T.; Wang, Z.; Zipf, A. A system for generating customized pleasant pedestrian routes based on OpenStreetMap data. Sensors 2018, 18, 3794. [Google Scholar] [CrossRef] [PubMed]
  61. Kyttä, M. SoftGIS methods in planning evaluation. In Evaluation for Participatory and Sustainable Planning; Hull, A., Ed.; Routledge: Abingdon, UK, 2011. [Google Scholar]
  62. Kahila, M.; Kyttä, M. SoftGIS method as a bridge builder in collaborative urban planning. In Planning Support Systems: Best Practices and New Methods; Geertman, S., Stillwell, J., Eds.; Springer: Dordrecht, The Netherlands, 2009; pp. 389–411. [Google Scholar]
  63. Moore, S.A.; Brown, G.; Kobryn, H.; Strickland-Munro, J. Identifying conflict potential in a coastal and marine environment using participatory mapping. J. Environ. Manag. 2017, 197, 706–718. [Google Scholar] [CrossRef] [PubMed]
  64. Strickland-Munro, J.; Kobryn, H.; Brown, G.; Moore, S.A. Marine spatial planning for the future: Using Public Participation GIS (PPGIS) to inform the human dimension for large marine parks. Mar. Policy 2016, 73, 15–26. [Google Scholar] [CrossRef]
  65. Brown, G.; Strickland-Munro, J.; Kobryn, H.; Moore, S.A. Stakeholder analysis for marine conservation planning using public participation GIS. Appl. Geogr. 2016, 67, 77–93. [Google Scholar] [CrossRef]
  66. Ignaccolo, M.; Inturri, G.; García-Melón, M.; Giuffrida, N.; Le Pira, M.; Torrisi, V. Combining analytic hierarchy process (AHP) with role-playing games for stakeholder engagement in complex transport decisions. Transp. Res. Proc. 2017, 27, 500–507. [Google Scholar] [CrossRef]
  67. Pensa, S.; Masala, E.; Arnone, M.; Rosa, A. Planning local public transport: A visual support to decision-making. Proc. Soc. Behav. Sci. 2014, 111, 596–603. [Google Scholar] [CrossRef]
  68. Cascetta, E. Teoria e Metodi dell’Ingegneria dei Sistemi di Trasporto; UTET: Torino, Italy, 1998. [Google Scholar]
  69. Pagliara, F.; Esposito, M.; Troisi, C. Planning and designing transport infrastructures for sustainability: The great project NAPLEST. Period. Polytech. Transp. Eng. 2017, 45, 53–57. [Google Scholar] [CrossRef]
  70. Verma, R.; Ghosh, S.; Shrivastava, A.; Ganguly, N.; Mitra, B.; Chakraborty, S. Unsupervised annotated city traffic map generation. In Proceedings of the 24th ACM SIGSPATIAL International Conference on Advances in Geographic Information Systems, SIGSPATIAL 2016, San Francisco, CA, USA, 31 October–3 November 2016; p. 59. [Google Scholar]
  71. Baker, K.; Ooms, K.; Verstockt, S.; Brackman, P.; De Maeyer, P.; Van de Walle, R. Crowdsourcing a cyclist perspective on suggested recreational paths in real-world networks. Cartogr. Geogr. Inf. Sci. 2017, 44, 422–435. [Google Scholar] [CrossRef]
  72. Tafidis, P.; Teixeira, J.; Bahmankhah, B.; Macedo, E.; Coelho, M.C.; Bandeira, J. Exploring crowdsourcing information to predict traffic-related impacts. In Proceedings of the 2017 IEEE International Conference on Environment and Electrical Engineering and 2017 IEEE Industrial and Commercial Power Systems Europe, EEEIC/I&CPS Europe, Milan, Italy, 6–9 June 2017; pp. 1–6. [Google Scholar]
  73. Rohit, V. CrowdMap: Crowdsourcing based city traffic map generation. In Proceedings of the 9th International Conference on Communication Systems and Networks, COMSNETS 2017, Bengaluru, India, 4–8 January 2017; pp. 582–583. [Google Scholar]
  74. Mozas-Calvache, A.T. Analysis of behaviour of vehicles using VGI data. Int. J. Geogr. Inf. Sci. 2016, 30, 2486–2505. [Google Scholar] [CrossRef]
  75. Liu, S.; Qu, Q. Dynamic collective routing using crowdsourcing data. Transp. Res. Part B Method. 2016, 93, 450–469. [Google Scholar] [CrossRef]
  76. Kashiyama, T.; Panga, Y.; Sekimoto, Y. Open PFLOW: Creation and evaluation of an open dataset for typical people mass movement in urban areas. Transp. Res. Part C Emerg. Technol. 2017, 85, 249–267. [Google Scholar] [CrossRef]
  77. Cairo, O.; Salcedo, J.S.; Gutierrez-Garcia, J.O. Crowdsourcing information for knowledge-based design of routes for unscheduled public transport trips. J. Knowl. Manag. 2015, 19, 626–640. [Google Scholar] [CrossRef]
  78. Pánek, J.; Benediktsson, K. Emotional mapping and its participatory potential: Opinions about cycling conditions in Reykjavík, Iceland. Cities 2017, 61, 65–73. [Google Scholar] [CrossRef]
  79. Salonen, M.; Broberg, A.; Kyttä, M.; Toivonen, T. Do suburban residents prefer the fastest or low-carbon travel modes? Combining public participation GIS and multimodal travel time analysis for daily mobility research. Appl. Geogr. 2014, 53, 438–448. [Google Scholar] [CrossRef]
  80. Czepkiewicz, M.; Ottelin, J.; Ala-Mantila, S.; Heinonen, J.; Hasanzadeh, K.; Kyttä, M. Urban structural and socioeconomic effects on local, national and international travel patterns and greenhouse gas emissions of young adults. J. Transp. Geogr. 2018, 68, 130–141. [Google Scholar] [CrossRef]
  81. Laatikainen, T.E.; Piiroinen, R.; Lehtinen, E.; Kyttä, M. PPGIS approach for defining multimodal travel thresholds: Accessibility of popular recreation environments by the water. Appl. Geogr. 2017, 79, 93–102. [Google Scholar] [CrossRef]
  82. Galpern, P.; Ladle, A.; Uribe, F.A.; Sandalack, B.; Doyle-Baker, P. Assessing urban connectivity using volunteered mobile phone GPS locations. Appl. Geogr. 2018, 93, 37–46. [Google Scholar] [CrossRef]
  83. Lu, Y.; Misra, A.; Wu, H. Smartphone sensing meets transport data: A collaborative framework for transportation service analytics. IEEE Trans. Mob. Comput. 2018, 17, 945–960. [Google Scholar] [CrossRef]
  84. May, A.; Ross, T. The design of civic technology: Factors that influence public participation and impact. Ergonomics 2018, 61, 214–225. [Google Scholar] [CrossRef]
  85. Sandheep, S.; Harry, J.; Harikumar, A.; Vinitha Panicker, J.V. BusTimer: An android based application for generating bus schedules using crowdsourcing. In Proceedings of the 2017 International Conference on Technological Advancements in Power and Energy, TAP Energy, Coimbatore, India, 21–23 December 2017; pp. 1–6. [Google Scholar]
  86. Wu, F.-J.; Lim, H.B. UrbanMobilitySense: A user-centric participatory sensing system for transportation activity surveys. IEEE Sens. J. 2014, 14, 4165–4174. [Google Scholar] [CrossRef]
  87. Bucher, D.; Mangili, F.; Cellina, F.; Bonesana, C.; Jonietz, D.; Raubal, M. From location tracking to personalized eco-feedback: A framework for geographic information collection, processing and visualization to promote sustainable mobility behaviors. Travel Behav. Soc. 2019, 14, 43–56. [Google Scholar] [CrossRef]
  88. Baloian, N.; Frez, J.; Pino, J.A.; Zurita, G. Efficient planning of urban public transportation networks. In International Conference on Ubiquitous Computing and Ambient Intelligence; Springer: Cham, Switzerland, 2015; pp. 439–448. [Google Scholar]
  89. Ferster, C.J.; Nelson, T.; Winters, M.; Laberee, K. Geographic age and gender representation in volunteered cycling safety data: A case study of BikeMaps.org. Appl. Geogr. 2017, 88, 144–150. [Google Scholar] [CrossRef]
  90. Sun, Y.; Du, Y.; Wang, Y.; Zhuang, L. Examining associations of environmental characteristics with recreational cycling behaviour by street-level Strava data. Int. J. Environ. Res. Public Health 2017, 14, 644. [Google Scholar] [CrossRef]
  91. Sobreiro Santos, G.; de Arantes Gomes, R.; dos Santos, E.A. PPGIS as an urban planning tool around airports. J. Air Transp.Manag. 2018, 69, 269–278. [Google Scholar] [CrossRef]
  92. Li, M.Z.; Suh, D.Y.; Ryerson, M.S. Visualizing aviation impacts: Modeling current and future flight trajectories with publicly available flight data. Transp. Res. Part D Transp. Environ. 2018, 63, 769–785. [Google Scholar] [CrossRef]
  93. Dienstl, B.; Scholz, J. A concept for smart transportation user-feedback utilizing volunteered geoinformation approaches. Adv. Intell. Syst. Comput. 2019, 879. [Google Scholar] [CrossRef]
  94. Cao, X.; Feiwen, L.; Huiling, C. Circuity characteristics of urban travel based on GPS data: A case study of Guangzhou. Sustainability 2017, 9, 2156. [Google Scholar]
  95. Teymurian, F.; Alesheikh, A.A.; Alimohammadi, A.; Sadeghi-Niaraki, A. VGI based urban public transport. Int. Arch. Photogram. Remote Sens. Spat. Inf. Sci. ISPRS Arch. 2013, XL-1/W3, 425–430. [Google Scholar] [CrossRef]
  96. Liu, K.; Siu, K.W.M.; Gong, X.Y.; Gao, Y.; Lu, D. Where do networks really work? The effects of the Shenzhen greenway network on supporting physical activities. Lands. Urban Plan. 2016, 152, 49–58. [Google Scholar] [CrossRef]
  97. Vajjhala, S.P.; Walker, W.M. Roads to participatory planning: integrating cognitive mapping and GIS for transport prioritization in rural Lesotho. J. Maps 2010, 6, 488–504. [Google Scholar] [CrossRef]
  98. Bordogna, G.; Capelli, S.; Ciriello, D.E.; Psaila, G. A cross-analysis framework for multi-source volunteered, crowdsourced, and authoritative geographic information: The case study of volunteered personal traces analysis against transport network data. Geosp. Inf. Sci. 2018, 21, 257–271. [Google Scholar] [CrossRef]
  99. Guerlain, C.; Cortina, S.; Renault, S. Towards a collaborative geographical information system to support collective decision making for urban logistics initiative. Transp. Res. Proc. 2016, 12, 634–643. [Google Scholar] [CrossRef]
  100. Bakillah, M.; Liang, S.H.L.; Zipf, A. Toward coupling sensor data and volunteered geographic information (VGI) with agent-based transport simulation in the context of smart cities. In Proceedings of the ACM International Symposium on Advances in Geographic Information Systems, Redondo Beach, CA, USA, 6–9 November 2012. [Google Scholar]
  101. Singla, A.; Santoni, M.; Bartók, G.; Mukerji, P.; Meenen, M.; Krause, A. Incentivizing users for balancing bike sharing systems. In Proceedings of the 29th AAAI Conference on Artificial Intelligence, Austin, TX, USA, 25–30 January 2015. [Google Scholar]
  102. Tomaras, D. Crowdsourcing techniques for smart urban mobility. In Proceedings of the 2018 IEEE International Conference on Pervasive Computing and Communications Workshops (PerCom Workshops, 2018), Athens, Greece, 19–23 March 2018; pp. 460–461. [Google Scholar]
  103. Gavalas, D.; Giannakopoulou, K.; Kasapakis, V.; Kehagias, D.; Konstantopoulos, C.; Kontogiannis, S.; Kypriadis, D.; Pantziou, G.; Paraskevopoulos, A.; Zaroliagis, C. Renewable mobility in smart cities: Cloud-based services. In Proceedings of the 2018 IEEE Symposium on Computers and Communications (ISCC, 2018), Natal, Brazil, 25–28 June 2018; pp. 01280–01285. [Google Scholar]
  104. Attard, M.; Haklay, M.; Capineri, C. The potential of volunteered geographic information (VGI) in future transport systems. Urban Plan. 2016, 1, 6–19. [Google Scholar] [CrossRef]
  105. Kessler, F. Volunteered geographic information: A bicycling enthusiast perspective. Cartogr. Geogr. Inf. Sci. 2011, 38, 258–268. [Google Scholar] [CrossRef]
  106. Browne, D.; Ryan, L. Comparative analysis of evaluation techniques for transport policies. Environ. Impact Assess. Rev. 2011, 31, 226–233. [Google Scholar] [CrossRef]
  107. Le Pira, M.; Inturri, G.; Ignaccolo, M.; Pluchino, A. Modelling consensus building in Delphi practices for participated transport planning. Transp. Res. Proc. 2017, 25, 3729–3739. [Google Scholar] [CrossRef]
  108. Macharis, C.; De Witte, A.; Ampe, J. The multi-actor, multi-criteria analysis methodology (MAMCA) for the evaluation of transport projects: Theory and practice. J. Adv. Transp. 2009, 43, 183–202. [Google Scholar] [CrossRef]
  109. Malczewski, J. GIS-based multicriteria decision analysis: A survey of the literature. Int. J. Geogr. Inf. Sci. 2006, 20, 703–726. [Google Scholar] [CrossRef]
  110. Malczewski, J. GIS and Multicriteria Decision Analysis; Wiley: New York, NY, USA, 1999. [Google Scholar]
  111. Giuffrida, N. A Public Participatory GIS and Multi Criteria Decision Analysis framework for the Evaluation of Transport Scenarios. Ph.D. Thesis, University of Catania, Catania, Italy, 2018. Available online: http://hdl.handle.net/10761/3897 (accessed on 23 April 2019).
  112. Gatta, V.; Marcucci, E.; Delle Site, P.; Le Pira, M.; Carrocci, C.S. Planning with stakeholders: Analysing alternative off-hour delivery solutions via an interactive multi-criteria approach. Res. Transp. Econ. 2019. [Google Scholar] [CrossRef]
  113. Ishizaka, A.; Nemery, P. Multi-Criteria Decision Analysis. Methods and Software; Wiley: Hoboken, NJ, USA, 2013. [Google Scholar]
  114. Fonte, C.C.; Antoniou, V.; Bastin, L.; Estima, J.; Arsanjani, J.J.; Bayas, J.-C.L.; See, L.; Vatseva, R. Assessing VGI Data Quality. In Mapping and the Citizen Sensor; Foody, G., See, L., Fritz, S., Mooney, P., Olteanu-Raimond, A.-M., Fonte, C.C., Antoniou, V., Eds.; Ubiquity Press: London, UK, 2017; pp. 137–163. [Google Scholar] [CrossRef]
Figure 1. Publishing years of articles included in the review.
Ijgi 08 00198 g001
Figure 2. Keyword analysis of articles included in the review.
Ijgi 08 00198 g002
Figure 3. Subjects studied: (a) Analysis of the transport projects per main categories; (b) Transport projects sub-category distribution.
Ijgi 08 00198 g003
Figure 4. (a) Role of GIS; (b) Type of Involvement.
Ijgi 08 00198 g004
Figure 5. Example of PPGIS used as a tool for data visualization and interaction with the public [66].
Ijgi 08 00198 g005
Figure 6. Triangle of integration of GIS, Public Participation and MCDA in the transport decision-making process (adapted from [111]).
Ijgi 08 00198 g006
Figure 7. Framework of the contribution of GIS, MCDA and Public Participation in transport decision-making processes [111].
Ijgi 08 00198 g007

