1. Introduction
3D reconstruction of urban environments has been an important topic as many different areas of study utilize 3D city models for visualization and simulation purposes [
1,
2]. With recent advancements, larger corporations such as Apple, Google and Microsoft provide their 3D visualization of city information as part of their map services. Moreover, such visualization is provided with varying levels of detail for optimization purposes, helping the services be utilized efficiently while providing detail when required [
3]. Detailed models of features might be required for generation of realistic 3D city models, which is utilized for effective project management integrating building information modeling (BIM) and geographic information systems (GIS) [
4]. Through detailed 3D environment reconstruction and integration of feature details, better planning can be accomplished. This approach contributes to effective risk management, construction management and environmental analysis for autonomous vehicles, which are several important topics that help build smarter cities [
5]. Representation of features such as 3D terrain, roads and detailed building models are useful for augmenting the experience of the users and professionals alike and, therefore, methods to provide 3D information have been an area of focus for years [
6].
Although storing such information as shape files for two-dimensional models may be considered appropriate, such large data providing 3D information require an efficient method of storage and processing [
3]. Especially storage might be a major issue for larger study areas [
7]. Furthermore, as the data are going to be utilized for other purposes and applications, a proper geometric and semantic structuring of the data for better accuracy is essential [
1]. Most often, 3D information is provided through hierarchical and semantically consistent formats [
3,
8]. Through such an arrangement, different applications, such as the ones for flooding [
9,
10,
11] or urban development planning [
12,
13] can utilize the data according to their requirements. In addition, providing multiple layers and storing the data in a hierarchical structure, more details can be incorporated into city description, which is essential for realistic and complex scenarios.
It is possible to model 3D environments using manual modeling through specialized software by creating models of features through software such as SketchUp [
14] and extracting the existing information of the study area by software such as CityEngine [
15,
16], which incorporates importing 2D and 3D data from different map sources. As urban environments are quite complicated in nature, most of the earlier studies of 3D environment reconstruction focus on automated generation, mapping and rendering of digital city models [
17]. With the advent of various approaches to visualize environments, LiDAR, photogrammetry and aerial imagery have been used to build 3D models of urban environments as the terrain and variety of features can be extracted and defined properly [
18,
19,
20,
21]. Through machine learning and pattern recognition techniques on 3D point clouds derived from LiDAR, automatic classification of buildings, ground and vegetation can be provided, and 3D reconstruction of building models can be accomplished [
22]. Furthermore, road extraction, lane detection and a variety of other tasks related to 3D urban environment generation can be accomplished through LiDAR [
23,
24]. Moreover, with the availability of open hierarchical map data sources, which provide the map descriptions in a structured format utilizing tags and values, it is possible to use data from sources such as OpenStreetMap (OSM) and convert the preexisting 2D data into 3D features [
1,
25]. As OSM data contain a hierarchical description of point, line and polygon features [
26], which are the common types of features used in GIS, it is a convenient data source to utilize. For hierarchical description of city models, CityGML is an accepted standard to represent large 3D urban environments and therefore it has been used in different approaches, such as modeling cities and landscapes [
27], web representation of large cities [
3], visualization and analysis of cities [
7] and certain simulations based on CityGML data [
28]. As CityGML format contains a structure to define highly detailed cities, it would be useful if the study area is well-investigated. Nevertheless, this might not be possible for various areas around the world and, therefore, the complex structure of the CityGML might not be required for certain applications.
OSM data, being flexible in nature, have been investigated for various purposes. Over et al. [
1] and Goetz [
29] investigated the usage of OSM data for 3D city reconstruction purposes. OSM data are further utilized for generating building models with their inner structures [
25], estimating spatial availability of alcohol [
30], routing applications [
31] and emergency logistics [
32]. Through these studies, it is clear that OSM can be utilized for various tasks and further specialized through incorporating other GIS concepts. This provides us insight on the usability of road networks, building footprints and various other custom data types, if required. Indeed, it would be very useful for specialized applications to convert their data to OSM format using custom tags and provide more information about the study areas.
As applications and experiments based on geographical information require the data source to be well-structured and accurate, it has been a focus of research to investigate the completeness of OSM data. Such surveys are important to compare crowdsourced information with propriety commercial map data. As crowdsourcing utilizes people to provide information and context to features, it has a potential to provide more detailed information than commercially available map data [
33]. Nevertheless, as data collection is not done primarily by professionals, it is expected to have certain inaccuracies or inconsistencies to occur [
34,
35]. Furthermore, as the information organized for OSM is provided by locals, and several geographical properties such as addresses, postal codes and province names are not used uniformly in different regions, there may be certain inconsistencies. Therefore, it is important to provide country-specific training material for the users for OSM to be used in a serious scenario, such as disaster management [
36]. Nevertheless, many works indicate that OSM data, if complete, are suitable for use [
30,
37,
38].
In our work, considering the utility of OSM data in recent literature, we built an urban environment reconstruction approach, City Maker, which considers efficient representation by limiting the number of features and details processed for use in environmental simulations. On top of efficient feature extraction and 3D environment reconstruction, storm sewer data are used and converted into OSM format for use in flooding scenarios. Furthermore, by recognizing surface types of features and embedding Manning coefficients [
39] to define roughness of the terrain, the 3D environment is made simulation-ready. Embedding the simulation parameters help the city model be more descriptive and suitable for efficient environmental simulations without further processing of parameters.
City Maker considers OSM data to provide an efficient way to visualize city information in both 2D and 3D. Through the utility of significant features alongside their most significant parameters, several basic geometric primitives can be used to represent the 3D environment for added efficiency. Moreover, color mapping is implemented to provide a more context in visualization of the study area. By repeating contextual colors organized in semantic categories, the features are better recognized, and further customizations about visualization can be achieved. Lastly, by adding simulation parameters to each feature that the engine generates, the environment is exported for use in simulations, which provides an advantage over merely providing the objects for collision detection purposes.
In
Section 2.1, we briefly introduce the system design.
Section 2.2,
Section 2.3 and
Section 2.4 discuss the individual stages of feature extraction, the drawing pipeline and utilization of simulation parameters.
Section 3 contains results generated by the City Maker. Lastly, we conclude with
Section 4 and discuss potential future work.
2. Methodology
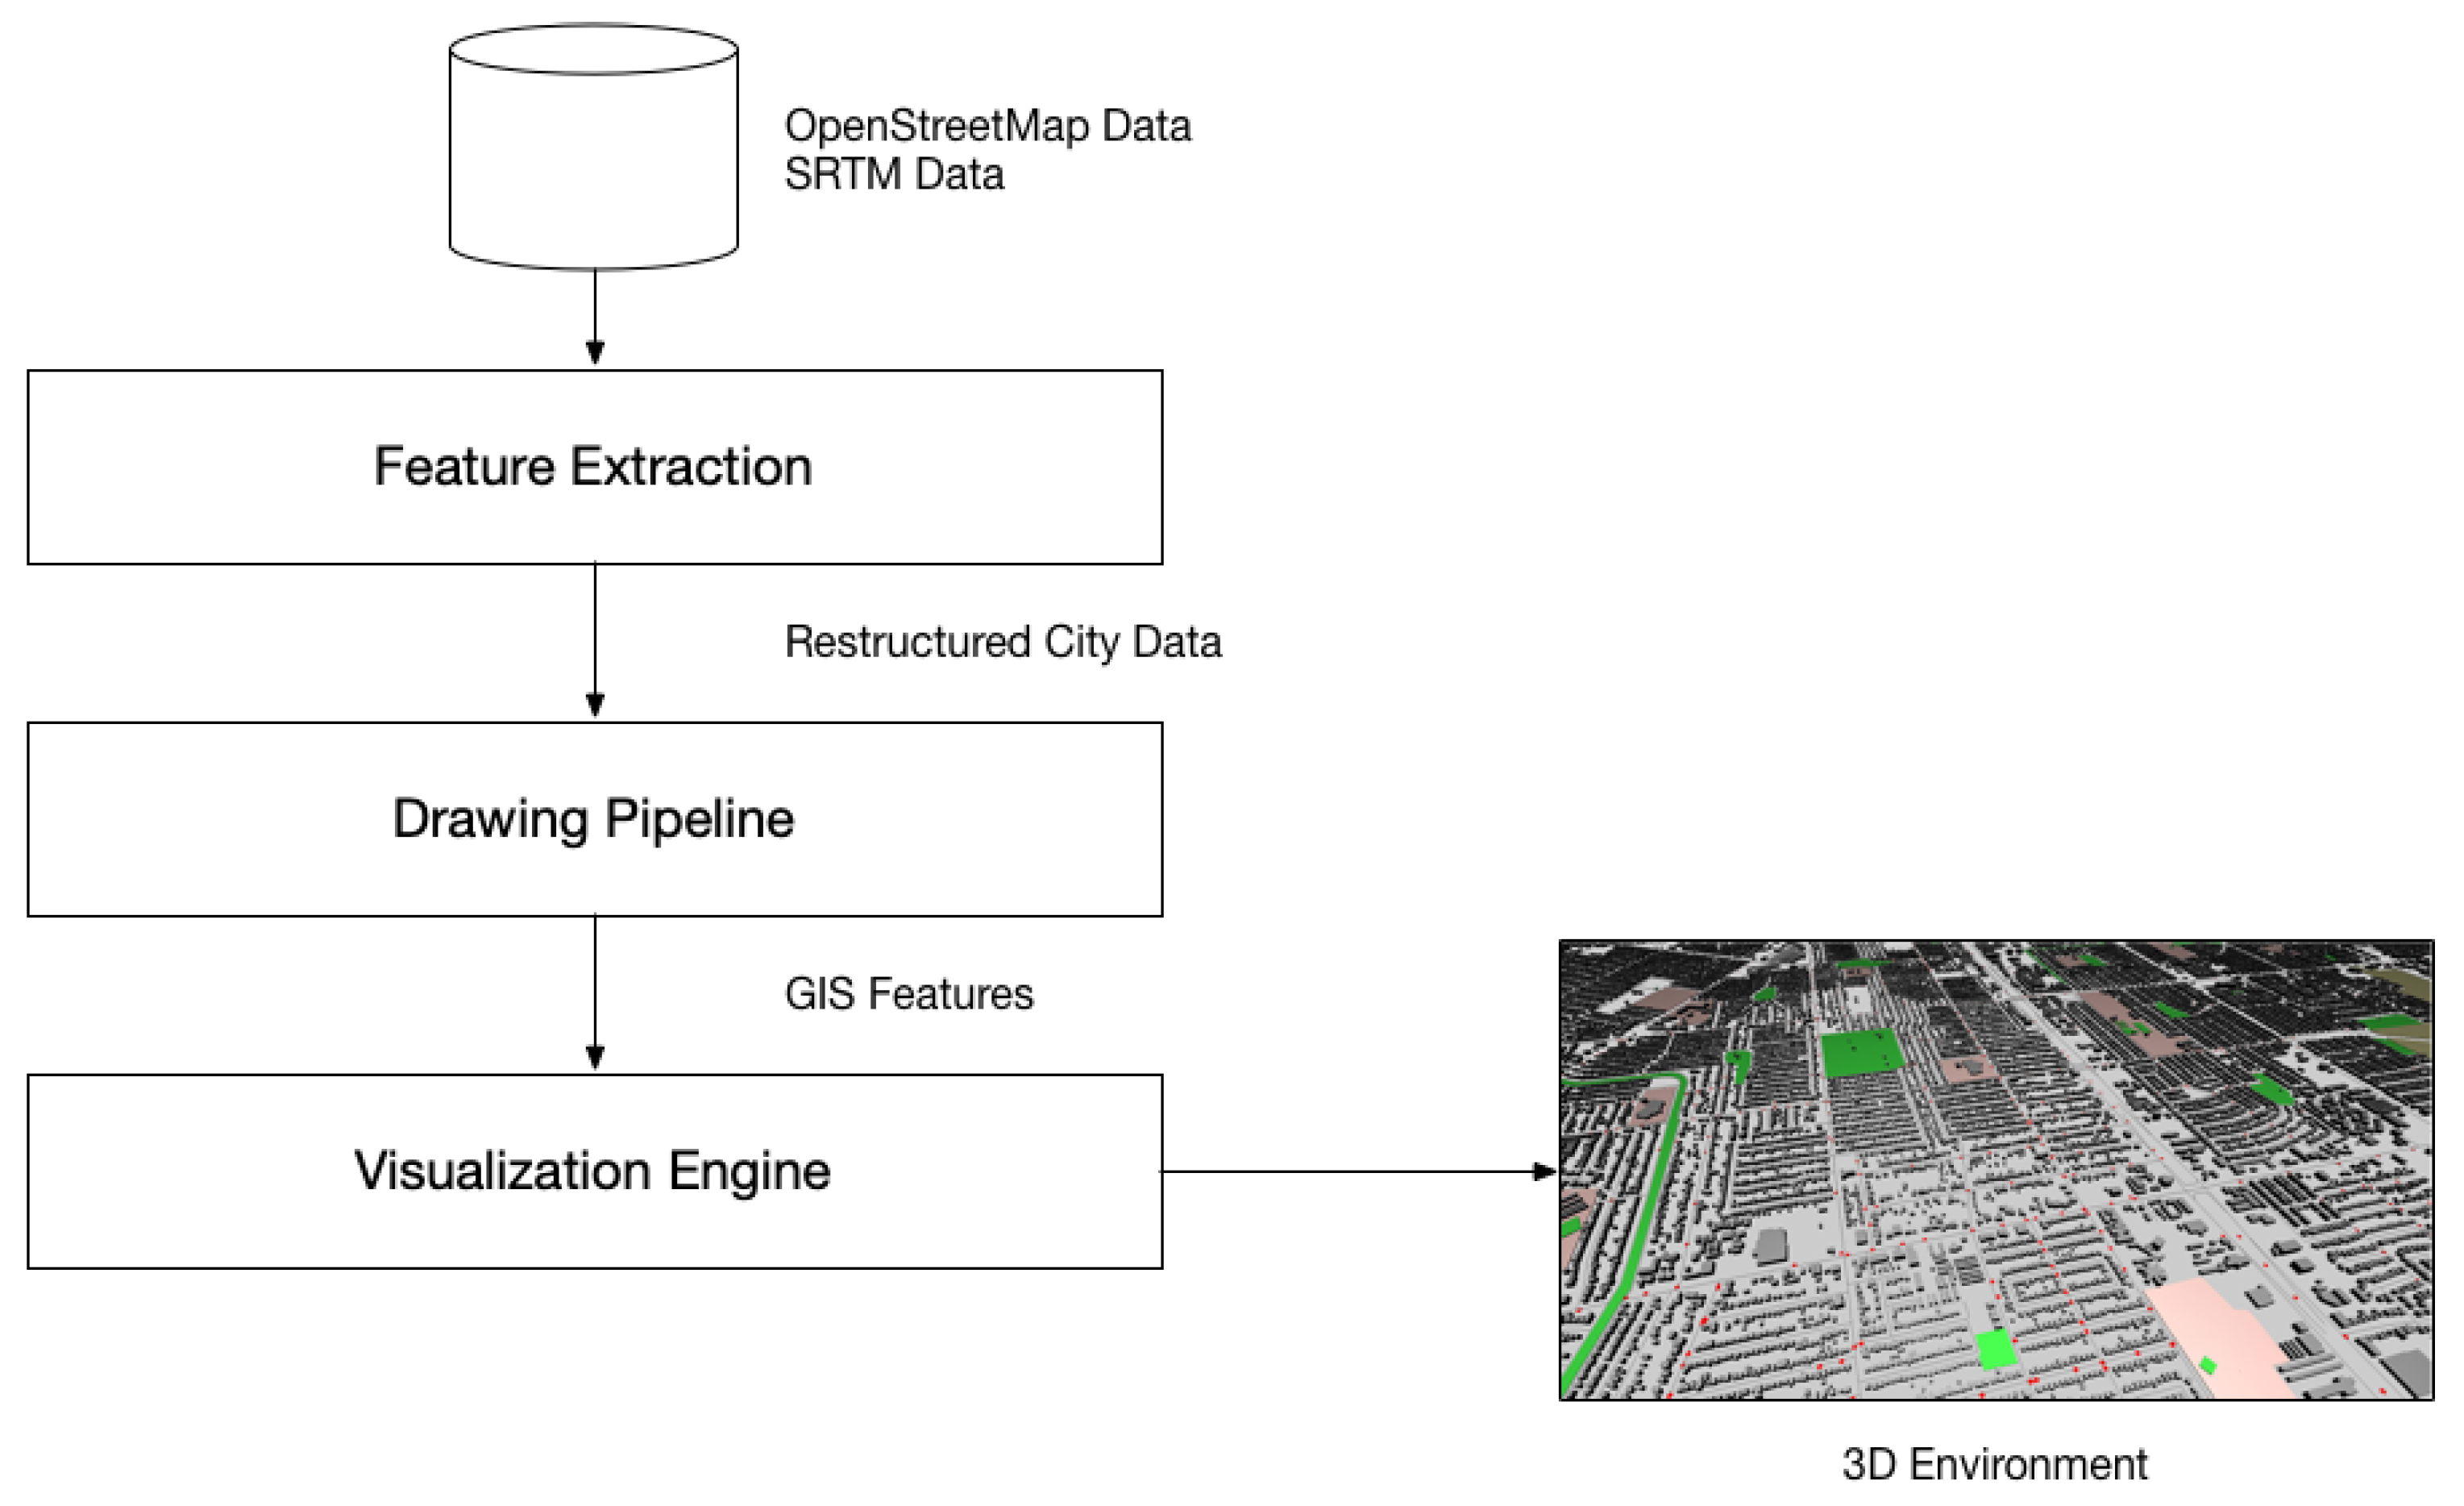
This section describes the methodology by providing details about our urban environment reconstruction framework, City Maker. Initially, the system overview is briefly discussed to provide an overall idea about how the components within the system relate. Upon introduction of the system design, feature extraction approach is explained to describe how the OSM data are integrated into the environment reconstruction mechanism. Lastly, the drawing pipeline and visualization engine, which is responsible for taking the extracted GIS features and render the environment, is explained.
Figure 1 shows the components alongside inputs and outputs of each phase in the system.
2.1. System Overview
Our system was built with C++ as the programming language, OpenGL library to provide drawing and rendering mechanisms and SDL library for windowing and interactivity purposes. Combining various data sources and providing an environment reconstruction mechanism that can incorporate city sewer information, the city models generated can be used in visualization and environmental simulations. The software was tested on Microsoft Windows 10 and Mac OS 10.14 Mojave.
The city building framework contains several layers of abstraction to accomplish boundary generation, feature extraction and 3D environment reconstruction. To utilize the geographical information, the base map is provided by OpenStreetMap (OSM) and the preliminary geographical information is parsed. The study area can be exported from OSM website and any urban environment can be selected for use in the environment reconstruction process. Once the base map is processed appropriately, the data are enhanced with elevation information acquired from the digital elevation model (DEM) from Satellite Radar Topography Mission (SRTM), which has been a common elevation model for a variety of uses [
40]. The version utilized for this work has 1-arc-second, or 30-m, resolution, which is sufficient for broader description of elevation.
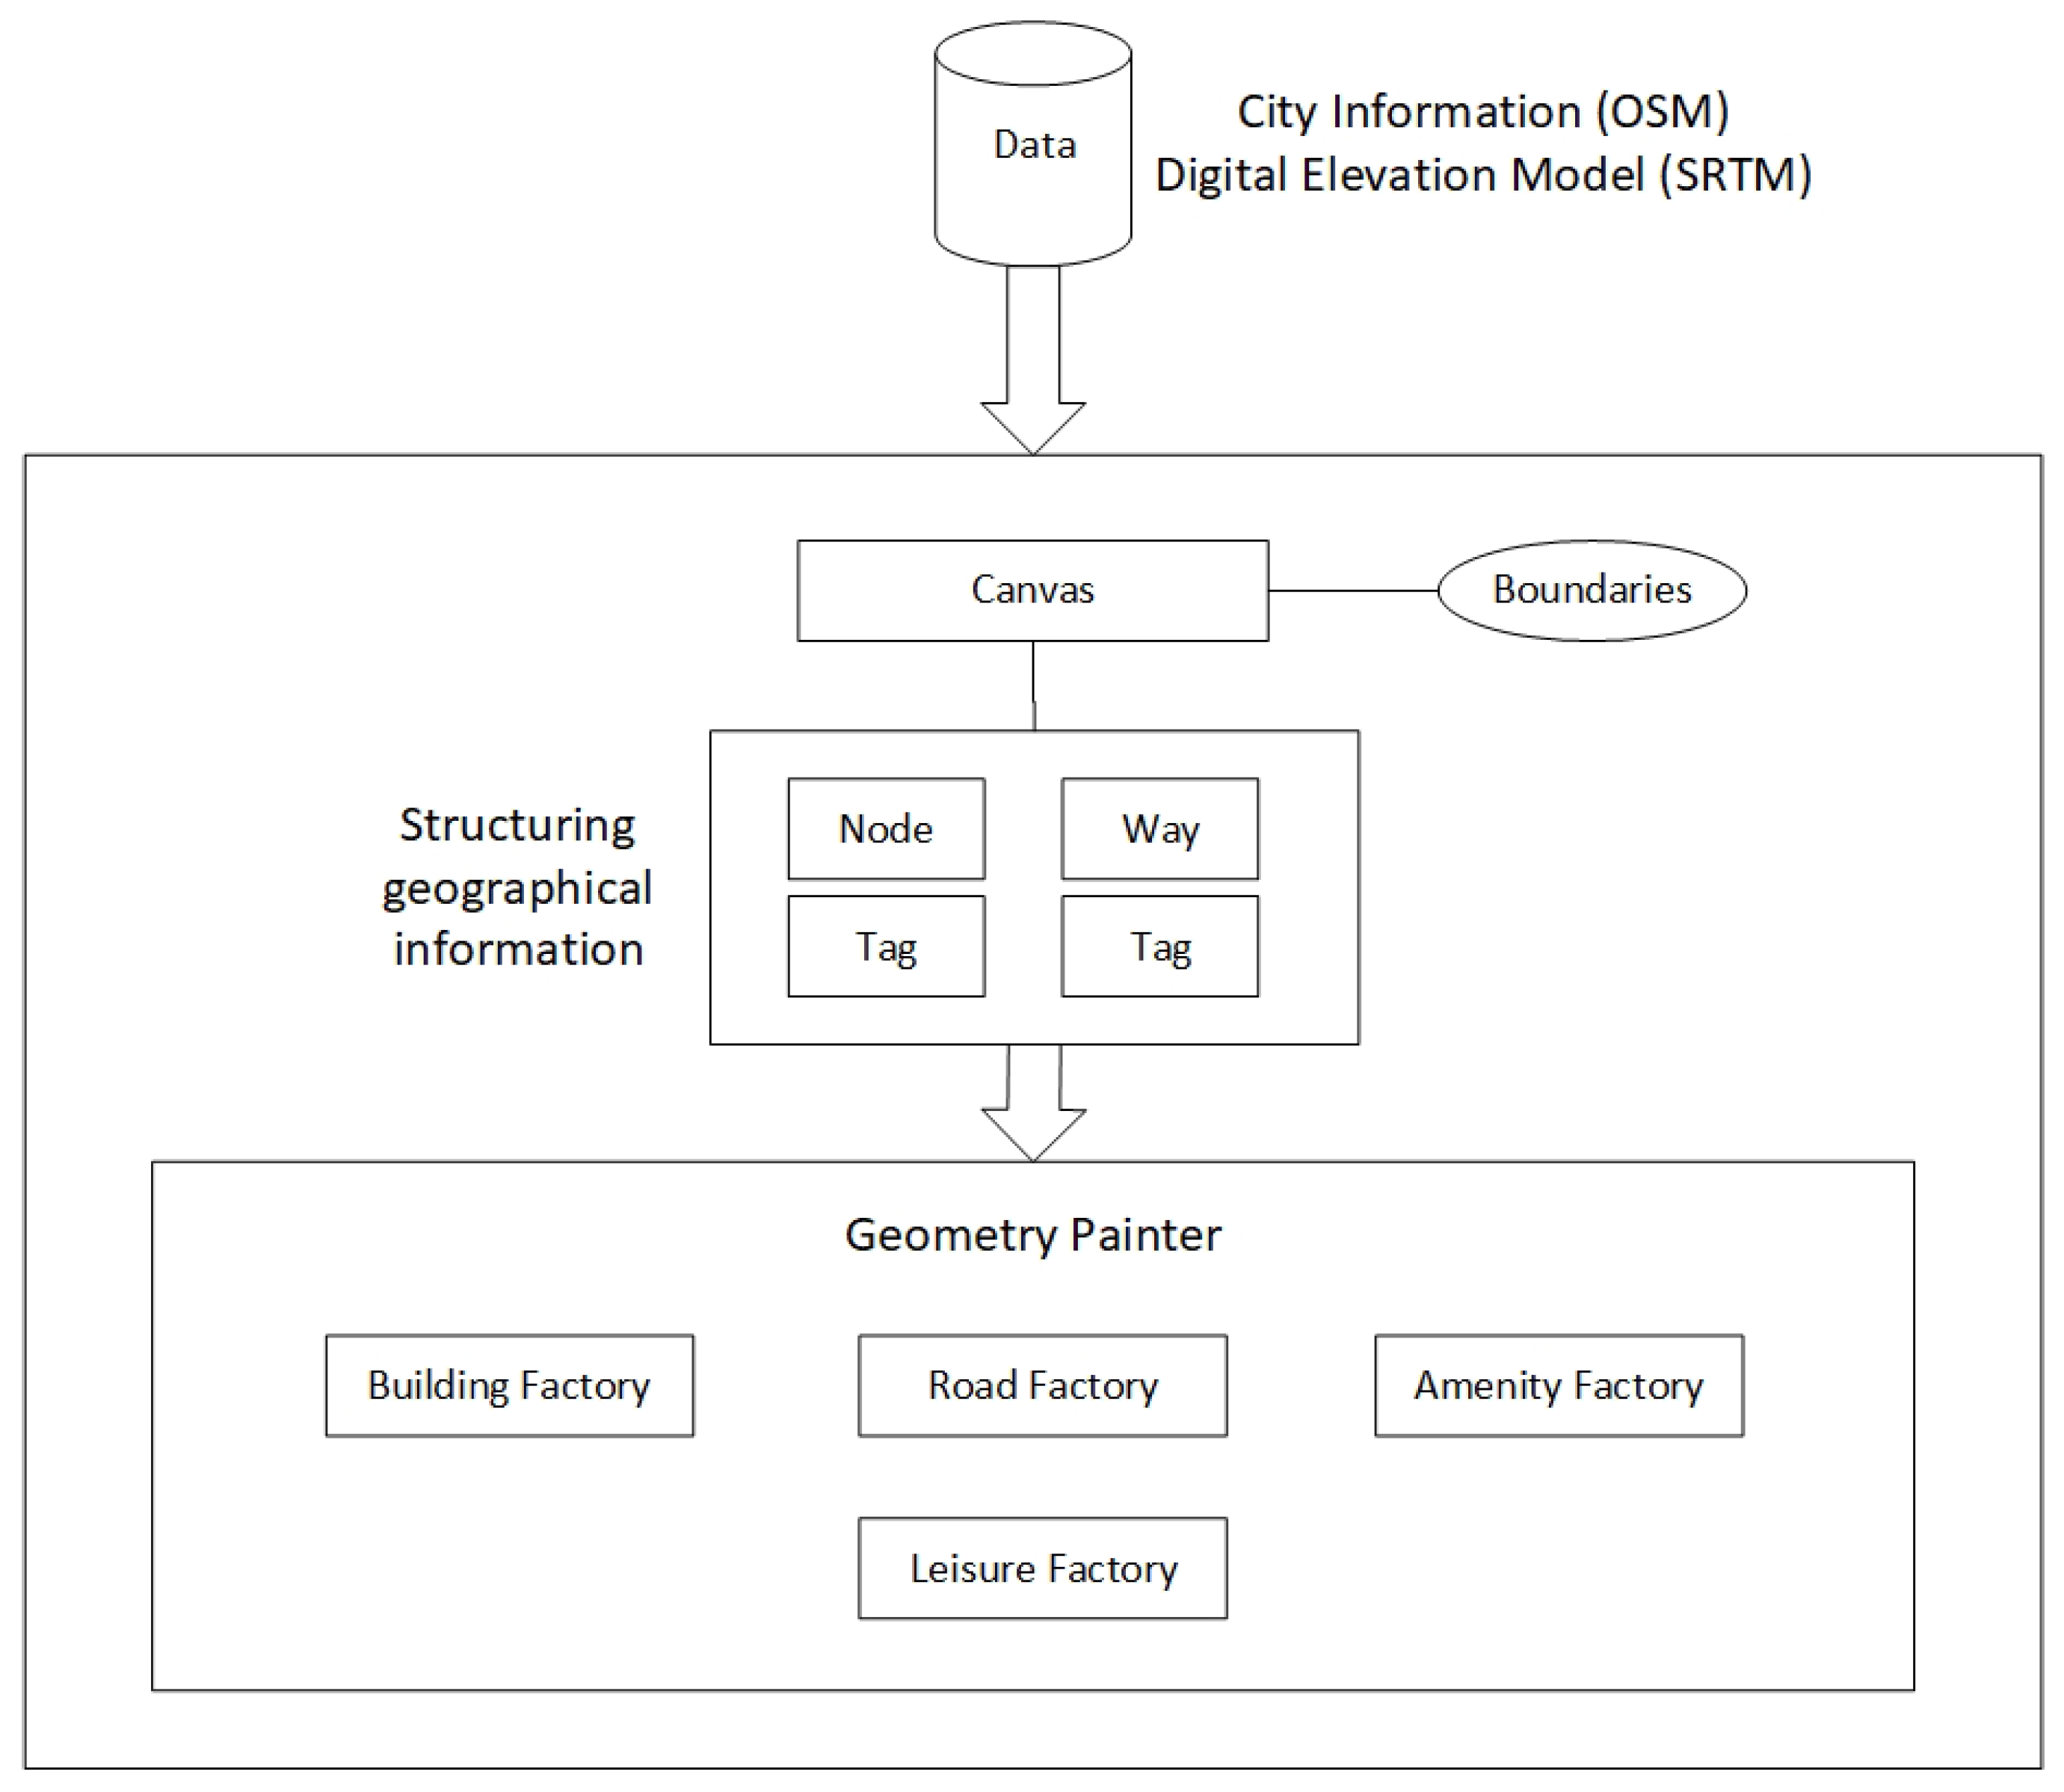
Figure 2 shows the overview of the framework and how its components relate.
Initially, a canvas is created to accommodate the 3D drawing components to build the environment. The canvas is the surface, or the empty area, that GIS features can be placed on. Once the canvas with its appropriate boundary parameters, which are longitude and latitude information that define the study area, are generated through reading the header of the OSM file, geographical information extracted from the OSM data is reorganized for further processing. This structuring phase provides vital information to the 3D drawing component, which is responsible for drawing the variety of objects and surfaces to represent the study area. OSM data provide tags, which are map features, that are attached to data structures called nodes, ways and relations. As the OSM follows this hierarchical data format, the data structures can easily be organized by parsing the exported OSM file and reading through nodes, ways, and relations, and then, individual map features through the tags. Upon organization of the data structures for the map features, a drawing pipeline, which has the power to draw basic geometric primitives and create relationships between separate components, is utilized to draw them to generate the 3D environment. At this stage, vertices, normals, colors and any applicable textures are passed to the drawing pipeline, which is implemented as a series of factories to draw the geometry and dress the objects up. Triangulation is utilized to accommodate concave polygons and extrusion is applied to provide sides of the features with a base and a roof, such as buildings.
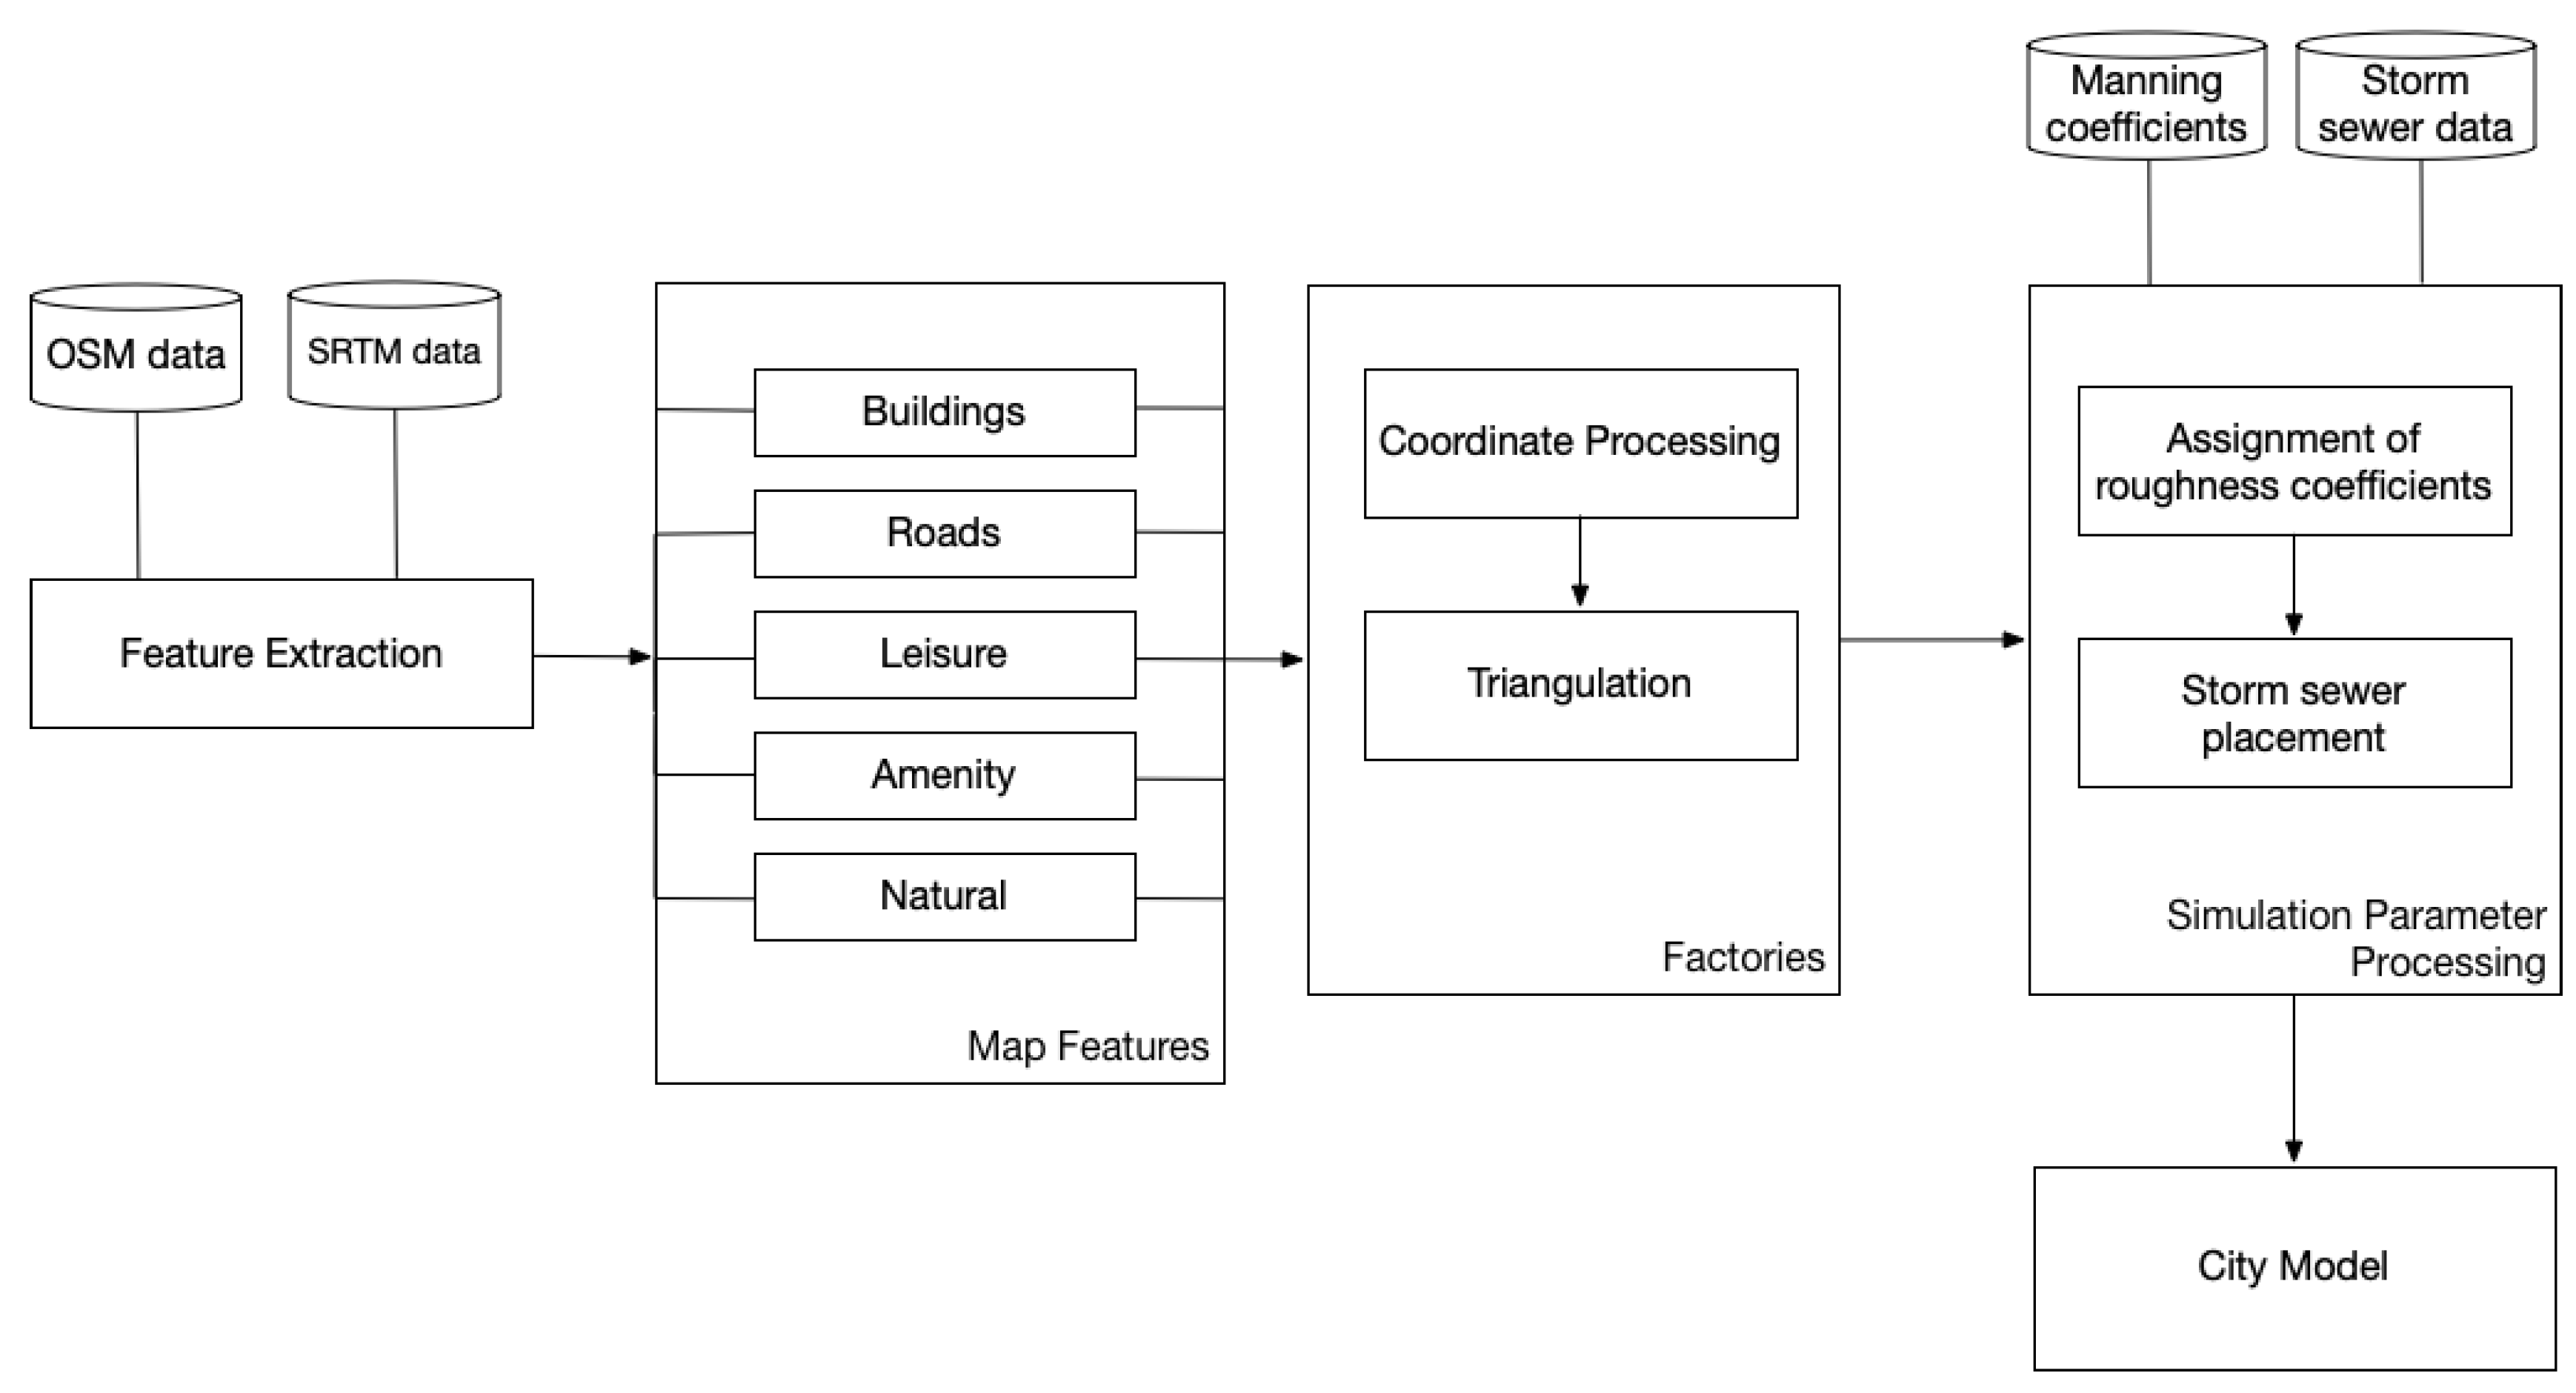
Once the drawing phase is completed, the simulation parameters are then added for use in simulations. Manning coefficients define surface roughness through coefficients, which can be used in describing free surface flow in flood simulations. These coefficients are acquired from Arcement and Schneider’s paper [
39] and calibrated for use within the flood simulator used in testing. As OSM data contain keys and values to define the type of features, our system uses this information to assign appropriate coefficients to features. Moreover, by utilizing storm sewer information, flood water absorption is defined for the 3D environment. For City Maker to properly generate sewer information, inlets, manholes and other relevant objects must be provided in a file alongside their geographic coordinates and absorption rates. Practitioners can further calibrate these data by providing a well-detailed description of each object, which would improve results obtained by the simulation. The steps in 3D environment reconstruction that City Maker considers is shown in
Figure 3.
2.2. Feature Extraction
Feature extraction is the stage in which features from the OSM data are extracted and processed for the drawing pipeline. This process encompasses parsing the OSM data, restructuring the nodes data by converting them from longitude–latitude pairs into relative 3D environment coordinates and then passing the structured information to the drawing pipeline. As OSM data are structured hierarchically, the format is quite predictable. While nodes contain longitude and latitude information alongside some significant map features as tags, ways define a collection of nodes that describe certain constructs such as buildings. Moreover, relations define even bigger constructs by providing a list of ways to utilize. Nevertheless, with the inclusion of user-defined tags, some features may be inconsistent across different environments. Hence, it is an important task to manually read the exported OSM file of the selected region to remove any inconsistencies.
There are four major categories of components that the feature extractor considers: relations, ways, nodes and tags, as OSM data are usually structured. Firstly, a canvas is utilized to describe the city model and its boundaries. OSM contains this information as the data are exported and, therefore, it is straightforward to incorporate this information into the 3D environment. After minimum and maximum longitudes and latitudes are stored as the boundary information, the feature extractor processes nodes and ways from the map data. Initially, a vector is utilized to store all the nodes for further manipulation once the ways are determined. Ways are ordered sets of nodes that define entities on the map. At this point, tag information is read from these “ways” to determine the type of object the drawing framework is going to receive. For example, a tag with a key “building” and a value “residential” defines a building utilized for residential purposes. Some of the buildings contain undefined functionality, which are indicated by the value “yes”.
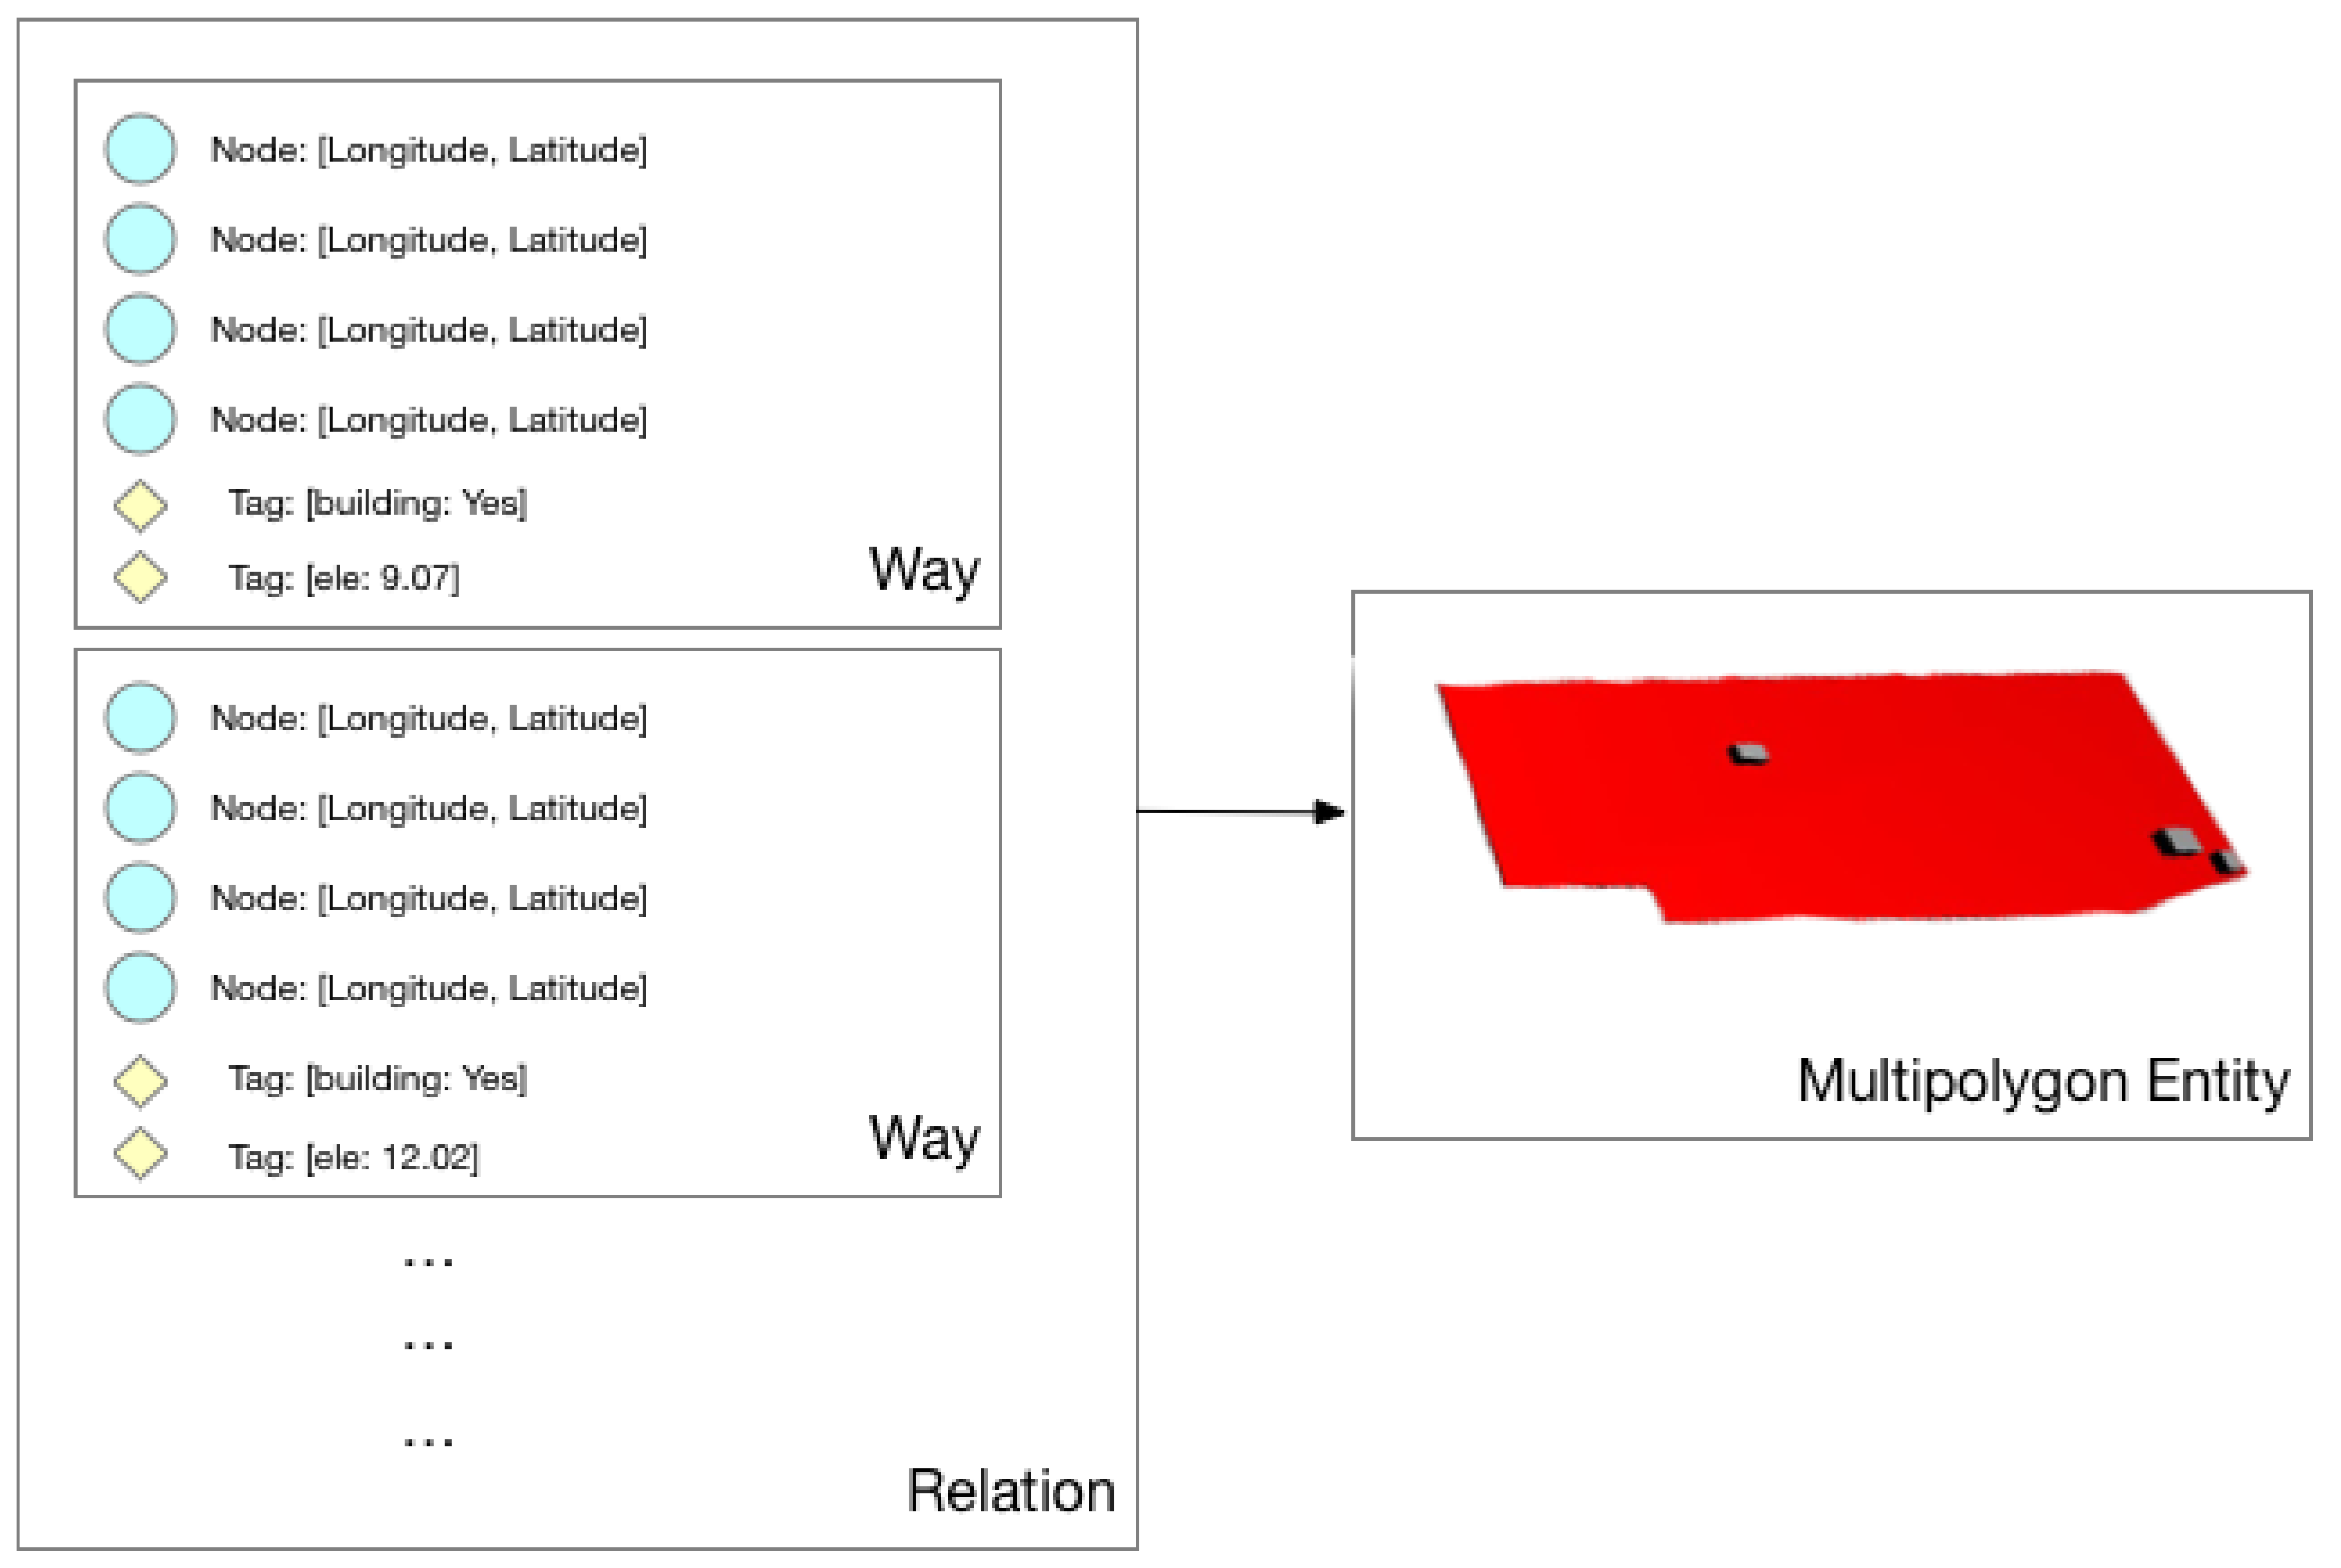
Figure 4 shows how a multipolygon relation construct defining an area and its relevant features is organized through ways, which contain multiple nodes that carry information alongside significant tags that define attributes. Furthermore, height information is associated with every entity the feature extractor determines. Height values are provided in meters unless indicated through notation otherwise. The extracted information is later sent to the drawing pipeline to visualize the study area.
To convert the data to the appropriate format, features are evaluated using their geographical coordinates and then parsed to generate vertex coordinates as they are required to place the map features in the 3D city model. Normally, vertex positions alongside normal and texture coordinates are specified to format the objects appropriately. Furthermore, these object files can contain a variety of attributes to specify a particular rendering attribute, such as level of detail, material name, and ray tracing information. In addition, grouping can be specified to combine relevant features together for a more contextual semantic organization. Currently, basic shading and color coding is available within the City Maker.
To compute distances between two points in the city model, the haversine formula is used. In Equation (
1),
and
indicate latitudes while
and
indicate longitudes. Therefore, to compute the great circle distance between two points, which is dependent on locations of two points and the radius of the Earth, latitudes and longitudes which are extracted from the nodes within OSM data are used. The distances are stored to provide proper georeferencing as well as a user-readable context to the features; instead of showing geographic coordinates, knowing the distance of a building from the sea in meters could provide better insight in many scenarios.
Once the distances are realized, the component translation matrix is formed with relative distances based on the object’s location from the boundaries of the study area. Moreover, this is the stage to organize the object data in a format that the drawing pipeline would recognize and process them. Buildings footprints are extruded with the elevation information, while roads are organized by structuring the nodes as flat planes and lines. These properties are stored in meaningful data structures to be passed later to the drawing factories. Certain features, e.g. roads, require connection of multiple features and therefore, required rotation matrices are derived from the processed coordinates and then placed accordingly in the environment. Furthermore, SRTM information is exported and passed to the next stage to carry elevation information for the study area. As the focus is on description of LOD0 and LOD1 details as specified by CityGML [
41], basic geometric primitives are sufficient to generate both the 2D and 3D digital city models.
2.3. Drawing Pipeline and Visualization
As the structured data from feature extraction are passed to the pipeline, the drawing pipeline organizes them according to a specific order. Initially, certain areas, such as waterways and parks, are visualized to provide the base layer of the environment. At this level, elevation information is also incorporated into the system to provide more details for the environment. This is especially important for the later stages in which the simulation parameters are embedded into the city model as the baseline would define absorption points for the fluid particles. Next, smaller and concrete features, such as buildings and landmarks are visualized. Considering basic geometric primitives and colors, these features are placed in the 3D environment. Lastly, roads are drawn to provide additional depth to the visualization. As the roads are placed directly on the canvas or other map features, they are drawn at a later stage. Upon drawing and coloring these objects, simulation parameters in the form of storm sewer data and roughness coefficients for the features placed in the 3D environment are carried over for use in simulations.
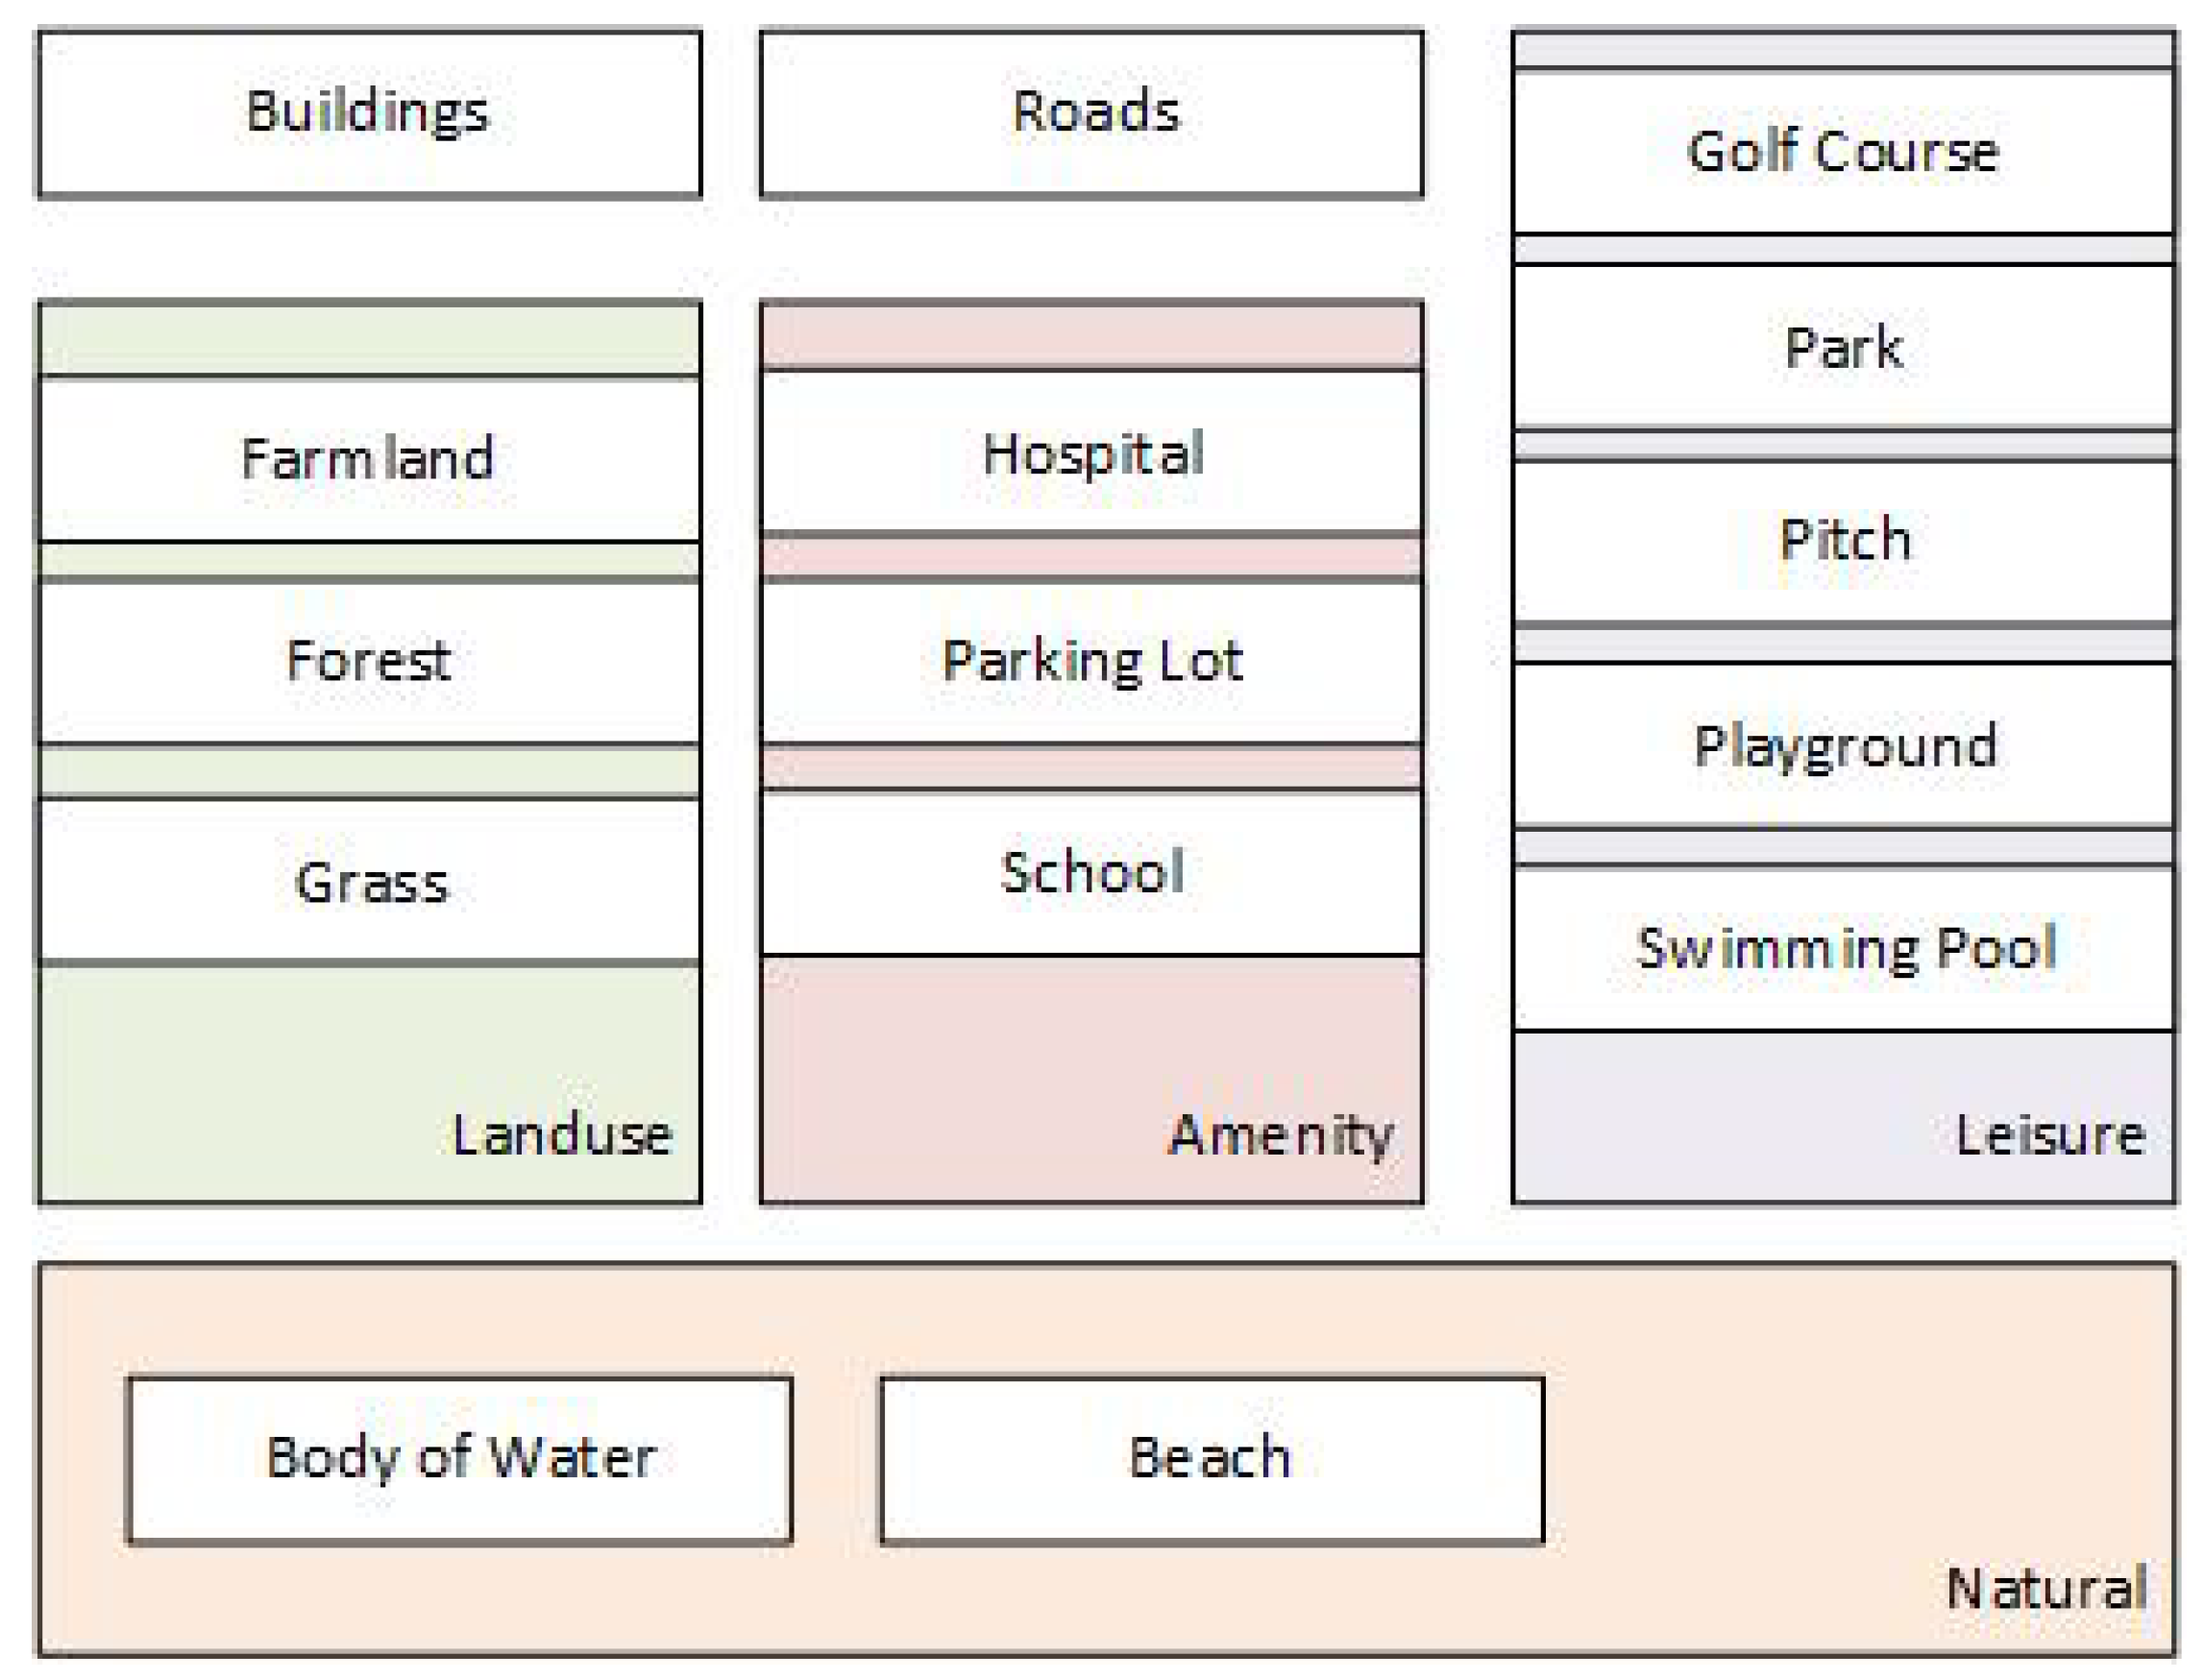
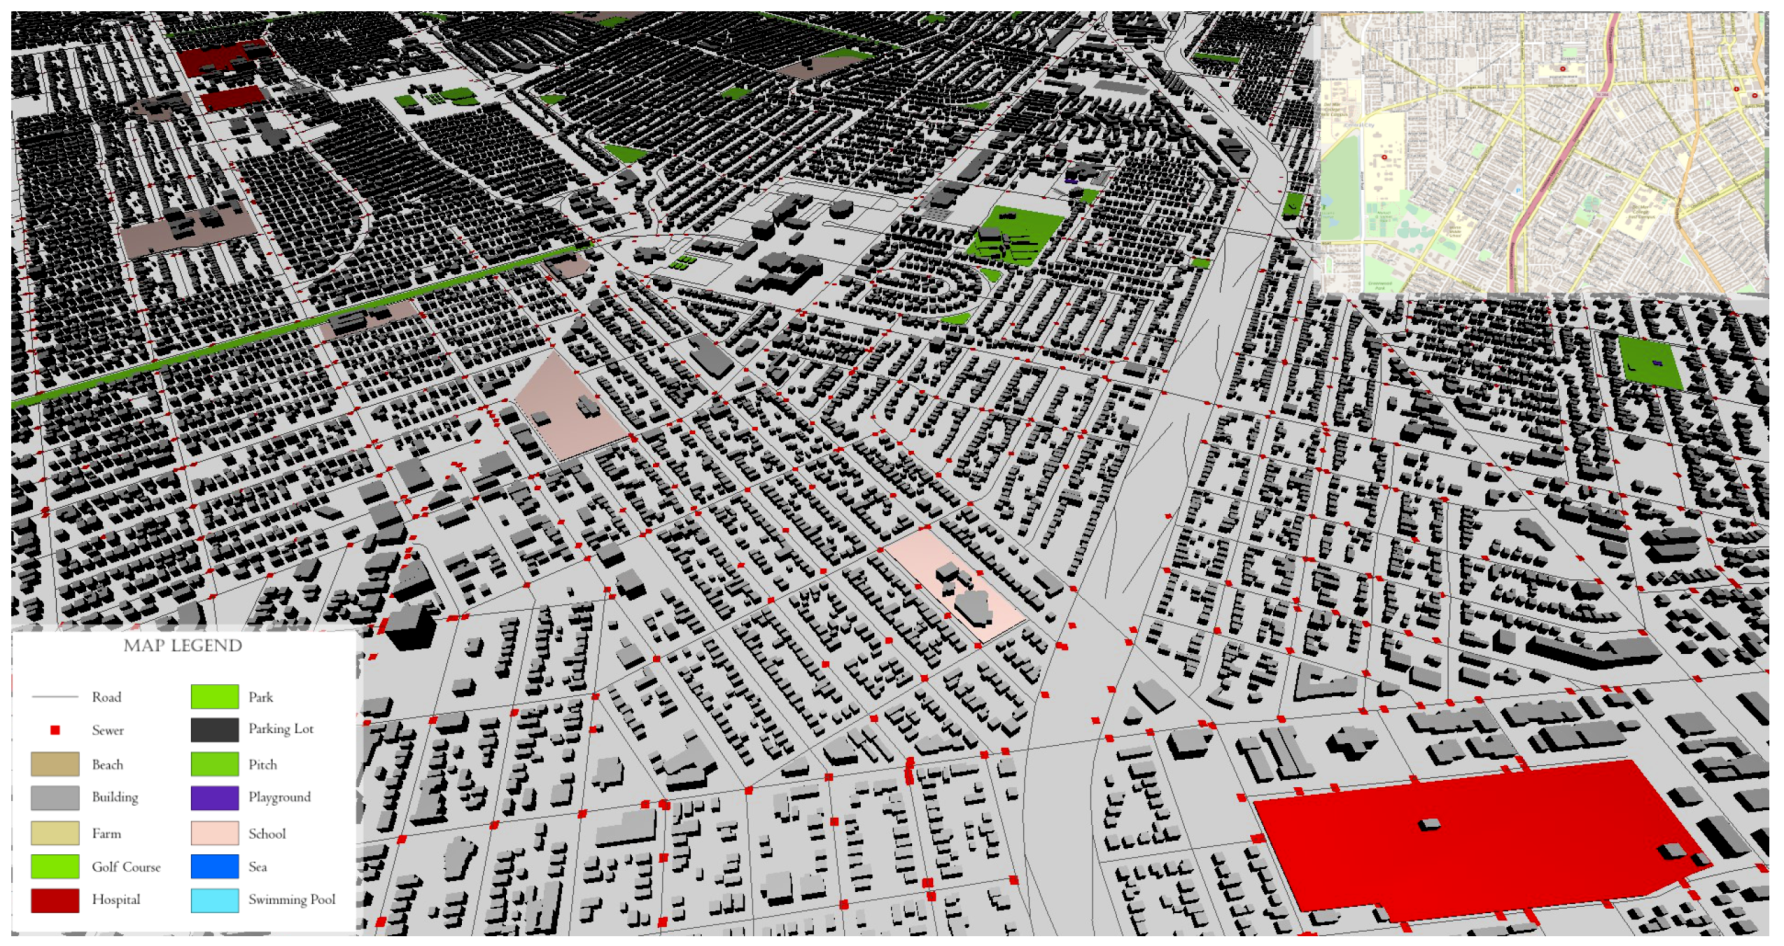
The features shown in
Figure 5 have their unique ways of drawing, texturing and 3D model selection. The way they are triangulated and placed on the surface of the model is defined within each factory in the drawing pipeline. For example, waterways are defined to be level with the base elevation data and provide a blue polygon in the area indicated by the coordinates, while hospitals define areas that contain hospital features such as buildings and parks. Depending on the extracted features and availability of data, more information can be incorporated in the drawing phase. For example, some buildings contain a height information in terms of meters. This is helpful in drawing the buildings yet not all buildings have this height information embedded. Consequently, some simplifications and assumptions may need to be made in the drawing phase. One major assumption is that the study area may not provide sufficient height information for all the features to be drawn in 3D. For this purpose, our system considers only the available height information in the surrounding area, averages the height, and then assigns a slightly randomized height parameter to the features with no height data. If none of the features provide height information, then the user can select an arbitrary height value for the features to use as default height for rendering purposes.
Buildings are drawn based on their dimensions and using the height information derived from OSM data. Height information is already embedded in OSM data as meters and, therefore, it can be utilized after appropriate conversions from meters to vertex coordinates. Length and width information is acquired through computing the distances between extreme sides of the building. These distances are gathered by checking through the list of nodes each building contains. These nodes contain longitude and latitude information. With appropriate conversion to simulation environment units, the features can be placed in the environment with no issues.
Roads are built directly on the canvas. Depending on the outline of the environment, which can be directly recognized through OSM tags such as waterways, highways and so on, different types of planes are generated. Roads are drawn by considering start and endpoints of each individual road and utilizing lines to draw lanes, junctions and other relevant information. Although our study did not focus on determining the number of lanes each road may have, it is possible if the information is available. This could possibly be improved through extracting such features and implementing additional steps in the drawing pipeline. Sometimes nodes carry such information in OSM data and, therefore, further processing can be done to extract such information.
2.4. Simulation Parameter Insertion and City Maker Files
Aside from 3D environment reconstruction capabilities, City Maker has the ability to embed simulation parameters into 3D city model it generates. At this stage, the system analyzes the city model built from the OSM data and incorporates simulation-related information. This stage allows for further customization of the simulation environment through incorporation of approximate simulation parameters for realistic simulation behavior. If the data are available, then it is possible to incorporate any simulation parameter to use in real-time simulations, yet it would not be necessary for the purpose of this work. Therefore, calibration has not been performed for different soil types, different surface textures and different road types. Nevertheless, global default simulation parameters are defined and configured for each entity and if needed, could be changed by the designer and therefore, it can accommodate different types of simulations.
The initial simulation mechanic considered is the roughness coefficients, or Manning coefficients. These values define the behavior in fluid simulations to restrict the movement of particles by defining certain friction values for the surface. City Maker, being aware of the Manning coefficients [
39] for each feature placed in the environment, embeds these friction coefficients into the city model as a separate layer, allowing the model to be directly inputted for environmental simulations. This approach later benefits efficiency as well since no analysis is required to determine terrain roughness once these values are initialized at this stage.
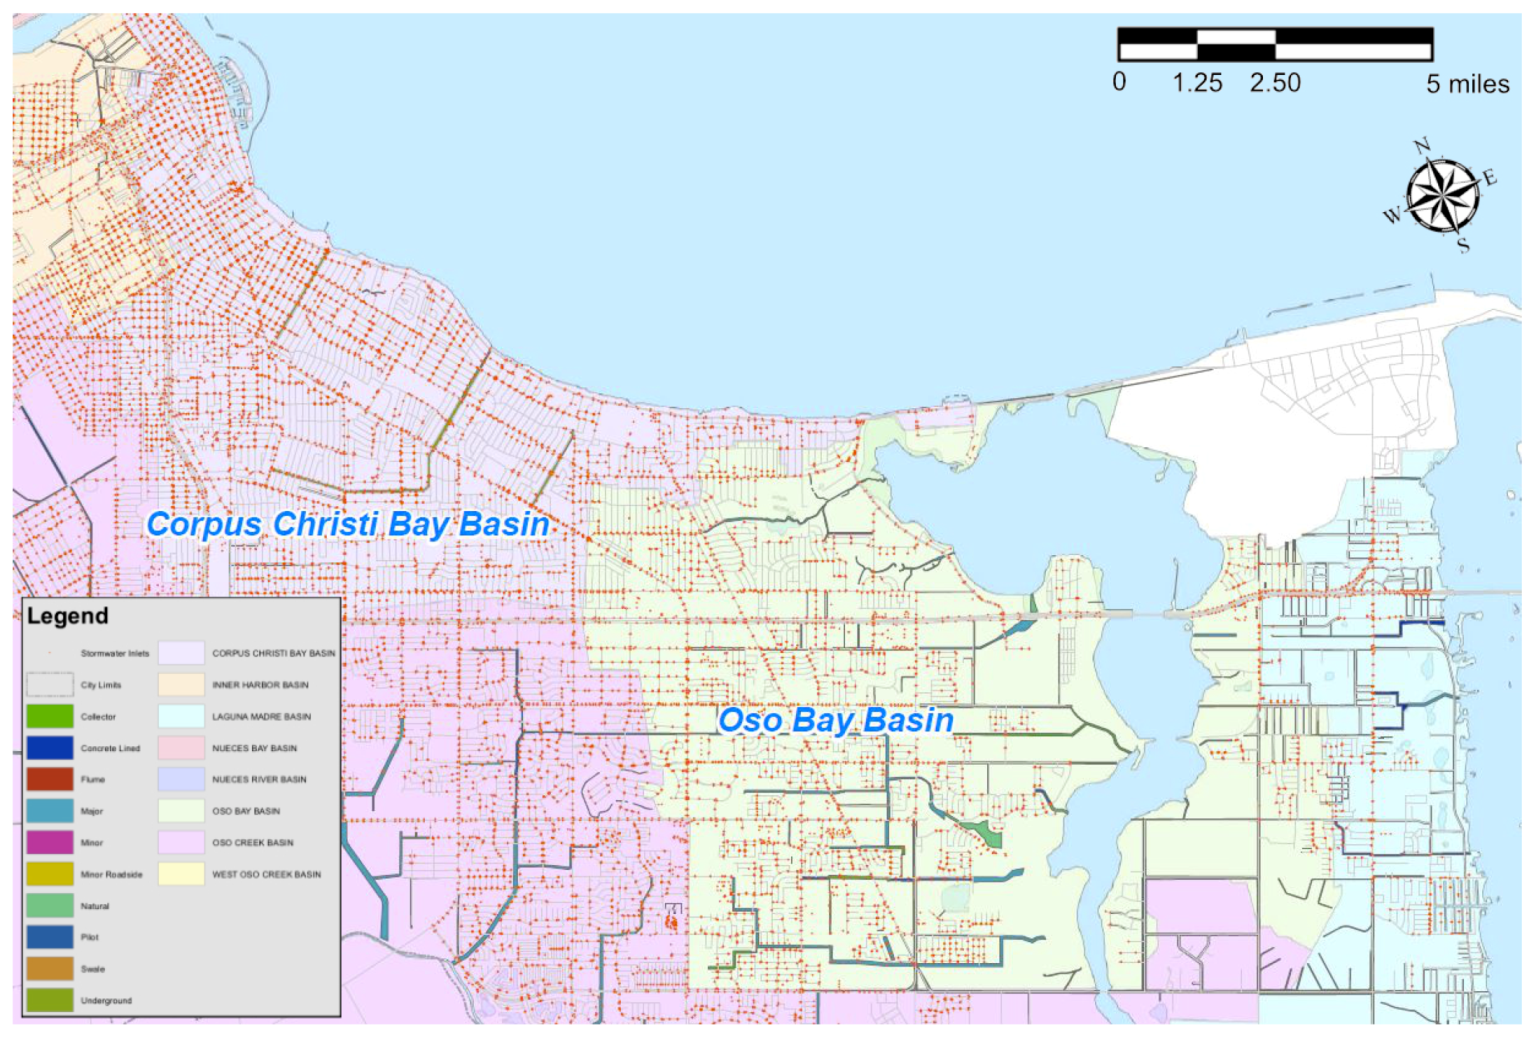
Moreover, City Maker contains an implementation for storm sewer data. Through a storm sewer data file, the information is parsed and the environment is assigned certain absorption coefficients to simulate water leaving the environment. To provide storm sewer data, the file must be prepared in a certain way to contain latitudes, longitudes, flow line elevations and similar relevant parameters. Once the data are processed, appropriate coefficients are provided about sections of the study area and then embedded into the city model as a separate layer. These coefficients define the absorption power of different sections within the city. For example, part of the city with many storm sewer inlets would absorb flood waters faster than some other part with no inlet. Consequently, it is vital to define this parameter if simulation of flooding would occur in urban environments.
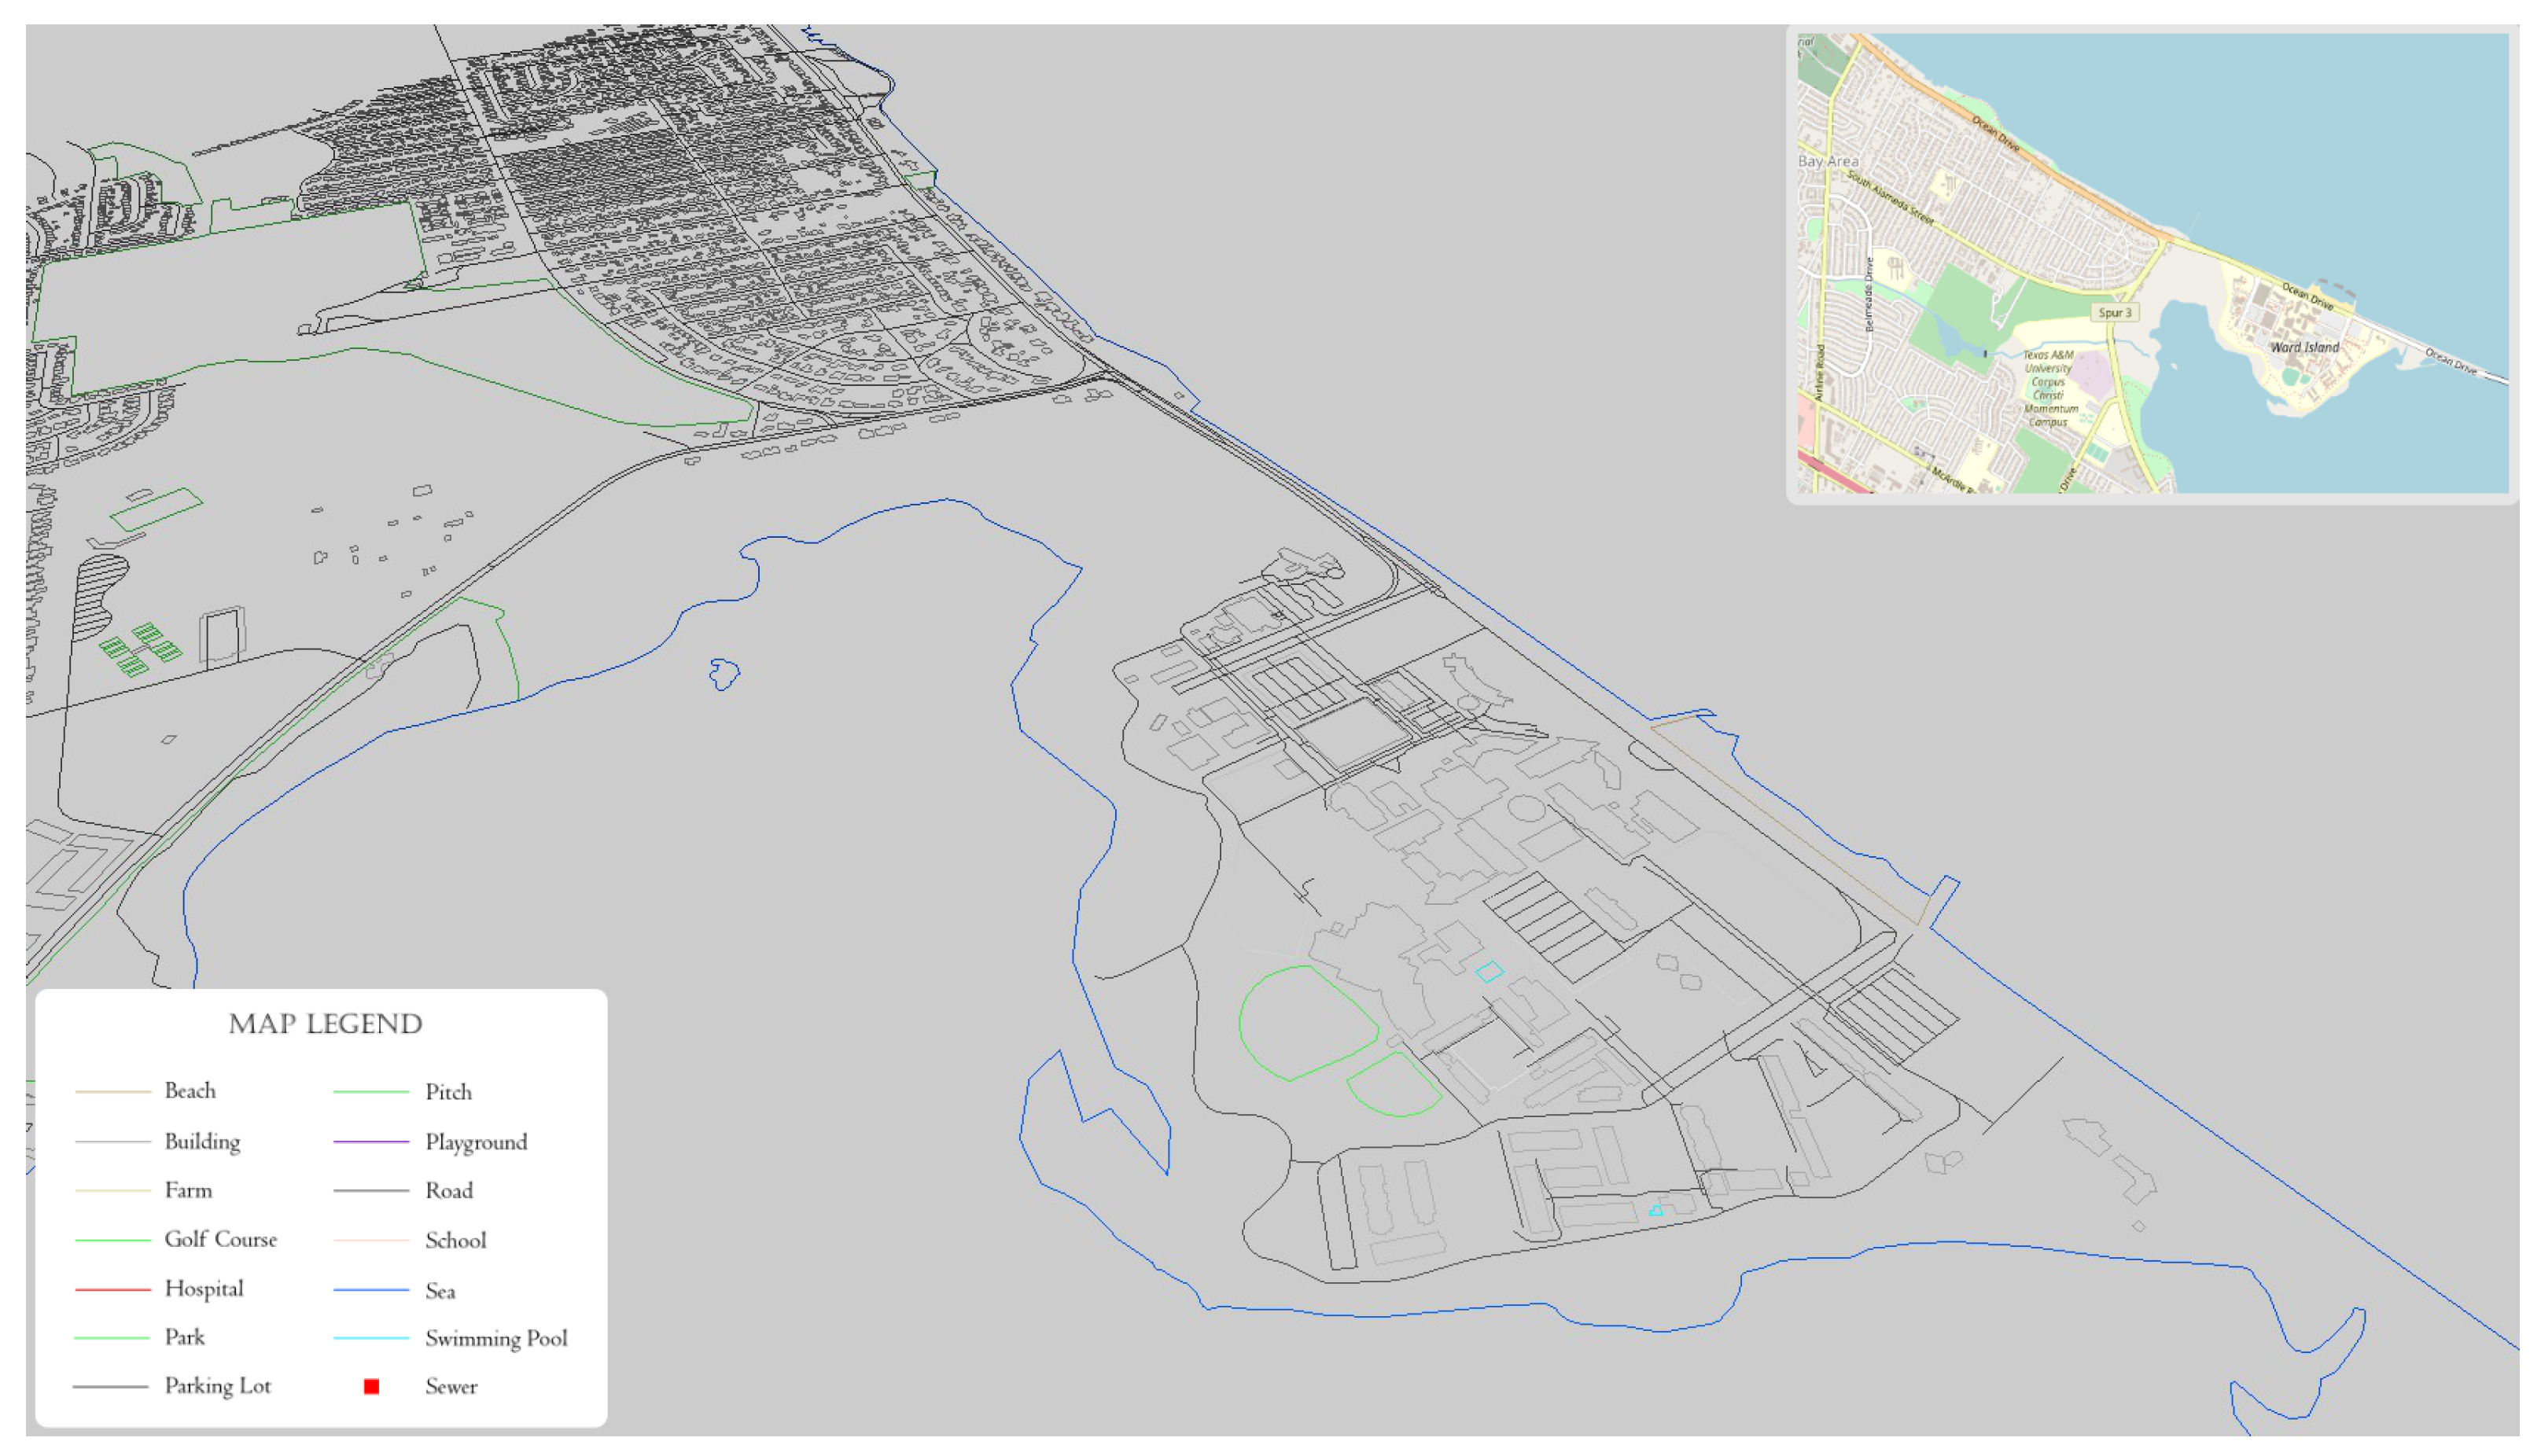
Once the simulation parameters are generated, the city model must be saved. Whenever the city information is processed once, it is exported into an application-specific format for reuse. An extension of .cm (City Maker File) is considered for this purpose and provided details about object placement, texture types, coloring schemes and simulation parameters for easy display and manipulation. Using the City Viewer implemented to work alongside City Maker, previously embedded information can be viewed, certain parameters can be modified, and different coloring schemes can be selected to refine the viewing experience. This approach provides a performance improvement over repeatedly parsing the OSM information whenever the city information is to be viewed. The performance results are shared in
Section 3.
4. Conclusions and Future Work
City Maker provides an urban reconstruction approach using OpenStreetMap (OSM) data through provision of feature recognition and efficient city model restructuring. By arranging the layers in an appropriate format, the city models are loaded and visualized efficiently. Through embedding both the friction coefficients and storm sewer information, the city model has the power to describe several simulation parameters required for a flood simulator to perform properly. By preparing these absorption and friction coefficients at an earlier stage, City Maker provides additional efficiency for the flood simulator. Furthermore, this implementation provides modularity and flexibility as other simulation parameters can be embedded if more information about the study area is acquired. Moreover, SRTM information is exported and used as the baseline for the environment in which the flood simulator can use as a collusion surface to compute fluid–solid interaction.
For the 3D urban environment reconstruction aspect, considering the coloring schemes utilized, more contextual texture provision would yield more realistic results. Currently, as the environment is demonstrated using a limited set of models extracted from the outlines of buildings and coloring for the City Maker, visual realism is not directly incorporated into the implementation. It is also worth underlining that, although the underlying mechanism of localization with regional features is implemented, the lack of artistic content and an appropriate texture visualization engine prevent the framework from utilizing this feature. Future work will incorporate implementation of such a visualization engine to better represent the study area.
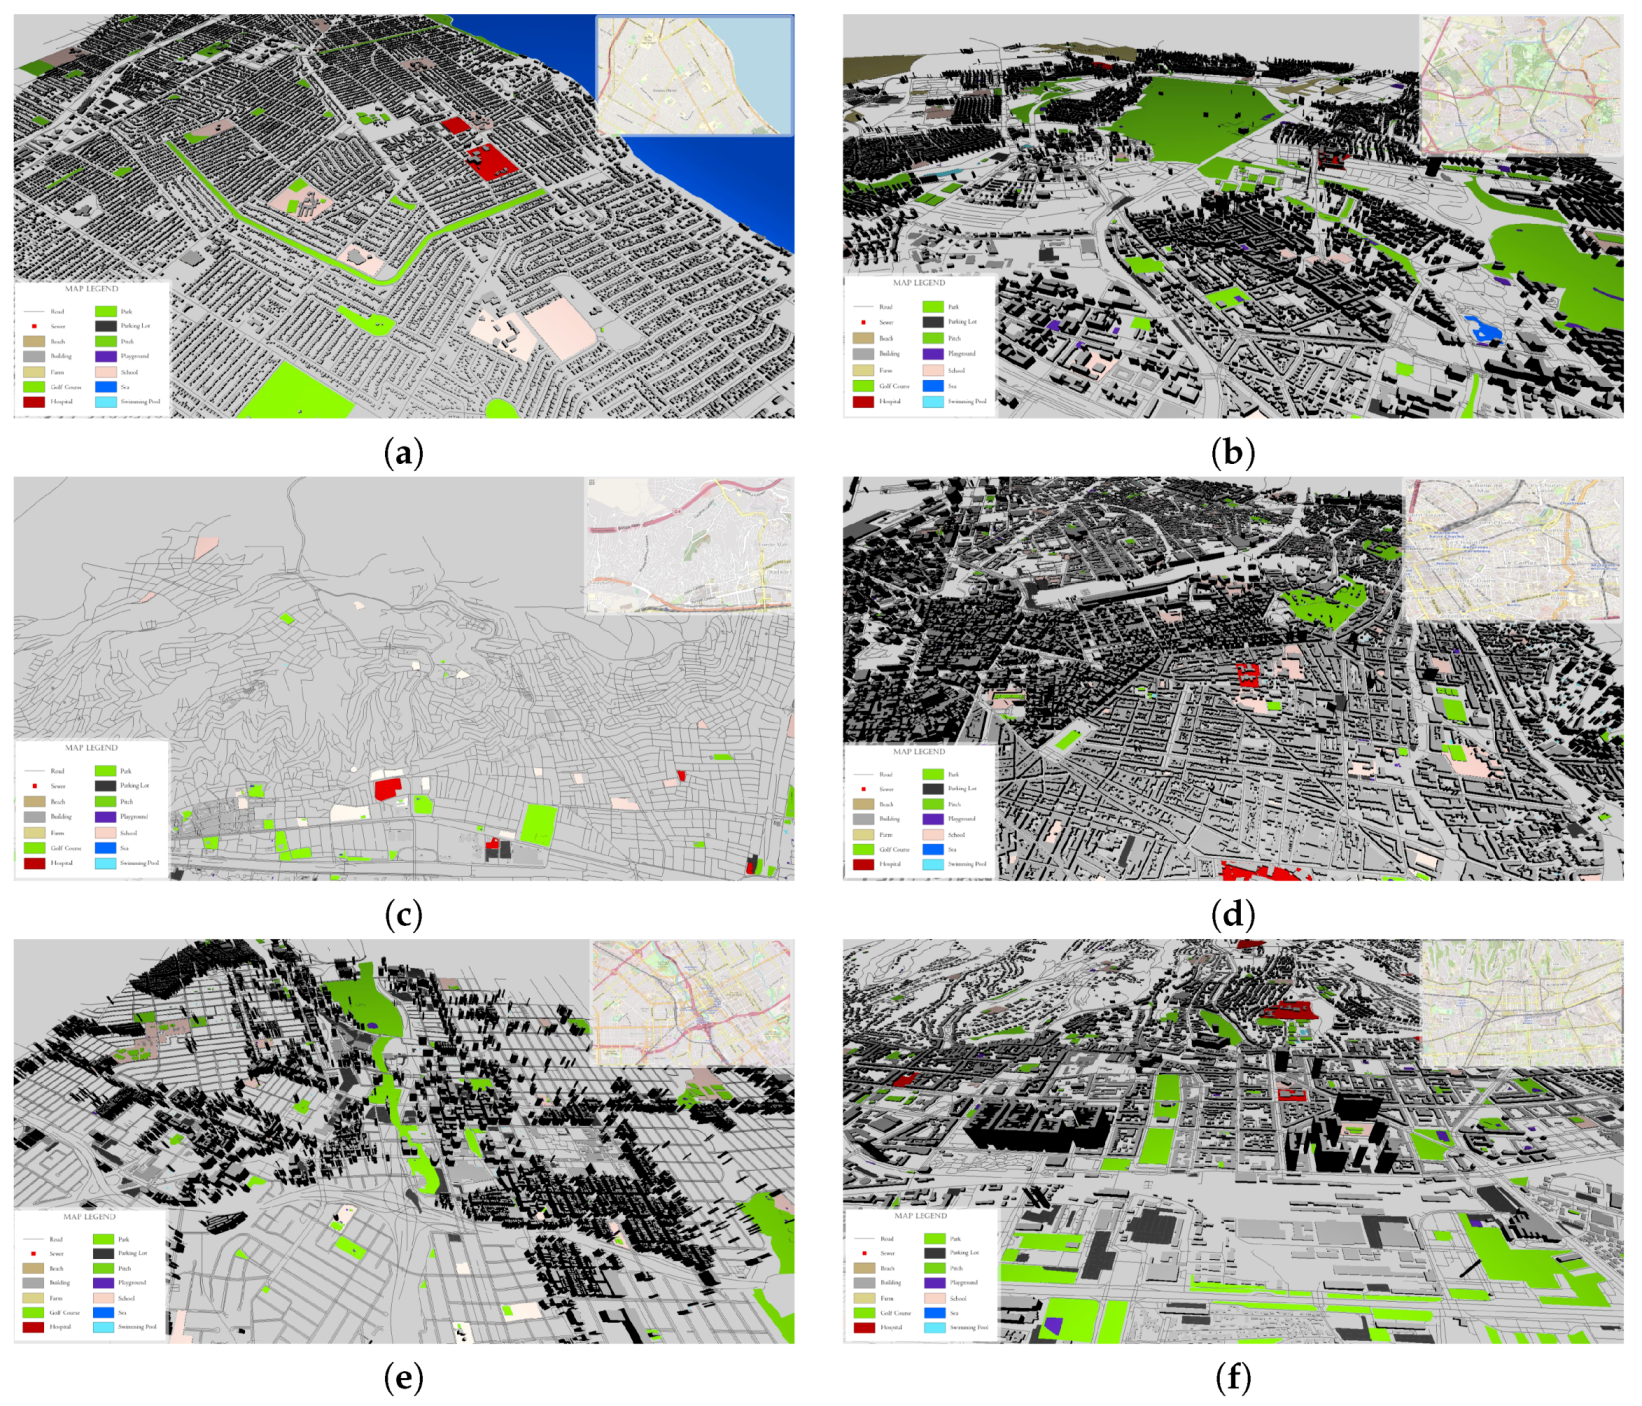
As underlined in
Section 3, reconstruction of cities were incomplete for some as they lacked appropriate information for accurate reconstruction of the environments in 3D. To account for such issues, techniques to extract 3D information from 2D satellite imagery or to utilize height values extracted from point clouds generated through LiDAR can be used and tested. Furthermore, national cadastre information, building blueprints acquired from the city database and other available land use information can be used to improve OSM data for 3D environment reconstruction purposes.
Another consideration for the City Maker is to integrate the environmental description to a web-based implementation for portability. Although it is mentioned that performance is a concern, an efficient implementation should be attempted, which could provide collaboration and automated generation of cities online. Through utilizing the efficient City Maker .cm files and using an online viewer, users would be able to work on their city models with ease. Consequently, web integration is considered for future work.
With such changes and further specifications of additional parameters, a generalized system can be attempted and crowdsourced data, as presented in this work, provide a lot of opportunities, given certain calibration and data enhancements are implemented by professionals and practitioners.


