Trip Extraction of Shared Electric Bikes Based on Multi-Rule-Constrained Homomorphic Linear Clustering Algorithm

Abstract
:1. Introduction
2. Methodology
3. Experimental Data and Results
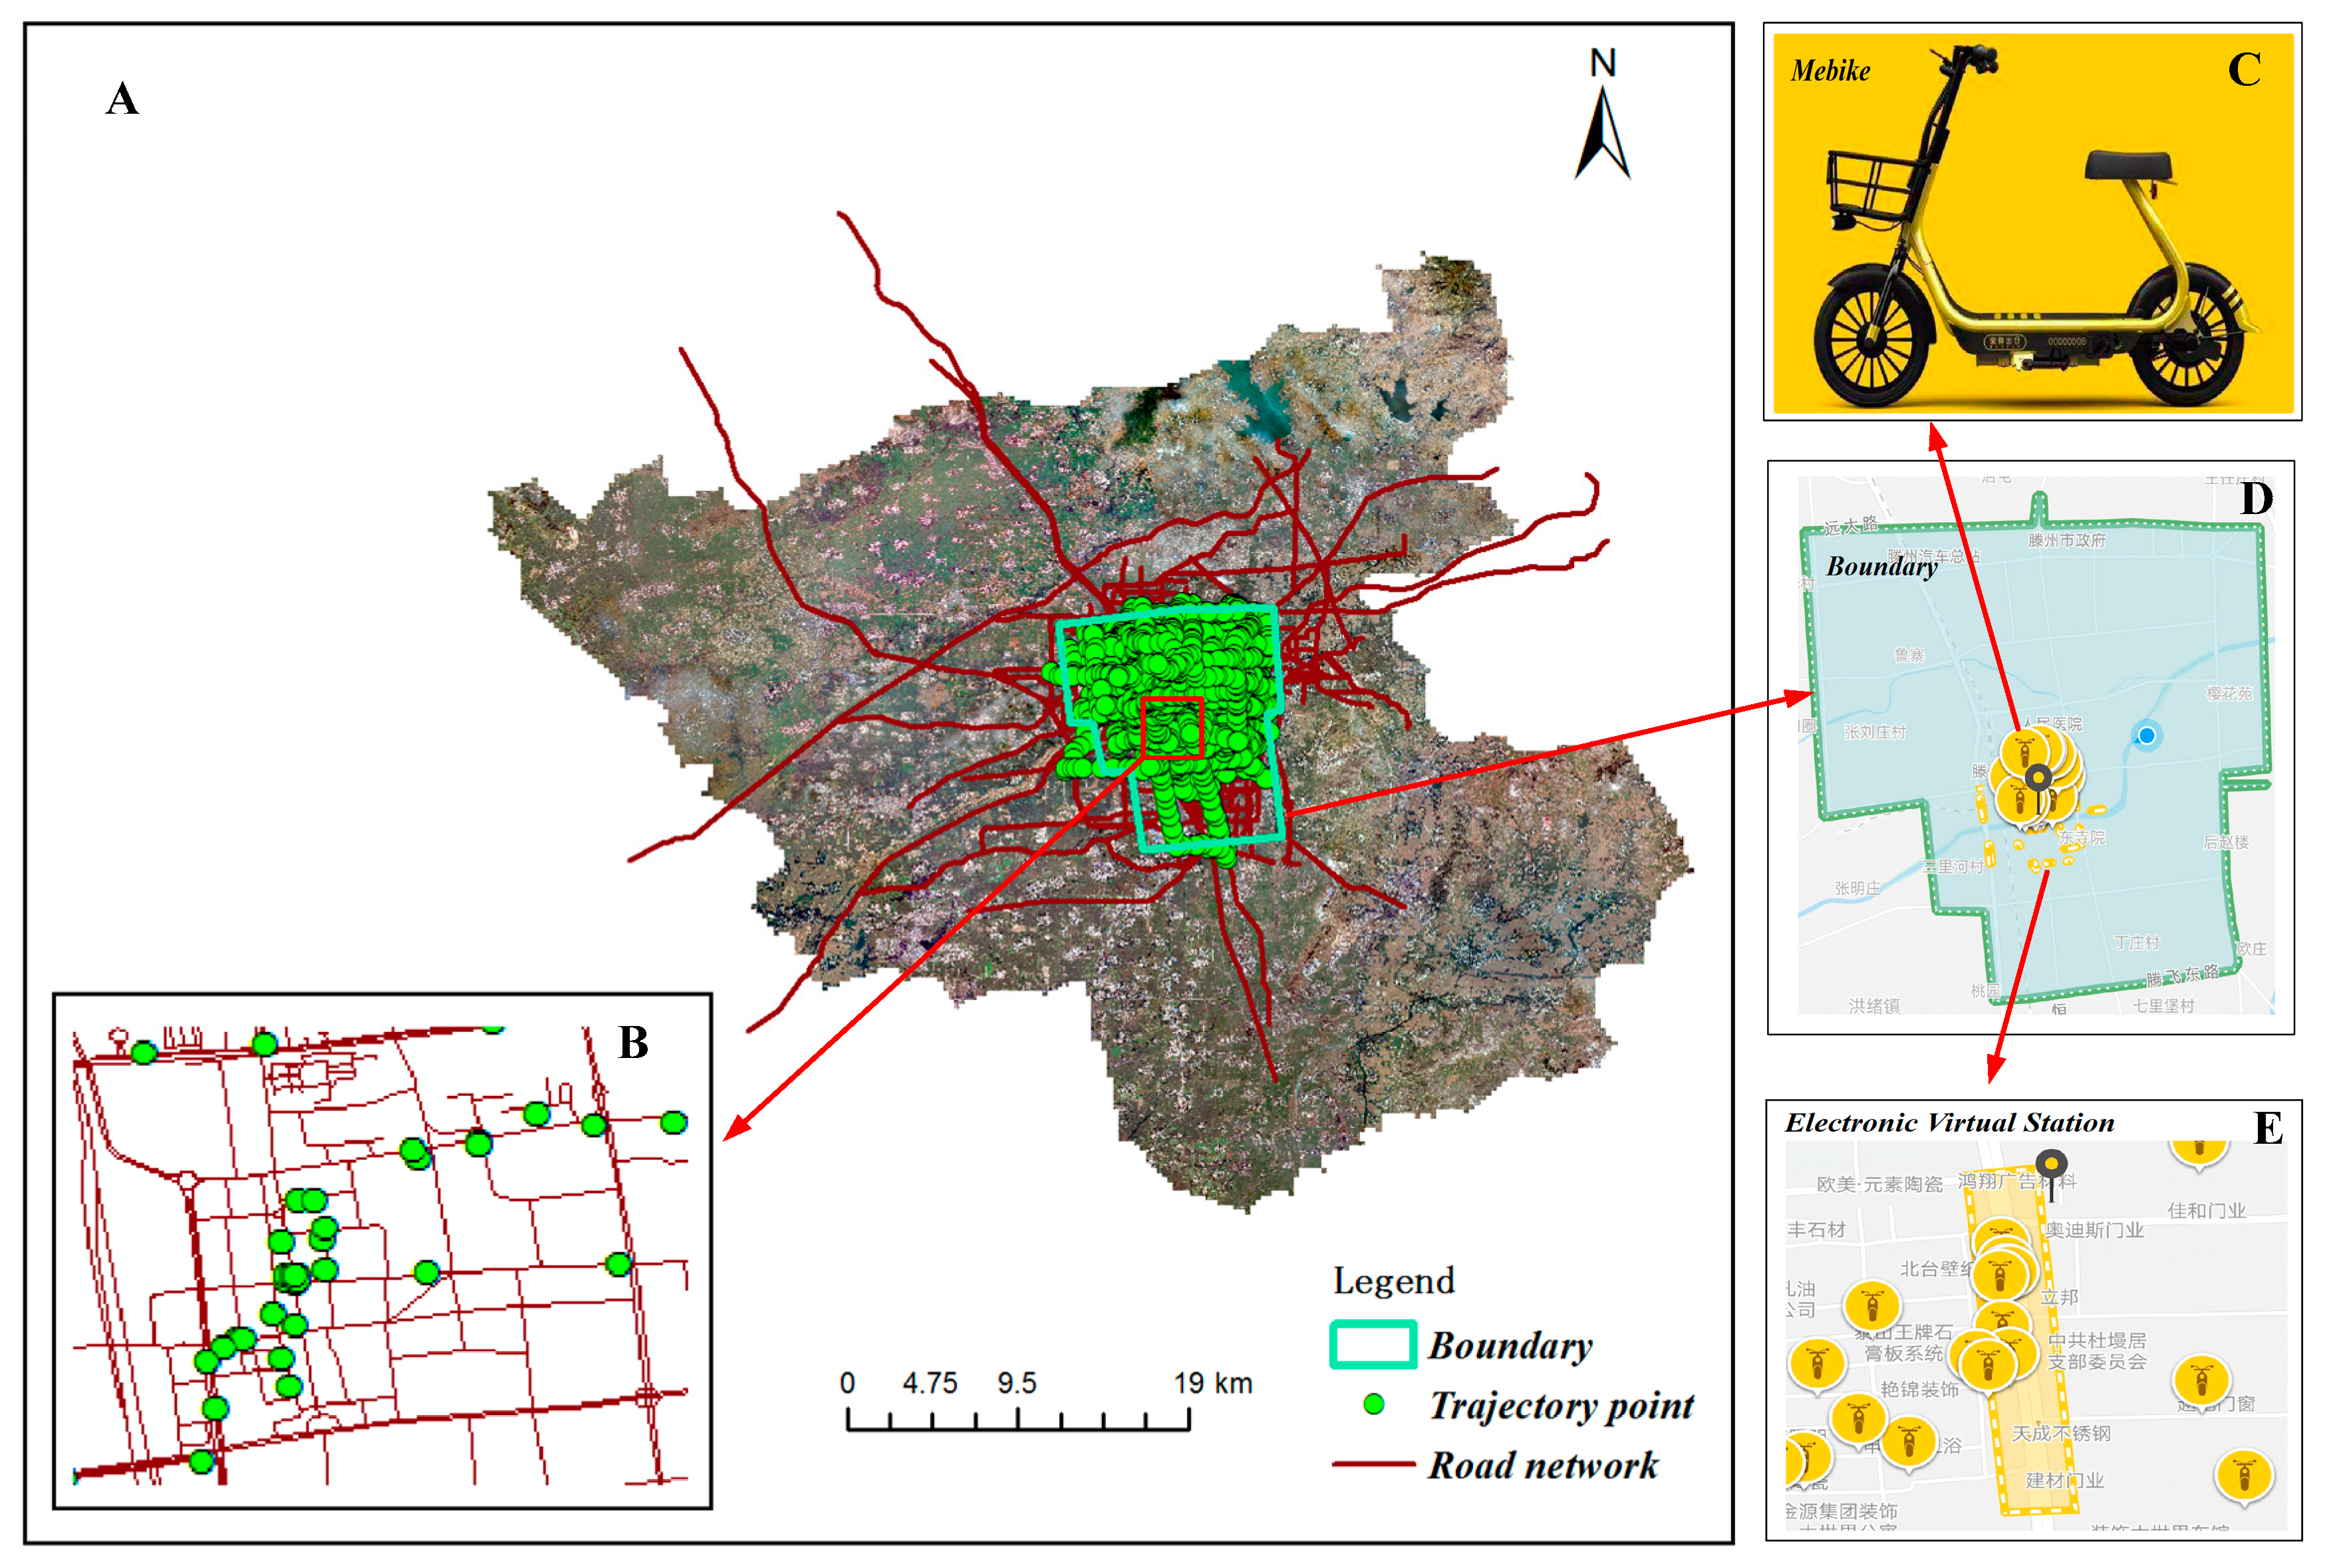
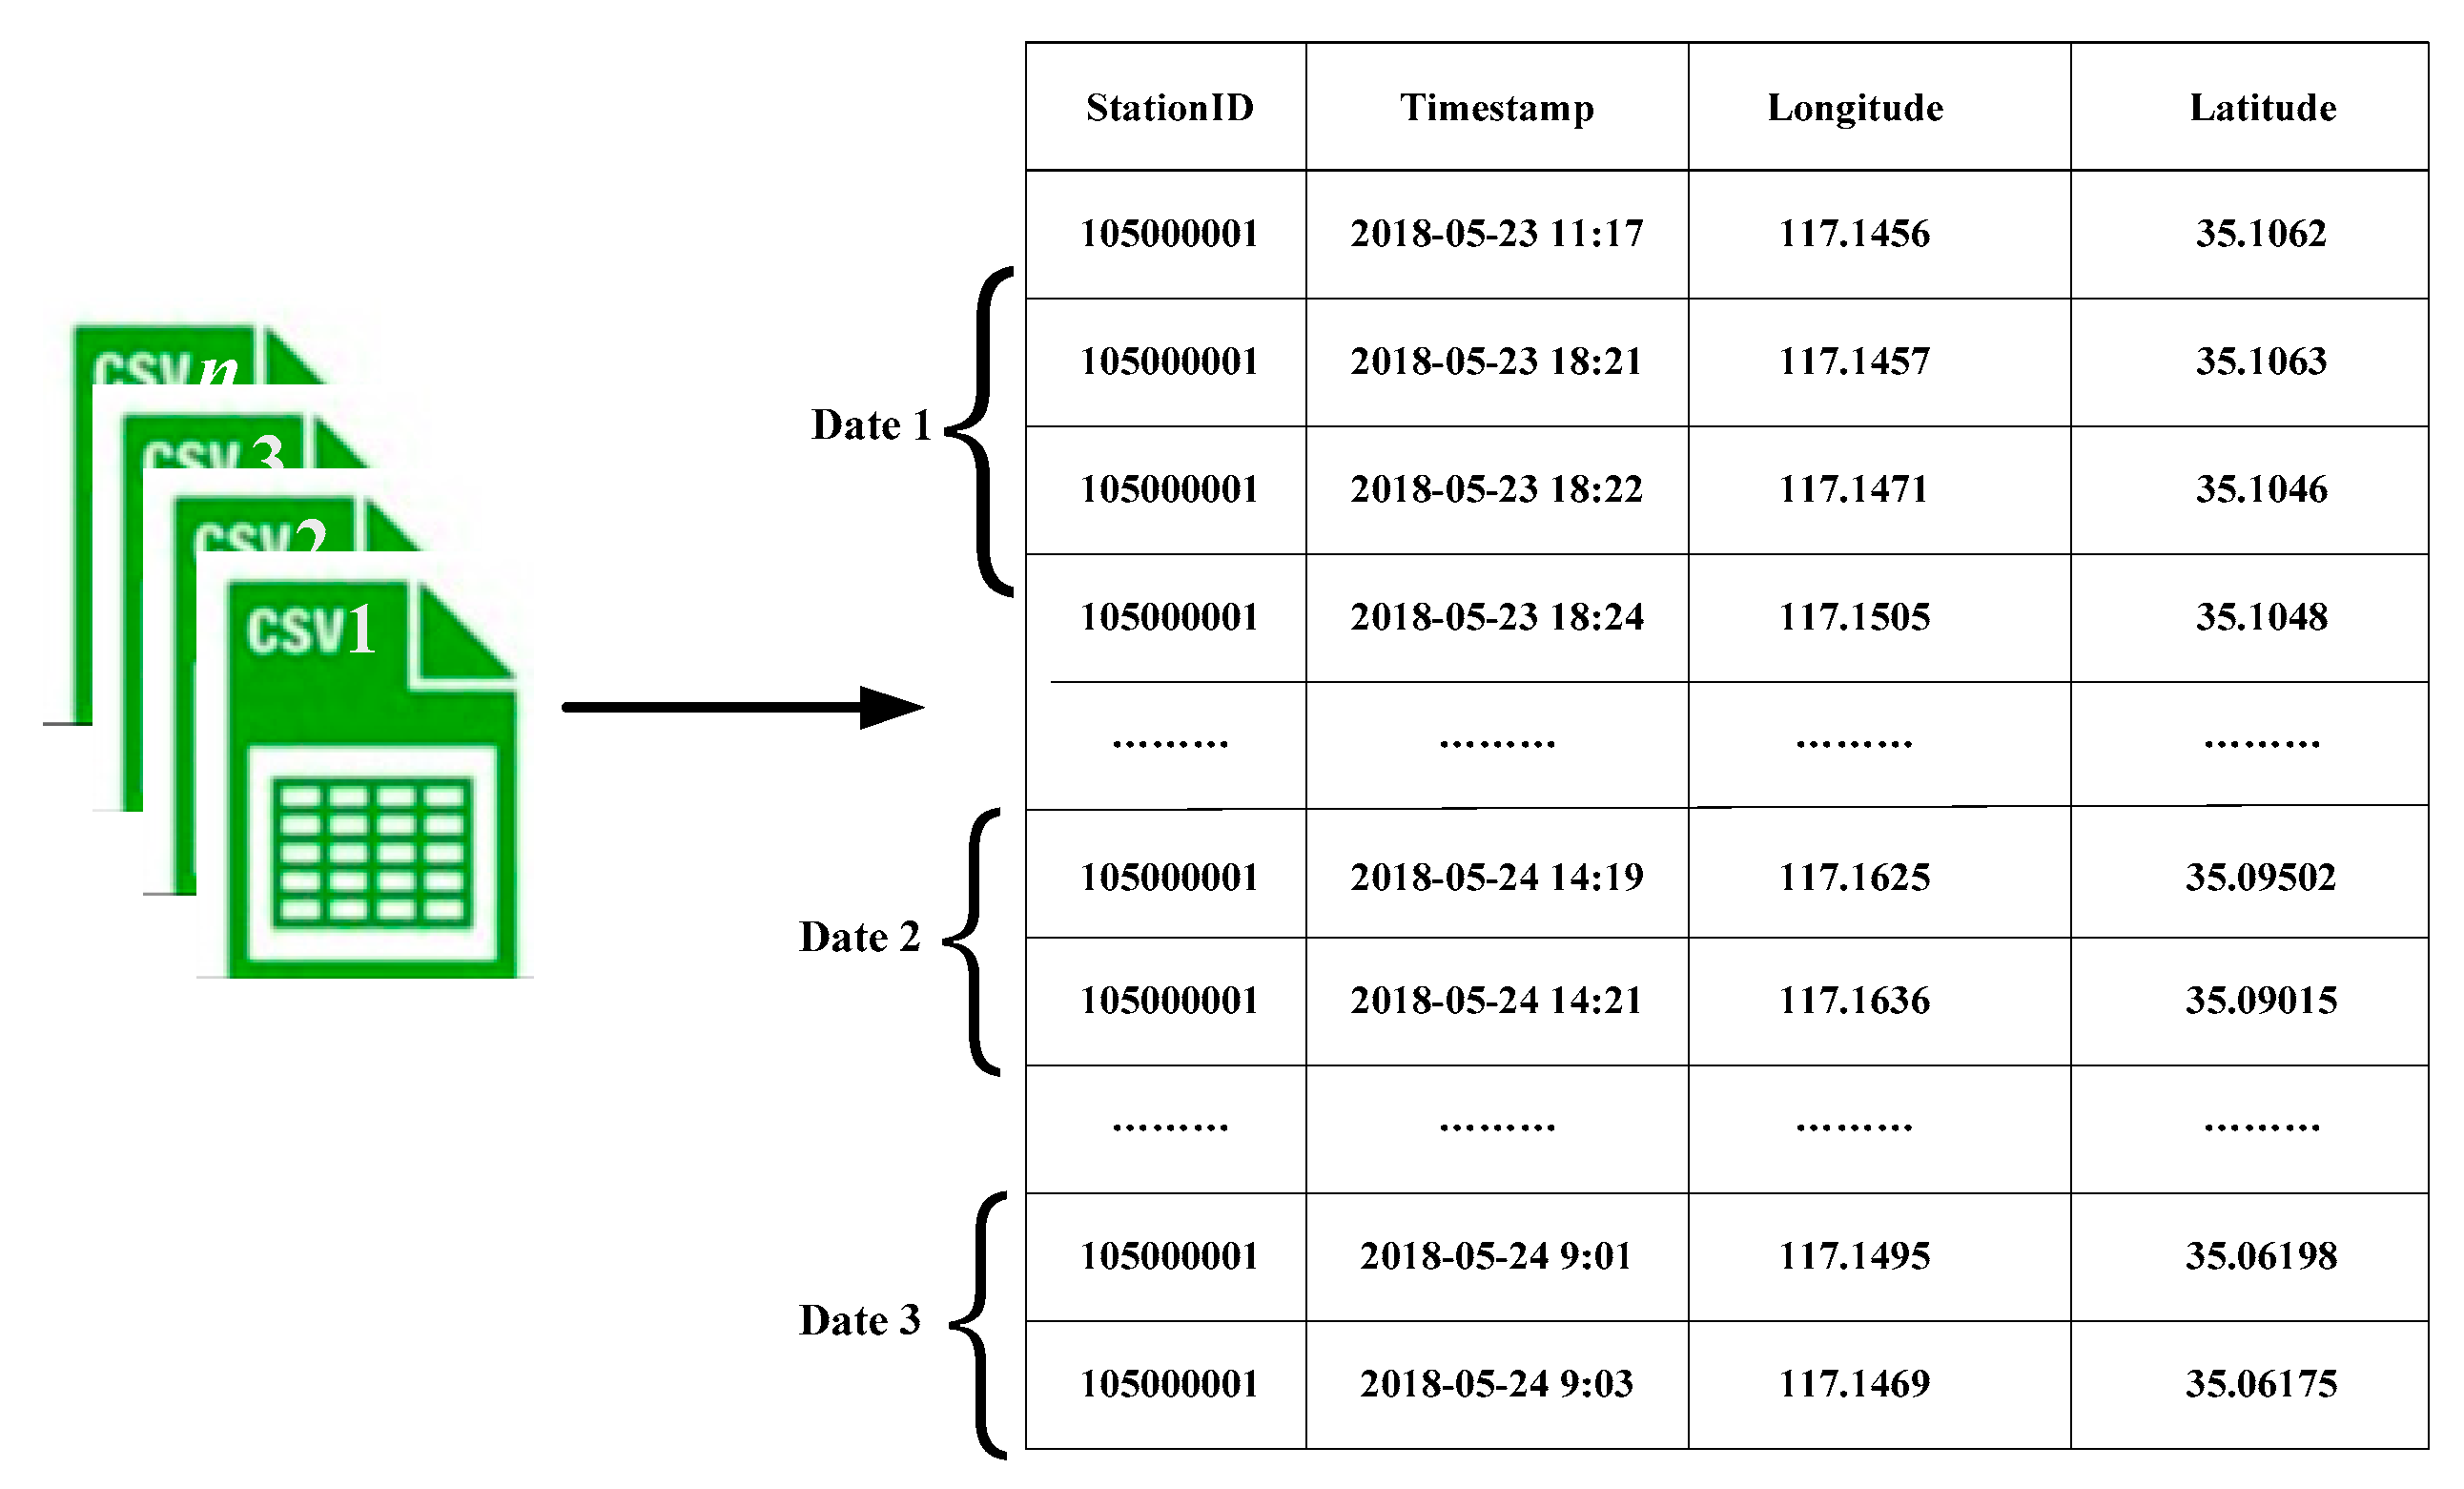
3.1. Experimental Data
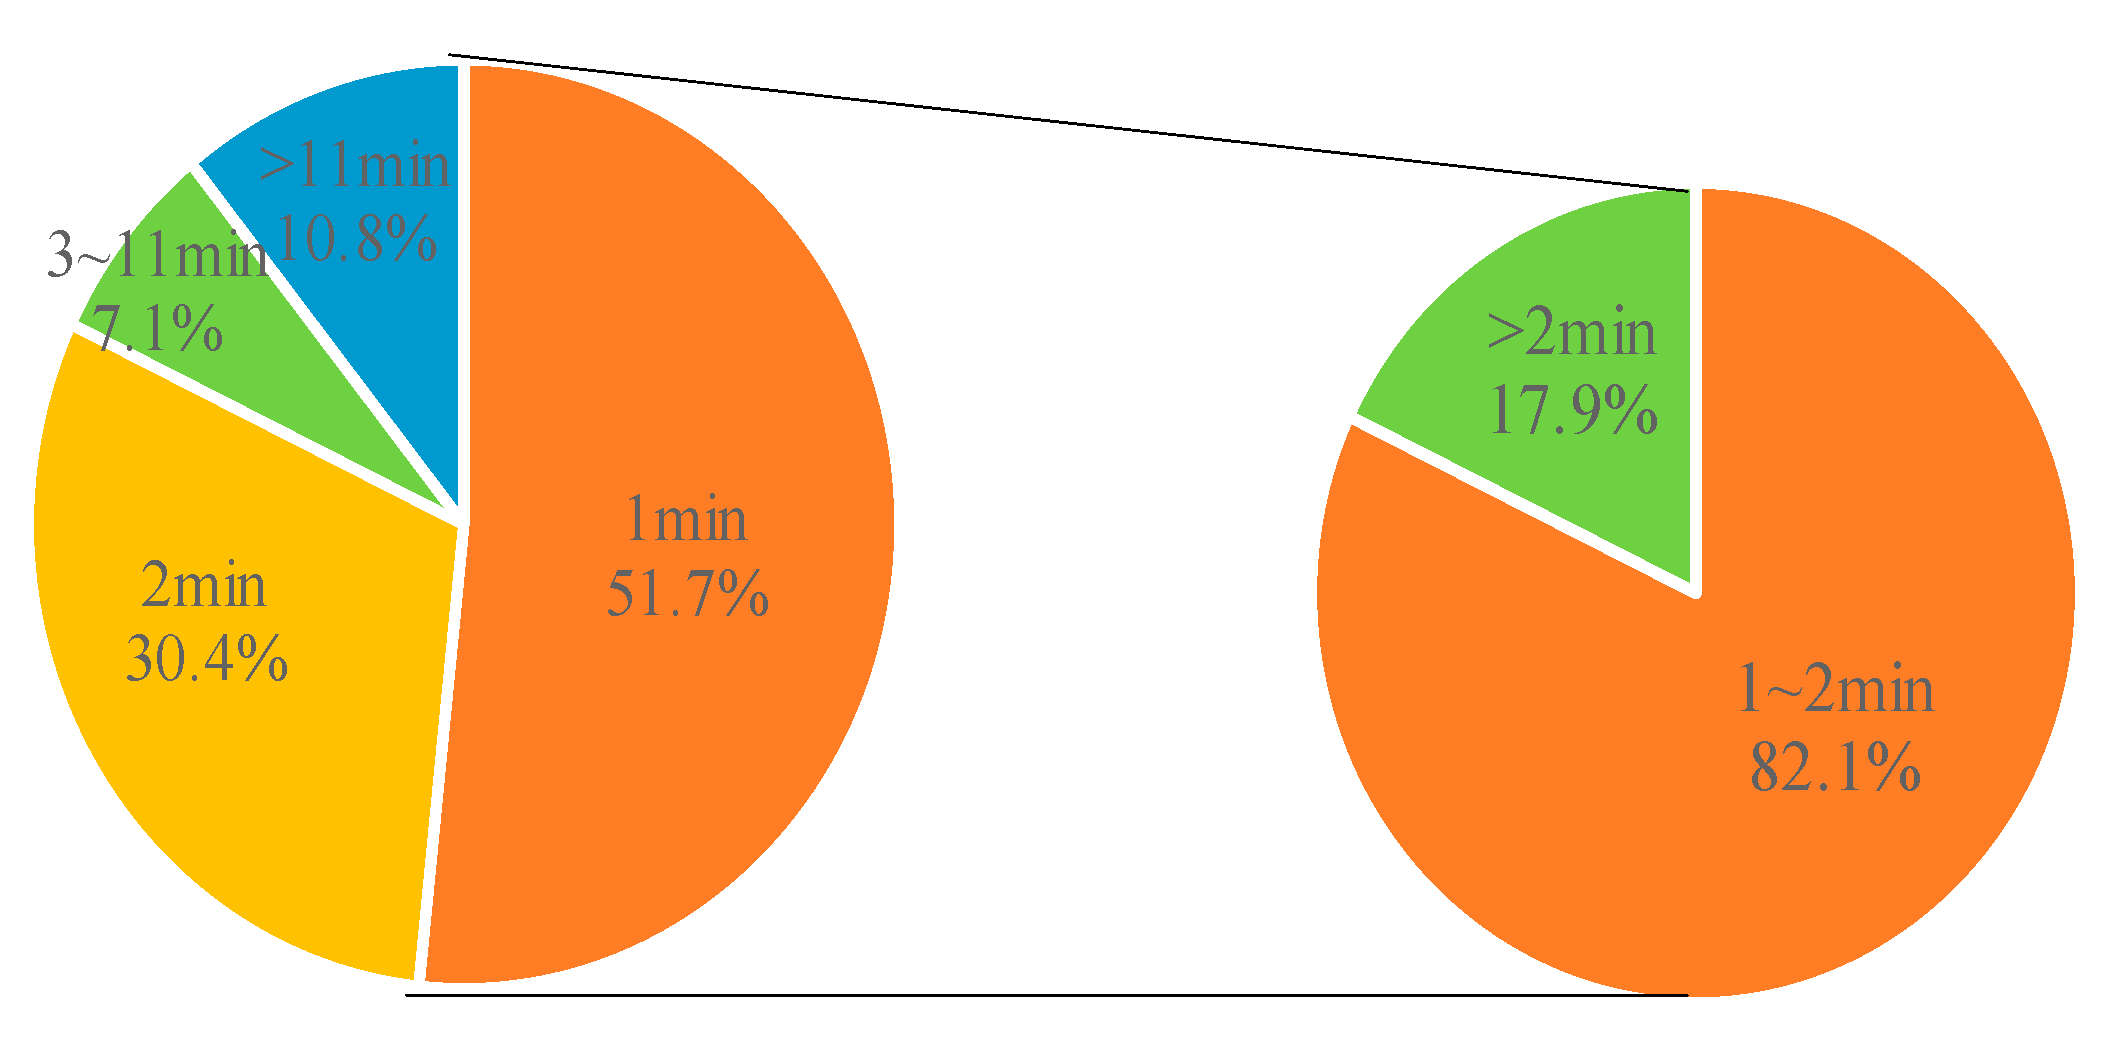
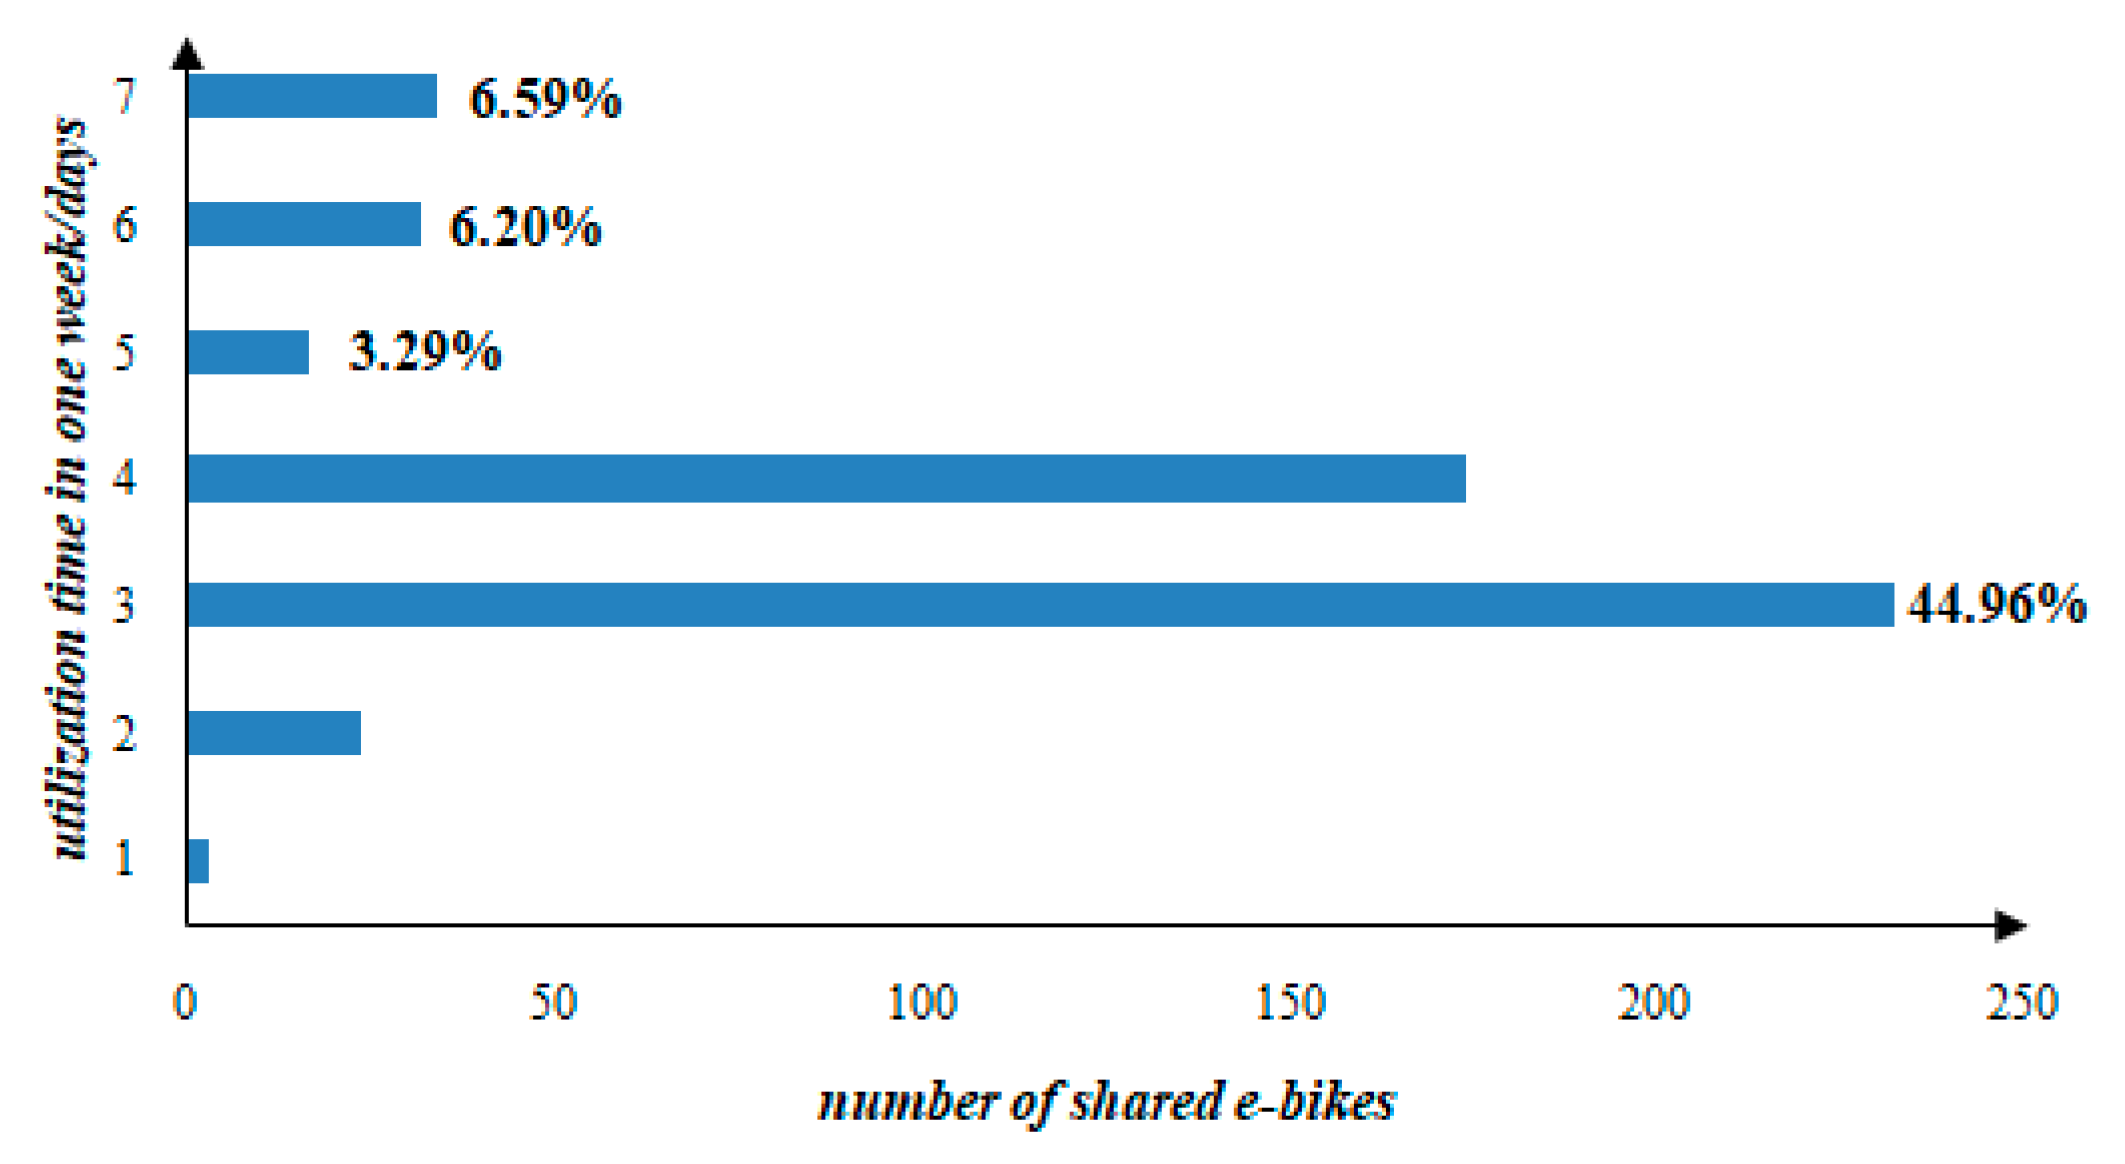
3.2. Experimental Results
4. Discussion
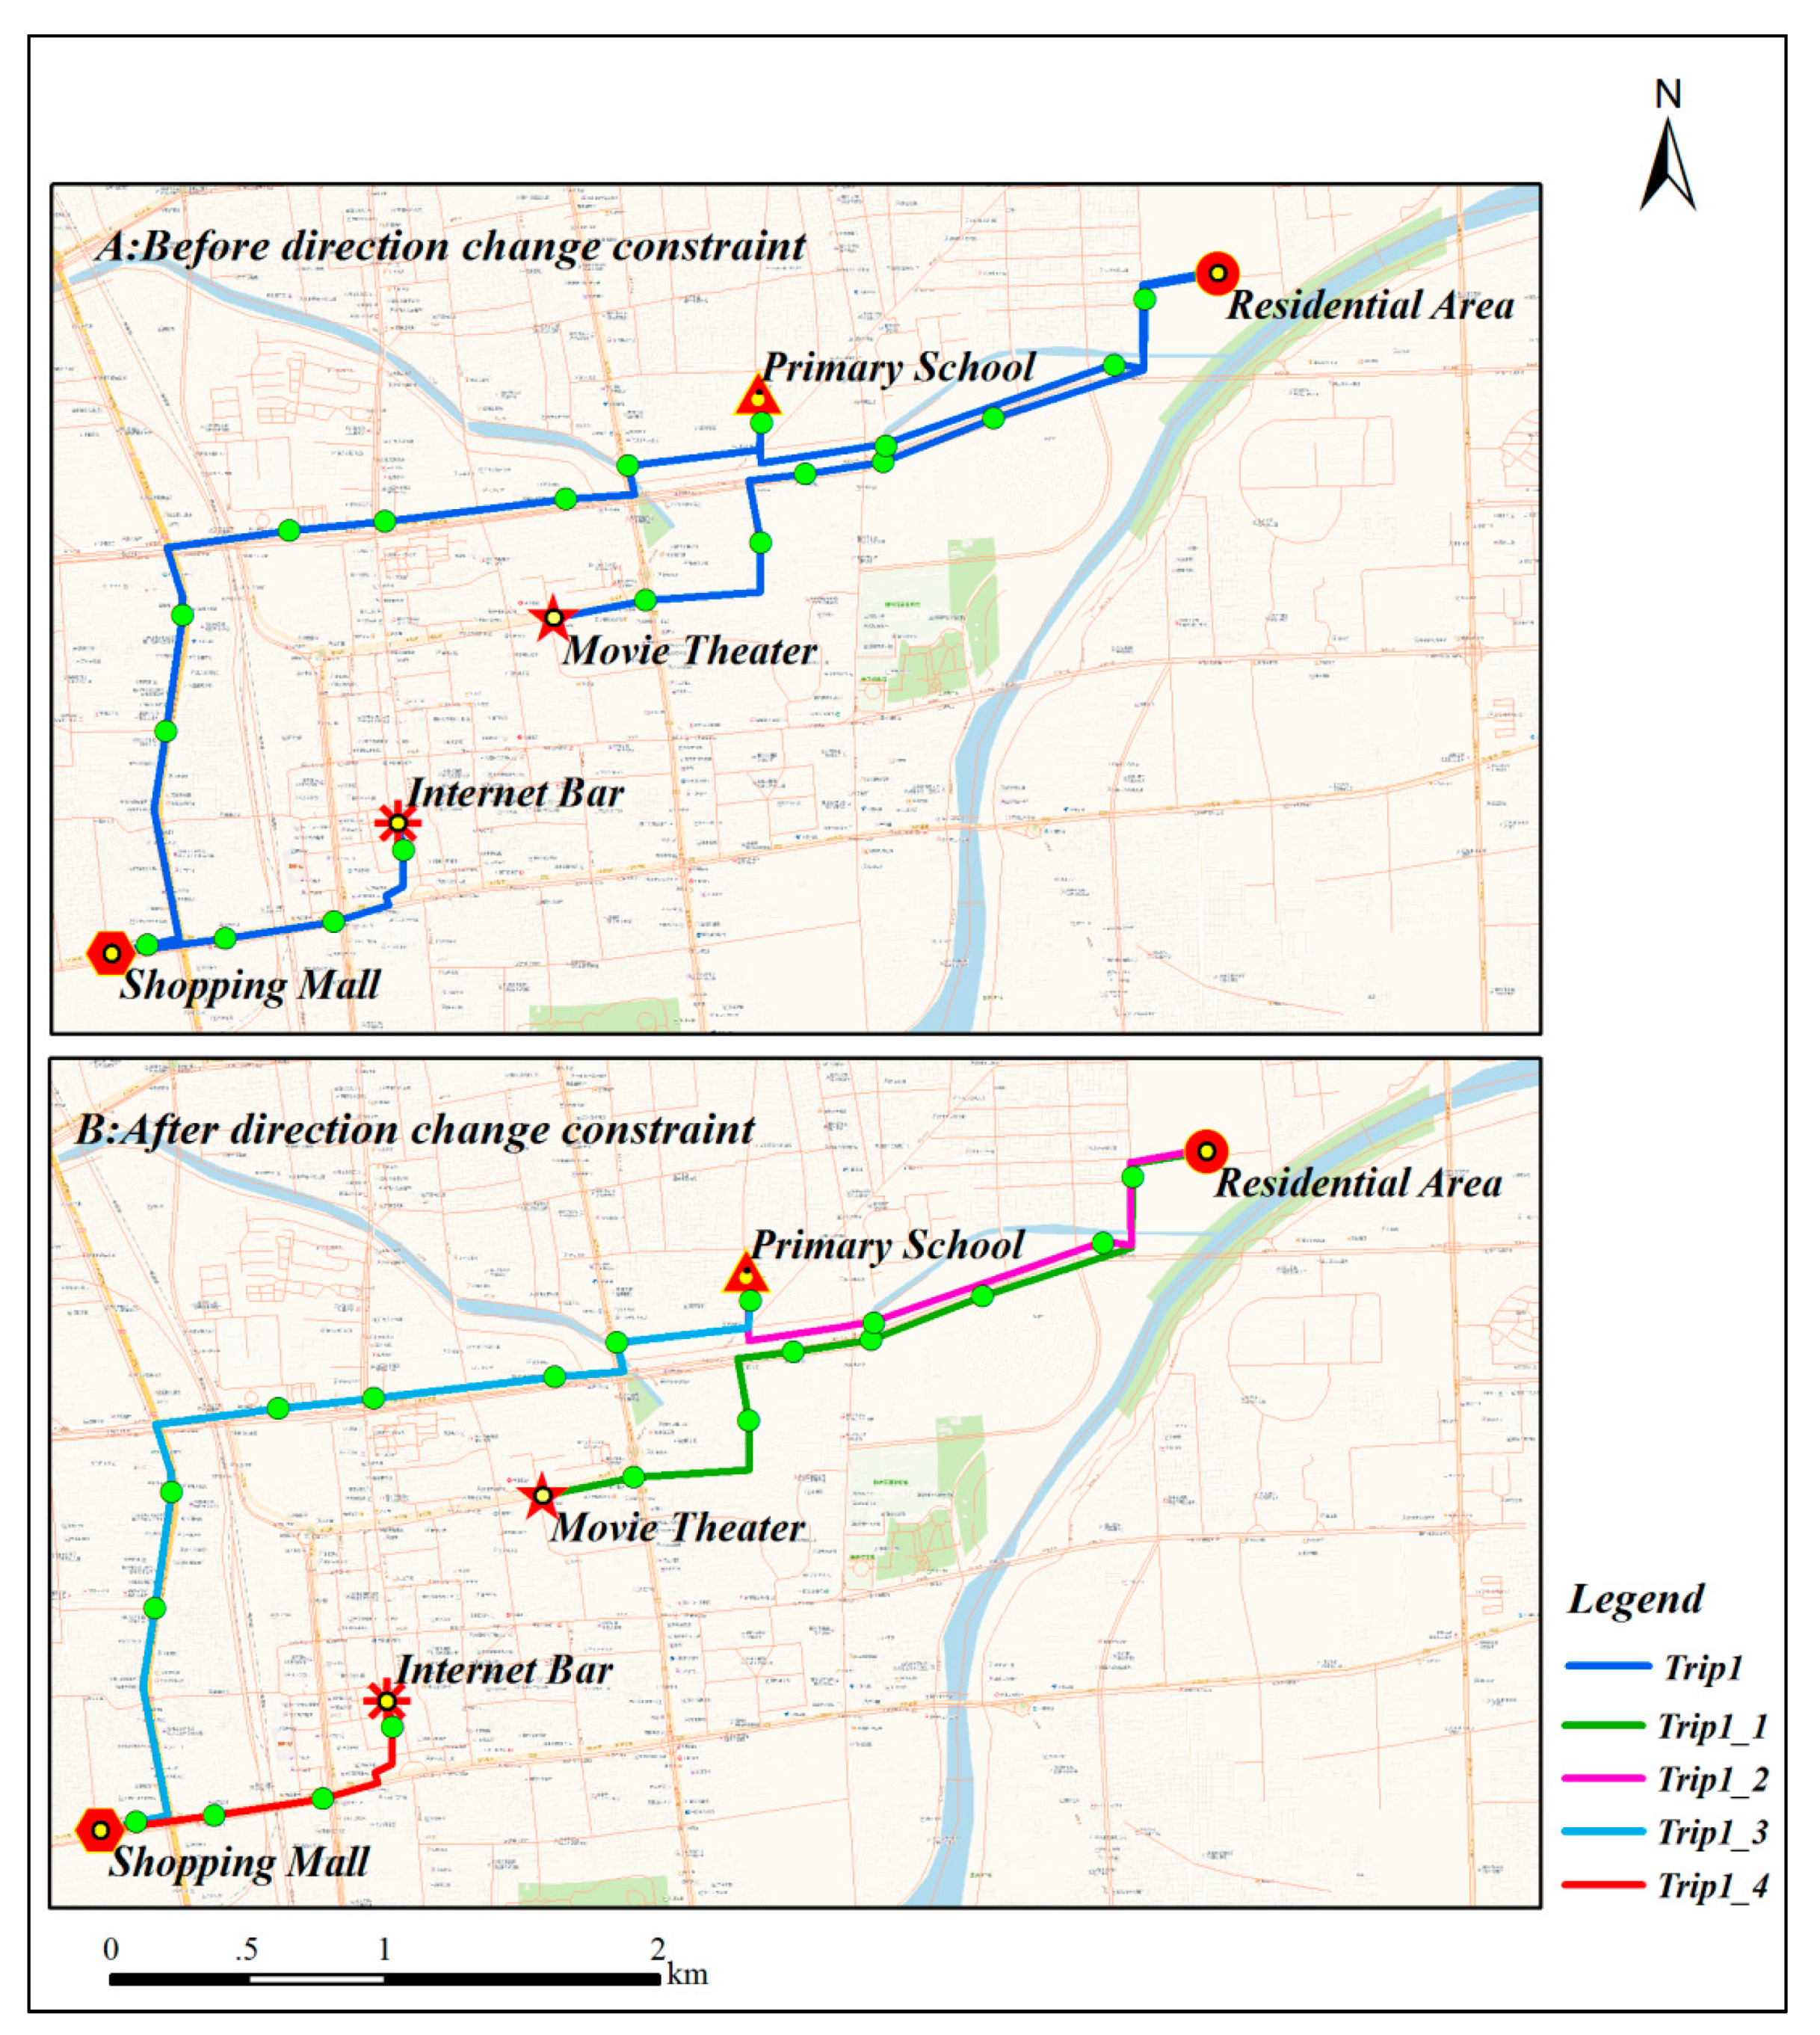
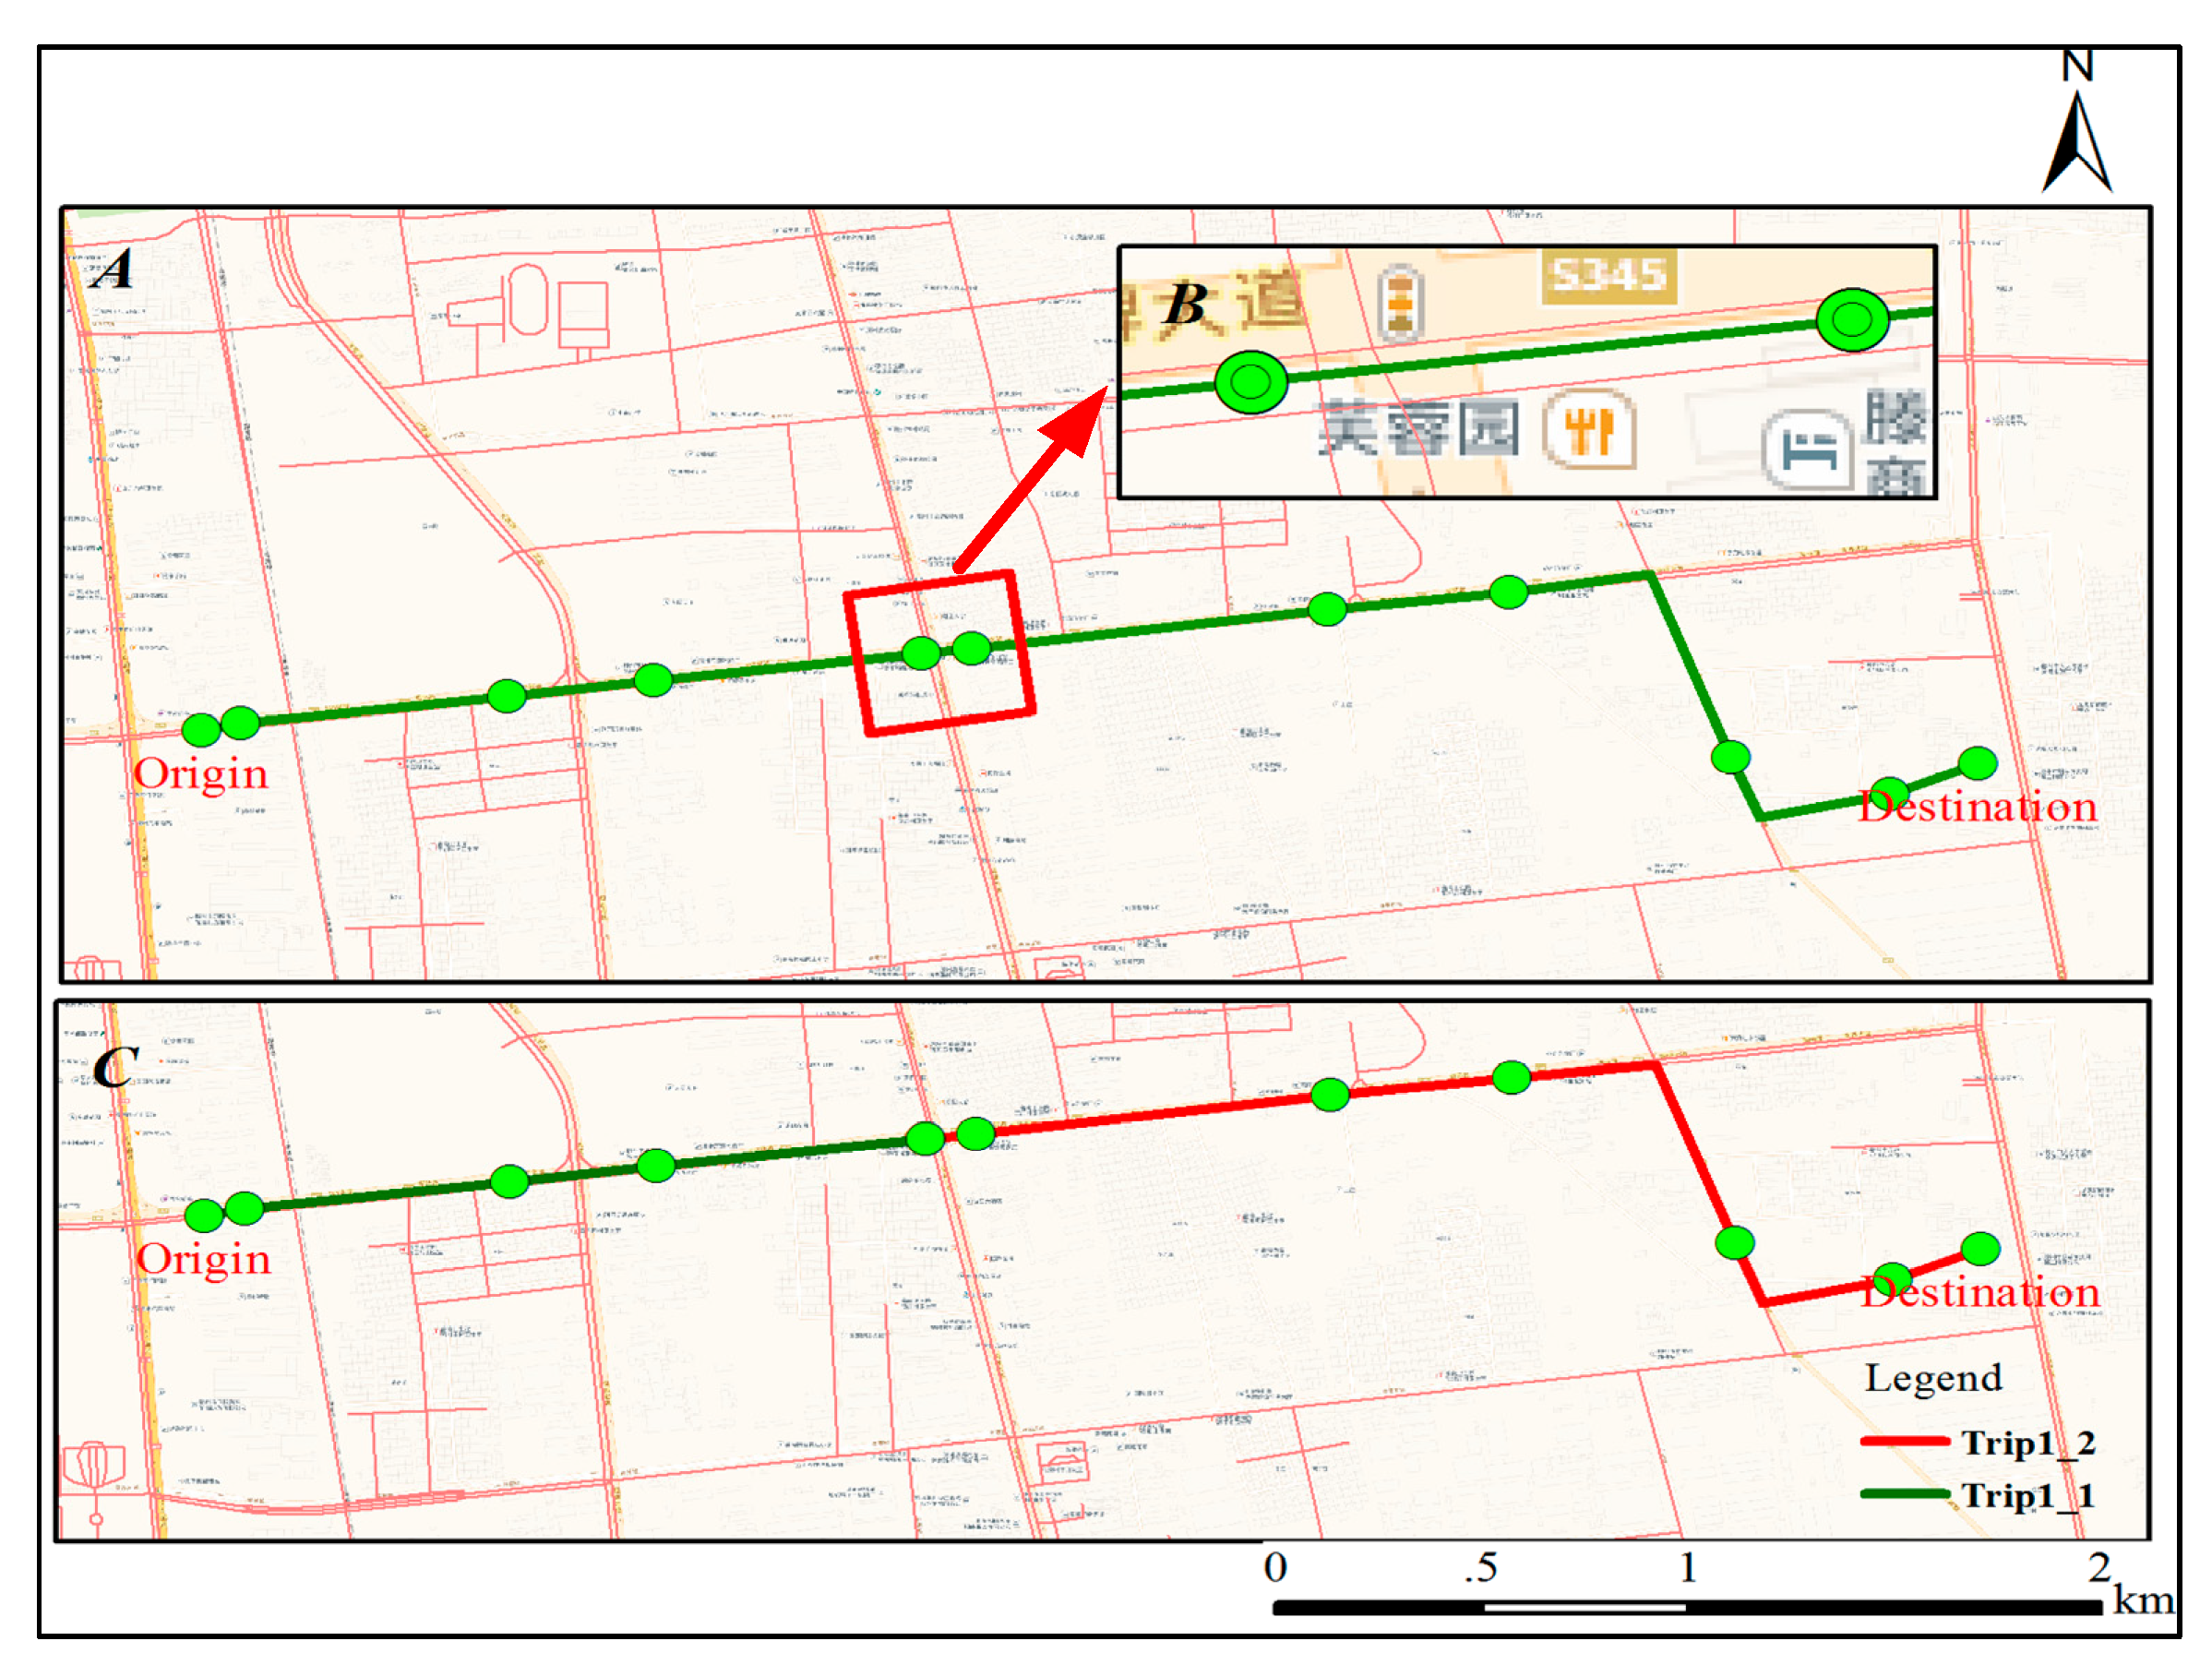
4.1. The Roles of the Directional Change Constraint and Contextual Constraint
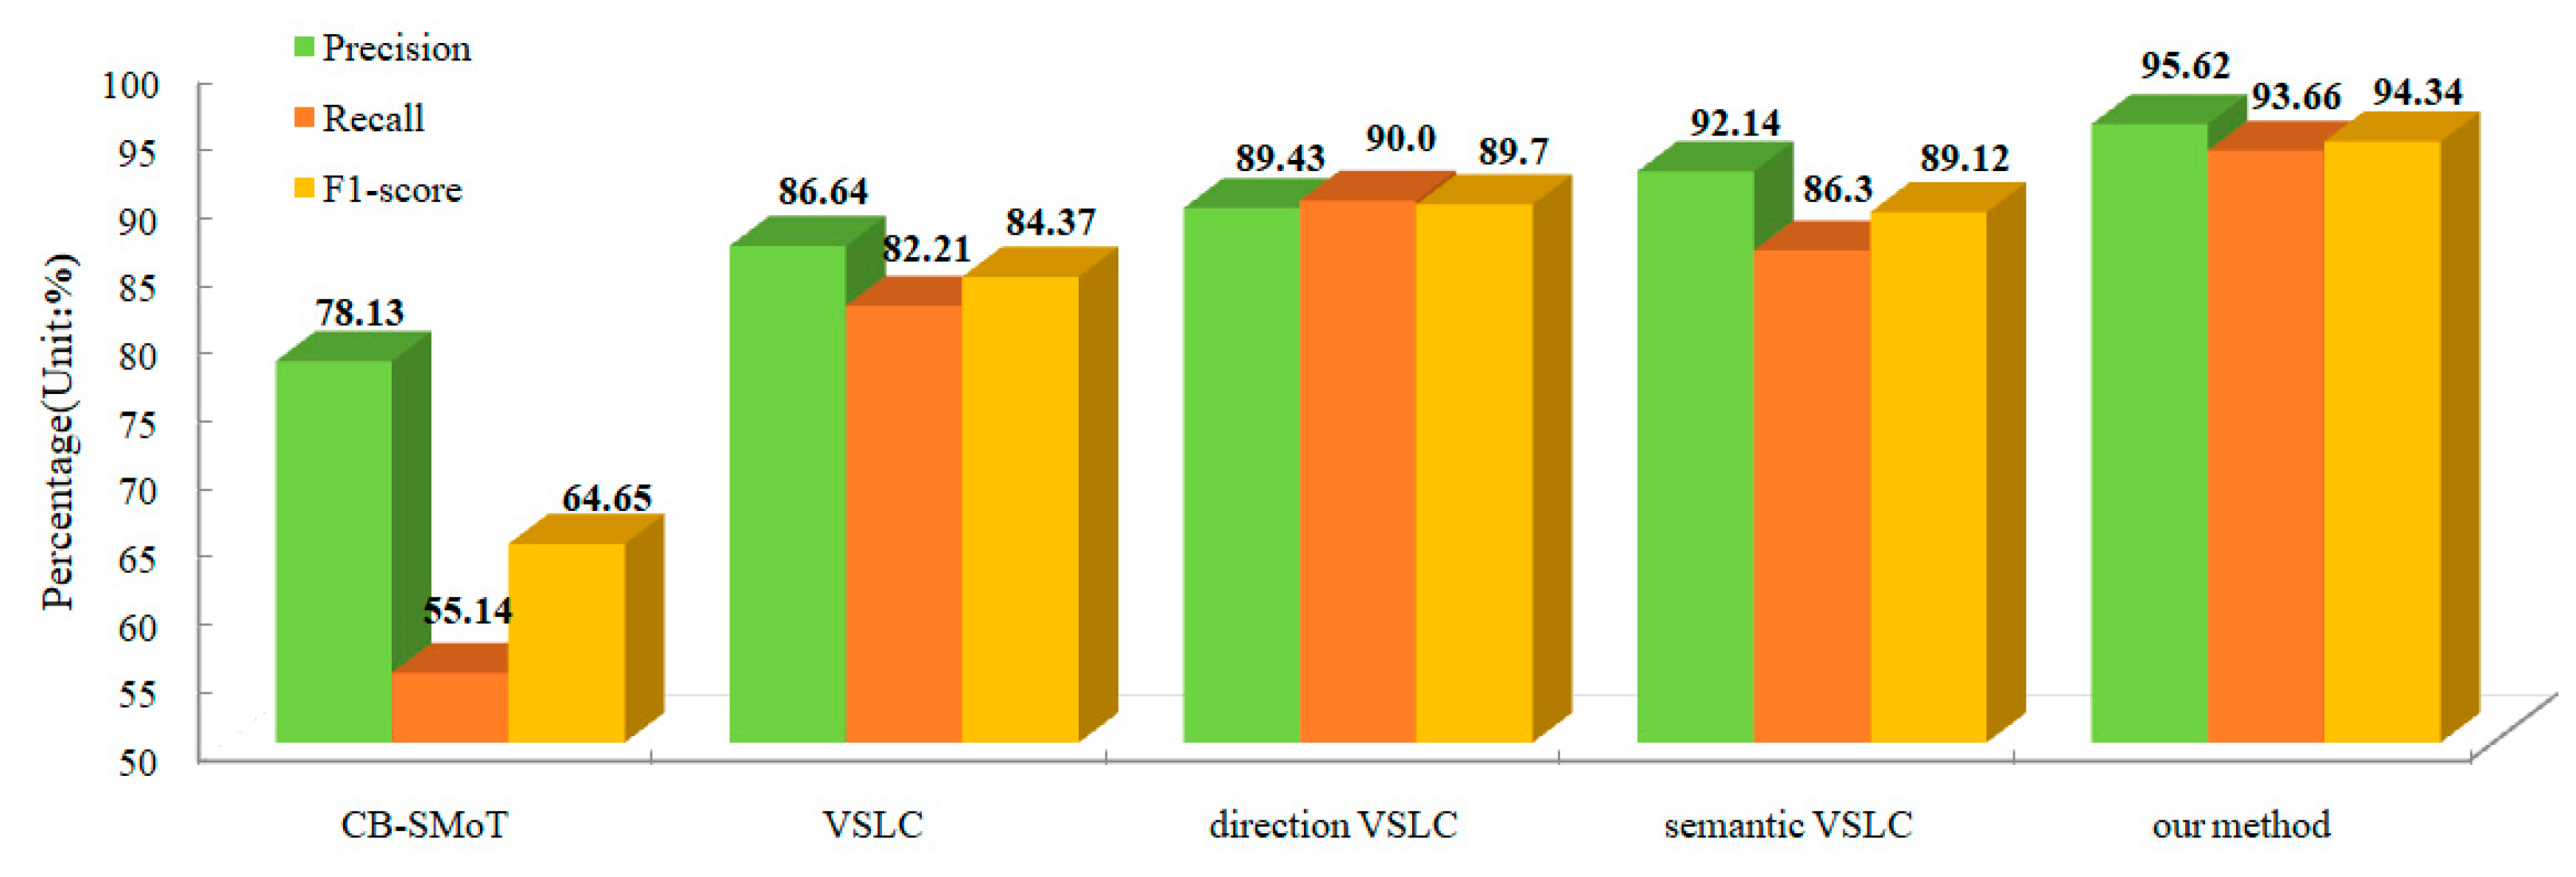
4.2. Comparison of the Different Methods
5. Conclusions
Author Contributions
Funding
Acknowledgments
Conflicts of Interest
References
- Mou, N.; Zhang, H.; Chen, J.; Zhang, L.; Dai, H. A Review on the Application Research of Trajectory Data Mining in Urban Cities. J. Geo-Inf. Sci. 2015, 17, 1136–1142. [Google Scholar]
- Zheng, Y. Trajectory Data Mining: An Overview. ACM Trans. Intell. Syst. Technol. 2015, 6, 1–41. [Google Scholar] [CrossRef]
- Jie, B.; He, T.; Ruan, S.; Li, Y.; Yu, Z. Planning Bike Lanes based on Sharing-Bikes’ Trajectories. In Proceedings of the ACM Sigkdd International Conference on Knowledge Discovery & Data Mining, Halifax, NS, Canada, 13–17 August 2017. [Google Scholar]
- Zhang, Y.; Mi, Z. Environmental benefits of bike sharing: A big data-based analysis. Appl. Energy 2018, 220, 296–301. [Google Scholar] [CrossRef]
- Kim, N.S.; Yook, D. Enhancing the economic benefit assessment of roadway investment through the application of value of time by trip length. Transp. Policy 2018, 68, 28–36. [Google Scholar] [CrossRef]
- Yuan, N.J.; Zheng, Y.; Xie, X.; Wang, Y.; Xiong, H. Discovering Urban Functional Zones Using Latent Activity Trajectories. IEEE Trans. Knowl. Data Eng. 2015, 27, 712–725. [Google Scholar] [CrossRef]
- Zhang, X.; Li, W.; Zhang, F.; Liu, R.; Du, Z. Identifying Urban Functional Zones Using Public Bicycle Rental Records and Point-of-Interest Data. ISPRS Int. J. Geo-Inf. 2018, 12, 459. [Google Scholar] [CrossRef]
- Ai, T.; Yang, W. The detection of transport land-use data using crowdsourcing taxi trajectory. In Proceedings of the International Archives of the Photogrammetry, Remote Sensing and Spatial Information Sciences, Prague, Czech, 12–19 July 2016; Volume XLI-B8, pp. 785–788. [Google Scholar]
- Ying, Z.; Brussel, M.J.G.; Thomas, T.; Maarseveen, M.F.A.M.V. Mining bike-sharing travel behavior data: An investigation into trip chains and transition activities. Comput. Environ. Urban Syst. 2018, 69, 39–50. [Google Scholar]
- Yu, L.; Wang, F.; Yu, X.; Song, G. Urban land uses and traffic ‘source-sink areas’: Evidence from GPS-enabled taxi data in Shanghai. Landsc. Urban Plan. 2012, 106, 73–87. [Google Scholar]
- Yu, Y.; He, Z.; Song, Z.; Xi’an, F.; Wang, C. Investigation on structural and spatial characteristics of taxi trip trajectory network in Xi’an, China. Phys. A Stat. Mech. Appl. 2018, 506, 755–766. [Google Scholar]
- Zhang, P.; Deng, M.; Shi, Y.; Zhao, L. Detecting hotspots of urban residents' behaviours based on spatio-temporal clustering techniques. GeoJournal 2017, 82, 1–13. [Google Scholar] [CrossRef]
- Zhao, P.; Qin, K.; Ye, X.; Wang, Y.; Chen, Y. A trajectory clustering approach based on decision graph and data field for detecting hotspots. Int. J. Geogr. Inf. Syst. 2016, 31, 27. [Google Scholar] [CrossRef]
- Zheng, L.; Dong, X.; Xin, Z.; Tan, L.; Hang, L.; Li, C.; Liu, W. Spatial-temporal travel pattern mining using massive taxi trajectory data. Phys. A Stat. Mech. Its Appl. 2018, 501, 24–41. [Google Scholar] [CrossRef]
- Luo, W.; Tan, H.; Lei, C.; Ni, L.M. Finding time period-based most frequent path in big trajectory data. In Proceedings of the ACM Sigmod International Conference on Management of Data (SIGMOD’13), New York, NY, USA, 22–27 June 2013. [Google Scholar]
- Xia, Y.; Wen, H.P.; Zhang, X. Hot route analysis method based on trajectory clustering. J. Chongqing Univ. Posts Telecommun. 2011, 23, 602–606. [Google Scholar]
- Yu, W. Discovering Frequent Movement Paths from Taxi Trajectory Data Using Spatially Embedded Networks and Association Rules. IEEE Trans. Intell. Transp. Syst. 2018, 20, 855–866. [Google Scholar] [CrossRef]
- Wang, W.-J.; Li, X.-M.; Jiao, P.-F.; Xu, G.-Q.; Yuan, N.; Yu, W. Exploring Intracity Taxi Mobility during the Holidays for Location-Based Marketing. Mob. Inf. Syst. 2017, 2017, 6310827. [Google Scholar] [CrossRef]
- Xi, Z.; Guo, D. Urban event detection with big data of taxi OD trips: A time series decomposition approach. Trans. GIS 2017, 21, 560–574. [Google Scholar]
- Gao, Q.L.; Li, Q.Q.; Yue, Y.; Zhuang, Y.; Chen, Z.P.; Kong, H. Exploring changes in the spatial distribution of the low-to-moderate income group using transit smart card data. Comput. Environ. Urban Syst. 2018, 72, 68–77. [Google Scholar] [CrossRef]
- Huang, J.; Levinson, D.; Wang, J.; Jin, H. Job-worker spatial dynamics in Beijing: Insights from Smart Card Data. Cities 2019, 86, 83–93. [Google Scholar] [CrossRef]
- Long, Y.; Thill, J.C. Combining smart card data and household travel survey to analyze jobs–housing relationships in Beijing. Comput. Environ. Urban Syst. 2015, 53, 19–35. [Google Scholar] [CrossRef]
- Krumm, J.; Horvitz, E. Predestination: Inferring Destinations from Partial Trajectories. In Proceedings of the 8th International Conference on Ubiquitous Computing (UbiComp 2006), Orange County, CA, USA, 17–21 September 2006; pp. 243–260. [Google Scholar]
- Du, J.; Aultman-Hall, L. Increasing the accuracy of trip rate information from passive multi-day GPS travel datasets: Automatic trip end identification issues. Transp. Res. Part A Policy Pract. 2007, 41, 220–232. [Google Scholar] [CrossRef]
- Li, Q.; Yu, Z.; Xing, X.; Chen, Y.; Liu, W.; Ma, W.Y. Mining user similarity based on location history. In Proceedings of the 16th ACM SIGSPATIAL International Conference on Advances in Geographic Information Systems (ACM GIS 2008), Irvine, CA, USA, 5–7 November 2008; pp. 298–307. [Google Scholar]
- Jia, T.; Ji, Z. Understanding the Functionality of Human Activity Hotspots from Their Scaling Pattern Using Trajectory Data. ISPRS Int. J. Geo Inf. 2017, 6, 341. [Google Scholar] [CrossRef]
- Spaccapietra, S.; Parent, C.; Damiani, M.L.; Macedo, J.A.D.; Porto, F.; Vangenot, C. A conceptual view on trajectories. Data Knowl. Eng. 2008, 65, 126–146. [Google Scholar] [CrossRef]
- Alvares, L.O.; Bogorny, V.; Kuijpers, B.; Moelans, B.; Vaisman, A. A model for enriching trajectories with semantic geographical information. In Proceedings of the 15th Annual ACM International Symposium on Advances in Geographic Information Systems, Seattle, WA, USA, 7–9 November 2007; pp. 162–169. [Google Scholar]
- Palma, A.T.; Bogorny, V.; Kuijpers, B.; Alvares, L.O. A clustering-based approach for discovering interesting places in trajectories. In Proceedings of the 23rd Annual ACM Symposium on Applied Computing (SAC’08), Fortaleza, Ceara, Brazil, 16–20 March 2008; pp. 863–868. [Google Scholar]
- Rocha, J.A.M.R.; Times, V.C.; Oliveira, G.; Alvares, L.O.; Bogorny, V. DB-SMoT: A direction-based spatio-temporal clustering method. In Proceedings of the 5th IEEE International Conference on Intelligent Systems, London, UK, 7–9 July 2010; pp. 114–119. [Google Scholar]
- Xiang, L.; Meng, G.; Tao, W. Extracting Stops from Noisy Trajectories: A Sequence Oriented Clustering Approach. ISPRS Int. J. Geo Inf. 2016, 5, 29. [Google Scholar] [CrossRef]
- Xiang, L.; Shao, X. Visualization and extraction of trajectory stops based on kernel-density. Cehui Xuebao 2016, 45, 1122–1131. [Google Scholar]
- Leiva, L.A.; Vidal, E. Warped K-means: An algorithm to cluster sequentially-distributed data. Inf. Sci. 2013, 237, 196–210. [Google Scholar] [CrossRef]
- Júnior, A.S.; Moreno, B.N.; Times, V.C.; Matwin, S.; Anjos Formiga Cabral, L.d. GRASP-UTS: An algorithm for unsupervised trajectory segmentation. Int. J. Geogr. Inf. Sci. 2015, 29, 46–68. [Google Scholar] [CrossRef]
- Junior, A.S.; Time, V.C.; Renso, C.; Matwin, S.; Cabral, L.A. A semi-supervised approach for the semantic segmentation of trajectories. In Proceedings of the 19th IEEE International Conference on Mobile Data Management (MDM 2018), Aalborg, Denmark, 25–28 June 2018; pp. 145–154. [Google Scholar]
- Ma, Y. Research on Residents Behavoir of Arrractive Areas and Spatio-temporal Feature Based on Taxi Trajectory Data—A Case of Kunshan City; Nanjing Norm University: Nanjing, China, 2014. [Google Scholar]
- Chris, V. Calculate Distance, Bearing and More Between Latitude/Longitude Points. Available online: http://www.movable-type.co.uk/scripts/latlong.html (accessed on 22 October 2019).
- Rob, G. Calculate the Distance between Two Points in Your Web Apps. Available online: https://www.htmlgoodies.com/beyond/javascript/calculate-the-distance-between-two-points-in-your-web-apps.html (accessed on 22 October 2019).
- Yang, W.; Tinghua, A.I. Refueling Stop Activity Detection and Gas Station Extraction Using Crowdsourcing Vehicle Trajectory Data. Cehui Xuebao 2017, 46, 918–927. [Google Scholar]
- Mobike Global. The Mobike White Paper: Bike Sharing and the City. Available online: https://mobike.com/global/public/Mobike%20-%20White%20Paper%202017_EN.pdf (accessed on 18 October 2019).
- Fishman, E.; Wei, H. Bikeshare: A Review of Recent Literature. Urban Transp. China 2016, 36, 92–113. [Google Scholar] [CrossRef]
- Rose, G. E-bikes and urban transportation: Emerging issues and unresolved questions. Transportation 2012, 39, 81–96. [Google Scholar] [CrossRef]
- Johnson, M.; Rose, G.; Johnson, M.; Rose, G. Extending life on the bike: Electric bike use by older Australians. J. Transp. Health 2015, 2, 276–283. [Google Scholar] [CrossRef]
- Inagaki, T.; Mimura, Y.; Ando, R. An Analysis on Excursion Characteristics of Electric Assist Bicycles by Travel Behavioral Comparison Based on Trajectory Data. In Proceedings of the 15th International IEEE Conference on Intelligent Transportation Systems (ITSC 2012), Anchorage, AK, USA, 16–19 September 2012; pp. 433–437. [Google Scholar]
- Cherry, C.; Cervero, R. Use characteristics and mode choice behavior of electric bike users in China. Transp. Policy 2007, 14, 247–257. [Google Scholar] [CrossRef]
- Cherry, C.R.; Yang, H.; Jones, L.R.; Min, H. Dynamics of electric bike ownership and use in Kunming, China. Transp. Policy 2016, 45, 127–135. [Google Scholar] [CrossRef]
- Lopez, A.J.; Astegiano, P.; Gautama, S.; Ochoa, D.; Tampère, C.M.J.; Beckx, C. Unveiling E-Bike Potential for Commuting Trips from GPS Traces. ISPRS Int. J. Geo Inf. 2017, 6, 190. [Google Scholar] [CrossRef]
- Campbell, A.A.; Cherry, C.R.; Ryerson, M.S.; Yang, X. Factors influencing the choice of shared bicycles and shared electric bikes in Beijing. Transp. Res. Part C Emerg. Technol. 2016, 67, 399–414. [Google Scholar] [CrossRef]
- Li, C.; Dai, Z.; Peng, W.; Shen, J. Green Travel Mode: Trajectory Data Cleansing Method for Shared Electric Bicycles. Sustainability 2019, 11, 1429. [Google Scholar] [CrossRef] [Green Version]
- Yuan, J.; Zheng, Y.; Zhang, C.; Xie, X.; Sun, G. An Interactive-Voting Based Map Matching Algorithm. In Proceedings of the 11th IEEE International Conference on Mobile Data Management (MDM 2010), Kansas City, MO, USA, 23–26 May 2010. [Google Scholar]


| Parameter | Description | Default Value |
|---|---|---|
| Min_Move | The minimum duration for a normal move | 4 min |
| Min_Stop | The minimum duration for a normal stop | 3 min |
| Direction_Diff | The angle of the direction change between adjacent points | 180° |
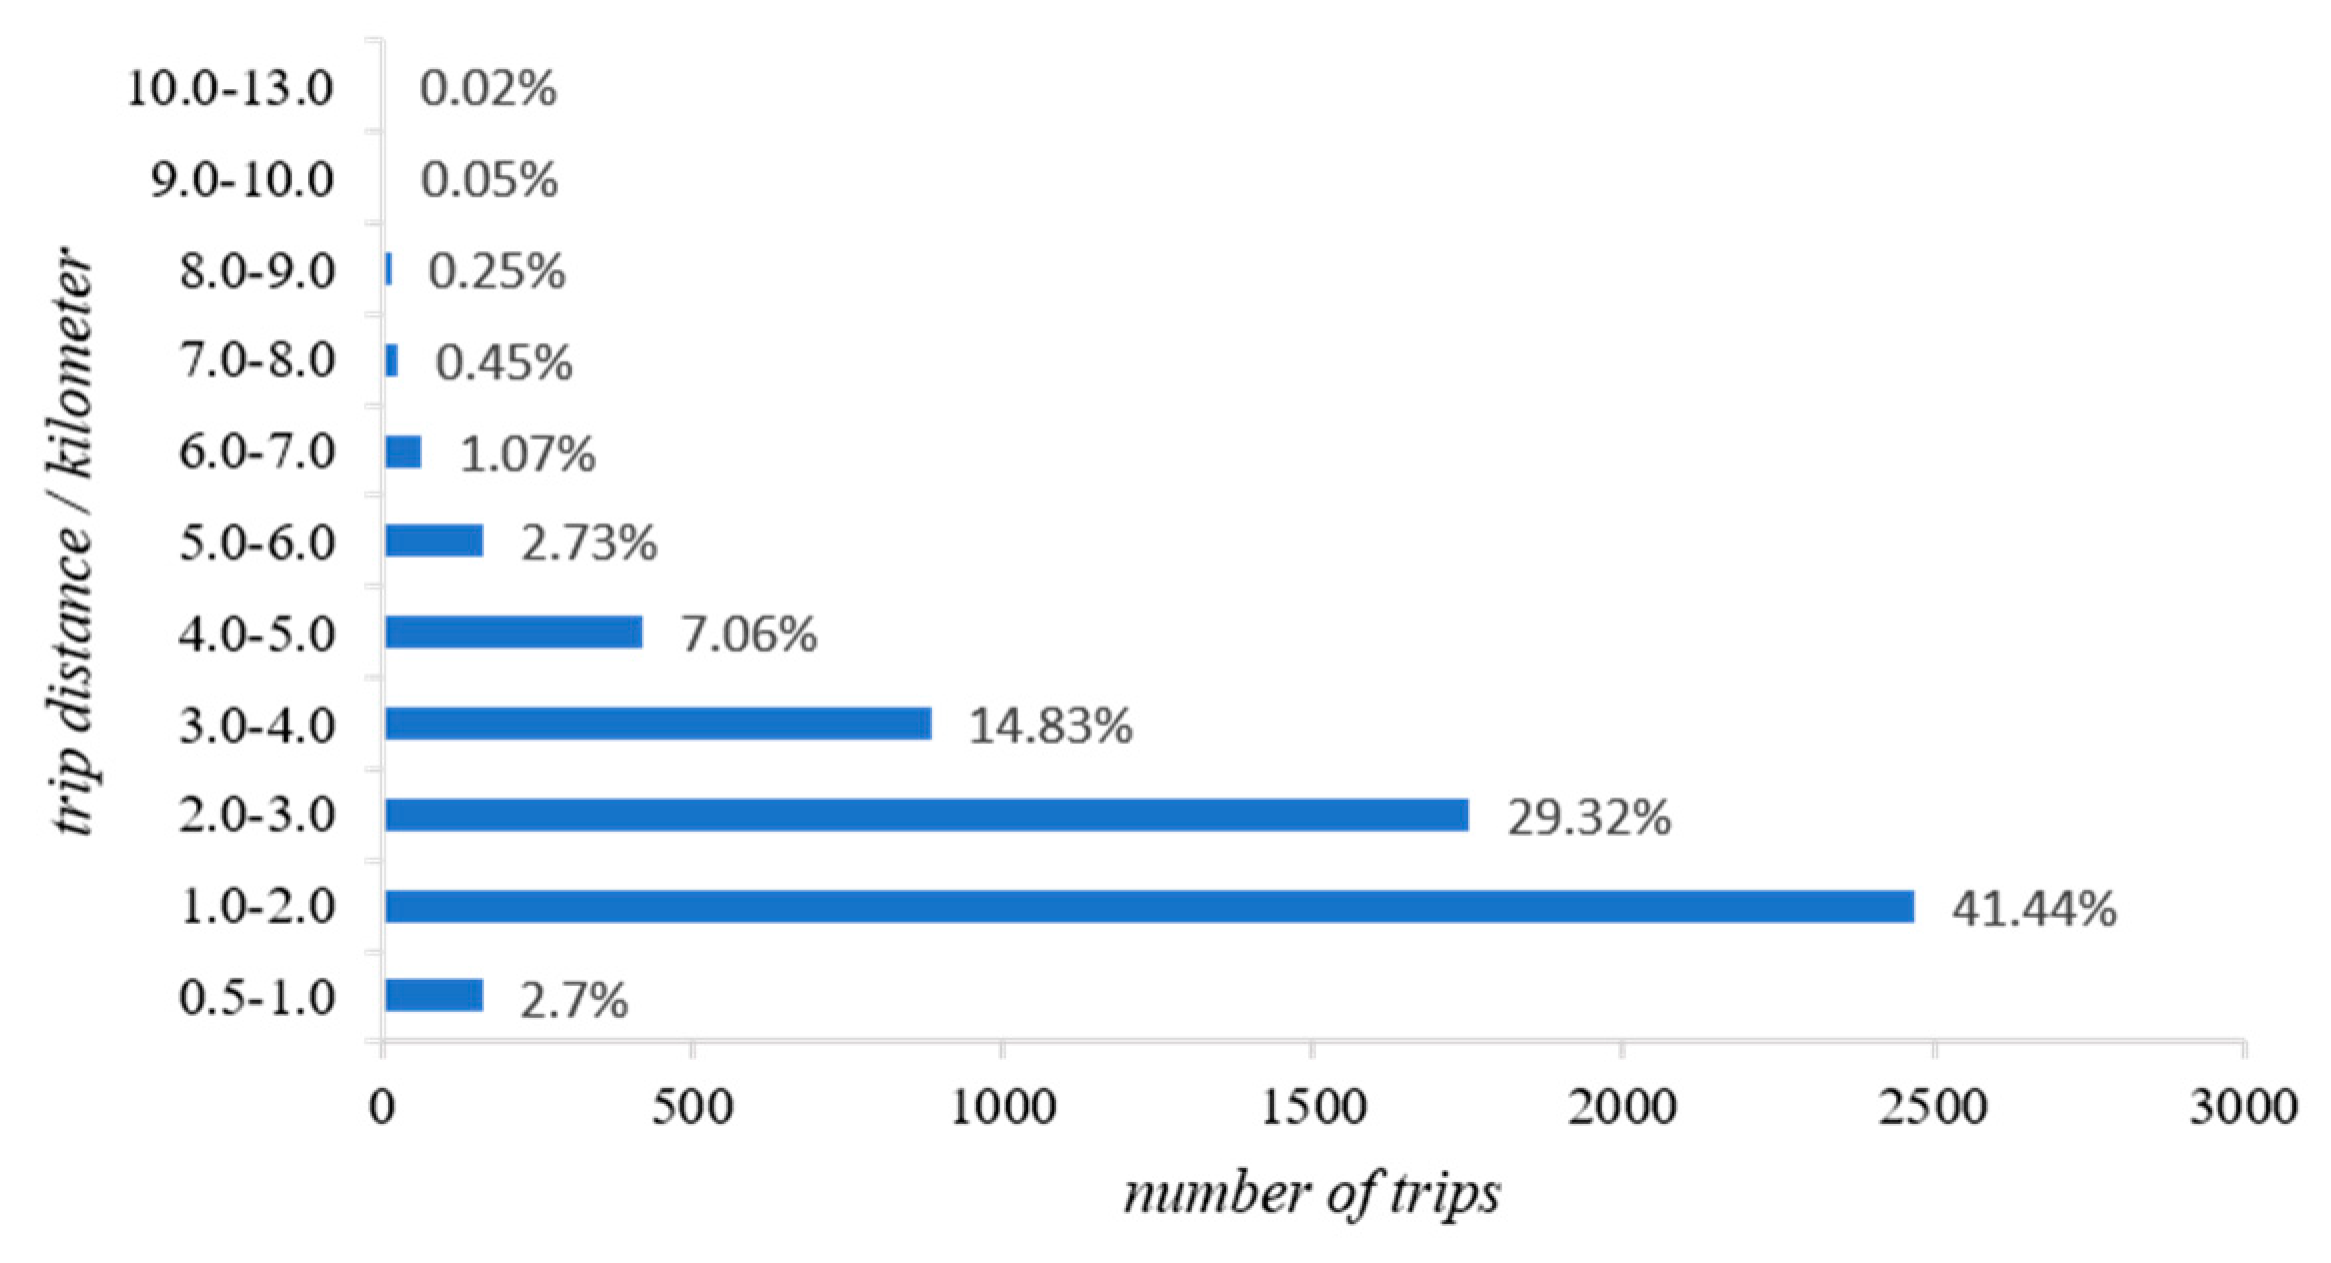
| Number of Trips | Minimum Travel Distance (meter) | Maximum Travel Distance (meter) | Average Travel Distance (meter) | Average Duration (minute) |
|---|---|---|---|---|
| 5962 | 833.5938 | 12552.16 | 2466.534 | 10.36 |
| Index | Value | Index | Value |
|---|---|---|---|
| Referenced trips | 489 | Precision | 95.62% |
| Calculated trips | 479 | ||
| TP | 458 | Recall | 93.66% |
| FP | 21 | ||
| FN | 31 | F1-score | 94.34% |
© 2019 by the authors. Licensee MDPI, Basel, Switzerland. This article is an open access article distributed under the terms and conditions of the Creative Commons Attribution (CC BY) license (http://creativecommons.org/licenses/by/4.0/).
Share and Cite
Cheng, X.; Li, C.; Du, W.; Shen, J.; Dai, Z. Trip Extraction of Shared Electric Bikes Based on Multi-Rule-Constrained Homomorphic Linear Clustering Algorithm. ISPRS Int. J. Geo-Inf. 2019, 8, 526. https://0-doi-org.brum.beds.ac.uk/10.3390/ijgi8120526
Cheng X, Li C, Du W, Shen J, Dai Z. Trip Extraction of Shared Electric Bikes Based on Multi-Rule-Constrained Homomorphic Linear Clustering Algorithm. ISPRS International Journal of Geo-Information. 2019; 8(12):526. https://0-doi-org.brum.beds.ac.uk/10.3390/ijgi8120526
Chicago/Turabian StyleCheng, Xiaoqian, Chengming Li, Weibing Du, Jianming Shen, and Zhaoxin Dai. 2019. "Trip Extraction of Shared Electric Bikes Based on Multi-Rule-Constrained Homomorphic Linear Clustering Algorithm" ISPRS International Journal of Geo-Information 8, no. 12: 526. https://0-doi-org.brum.beds.ac.uk/10.3390/ijgi8120526