A Novel Infringement Detection Method for GIS Vector Data


1
School of Geography and Tourism, Anhui Normal University, Wuhu 241002, China
2
Engineering Technology Research Center of Resources Environment and GIS, Wuhu 241002, China
3
Laboratory of Natural Disaster Process and Prevention Research of Anhui Province, Wuhu 241000, China
*
Author to whom correspondence should be addressed.
ISPRS Int. J. Geo-Inf. 2020, 9(1), 12; https://0-doi-org.brum.beds.ac.uk/10.3390/ijgi9010012
Submission received: 13 November 2019
/
Revised: 11 December 2019
/
Accepted: 17 December 2019
/
Published: 21 December 2019
Abstract
:There is undoubtedly a groundswell of support for the concept of geographic data sharing with the rapid development and wide-ranging application of geographic information science. However, copyright protection and infringement detection in the process of geographic data sharing has always been an important issue that needs to be addressed urgently. In this paper, we present a novel infringement detection method for GIS vector data to compensate for the shortcomings of vector data digital watermarking technology in infringement detection. The method determines whether infringement exists by the duplication degree between the original data and the vector data to be detected in three features including feature features, included angle features and vertex features which gets by using the spatial information of vector data to perform the feature matching based on GeoJSON format data. The experimental results indicate that the proposed algorithm can effectively resist common geometric attacks, such as interpolation attack, deletion attack, similarity transformation attack, feature order scrambling attack, and feature simplification attack, on vector data, which proves that the proposed algorithm has excellent robustness and meets the requirements of practical application.
1. Introduction
Geographical data is the symbolic expression of the relationship between various geographical features and phenomena in the earth’s surface space and is an important resource for promoting the national economy and a necessary foundation for earth science research [1]. In recent years, the internet has improved the efficiency of data transmission greatly due to the rapid development of computer technology. Under these circumstances, the spread of geographic data has become very convenient, resulting in serious problems such as piracy and leakage of geographic data, illegal profits, uncompensated use, and other phenomena that are rampant increasingly. The illegal copying and dissemination of geographic data not only infringes the legitimate rights and interests of data producers, but also disrupts the normal order of the industries related to geographic information; moreover, the leakage of high-precision geographic data threatens national security [2]. For these reasons, geographic data owners attach great importance to geographic data, and most of them hold a conservative attitude towards geographic data sharing. They are reluctant to share geographic data, which greatly hinders the sharing and application of geographic data. Data producers are reluctant to share geographic data, but there is growing demand for geographic data in society. This forms a contradiction, and the issue of geographic data sharing needs to be resolved as soon as possible.
In order to promote the sharing of geographic data, some international organizations and countries have set up systems and platforms [3,4,5] dedicated to the sharing of geographic data, and there have also been a number of crowd-sourced geographic information platforms [6] established spontaneously. The emergence of these platforms has provided good geographic data support for research, education, and development of the geographic information discipline, but still fails to resolve the above contradiction. The main reason is that most of these platforms are public welfare platforms funded by the state and the public, and the platforms themselves aim to provide free data to the public, hence these platforms may not need to adopt relevant methods to protect the copyright of geographic data, and the interests of data producers are still not taken into account. In general, one of the important reasons why the above contradictions have not been solved is that there is no universal method for protecting the copyright of geographic data [7]. The first case of electronic map data copyright in China in 2016 shows that society attaches great importance to geographic data copyright at present. Therefore, there is an urgent demand for a technology that can protect the copyright of geographic data effectively in the case of imperfect laws and regulations.
At present, encryption control technology and digital watermarking technology are the main means of geographic data copyright protection [8]. Among them, encryption control technology combines computer hardware, computer software, and geographic data to control the reading and writing of geographic data at the bottom of the computer system. It can prevent users from reading, abusing, and tampering with unauthorized geographic data on unauthorized computers, and can prevent illegal acts such as infringement and disclosure of geographic data in advance. However, this technology is more suitable for the protection of classified data than the public-oriented geographic data sharing process because it is demanding on software and hardware. Digital watermarking technology is an after-the-fact pursuit technique [9], which embeds watermark information (such as a copyright information identification image) into geographic data, and the geographic data before and after watermarking cannot be visually detected [10]. In this way, geographic data owners can share geographic data with the public after embedding copyright attribution information in the data. When the geographic data is considered to be suspected of infringement, the copyright dispute can be solved by detecting the watermark information in the data. Therefore, the digital watermarking technology can be applied to the geographic data sharing process for the public.
Geographic data is mainly divided into raster data and vector data. The research on the raster data digital watermarking algorithm follows the ordinary image watermarking algorithm to some extent because raster data is similar to ordinary image data in terms of storage mode and representation. However, the data structure of vector data is complex, including geometric information, attribute information, and topology information, which has four basic features of spatial, attribute, temporal, and scale, which increases the difficulty of vector data digital watermarking research. Currently, most scholars use the spatial features of vector data to study vector data digital watermarking technology due to the inapplicability of the attribute, temporal, and scale features of vector data [11,12,13,14,15,16,17,18,19]. Thus, the robustness of the watermarking algorithm after the spatial features of vector data is subjected to different geometric attack methods must be considered in the research of vector data digital watermarking algorithms. Common geometric attack methods mentioned in [12,14,15,16,17,18,19] include interpolation attack, deletion attack, similarity transformation attack, feature order scrambling attack, feature simplification attack, and coordinate system conversion attack. Their definitions are described below.
- Similarity transformation attack: The similarity transformation attack is a geometrically similarity transformation of the original vector data, including translation attack, rotation attack, and scaling attack [16,18,19]. The spatial coordinates of the features will generally differ from the original data after the data is subjected to this type of attack.
- Feature order scrambling attack: The feature order scrambling attack disrupts the order of the feature in the original vector data [15,17,19], such as modifying the FID of a feature from 0 to 1 in a shapefile vector data. This type of attack only modifies the order of features without modifying the coordinates of the features, thus the data before and after the attack does not change visually.
- Coordinate system conversion attack: The coordinate system conversion attack means converting the current coordinate system of the original vector data to another coordinate system [18].
Vector data digital watermarking algorithms can be divided into the spatial domain algorithm, frequency domain algorithm, geometric domain algorithm, and zero-watermarking algorithm according to the watermark embedding position and the source of the watermark information. The spatial domain watermarking algorithm uses quantification, coordinate mapping, and other methods to embed the watermark by modifying the vector data coordinate values within the error tolerance, thus achieving strong resistance to addition and deletion attacks [20,21,22,23,24]. The frequency domain watermarking algorithm embeds the watermark into the coordinate transform domain coefficients such as DFT (discrete Fourier transform), DCT (discrete cosine transform), DWT (discrete wavelet transform), which improves the ability of the algorithm to resist attacks such as noise and translation [25,26,27,28]. The geometric domain-based watermarking algorithm embeds the watermark into the geographic data geometric features, including angle, distance, arc length, and can be more resistant to geometric attacks such as rotation, scaling, and translation [29,30,31,32]. The zero-watermarking algorithm uses the characteristics of the digital works to construct the watermark. The process of constructing the watermark does not have to change the information of the original digital work; therefore, the accuracy of the vector data after embedding the watermark is unaffected. The drawback is that although most algorithms are resistant to certain attacks, the robustness is generally poor [33,34,35,36,37]. In summary, the current research on vector data digital watermarking is based on the data structure characteristics of vector data for watermark embedding or watermark information generation. Watermark embedding and extraction accuracy are significantly affected by vector data structure, and it is basically impossible to extract valid watermark information from the data if the vector data is greatly damaged (e.g., more than 90% of the data is deleted), which is a common and inevitable shortage in the current research of vector data digital watermarking.
Vector data uses points, lines, and polygons to digitize spatial entities, where lines and polygons are composed of multiple point coordinates, two points can be connected into one line, three points can form one polygon, and the final object of the operation and transformation of most vector data digital watermarking algorithms are point coordinates. For example, the watermark information is directly embedded into the coordinates in the spatial domain algorithm; the lengths and included angles of the line segments are calculated by the point coordinates as the feature information to generate a digital watermarking in the zero-watermark algorithm. The zero-watermarking algorithm is used as a reference. In this paper, we propose a novel infringement detection method for GIS vector data based on the GeoJSON format with point coordinates as the manipulation object, which does not adopt the vector data digital watermarking technology but matches the point coordinates which are the smallest constituent unit of the vector data in GeoJSON, and whether there is any infringement is determined according to the duplicated degree of the vector data in order to compensate for the shortages in current vector data digital watermarking research.
2. GeoJSON Data Structure of Vector Data
The GeoJSON data structure of all vector data of point, line, and polygon types described in this chapter follows the Simple Feature Specification in OGC standard [38,39].
2.1. Point
The representation of point vector data in GeoJSON has two geometric types, one is Point and the other is MultiPoint. The organization of the Point type vector data in the GeoJSON format is shown in Figure 1. For the Point type, each point is an independent feature in Figure 1a. In Figure 1b, the value of “type” key in “geometry” is Point, the value of “coordinates” key in “geometry” is the coordinates of only one point, the value type of “features” key is an array, and each element in the array is a JSON record. Each JSON record represents a point in Figure 1a.
The GeoJSON format data of MultiPoint type vector data is shown in Figure 2b. There is no difference in the visual representation of the spatial position between the MultiPoint type data and the Point type data when comparing Figure 2a with Figure 1a, but when comparing Figure 2b with Figure 1b, we can see that there are some local differences in the GeoJSON format of the two data types. In the GeoJSON format of the MultiPoint type vector data, the value of “type” key in “geometry” is MultiPoint, the value type of “coordinates” key in “geometry” is an array and this array can store multiple points coordinates, means that each JSON record in Figure 2b represents multiple points in Figure 2a. As shown in Figure 2a, the four points (x1, y1), (x2, y2), (x3, y3), and (x4, y4) are collectively stored in the first JSON record of the “features” key in Figure 2b and form a point feature. If the MultiPoint type is converted to the Point type, these four points will generate four JSON records which will form four points feature. Moreover, the GeoJSON format directly stores the coordinates of the points in the JSON record when storing the spatial information of the point vector data as can be seen from Figure 1b and Figure 2b.
2.2. Line
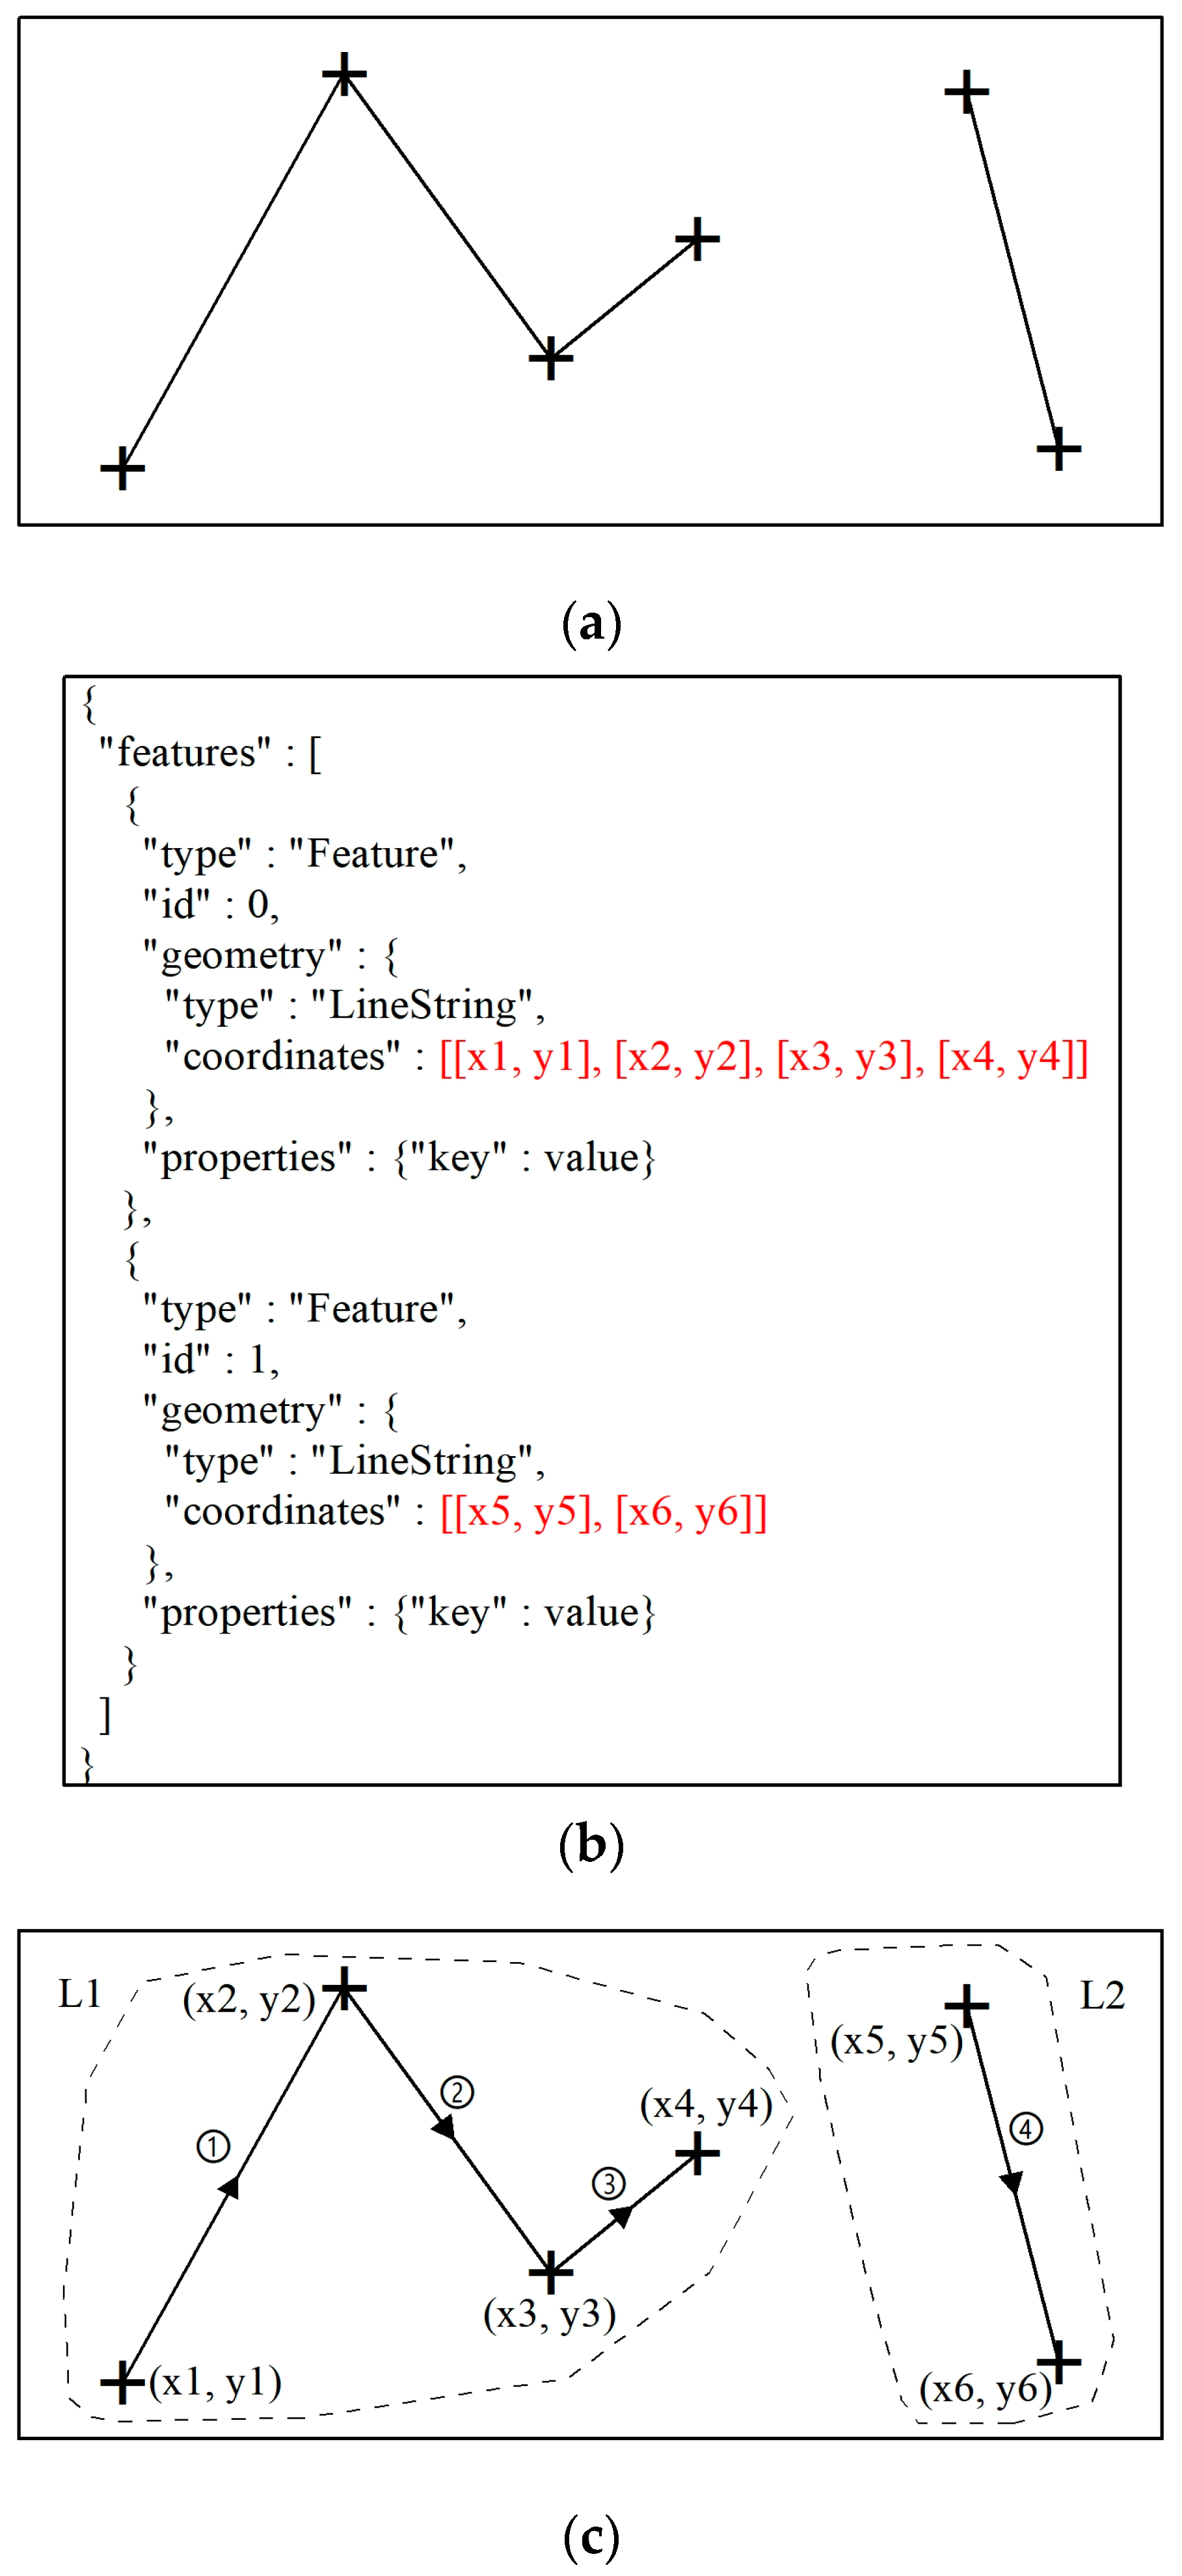
Similar to point type data, line vector data has two geometric types of LineString and MultiLineString in GeoJSON format. For the LineString type, the value of “type” key in “geometry” is LineString, the value type of “coordinates” key in “geometry” is an array. The number of elements in the array represents the number of vertices of the line feature, as shown in Figure 3b. The GeoJSON format assigns a start and end point to each line feature, which produces the direction of the line feature. Line feature L1 in Figure 3c contains three line segments numbered 1, 2, and 3, while line feature L2 only contains one line segment, numbered 4. (x1, y1) and (x2, y2) are the start and end points of line segment 1, as shown in Figure 3c, then, it can be considered that the direction of (x2, y2) relative to (x1, y1) is the direction of line segment 1. Since line segment 1 and line segment 2 are spatially continuous, (x2, y2) is both the end point of line segment 1 and the starting point of line segment 2, while L1 and L2 are spatially discontinuous, the starting point of line segment 4 is not the end point of line segment 3. This rule can be used to determine whether the two line features or segments are connected in the GeoJSON data.
Line vector data spatial distribution of the MultiLineString type and the corresponding GeoJSON format data is shown in Figure 4. Figure 4a is slightly different from Figure 3a in the spatial representation of the data, but after parsing the GeoJSON structure onto the graph, it can be seen that lines 1, 2, 3, and 4 in Figure 4c are combined to belong to one line feature, ML1, which corresponds to the first JSON record of the “features” key in Figure 4b. In line feature ML1 of Figure 4c, fold line L1 and fold line L2 are spatially disconnected, so the three vertex coordinates of L1 and the three vertex coordinates of L2 are stored in the first element and second element of the “coordinates” key value, respectively, to indicate the spatial relationship between the lines. In addition, the GeoJSON format divides the line feature into the smallest unit (line segment) at first when storing the spatial information of the line vector data, and then stores the vertex coordinates of the line segment into the JSON data, as can be seen in Figure 3b and Figure 4b.
2.3. Polygon
There are two types of Polygon in the GeoJSON format, including Polygon and MultiPolygon. The polygon vector data of the Polygon type and its GeoJSON format data are shown in Figure 5. For the Polygon type, the value type of “coordinates” key in “geometry” is an array, denoted as A[i]. It can be seen in Figure 5a,b that:
- When there is no hole in the polygon, there is only one element in A[i]
- When there is a hole in the polygon, multiple elements will be stored in A[i]
- The coordinates of the periphery vertices of the polygon are always stored in the first element of A[i], and the coordinates of the vertices of the hole are stored in the second and subsequent elements
The spatial information of polygon vector data is stored as vertex coordinates in the GeoJSON format in the same way as line vector data. When stored, GeoJSON will start with the vertex of the northernmost polygon feature, the coordinates of other vertices of the polygon are stored in a counterclockwise direction, and use the starting point as the end point to complete the closing of the polygon. If there is a hole in the polygon, the vertex coordinates of the hole are stored in a clockwise direction, as shown in Figure 5c.
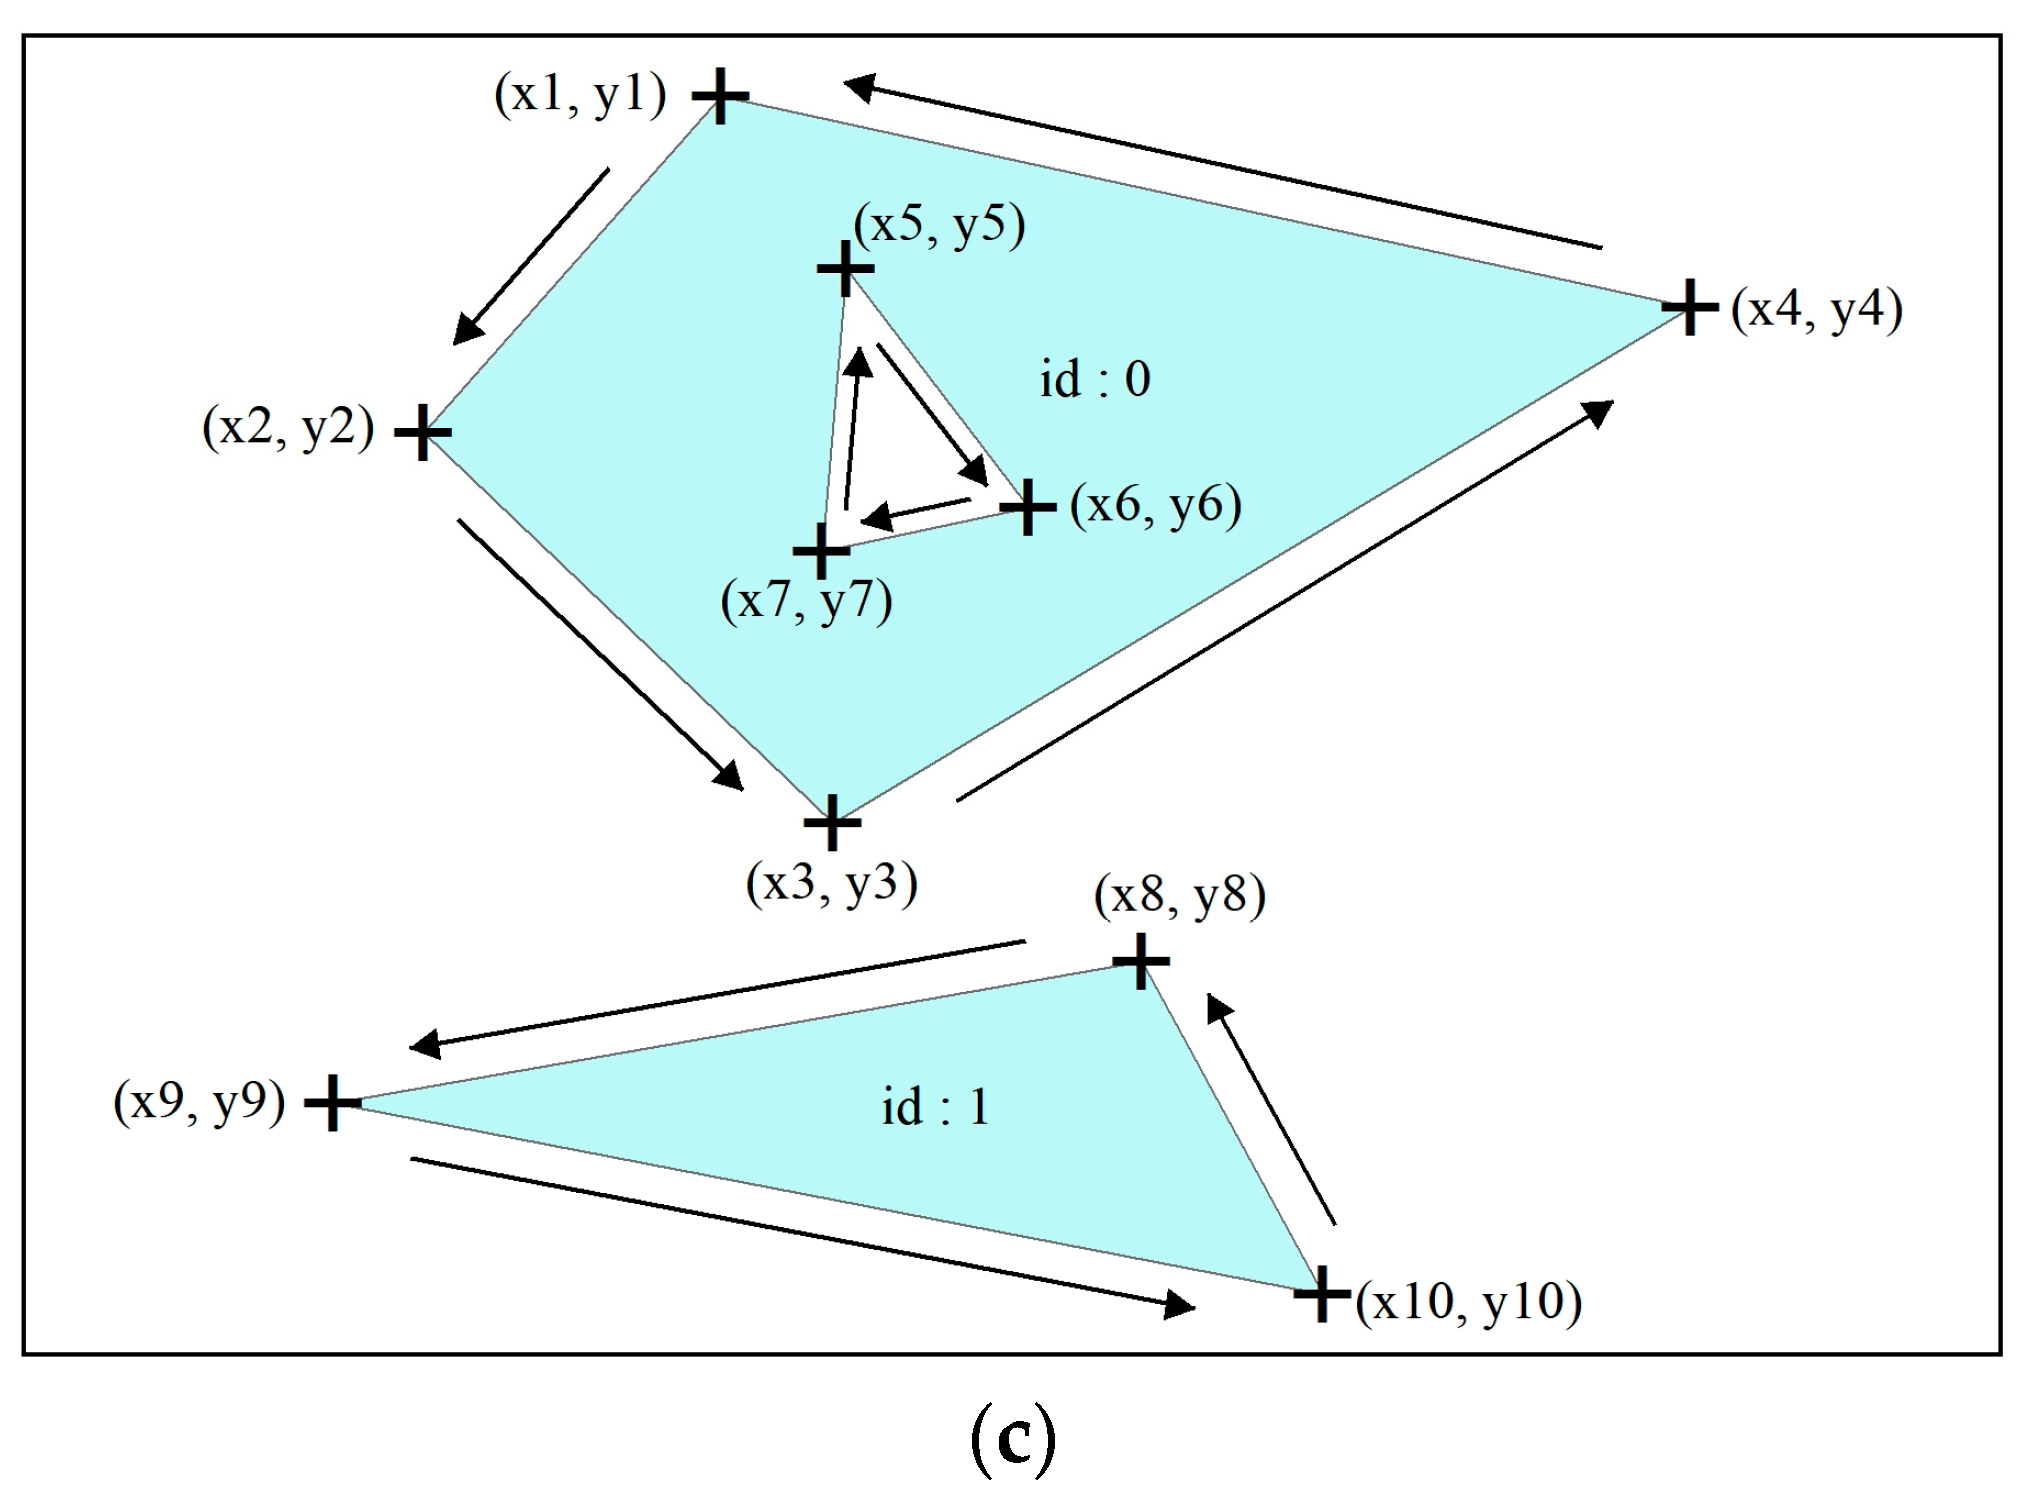
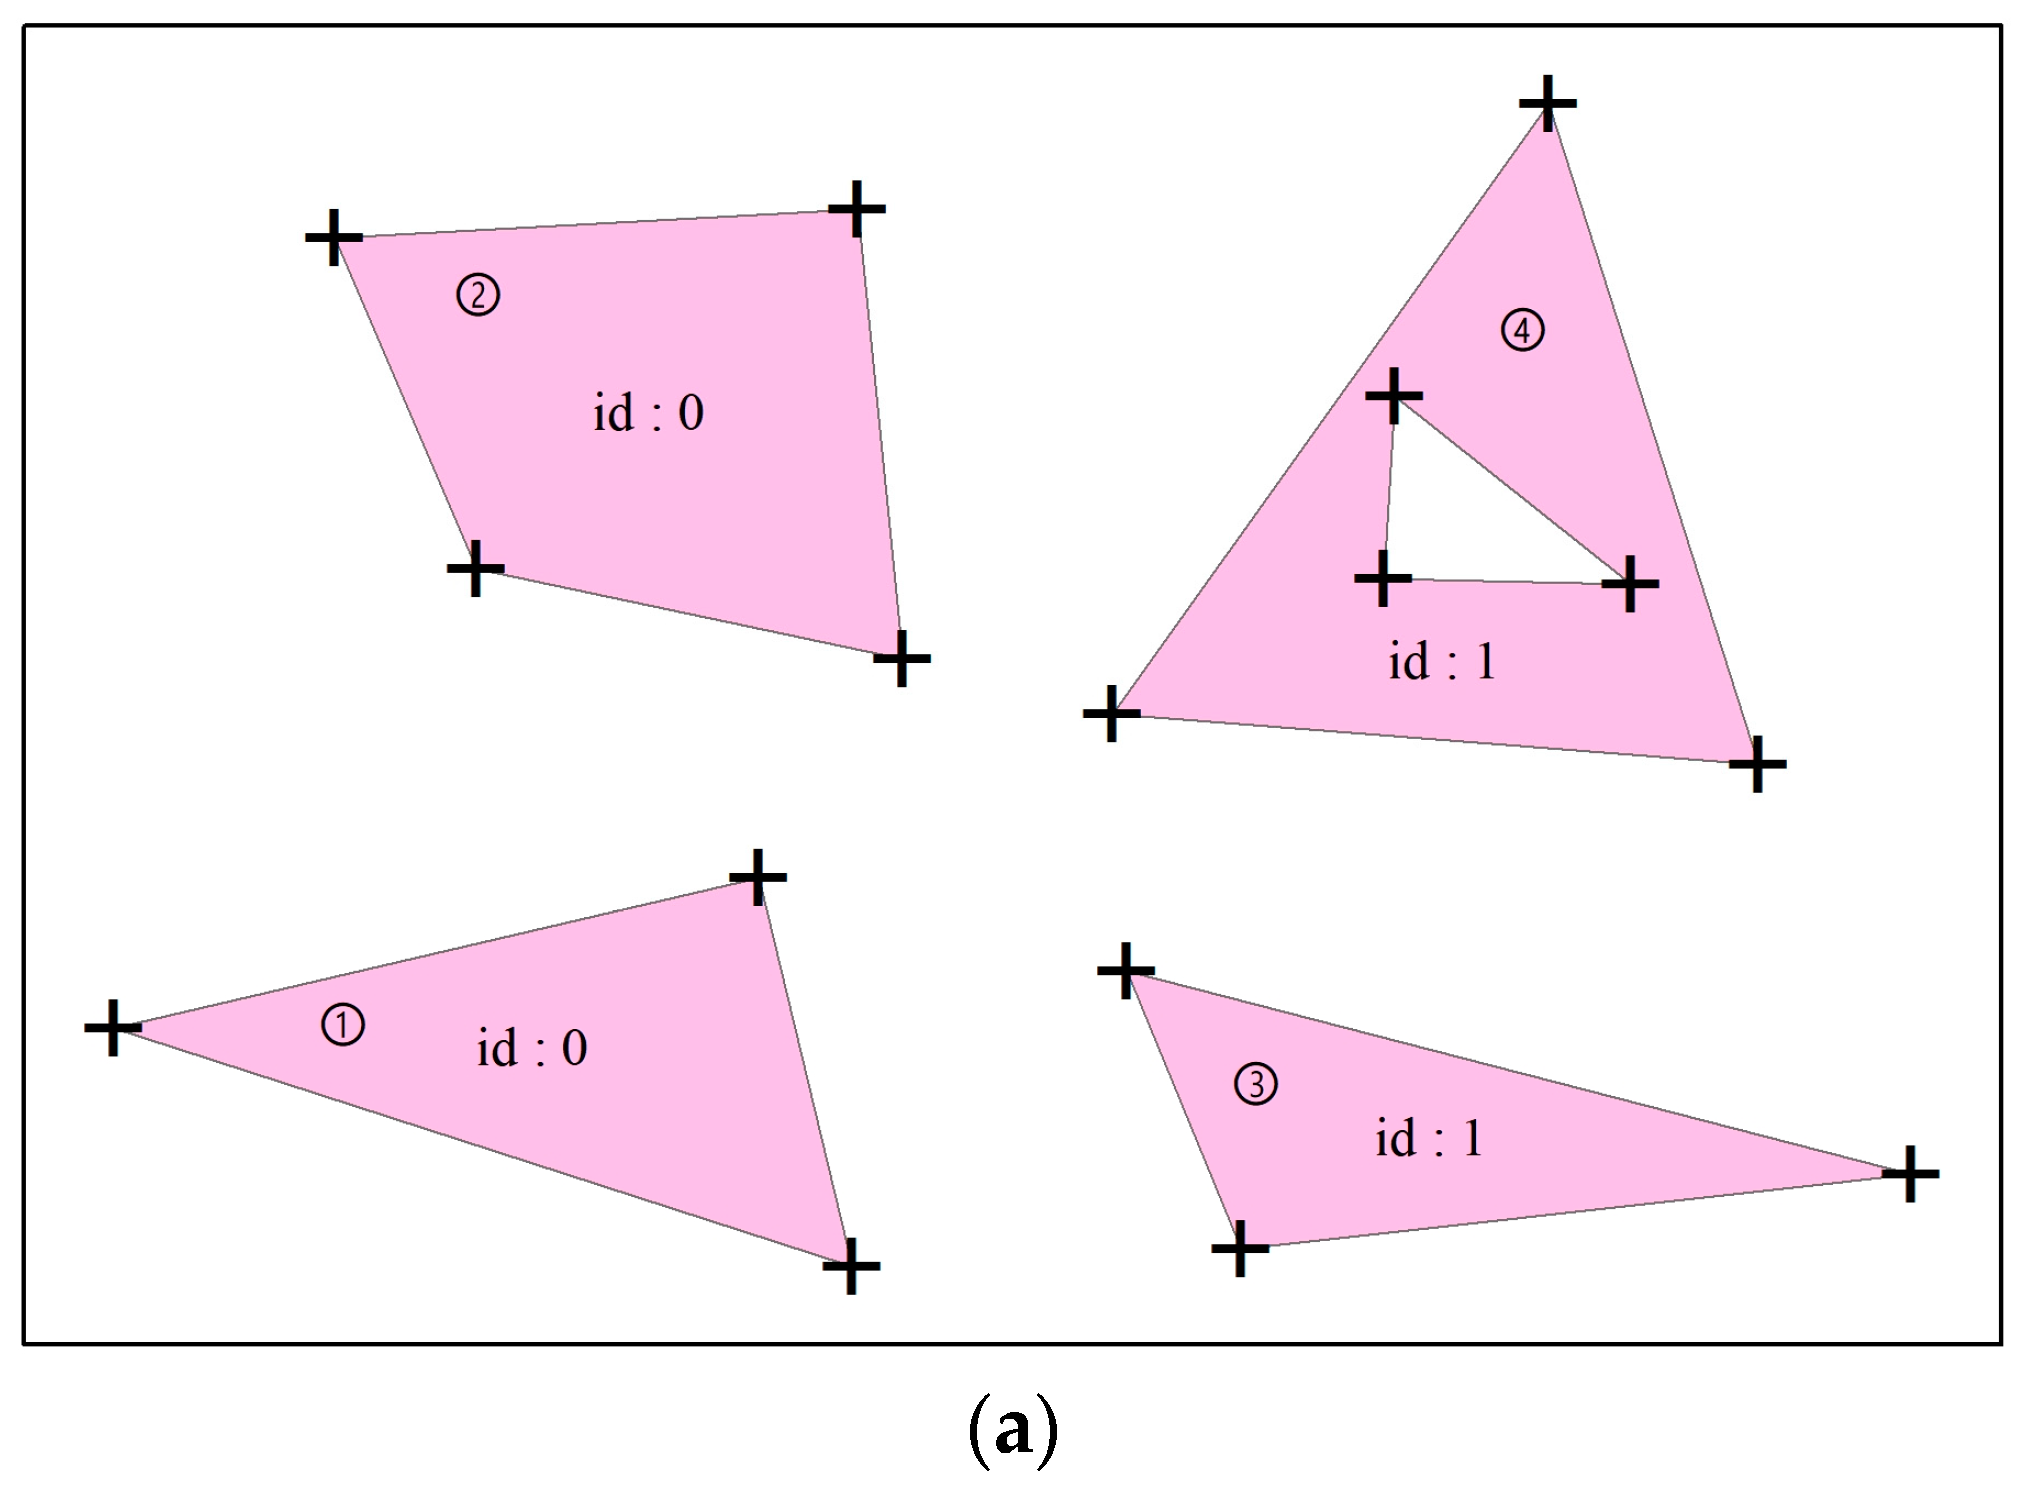
Similar to the vector data of the MultiPoint and MultiLineString types, for the MultiPolygon type, a JSON record in the “features” key value stores multiple polygons. The value type of “coordinates” key in “geometry” is an array (denoted as C[k]), C[k] stores all polygon features, each element in C[k] is an array (denoted as D[m]), and D[m] corresponds to the polygon object contained in the polygon feature, each element in D[m] is also an array (denoted as E[n]), and the coordinates of the vertices of each polygon object are stored in E[n]. As shown in Figure 6a,b, the two polygon objects of numbers 3 and 4 belong to the same polygon feature with the i.d. 1, thus there are two elements in C[k], and a hole is contained in the polygon numbered 4, hence the D[m] array has two elements. The first element in D[m] stores the coordinates of the peripheral vertices of polygon 4, and the second element stores the coordinates of the vertices of the hole in polygon 4. In simple terms, the value type of “coordinates” key in “geometry” in the MultiPolygon type is an array of polygon vertex coordinate arrays. Like the Polygon type, the coordinates of the peripheral vertices of the polygons in the MultiPolygon type are stored counterclockwise, and the order of the storage of the vertices of the holes is clockwise, whereas the starting point in the vertices of the polygon is not always the northernmost point, as shown in Figure 6c.
3. Algorithm Design
3.1. Angle Calculation
In the GIS vector data, the angle between the features will remain unchanged if the spatially relative positional relationship between the two features does not change (equal or similar in geometry). In the algorithm of this paper, the angle is an important measure indicator. The calculation of the angle is based on point coordinates, and is divided into azimuth angle and included angle. Let the coordinates (x1, y1) and (x2, y2) be the start and end points of the line segment P, respectively; then, the included angle α between the line segment P and the x-axis can be calculated as depicted in Equation (1):
α = arctan ((y2 − y1)/(x2 − x1))
Considering that the end point of the line segment P may be in different quadrants with respect to the direction of the starting point, the azimuth angle Az of the line segment P in four quadrants is shown in Figure 7. The calculation method of Az for line segment P in different quadrants are given in Equation (2). The range of Az is 0–360°.
After the azimuth calculation is completed, the included angle between the two connected line segments can be calculated. The calculation needs to be discussed separately according to the different quadrant positions of the two line segments. Since there are many cases in which two line segments are combined, only one example is shown here. As shown in Figure 8, the line segment P is connected to line segment L, and the directions of the two line segments are located in the first quadrant, the azimuth angle of the line segment P is ∠PAz and the azimuth angle of the line segment L is ∠LAz, then the included angle β between the line segment P and the line segment L can be calculated according to Equation (3). It should be noted that since the angle less than 180° is always taken as the included angle between the two line segments, there are two formulas for calculating the included angle β when the directions of the two line segments are in the same quadrant. For example, P’ is the extension line of the line segment P as shown in Figure 8b. When the position of line segment L is between the y’-axis and P’ (∠PAz > ∠LAz), the calculation of the included angle β should be performed using the Equation (3), and the calculation of the included angle β should be performed using the Equation (4) when the position of line segment L is between P’ and the x’-axis (∠PAz < ∠LAz).
3.2. Mean Center Calculation
For a polygon feature, the center coordinates will not change if the vertex coordinates are unchanged. Therefore, the center coordinates can be used to determine whether the spatial positions of the two polygons are the same. In order to guarantee the performance of the algorithm, the mean value of the vertex coordinates is used here to represent the center of the polygon. Let the coordinates of the vertices of the polygon M be (x1, y1), (x2, y2), …, (xn, yn), then the mean center coordinates C () of the M can be calculated according to Equation (5). The hole is also considered as a polygon if there is a hole in M, as shown in Figure 9.
3.3. Vector Data Infringement Detection Algorithm
From the analysis of the GeoJSON data structure, it can be seen that the three types of vector data (Point, LineString, and Polygon) are clearer in the expression of feature spatial information than MultiPoint, MultiLineString, and MultiPolygon. Therefore, the algorithm specifies the geometry type in the GeoJSON format as Point, LineString, and Polygon in the design process.
The basic design concept of the infringement detection algorithm for GIS vector data is to perform the feature matching based on the minimum constituent unit of the vector data to obtain the repetition rate of the data, thereby determining whether there is any infringement in the data to be detected. However, the spatial features of vector data are extremely vulnerable to geometric attacks such as addition, deletion, and modification. Therefore, it is necessary to separate the feature features, the included angle features, and the vertex features from the spatial features of the vector data as the measurement indicators in the matching. In general, vector data infringement detection algorithms are divided into feature detection, included angle detection, and vertex detection. Point type vector data mainly uses feature detection and included angle detection, while the line and polygon type vector data are in need of all three of the above-mentioned detection methods. The algorithm flow is shown in Table 1. The vector data repetition rate RT is calculated as RT = (the number of repeated features/features cardinality) × 100%. The number of repeated features refers to the number of repetitions of geographic features, included angle value, or mean center coordinates value in the vector data. The RT is used in this paper to evaluate whether there is infringement, hence the maximum of the two or three feature repetition rates is taken as RT. The feature cardinality refers to the total number of each feature. The smaller cardinality of the features is taken as the feature cardinality in the vector data to be detected.
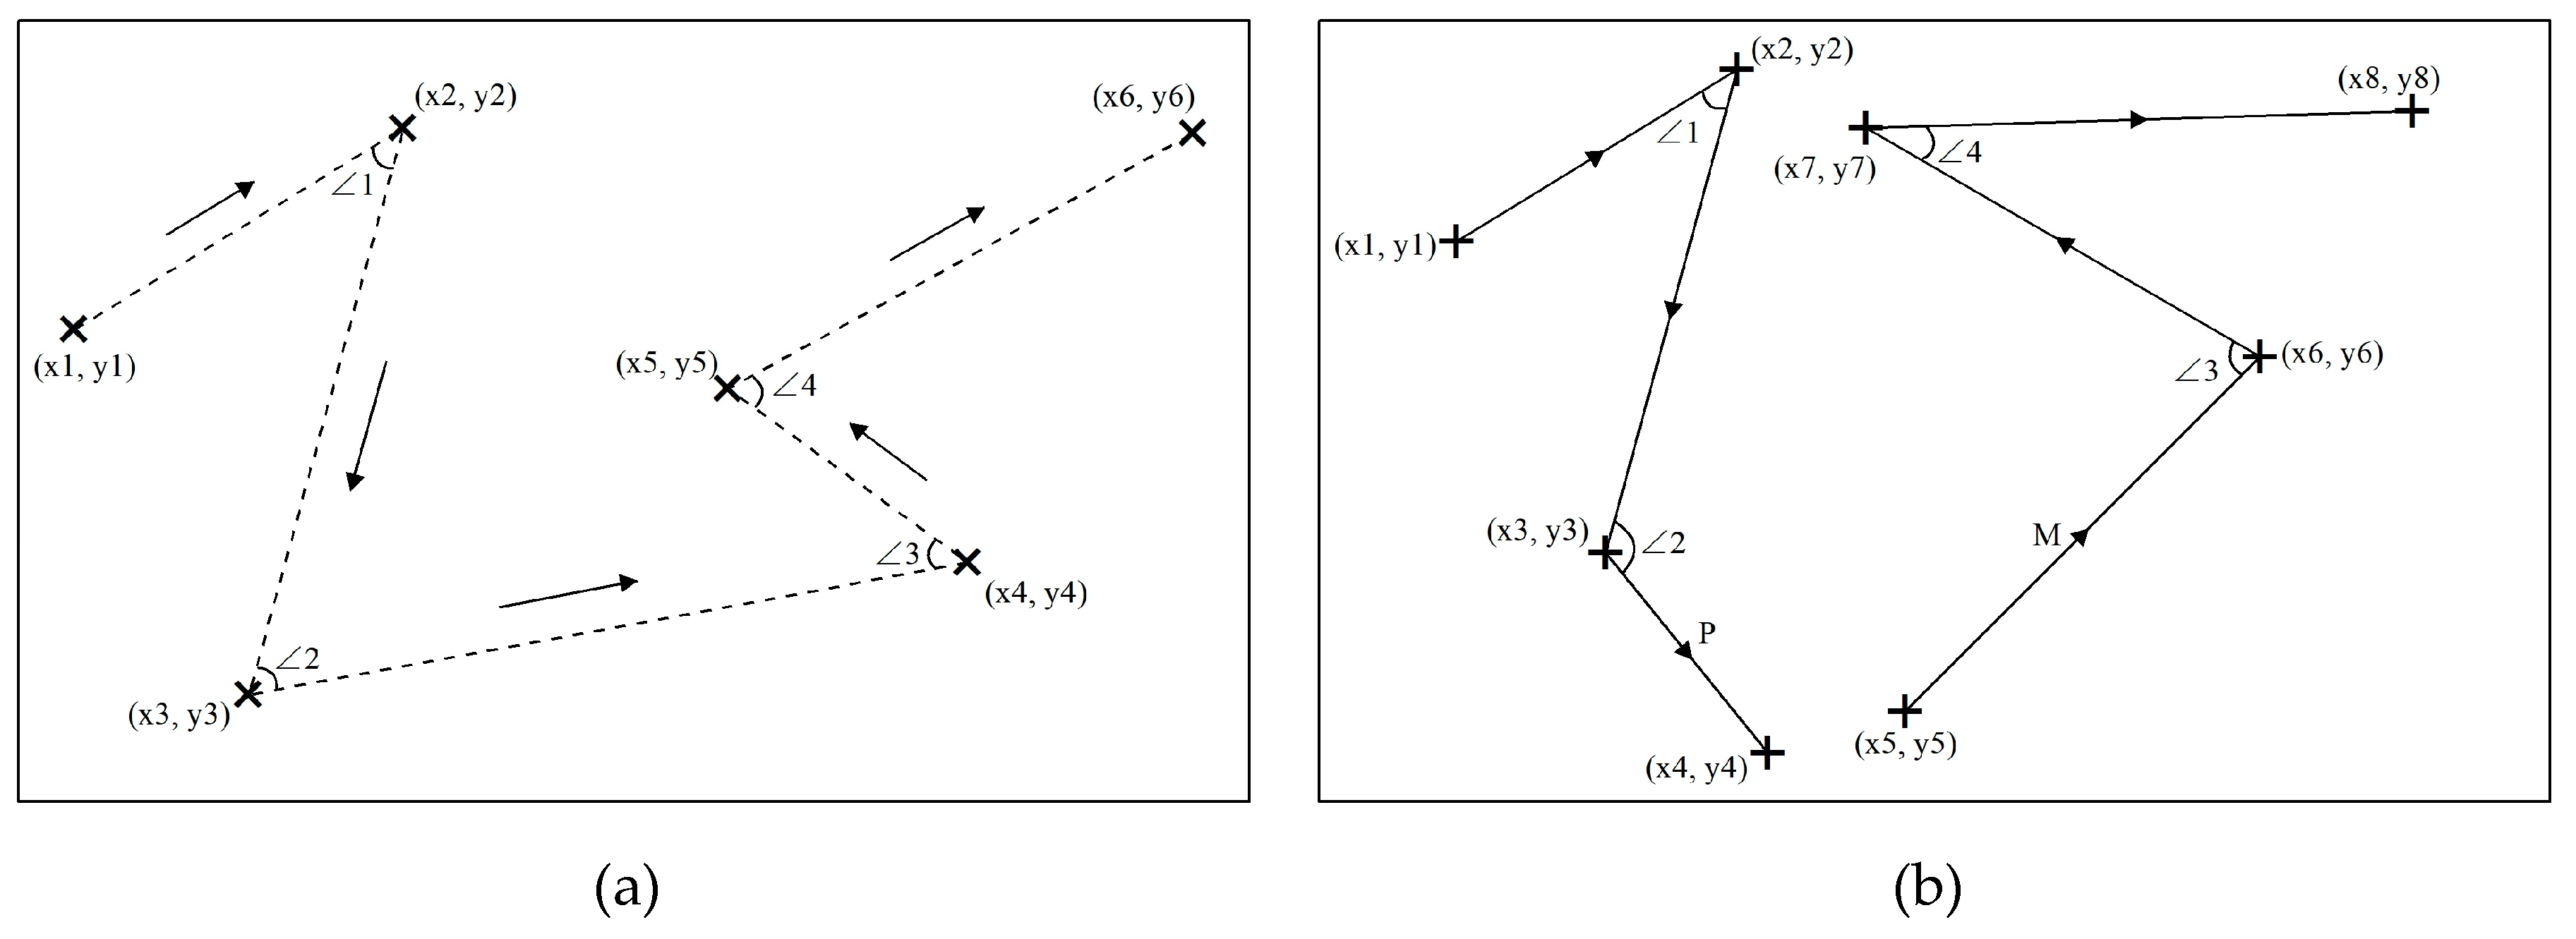
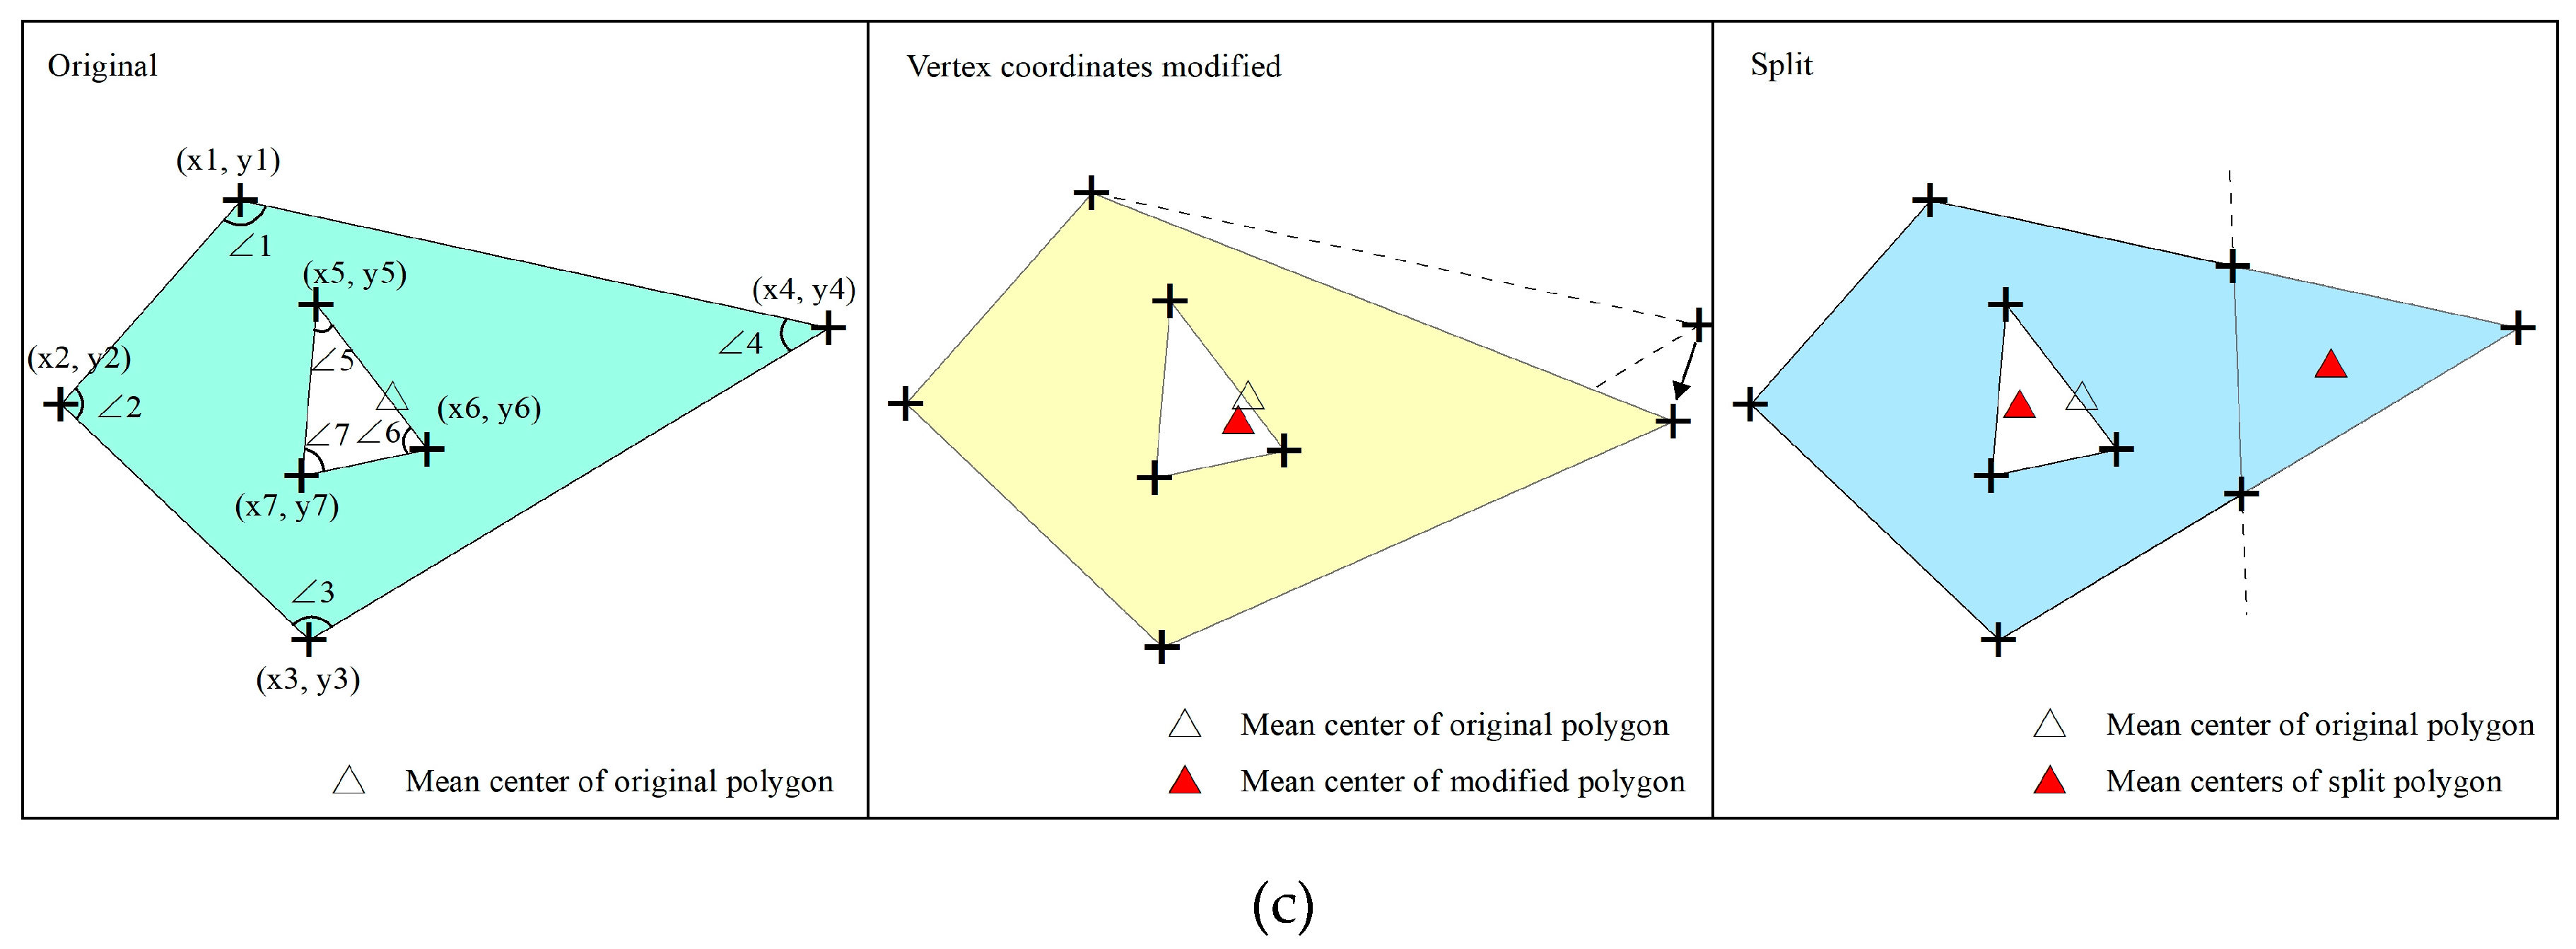
The point coordinates are matched first when detecting the repetition rate of the point type data, and the equal coordinates indicate that the two point features are duplicated. It is essential to consider whether the spatial relative positional relationship of each feature matches in addition to considering whether the geographic coordinates of each feature match. We use the included angle between the connection lines of point features to express the relative positional relationships of the features. The azimuth angle of the connecting line between the two point features should be calculated in sequence when the included angles in the point data are calculated, and then the included angle between the two lines can be calculated sequentially after all the azimuth angles are calculated, as shown in Figure 10a. It should match the coordinates of the starting and ending points of the line feature when detecting the line type data. If the coordinate values are equal, the two line features will be considered duplicate. The relative spatial relationship of the line features is expressed by the included angle between the line features. It is necessary to determine whether the line feature P is connected to the line feature M by the coordinates of the starting and ending points of the line features before calculating the included angle between the line features, and the included angle is calculated only when the line features are connected, as shown in Figure 10b. The spatial features of a polygon will change a lot if it is attacked, thus the detection process for polygon vector data is more complicated, and is divided into three parts: feature detection, internal included angle detection, and vertex coordinate detection. The mean center coordinates are unchanged when the polygon vertex coordinates have not changed; therefore, the number of repetitions of polygon features can be detected by the polygon mean center coordinates, but this is only suitable for the case where the polygon feature vertex coordinates are completely unchanged. The center coordinates will change when the polygon is cut or one of the vertices is tampered with, as shown in Figure 10c. Therefore, it is indispensable to perform the vertex coordinates detection for auxiliary judgment when detecting the polygon type data.
4. Experiment and Result
4.1. Data Processing and Experimental Environment
4.1.1. Data Processing
The dataset of this paper uses the shapefile vector dataset in OpenStreetMap. The point features are interest point data, including places, POIs, traffic, and transport. The line features use road data, the polygon features use building data, and the range of the latitude and longitude of experimental data are 113.963°–118.493° E and 38.302°–42.125° N, the coordinate system of experimental data is GCS_WGS_1984, the overall data overview is shown in Figure 11a, and the local details are shown in Figure 11b. It is essential to pay attention to the elimination of multipoint, multiline, and multipolygon when converting the shapefile format data to the GeoJSON format because the algorithm specifies the GeoJSON format type of vector data as Point, LineString, and Polygon. The data preprocessing process is shown in Figure 12.
4.1.2. Experimental Environment
The GeoJSON format is widely used in the B/S architecture system, which is also an extension to the JSON format. Consequently, JavaScript has good support for the GeoJSON format. In this experiment, the JavaScript language is used to implement the steps of the algorithm. The system environment is Windows 10 18362.175 based on ×64, inter i5-7300HQ CPU, 24 Gb RAM, and the development tools are Sublime Text 3 and Google Chrome.
4.2. Attack Experiment
The spatial features of vector data are easy to change, and the cost of tampering with spatial information on vector data is low. Several common types of spatial information attacks mentioned in the current digital watermarking research include interpolation attack, deletion attack, similarity transformation (translation, rotation, scaling) attack, feature order scrambling attack, feature simplification attack, and coordinate system conversion attack. The default coordinate reference system for the GeoJSON format is the geographic coordinate system using the WGS84 datum, and we take this default as a precondition of the proposed algorithm and specifies that the data coordinate system for detection should be GCS_WGS_1984, thus the coordinate system conversion attack experiment is no longer performed in the experiment. For the other five tampering methods, we conduct geometric attack experiments on the different vector data types of point, line, and polygon, respectively, to evaluate the effectiveness and robustness of the proposed algorithm.
4.2.1. Interpolation Attack
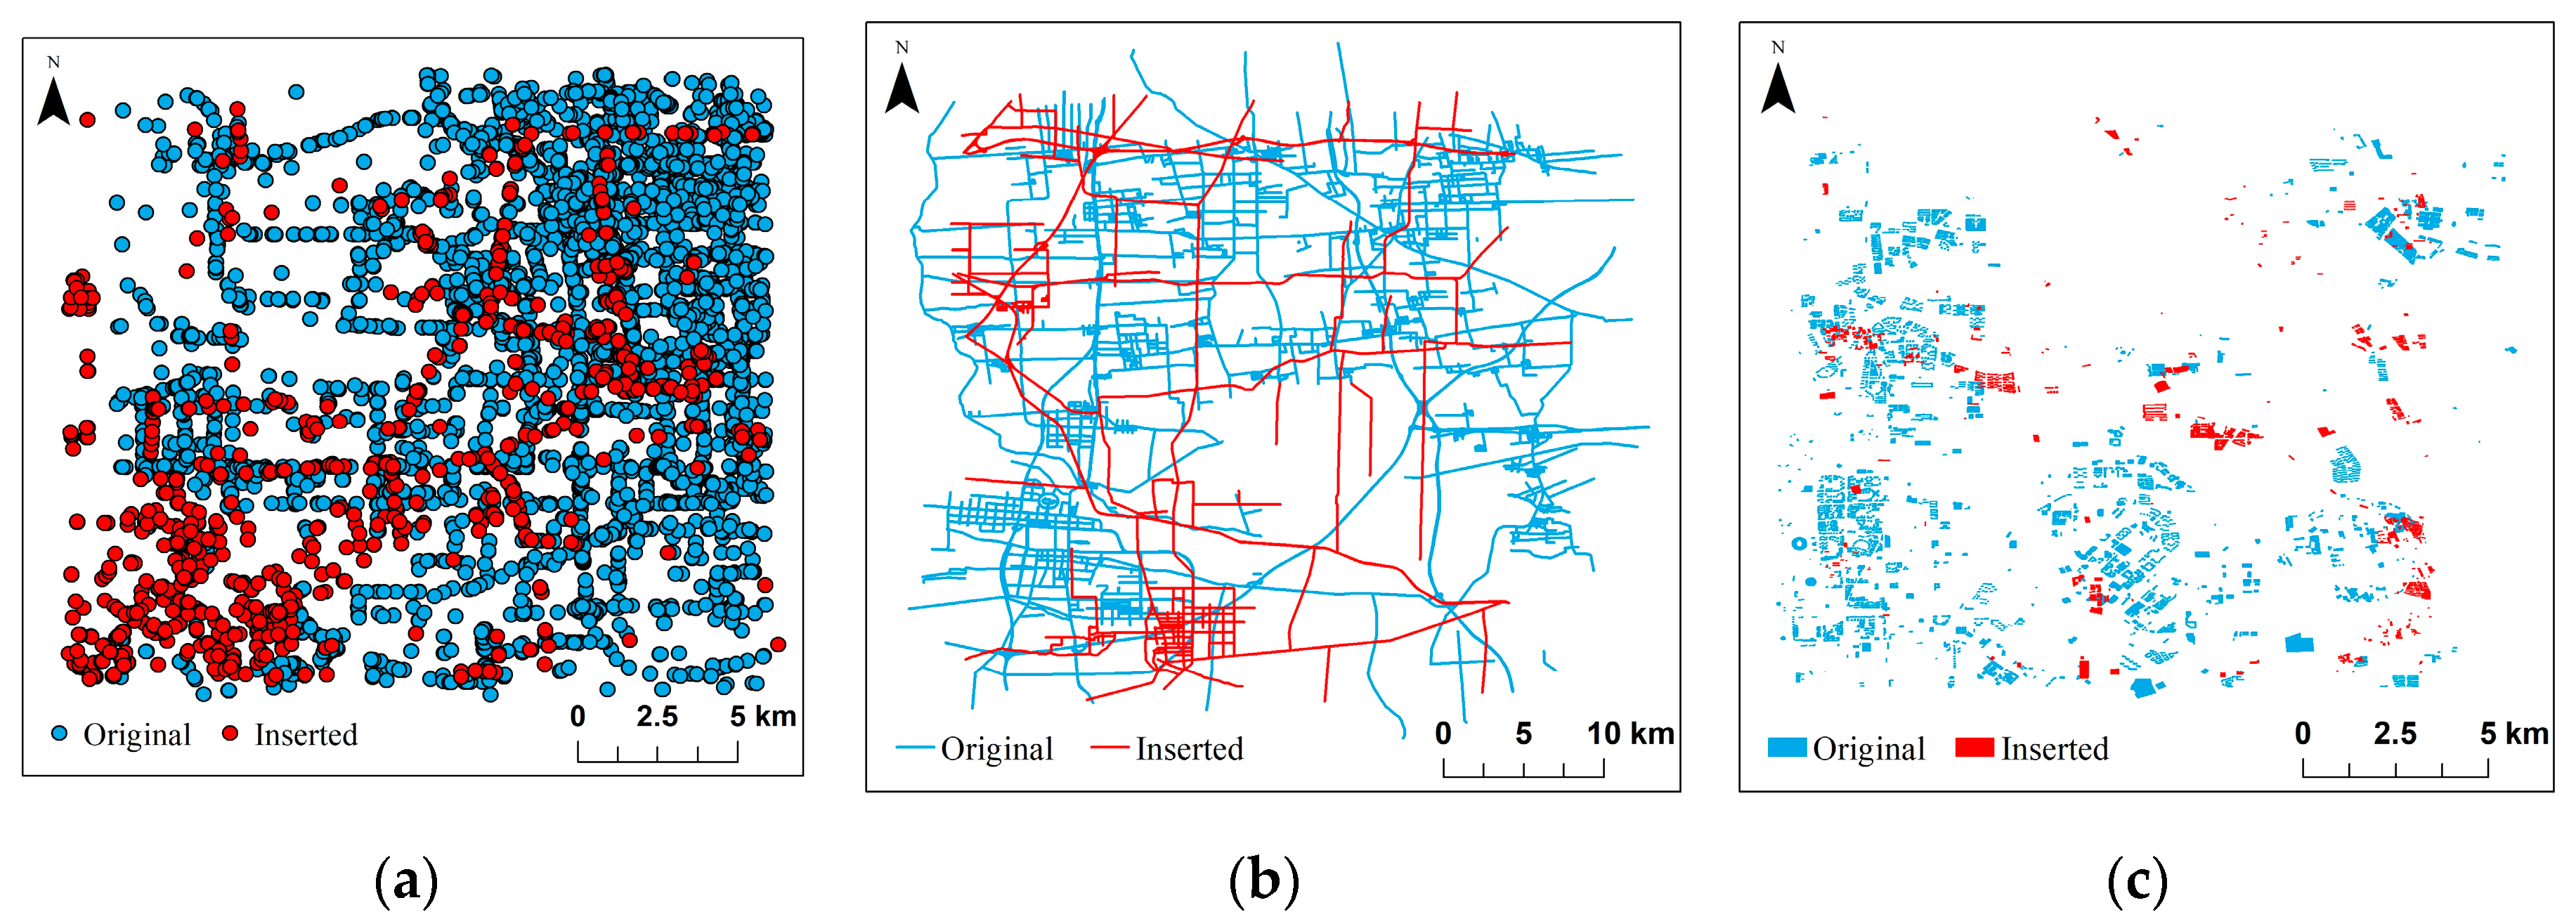
We selected a certain amount of points, lines, and polygon features from the experimental dataset and set different attack levels to examine the robustness of the algorithm. Taking 20% of features as an example, the comparison of different types of data and original data after the interpolation attack is shown in Figure 13. The test results are shown in Table 2, which show that the proposed algorithm has high accuracy for the detection of interpolation attacks. The interpolation attack only adds features and does not modify the spatial information of the original data, hence most digital watermarking algorithms are effective for the detection of interpolation attacks.
4.2.2. Deletion Attack
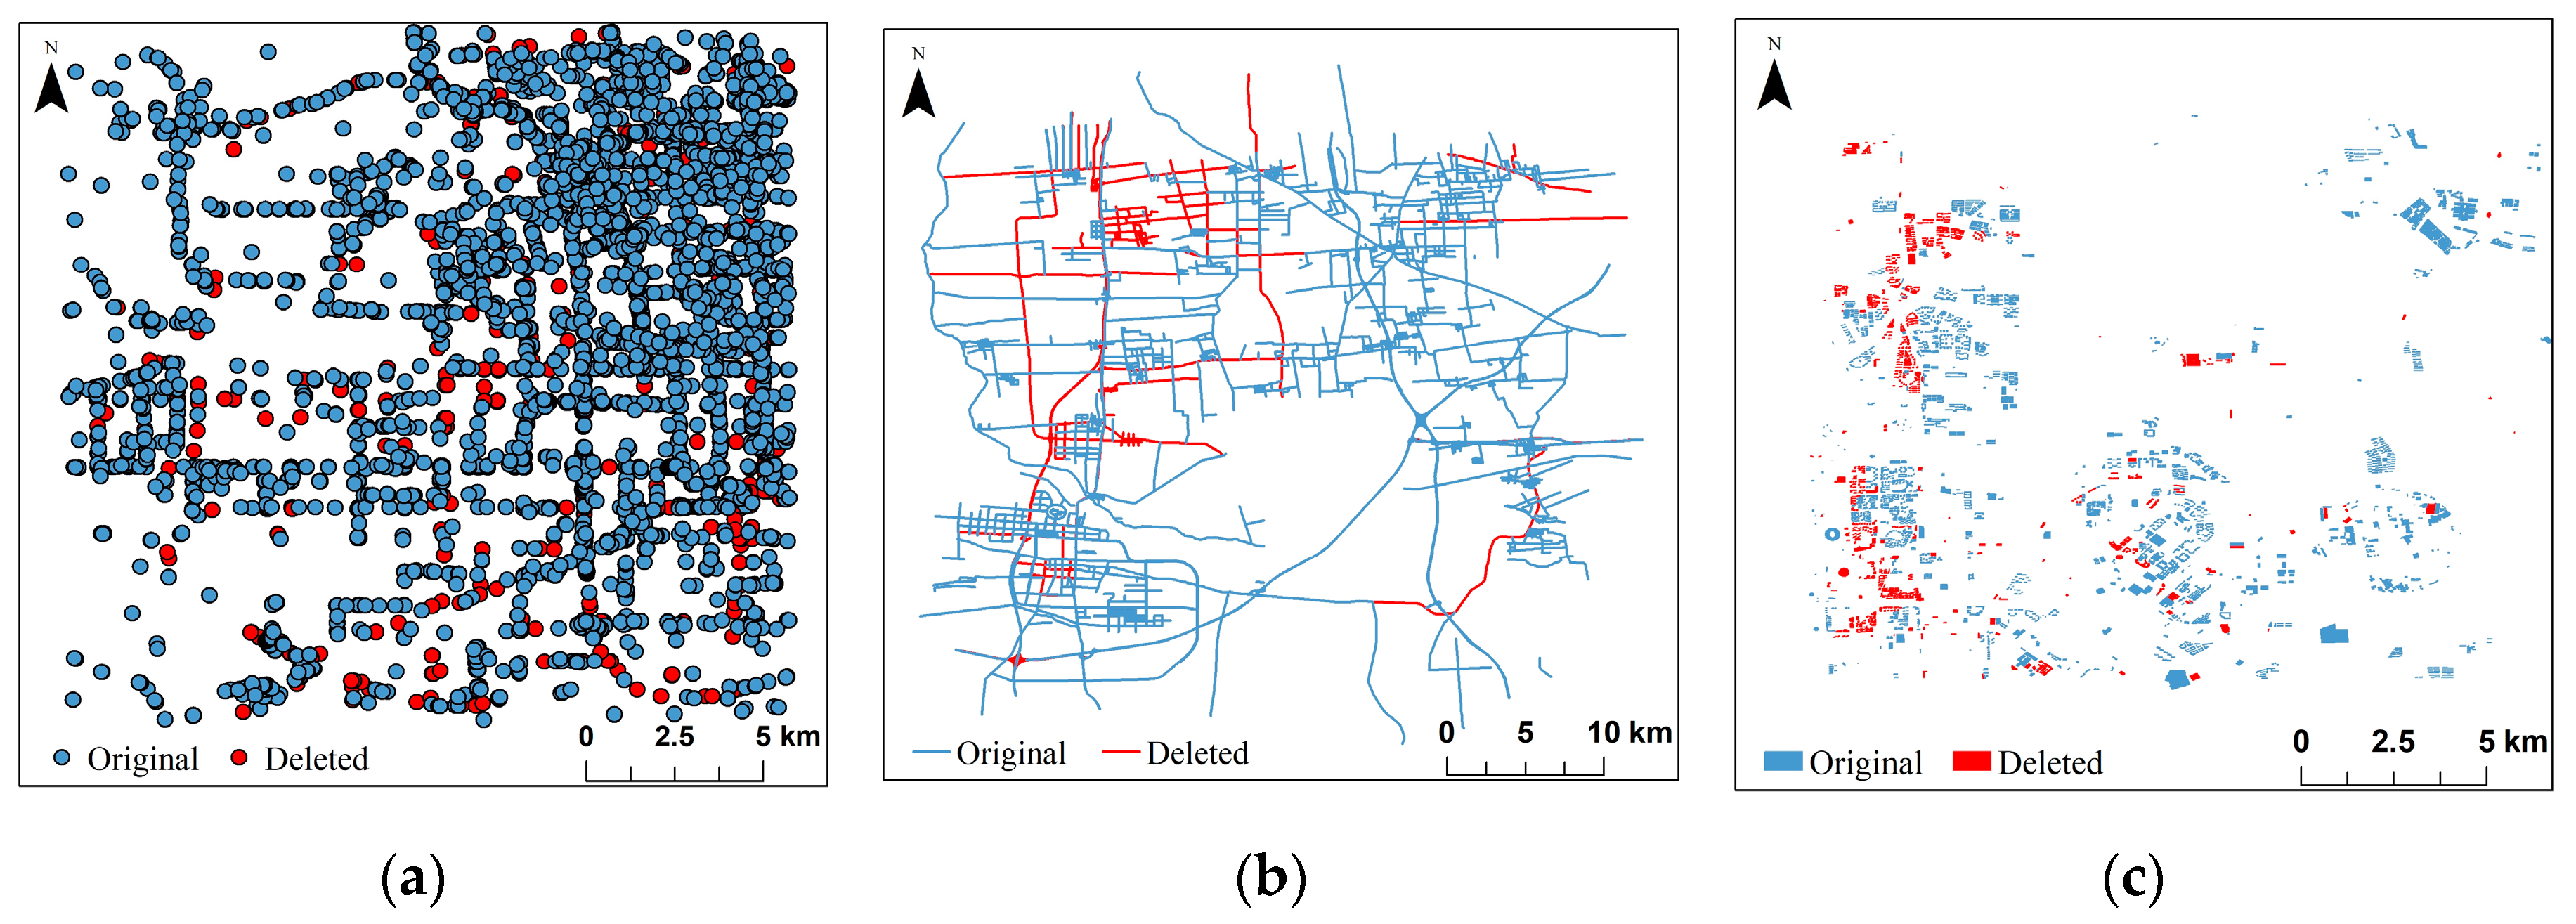
In this experiment, three different levels of deletion attack were set. Taking 20% feature deletion as an example, the comparison of different types of data and original data after the deletion attack is shown in Figure 14 and the test results are shown in Table 3. Different from interpolation attacks, deleting attacks directly destroy the spatial features of the original data. The destruction of the spatial features of the original data will inevitably lead to the loss of watermark information because current vector data digital watermarking algorithms are mostly based on spatial features for watermark embedding. Therefore, most of the vector data digital watermarking algorithms have a relatively unstable detection effect for deletion attacks; for this reason, digital watermarking technology is not used in the design process of the proposed algorithm. In the literature [16], the similarity between the detected watermark and the original watermark was 90.53%, 89.75%, and 90.60%, respectively, after a 20% deletion attack on the three types of data [16], and the authors did not perform a higher-intensity deletion attack experiment. Table 3 shows that the detection results of the proposed algorithm remain stable after deleting 90% of the experimental data.
4.2.3. Similarity Transformation Attack
In this experiment, two different attack levels were set for each subtype attack. The comparison of the different types of data and the original data after the similarity transformation attack is shown in Figure 15. As can be seen from Figure 15, the coordinate information of the data after the attack is completely different from the original data, so the RF and RC in the result are 0%, as shown in Table 4. However, the relative spatial relationship of each feature in the experimental data does not change, hence we can know that the included angle features of the data after the attack are consistent with the original data by the value of RA, which proves that the proposed algorithm has a high accuracy rate for the detection of similarity transformation attacks.
4.2.4. Feature Order Scrambling Attack
Two different attack levels were set in this experiment. The comparison between the different types of data and the original data after the feature order scrambling attack is shown in Figure 16. As we can see from Table 5, the RA in the results of the point vector data is greatly affected by the feature order scrambling attack. This is because the feature order scrambling attack may interrupt the vertex order between the before and after features somewhere in the original data, resulting in a change in the included angle between the features. Hence, the detection result RA of the point vector data has a large error with the increase of the attack level. However, the scrambling attack does not modify the spatial point feature information, thus the values of RF are 100%. Although the order between the features is modified, the vertex position of each feature remains unchanged, thus the values of RF, RA, and RC in the results are all correct. In general, the proposed algorithm has a high sensitivity to feature order scrambling attacks.
4.2.5. Feature Simplification Attack
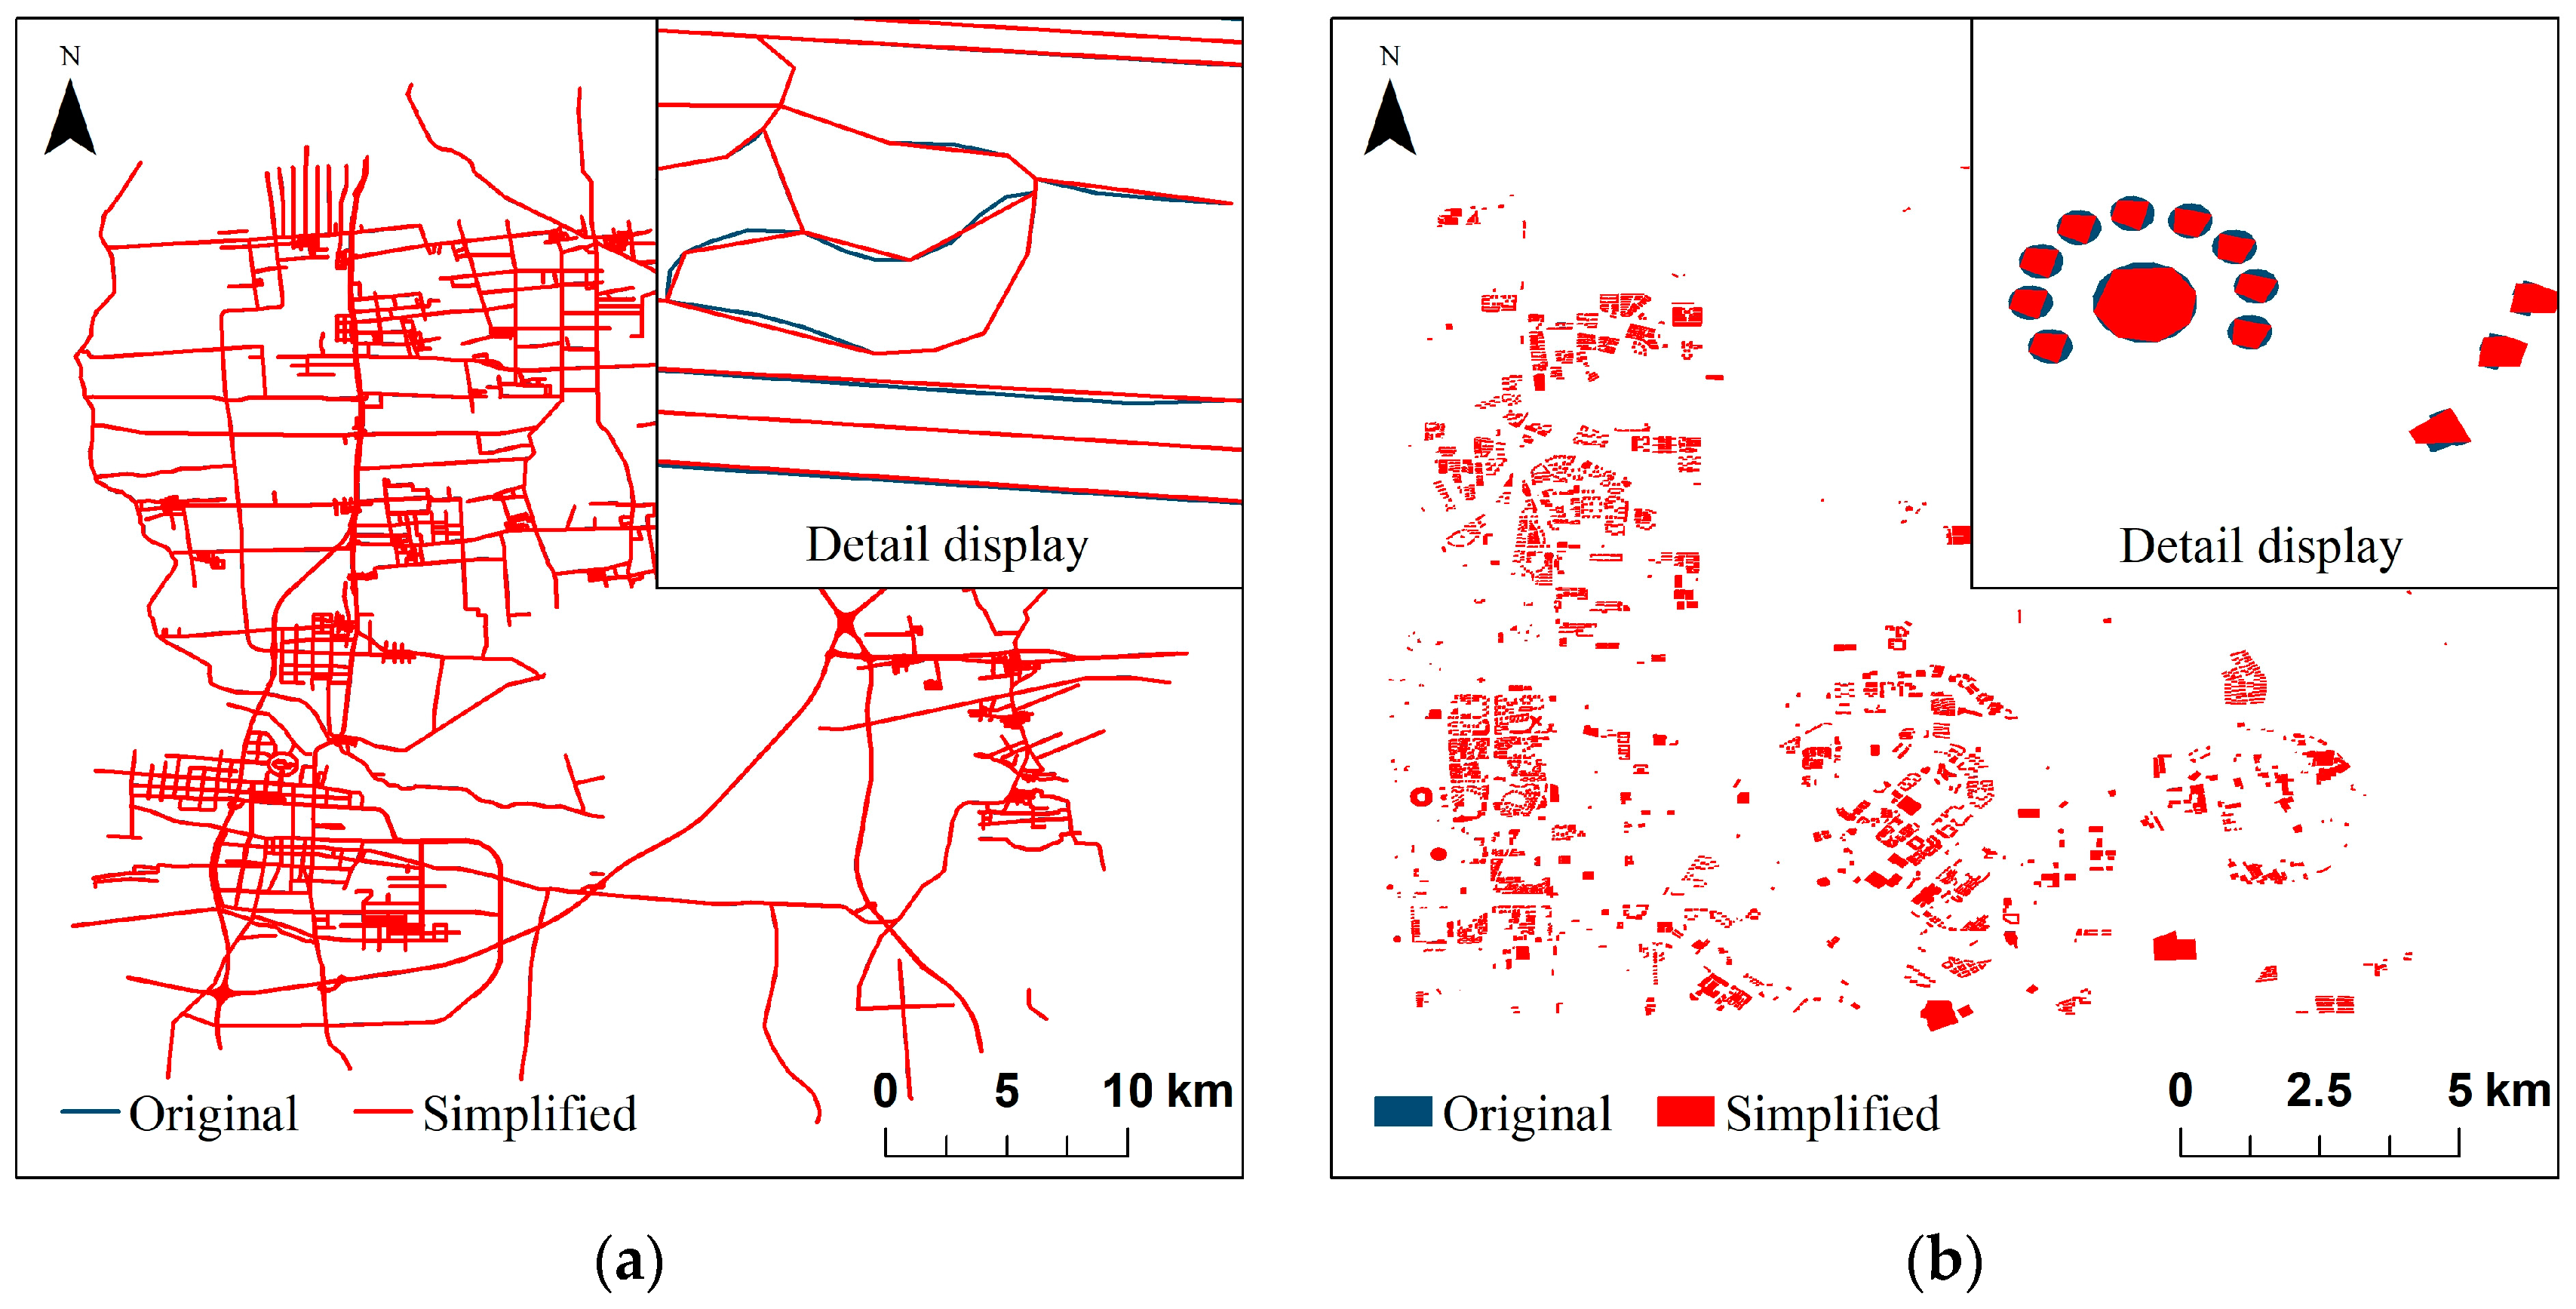
We used the Douglas–Peucker algorithm to simplify the data, and three different threshold ranges were set in this experiment to attack the data. The comparison between the different types of data and the original data after the feature simplification attack is shown in Figure 17. The feature simplification attack removes a certain number of vertices from the data, the shape of the line features and the polygon features will change, and the included angle between the features calculated based on the vertex coordinates will also change. Consequently, the values of RF and RA in the detection results of the line and polygon vector data decrease gradually with the increase of simplification attack level, as shown in Table 6. The vertex coordinates left after the data was subjected to the feature simplification attack still belong to the vertex coordinates in the original data; therefore, we can use the RC value to represent the repetition rate of the data to be detected and the original data in the feature simplification attack. In a previous study, the error rate of watermark extraction by the 20% simplification attack level on data was 3.26%, and the error rate of watermark extraction by the 30% simplification attack level on data was 6.43% [12]. As can be seen from Table 6, in the detection results of the algorithm in this paper, the error of the detection result is 3.366% when the simplification attack level is 44.3%; the error of the detection result is 4.476% when the simplification attack level is 57.2%. Hence, one can see that the proposed algorithm in this paper still has a good detection ability in the case of a higher degree of simplification attack compared with the digital watermarking algorithm in the literature [12].
4.2.6. Composite Attack
In order to further evaluate the robustness of the proposed algorithm, an experiment of composite attack was performed on the test data. The composite attack for the point vector data includes six attacks, as follows:
- Interpolating 20% of features
- Deleting 60% of features
- Translating 20% of features to the right by 20 km
- Rotating 20% of features by 50°
- Enlarging 20% of features two-fold
- Scrambling 20% of features
The composite attack for line and polygon vector data performed a simplification attack with a threshold of 10 m in addition to the above-mentioned six attacks. The comparison between the different types of data and the original data after the composite attack is shown in Figure 18. The experimental results of the composite attack are shown in Table 7. After extensive modification of the experimental data, for the point vector data, the algorithm can still detect that 57.827% (RF) of the point features from the attacked data come from the original point data, and 41.099% (RA) of the point features’ relative spatial relationships are consistent with the original data. For the line vector data, the line type experimental data is greatly destroyed in this attack, as seen in Figure 18b, but the algorithm can still identify that 12.920% (RF) of the line features, 9.604% (RA) of the included angles between the features, and 27.815% (RC) of the line feature vertex positions of the postattack data come from the original data. In total, 48.224% (RF) of the polygon features and 33.871% (RC) of the polygon vertices in the attacked data are the same as the original data, and the relative spatial relationships within 36.552% (RA) of the polygon features are not changed in the polygon vector data.
5. Discussion
We discuss the research in this paper from the following four aspects:
- (1)
- The feasibility of repetition rate in the determination of infringement: Plagiarism constitutes infringement in the copyright laws of most countries, but the definition of plagiarism needs to meet two criteria in China. One is whether the plagiarizing is protected by copyright, and the other is whether the use of other people’s works by plagiarists is beyond the scope of “appropriate citations”. The regulation of book protection in China clearly defines that the range of quantities of “appropriate citations” is one tenth of the cited works, and it constitutes an infringement when this range is exceeded. It is similar to the fact that the repetition rate in academic papers must not exceed a certain standard. Therefore, we believe that the repetition rate can be used as a judgment indicator of infringement. However, whether the above-mentioned “appropriate citations” quantity range is suitable for the copyright protection of geographic data requires further argument, which is beyond the scope of the discussion in this paper.
- (2)
- Analysis of problems in the methods and experiments in this paper: (1) Feature cardinality problem. For two vector data A and B, data A contains 80 features, and data B contains 50 features. If data B is suspected of infringement, and 40 features in data B are derived from data A, then 50 should be taken as the cardinality in the calculation of the repetition rate of data B with respect to data A, and the repetition rate is 80% instead of 50%. Hence, the number of features of the vector data with lower data volume is always taken as the cardinality in the process of calculating the repetition rate of two vector datasets in this paper. (2) Composite attack problem. In the experimental design, in order to further verify the effectiveness of the algorithm, a complex composite attack was performed on the experimental data. Although the repetition rate in the detection result was lower than in the other attack methods, the data spatial distribution after the composite attack was far from the original data, and the practical application value and copyright protection value were lost. (3) Repetition rate indicator problem. The algorithm results in this paper are not a simple general repetition rate value, but have three indicators: RF, RA, and RC. These three indicators measure the repetition rate of data from the three aspects of feature features, included angle features, and vertex features of vector data, which can resist different types of attacks more effectively and evaluate the degree of duplication between the data to be detected and the original data more scientifically.
- (3)
- The advantages of the proposed method: (1) Compared with the existing digital watermarking algorithm, the proposed method in this paper is simple and easy to understand. There is no complex mathematical calculation and it is easy to implement. (2) In the experiment, the proposed algorithm runs for a minimum of 0.459 s and the longest time is 36.244 s. The detection efficiency is at an acceptable level. (3) The proposed method in this paper is applicable to all three vector data types, which is not the case for most zero-watermarking algorithms. (4) The proposed algorithm detects the data repetition rate based on the GeoJSON format, which follows the OGC standard, and has good versatility. The proposed algorithm can be extended to any data type that can be converted to the GeoJSON format.
- (4)
- Practical application: Because the GeoJSON format is an extension of the JSON format, the proposed method can be applied to a geographic data sharing system using B/S architecture. It is especially suitable for current geographic data publishing platforms (such as the journal of Earth System Science Data) and possible future geographic data self-publishing platforms to prevent and detect infringements in the process of geographic data publishing.
- (5)
- Disadvantages: The proposed detection algorithm cannot maintain high accuracy in the recognition of a coordinate system conversion attack, which is the shortcoming of the algorithm and will be solved in future research. There are few methods in the research of vector data digital watermarking technology that can resist all attack methods at present. The proposed method in this paper can be considered to be combined with digital watermarking technology in practical applications, thereby achieving complementary advantages. For example, another digital watermarking algorithm proposed in the literature [18] can effectively identify coordinate system conversion attacks; consequently, when judging whether there is any infringement of the geographic data, our proposed method can be used to detect whether the geographic data has been subjected to interpolation attack, deletion attack, similarity transformation attack, feature order scrambling attack, and feature simplification attack, while the digital watermarking algorithm proposed in the literature [18] can be used to detect whether the geographic data has been subjected to coordinate system conversion attack, thereby the infringement can be comprehensively assessed.
6. Conclusions
In this paper, a novel infringement detection method for GIS vector databased on the GeoJSON format was proposed. The spatial features of the vector data were used for feature matching, and the infringement behavior in the vector data could be determined according to the matching results. We deeply analyzed the spatial features of the vector data, and separated three different indicators of feature features, included angle features, and vertex features, which were used to resist different types of attacks, and accurately identified the degree of data duplication. The repetition rate detection process for the three types of vector data was described in detail, and various geometric attacks were performed using the three different types of vector data to evaluate the effectiveness and robustness of the proposed algorithm. The results show that the proposed algorithm has high robustness to common geometric attacks such as interpolation attacks, deletion attacks, similarity transformation attacks, feature order scrambling attacks, and feature simplification attacks, and meets the requirements of practical applications.
Author Contributions
Conceptualization, Yun Zhang; Data curation, Yue Ding; Formal analysis, Yue Ding; Methodology, Zhi Tang; Software, Zhi Tang; Supervision, Yun Zhang; Validation, Hao He; Visualization, Jing Huang; Writing—original draft, Zhi Tang; Writing—review & editing, Jing Huang. All authors have read and agreed to the published version of the manuscript.
Funding
This research received no external funding.
Acknowledgments
We would like to thank the anonymous reviewers for their valuable comments which helped us improve the content, quality, and presentation of this paper.
Conflicts of Interest
The authors declare no conflict of interest.
References
- Zhou, W.; Zhu, C.Q.; Wu, W.D. Problem and countermeasure about secret classification and decryption of national geographic information of China. Sci. Surv. Mapp. 2016, 41, 76–79. [Google Scholar] [CrossRef]
- Lyu, W.Q. A Study on Copyright Protection of Vector Spatial Data based on Zero-Watermark and Digital Fingerprint. Master’s Thesis, Lanzhou Jiaotong University, Lanzhou, China, 15 March 2018. [Google Scholar]
- Yow, T.G.; Jennings, S.V.; Grubb, J.W.; Smith, A.W. Inside an Environmental data archive WWW site. In Environmental Software Systems: Volume 2; Denzer, R., Swayne, D.A., Schimak, G., Eds.; Springer: Boston, MA, USA, 1997; pp. 168–174. [Google Scholar] [CrossRef] [Green Version]
- Wang, J.L.; Zhu, Y.Q.; Xie, C.J. Network platform design and development for Earth system science data sharing. Earth Sci. Front. 2006, 54–59. [Google Scholar] [CrossRef]
- Kimball, J.S. Earth observation of global change: The role of satellite remote sensing in monitoring the global environment. Eos Trans. Am. Geophys. Union 2008, 89, 294. [Google Scholar] [CrossRef]
- Mocnik, F.B.; Ludwig, C.; Grinberger, A.; Jacobs, C.; Klonner, C.; Raifer, M. Shared data sources in the geographical domain—A classification schema and corresponding visualization techniques. ISPRS Int. J. Geo-Inf. 2019, 8, 242. [Google Scholar] [CrossRef] [Green Version]
- Cao, Y.R.; Lv, G.N.; Wu, P.S.; He, J.B. The position of geographic information resources property in geographic information sharing. J. Geo-Inf. Sci. 2011, 13, 611–616. [Google Scholar] [CrossRef]
- Cui, H.C. Research on the Sharing Security of Vector Geography Data. Ph.D. Thesis, Nanjing Normal University, Nanjing, China, 13 March 2013. [Google Scholar]
- Zhu, C.Q. Research progresses in digital watermarking and encryption control for geographical data. Acta Geod. Cartogr. Sin. 2017, 46, 1609–1619. [Google Scholar] [CrossRef]
- Hou, X.; Min, L.Q.; Yang, H. A reversible watermarking scheme for vector maps based on multilevel histogram modification. Symmetry 2018, 10, 397. [Google Scholar] [CrossRef] [Green Version]
- Wang, N.N.; Bian, J.L.; Zhang, H. RST invariant fragile watermarking for 2D vector map authentication. Int. J. Multimed. Ubiquitous Eng. 2015, 10, 155–172. [Google Scholar] [CrossRef]
- Gaata, M.T. Robust watermarking scheme for GIS vector maps. Ibn Al-Haitham J. Pure Appl. Sci. 2018, 31, 277–284. [Google Scholar] [CrossRef]
- Neyman, S.N.; Sitohang, B.; Sutisna, S. Reversible fragile watermarking based on difference expansion using manhattan distances for 2D vector map. Procedia Technol. 2013, 11, 614–620. [Google Scholar] [CrossRef] [Green Version]
- Abubahia, A.; Cocea, M. A clustering approach for protecting GIS vector data. In Proceedings of the Advanced Information Systems Engineering, Stockholm, Sweden, 8–12 June 2015. [Google Scholar] [CrossRef]
- Hou, X.; Min, L.Q.; Tang, L.W. Fragile watermarking algorithm for locating tampered entity groups in vector map data. Geomat. Inf. Sci. Wuhan Univ. 2019, 44. [Google Scholar] [CrossRef]
- Jin, Y.T.; Wu, J.C.; Chen, X.; Yang, X.F.; Zhou, J.W. Research on vector watermarking algorithm based on coordinate location. Spacecr. Recovery Remote Sens. 2017, 38, 98–106. [Google Scholar] [CrossRef]
- Hou, X.; Min, L.Q.; Yang, H. A fragile watermarking scheme for vector map data using geographic graticule block-wise method. J. Comput. Aided Des. Comput. Graph. 2018, 30, 2042–2048. [Google Scholar] [CrossRef]
- Liang, W.D.; Zhang, X.C.; Xi, X.; Zhang, P.C. A multiple watermarking algorithm for vector geographic data based on zero-watermarking and fragile watermarking. Acta Sci. Nat. Univ. Sunyatseni 2018, 57, 7–14. [Google Scholar] [CrossRef]
- Tong, D.Y.; Zhu, C.Q.; Ren, N. Watermarking algorithm applying to small amount of vector geographical data. Acta Geod. Cartogr. Sin. 2018, 47, 1518–1525. [Google Scholar] [CrossRef]
- Ohbuchi, R.; Ueda, H.; Endoh, S. Robust Watermarking of Vector Digital Maps. In Proceedings of the 2002 IEEE International Conference on Multimedia and Expo, ICME 2002, Lausanne, Switzerland, 26–29 August 2002. [Google Scholar] [CrossRef] [Green Version]
- Cao, L.J.; Men, C.G.; Ji, R.R. Nonlinear scrambling-based reversible watermarking for 2D-vector maps. Vis. Comput. 2013, 29, 231–237. [Google Scholar] [CrossRef]
- Peng, Z.Y.; Yue, M.L.; Wu, X.; Peng, Y.W. Blind watermarking scheme for polylines in vector geo-spatial data. Multimed. Tools Appl. 2015, 74, 11721–11739. [Google Scholar] [CrossRef]
- Tong, D.Y.; Ren, N.; Zhu, C.Q.; Lin, W. A watermarking algorithm resisting to projection transformation for vector geographic data. J. Geo-Inf. Sci. 2016, 18, 1037–1042. [Google Scholar] [CrossRef]
- Yan, H.W.; Zhang, L.M.; Yang, W.F. A normalization-based watermarking scheme for 2D vector map data. Earth Sci. Inform. 2017, 10, 471–481. [Google Scholar] [CrossRef]
- Wang, X.; Huang, D.J.; Zhang, Z.Y. A DCT-based blind watermarking algorithm for vector digital maps. Adv. Mater. Res. 2011, 179–180, 1053–1058. [Google Scholar] [CrossRef]
- Neyman, S.N.; Pradnyana, N.P.; Sitohang, B. A new copyright protection for vector map using FFT-based watermarking. Telkomnika 2014, 12, 367–378. [Google Scholar] [CrossRef] [Green Version]
- Zhang, L.M.; Yan, H.W.; Qi, J.X.; Zhang, Y.Z. A blind watermarking algorithm for copyright protection of vector geospatial data under controllable errors based on DFT. Geomat. Inf. Sci. Wuhan Univ. 2015, 40, 990–994. [Google Scholar] [CrossRef]
- Im, D.H.; Lee, H.Y.; Ryu, S.J.; Lee, H.K. Vector watermarking robust to both global and local geometrical distortions. IEEE Signal Process. Lett. 2008, 15, 789–792. [Google Scholar] [CrossRef]
- Wang, C.J.; Peng, Z.Y.; Peng, Y.W.; Yu, L.; Wang, J.Z.; Zhao, Q.Z. Watermarking geographical data on spatial topological relations. Multimed. Tools Appl. 2012, 57, 67–89. [Google Scholar] [CrossRef]
- Lee, S.H.; Huo, X.J.; Kwon, K.R. Vector watermarking method for digital map protection using arc length distribution. IEICE Trans. Inf. Syst. 2014, 97, 34–42. [Google Scholar] [CrossRef] [Green Version]
- Zhang, C.; Li, A.B.; Lv, G.N.; Lin, B.X. A reversible watermakering algrithm for vector map based on angle modulating. J. Geo-Inf. Sci. 2013, 15, 180–186. [Google Scholar] [CrossRef]
- Abubahia, A.; Cocea, M. Partition clustering for GIS map data protection. In Proceedings of the 2014 IEEE 26th International Conference on Tools with Artificial Intelligence (ICTAI 2014), Limassol, Cyprus, 10–12 November 2014. [Google Scholar] [CrossRef] [Green Version]
- Wang, X.; Huang, D.J.; Zhang, Z.Y. A robust zero-watermarking algorithm for vector digital maps based on statistical characteristics. J. Softw. 2012, 7, 2349–2356. [Google Scholar] [CrossRef]
- Peng, Y.W.; Yue, M.L. A zero-watermarking scheme for vector map based on feature vertex distance ratio. J. Electr. Comput. Eng. 2015, 2015, 421529. [Google Scholar] [CrossRef] [Green Version]
- Cao, L.J.; Men, C.G.; Gao, Y. A recursive embedding algorithm towards lossless 2D vector map watermarking. Digit. Signal Process. 2013, 23, 912–918. [Google Scholar] [CrossRef]
- Sun, Y.C.; Li, D. Vector map zero-watermark algorithm based on node feature. Geogr. Geo-Inf. Sci. 2017, 33, 17–21. [Google Scholar] [CrossRef]
- Lyu, W.Q.; Zhang, L.M. A DFT-based zero-watermarking algorithm for vector geodata. J. Geomat. Sci. Technol. 2018, 35, 94–98. [Google Scholar] [CrossRef]
- The GeoJSON Format. Available online: https://www.rfc-editor.org/info/rfc7946 (accessed on 12 December 2019).
- Simple Feature Access—Part 2: SQL Option. Available online: https://www.opengeospatial.org/standards/sfs (accessed on 12 December 2019).
Figure 1.
Point type vector data in GeoJSON: (a) Point type vector data; (b) GeoJSON format of the Point type vector data.
Figure 1.
Point type vector data in GeoJSON: (a) Point type vector data; (b) GeoJSON format of the Point type vector data.

Figure 2.
MultiPoint type vector data in GeoJSON: (a) MultiPoint type vector data; (b) GeoJSON format of the MultiPoint type vector data.
Figure 2.
MultiPoint type vector data in GeoJSON: (a) MultiPoint type vector data; (b) GeoJSON format of the MultiPoint type vector data.

Figure 3.
LineString type vector data in GeoJSON: (a) LineString type vector data; (b) GeoJSON format of the LineString type vector data; (c) The direction of the line feature.
Figure 3.
LineString type vector data in GeoJSON: (a) LineString type vector data; (b) GeoJSON format of the LineString type vector data; (c) The direction of the line feature.

Figure 4.
MultiLineString type vector data in GeoJSON: (a) MultiLineString type vector data; (b) GeoJSON format of the MultiLineString type vector data; (c) The direction of the line feature and visual representation of GeoJSON data structure of MultiLineString type vector data.
Figure 4.
MultiLineString type vector data in GeoJSON: (a) MultiLineString type vector data; (b) GeoJSON format of the MultiLineString type vector data; (c) The direction of the line feature and visual representation of GeoJSON data structure of MultiLineString type vector data.


Figure 5.
Polygon type vector data in GeoJSON: (a) Polygon type vector data; (b) GeoJSON format of the Polygon type vector data; (c) Vertex storage order of Polygon type data.
Figure 5.
Polygon type vector data in GeoJSON: (a) Polygon type vector data; (b) GeoJSON format of the Polygon type vector data; (c) Vertex storage order of Polygon type data.


Figure 6.
MultiPolygon type vector data in GeoJSON: (a) MultiPolygon type vector data; (b) GeoJSON format of the MultiPolygon type vector data; (c) Vertex storage order of MultiPolygon type data.
Figure 6.
MultiPolygon type vector data in GeoJSON: (a) MultiPolygon type vector data; (b) GeoJSON format of the MultiPolygon type vector data; (c) Vertex storage order of MultiPolygon type data.


Figure 7.
Azimuth angle calculation when P is in different quadrants.

Figure 8.
Included angle calculation: (a) Schematic diagram of line segment P and line segment L; (b) When the position of line segment L is between the y’-axis and P’ (∠PAz > ∠LAz).
Figure 8.
Included angle calculation: (a) Schematic diagram of line segment P and line segment L; (b) When the position of line segment L is between the y’-axis and P’ (∠PAz > ∠LAz).

Figure 9.
Polygon mean center calculation.

Figure 10.
Detection indicators of point, line, and polygon: (a) Detection indicators of point; (b) Detection indicators of line; (c) Detection indicators of polygon and change of mean center when the polygon is modified.
Figure 10.
Detection indicators of point, line, and polygon: (a) Detection indicators of point; (b) Detection indicators of line; (c) Detection indicators of polygon and change of mean center when the polygon is modified.


Figure 11.
Experimental dataset: (a) Overview; (b) Detailed display.

Figure 12.
Data preprocessing process.

Figure 13.
Comparison of different types of data and original data after an interpolation attack: (a) Point type vector data; (b) Line type vector data; (c) Polygon type vector data.
Figure 13.
Comparison of different types of data and original data after an interpolation attack: (a) Point type vector data; (b) Line type vector data; (c) Polygon type vector data.

Figure 14.
Comparison of different types of data and original data after deletion attack: (a) Point type vector data; (b) Line type vector data; (c) Polygon type vector data.
Figure 14.
Comparison of different types of data and original data after deletion attack: (a) Point type vector data; (b) Line type vector data; (c) Polygon type vector data.

Figure 15.
Comparison of different types of data and original data after similarity transformation attack: (a) Translation attack of point type vector data; (b) Rotation attack of point type vector data; (c) Scaling attack of point type vector data; (d) Translation attack of line type vector data; (e) Rotation attack of line type vector data; (f) Scaling attack of line type vector data; (g) Translation attack of polygon type vector data; (h) Rotation attack of polygon type vector data; (i) Scaling attack of polygon type vector data.

Figure 16.
Comparison of different types of data and original data after a feature order scrambling attack: (a) Point type vector data; (b) Line type vector data; (c) Polygon type vector data.
Figure 16.
Comparison of different types of data and original data after a feature order scrambling attack: (a) Point type vector data; (b) Line type vector data; (c) Polygon type vector data.

Figure 17.
Comparison of different types of data and original data after feature simplification attack: (a) Line type vector data; (b) Polygon type vector data.
Figure 17.
Comparison of different types of data and original data after feature simplification attack: (a) Line type vector data; (b) Polygon type vector data.

Figure 18.
Comparison of different types of data and original data after composite attack: (a) Point type vector data; (b) Line type vector data; (c) Polygon type vector data.
Figure 18.
Comparison of different types of data and original data after composite attack: (a) Point type vector data; (b) Line type vector data; (c) Polygon type vector data.


Table 1.
Algorithm flow.
| Infringement Detection Algorithm for GIS Vector Data |
|---|
| Input: |
| DR: raw vector data with correct copyright, |
| DT: suspected infringing vector data. |
| Output: RT, RPoint, RLineString, RPolygon: RT is the repetition rate of vector data, according to the input vector data type, there are three subtypes of RT, namely RPoint, RLineString and RPolygon. RPoint includes point feature repetition rate RPTF and point feature included angle repetition rate RPTA; RLineString includes line feature repetition rate RLSF, line feature included angle repetition rate RLSA and line feature vertex repetition rate RLSC; RPolygon includes polygon feature repetition rate RPNF, polygon feature included angle repetition rate RPNA and polygon feature vertex repetition rate RPNC. |
| Initialize: |
| Feature cardinality: FBC = 0, |
| Number of repeated features: FRC = 0, |
| Number of repeated included angles: FARC = 0, |
| Number of repeated vertices: FCRC = 0. |
| Method: |
| — determine feature cardinality in DR and DT, take the smaller cardinality as FBC; |
| — determine the data type of DR and DT as R and T; |
| — if R is Point and T is Point then: |
| — for i in DR: |
| — for j in DT: |
| — if the coordinates of i are equal to the coordinates of j then: |
| — FRC ++; |
| — calculate the included angle formed by the point feature connection lines in DR and DT respectively to get two included angle sets AR and AT; |
| — determine the cardinality of AR and AT, take the smaller cardinality as the ABC; |
| — for i in AR: |
| — for j in AT: |
| — if i equals j then: |
| — FARC ++; |
| — break; |
| — calculate RPTF = (FRC/FBC) × 100% and RPTA = (FARC/ABC) × 100%; |
| — return: RPoint = [RPTF, RPTA]; RT = max [RPTF, RPTA]; |
| — else if R is LineString and T is LineString then: |
| — for i in DR: |
| — for j in DT: |
| — if The starting point coordinate of i is equal to the starting point coordinate of j and the end point coordinate of i is equal to the end point coordinate of j then: |
| — FRC ++; |
| — calculate the included angle formed by the line features in DR and DT respectively to get two included angle sets AR and AT; |
| — determine the cardinality of AR and AT, take the smaller cardinality as ABC; |
| — for i in AR: |
| — for j in AT: |
| — if i equals j then: |
| — FARC ++; |
| — break; |
| — extract the vertex coordinates of all line features in DR and DT respectively to get two vertex coordinate sets CR and CT; |
| — remove the repeated elements in CR and CT respectively, determine the cardinality of the two sets, take the smaller cardinality as CBC; |
| — for i in CR: |
| — for j in CT: |
| — if the coordinates of i are equal to the coordinates of j then: |
| — FCRC ++; |
| — break; |
| — calculate RLSF = (FRC/FBC) × 100%, RLSA = (FARC/ABC) × 100% |
| and RLSC = (FCRC/CBC) × 100%; |
| — return: RLineString = [RLSF, RLSA, RLSC]; RT = max [RLSF, RLSA, RLSC]; |
| — else if R is Polygon and T is Polygon then: |
| — extract the coordinates of all polygon vertices in DR and DT respectively to get two vertex coordinate sets CR and CT; extract the included angles in all polygons to get two included angle sets AR and AT, respectively; extract the coordinates of the mean center of all the polygons to get the central coordinate sets MR and MT, respectively; determine the cardinality of each pair of sets, respectively; take the smaller cardinality as CBC, ABC, MBC; |
| — for i in CR: |
| — for j in CT: |
| — if the coordinates of i are equal to the coordinates of j then: |
| — FCRC ++; |
| — break; |
| — for i in AR: |
| — for j in AT: |
| — if i equals j then: |
| — FARC ++; |
| — break; |
| — for i in MR: |
| — for j in MT: |
| — if the coordinates of i are equal to the coordinates of j then: |
| — FRC ++; |
| — break; |
| — calculate RPNF = (FRC/MBC) × 100%, RPNA= (FARC/ABC) × 100% and RPNC = (FCRC/CBC) × 100%; |
| — return: RPolygon = [RPNF, RPNA, RPNC]; RT = max [RPNF, RPNA, RPNC]; |
| — else then: |
| — return: incorrect data type (error massage). |
Table 2.
Test results of interpolation attack.
| Data Type | Number of Features | Attack Level | RT | Results of Each Indicator | Time Taken (s) | ||
|---|---|---|---|---|---|---|---|
| RF1 | RA2 | RC3 | |||||
| Point | 5347 | Inserting 20% | 100% | 100% | 99.888% | — | 1.34 |
| Inserting 50% | 100% | 100% | 99.888% | — | 1.64 | ||
| Inserting 90% | 100% | 100% | 99.888% | — | 2.23 | ||
| Line | 11,022 | Inserting 20% | 100% | 100% | 100% | 98.787% | 15.81 |
| Inserting 50% | 100% | 100% | 100% | 98.787% | 24.96 | ||
| Inserting 90% | 100% | 100% | 100% | 98.787% | 36.24 | ||
| Polygon | 4524 4 | Inserting 20% | 100% | 99.912% | 99.937% | 100% | 6.86 |
| Inserting 50% | 100% | 99.912% | 99.937% | 100% | 9.20 | ||
| Inserting 90% | 100% | 99.912% | 99.937% | 100% | 14.28 | ||
1 Feature features repetition rate, used to represent the repetition rate of the absolute spatial position of the features; 2 Included angle features repetition rate, used to represent the repetition rate of the relative spatial relationship of the features; 3 Vertex features repetition rate, used to represent the repetition rate of the vertex coordinate repetition rate of the line or polygon data; 4 This number refers to the number of all polygon features, including the number of holes inside the polygon features.
Table 3.
Test results of deletion attack.
| Data Type | Number of Features | Attack Level | RT | Results of Each Indicator | Time Taken (s) | ||
|---|---|---|---|---|---|---|---|
| RF | RA | RC | |||||
| Point | 5347 | Deleting 20% | 100% | 100% | 99.883% | — | 0.95 |
| Deleting 50% | 100% | 100% | 99.925% | — | 0.72 | ||
| Deleting 90% | 100% | 100% | 100% | — | 0.46 | ||
| Line | 11,022 | Deleting 20% | 100% | 100% | 100% | 98.88% | 11.97 |
| Deleting 50% | 100% | 100% | 100% | 98.932% | 8.76 | ||
| Deleting 90% | 100% | 100% | 100% | 99.171% | 7.54 | ||
| Polygon | 4524 | Deleting 20% | 100% | 100% | 99.917% | 100% | 4.92 |
| Deleting 50% | 100% | 100% | 99.848% | 100% | 3.61 | ||
| Deleting 90% | 100% | 100% | 99.948% | 100% | 2.67 | ||
Table 4.
Test results of similarity transformation attack.
| Data Type | Number of Features | Subtype of Attack | Attack Level | RT | Results of Each Indicator | Time Taken (s) | ||
|---|---|---|---|---|---|---|---|---|
| RF | RA | RC | ||||||
| Point | 5347 | Translation | Left translating 20 km | 99.988% | 0% | 99.988% | — | 1.136 |
| Left translating 50 km | 99.988% | 0% | 99.988% | — | 1.173 | |||
| Rotation | Counterclockwise rotating 20° | 99.719% | 0% | 99.719% | — | 1.131 | ||
| Clockwise rotating 60° | 99.588% | 0% | 99.588% | — | 1.173 | |||
| Scaling | Enlarging 1 times | 99.888% | 0% | 99.888% | — | 1.79 | ||
| Shrinking 1 times | 99.663% | 0% | 99.663% | — | 1.803 | |||
| Line | 11,022 | Translation | Right translating 20 km | 100% | 0% | 100% | 0% | 14.229 |
| Right translating 50 km | 100% | 0% | 100% | 0% | 14.743 | |||
| Rotation | Counterclockwise rotating 20° | 99.896% | 0% | 99.896% | 0% | 16.816 | ||
| Clockwise rotating 60° | 99.831% | 0% | 99.831% | 0% | 15.119 | |||
| Scaling | Enlarging 1 times | 100% | 0% | 100% | 0% | 14.329 | ||
| Shrinking 1 times | 99.791% | 0% | 99.791% | 0% | 14.147 | |||
| Polygon | 4524 | Translation | Upward translating 20 km | 99.937% | 0% | 99.937% | 0% | 6.96 |
| Upward translating 50 km | 99.937% | 0% | 99.937% | 0% | 6.771 | |||
| Rotation | Counterclockwise rotating 20° | 98.870% | 0% | 98.870% | 0% | 6.624 | ||
| Clockwise rotating 60° | 98.958% | 0% | 98.958% | 0% | 6.745 | |||
| Scaling | Enlarging 1 times | 99.937% | 0% | 99.937% | 0% | 7.236 | ||
| Shrinking 1 times | 98.927% | 0% | 98.927% | 0% | 6.954 | |||
Table 5.
Test results of feature order scrambling attack.
| Data Type | Number of Features | Attack Level | RT | Results of Each Indicator | Time Taken (s) | ||
|---|---|---|---|---|---|---|---|
| RF | RA | RC | |||||
| Point | 5347 | Scrambling 20% | 100% | 100% | 52.001% | — | 1.177 |
| Scrambling 50% | 100% | 100% | 25.065% | — | 1.253 | ||
| Line | 11,022 | Scrambling 20% | 100% | 100% | 99.984% | 99.286% | 14.73 |
| Scrambling 50% | 100% | 100% | 100% | 98.781% | 22.846 | ||
| Polygon | 4523 | Scrambling 20% | 100% | 99.912% | 99.921% | 100% | 5.862 |
| Scrambling 50% | 100% | 99.912% | 99.927% | 100% | 5.945 | ||
Table 6.
Test results of feature simplification attack.
| Data Type | Number of Features | Threshold | Compression Rate | RT | Results of Each Indicator | Time Taken (s) | ||
|---|---|---|---|---|---|---|---|---|
| RF | RA | RC | ||||||
| Line | 6993 | 5 m | 55.7% | 96.634% | 61.519% | 43.788% | 96.634% | 10.249 |
| 10 m | 46.8% | 95.83% | 54.080% | 37.421% | 95.83% | 9.403 | ||
| 15 m | 42.8% | 95.254% | 0% | 35.836% | 95.254% | 8.787 | ||
| Polygon | 4521 | 5 m | 86.9% | 99.933% | 83.256% | 84.825% | 99.933% | 5.285 |
| 10 m | 77.97% | 99.936% | 67.883% | 73.082% | 99.936% | 4.811 | ||
| 15 m | 66.5% | 99.938% | 29.927% | 52.889% | 99.938% | 4.594 | ||
Table 7.
Test results of composite attack.
| Data Type | Number of Features | Types of Attack | RT | Results of Each Indicator | Time Taken (s) | ||
|---|---|---|---|---|---|---|---|
| RF | RA | RC | |||||
| Point | 2568 | Interpolation attack, deletion attack, similarity transformation attack, feature order scrambling attack | 57.827% | 57.827% | 41.099% | — | 1.02 |
| Line | 2918 | Interpolation attack, deletion attack, similarity transformation attack, feature order scrambling attack, feature simplification attack | 27.815% | 12.920% | 9.604% | 27.815% | 7.755 |
| Polygon | 2170 | Interpolation attack, deletion attack, similarity transformation attack, feature order scrambling attack, feature simplification attack | 48.224% | 48.224% | 36.552% | 33.871% | 5.084 |
© 2019 by the authors. Licensee MDPI, Basel, Switzerland. This article is an open access article distributed under the terms and conditions of the Creative Commons Attribution (CC BY) license (http://creativecommons.org/licenses/by/4.0/).
Share and Cite
MDPI and ACS Style
Tang, Z.; Zhang, Y.; Huang, J.; He, H.; Ding, Y. A Novel Infringement Detection Method for GIS Vector Data. ISPRS Int. J. Geo-Inf. 2020, 9, 12. https://0-doi-org.brum.beds.ac.uk/10.3390/ijgi9010012
AMA Style
Tang Z, Zhang Y, Huang J, He H, Ding Y. A Novel Infringement Detection Method for GIS Vector Data. ISPRS International Journal of Geo-Information. 2020; 9(1):12. https://0-doi-org.brum.beds.ac.uk/10.3390/ijgi9010012
Chicago/Turabian StyleTang, Zhi, Yun Zhang, Jing Huang, Hao He, and Yue Ding. 2020. "A Novel Infringement Detection Method for GIS Vector Data" ISPRS International Journal of Geo-Information 9, no. 1: 12. https://0-doi-org.brum.beds.ac.uk/10.3390/ijgi9010012
Note that from the first issue of 2016, this journal uses article numbers instead of page numbers. See further details here.