1. Introduction
Land use optimization, as one important kind of resource allocation, can be defined as the process of allocating different activities to various geographical units, such as residential land, industrial land, recreational facility, green land, etc. Therein, different objectives will result in different land use allocations and consequently, the achievement of multiple objectives simultaneously will result in quite a complicated trade-off process. For instance, with the notion of sustainability, three different objectives are strived for, such as environmental preservation, economic prosperity, and social equity. It is obvious that for planners and policymakers it is difficult to achieve these objectives simultaneously by making use of traditional methods. Therefore, it is necessary to look for methods in which multiple objectives could be considered effectively and simultaneously, despite its complexity.
Both concepts of sustainability and livability have been widely discussed in land use planning and optimization, which is to achieve the ultimate goal of reaching sustainability and improving livability. Gough [
1] described the overlap and separation between these two concepts and demonstrated the complementarity and conflict between sustainability and livability. Sustainability considers the long-term consequences of the development more, which aims to meet the current generations’ needs without threatening the lives of future generation [
2]. In contrast, livability concentrates on the idea of "now" and "here", which refers to more explicit goals and immediate interference [
3]. Pacione [
4] states that urban livability is a relative term which takes “place, time, and purpose of the assessment and on the value system of the assessor” into consideration. This definition of livability emphasizes human and environment interaction.
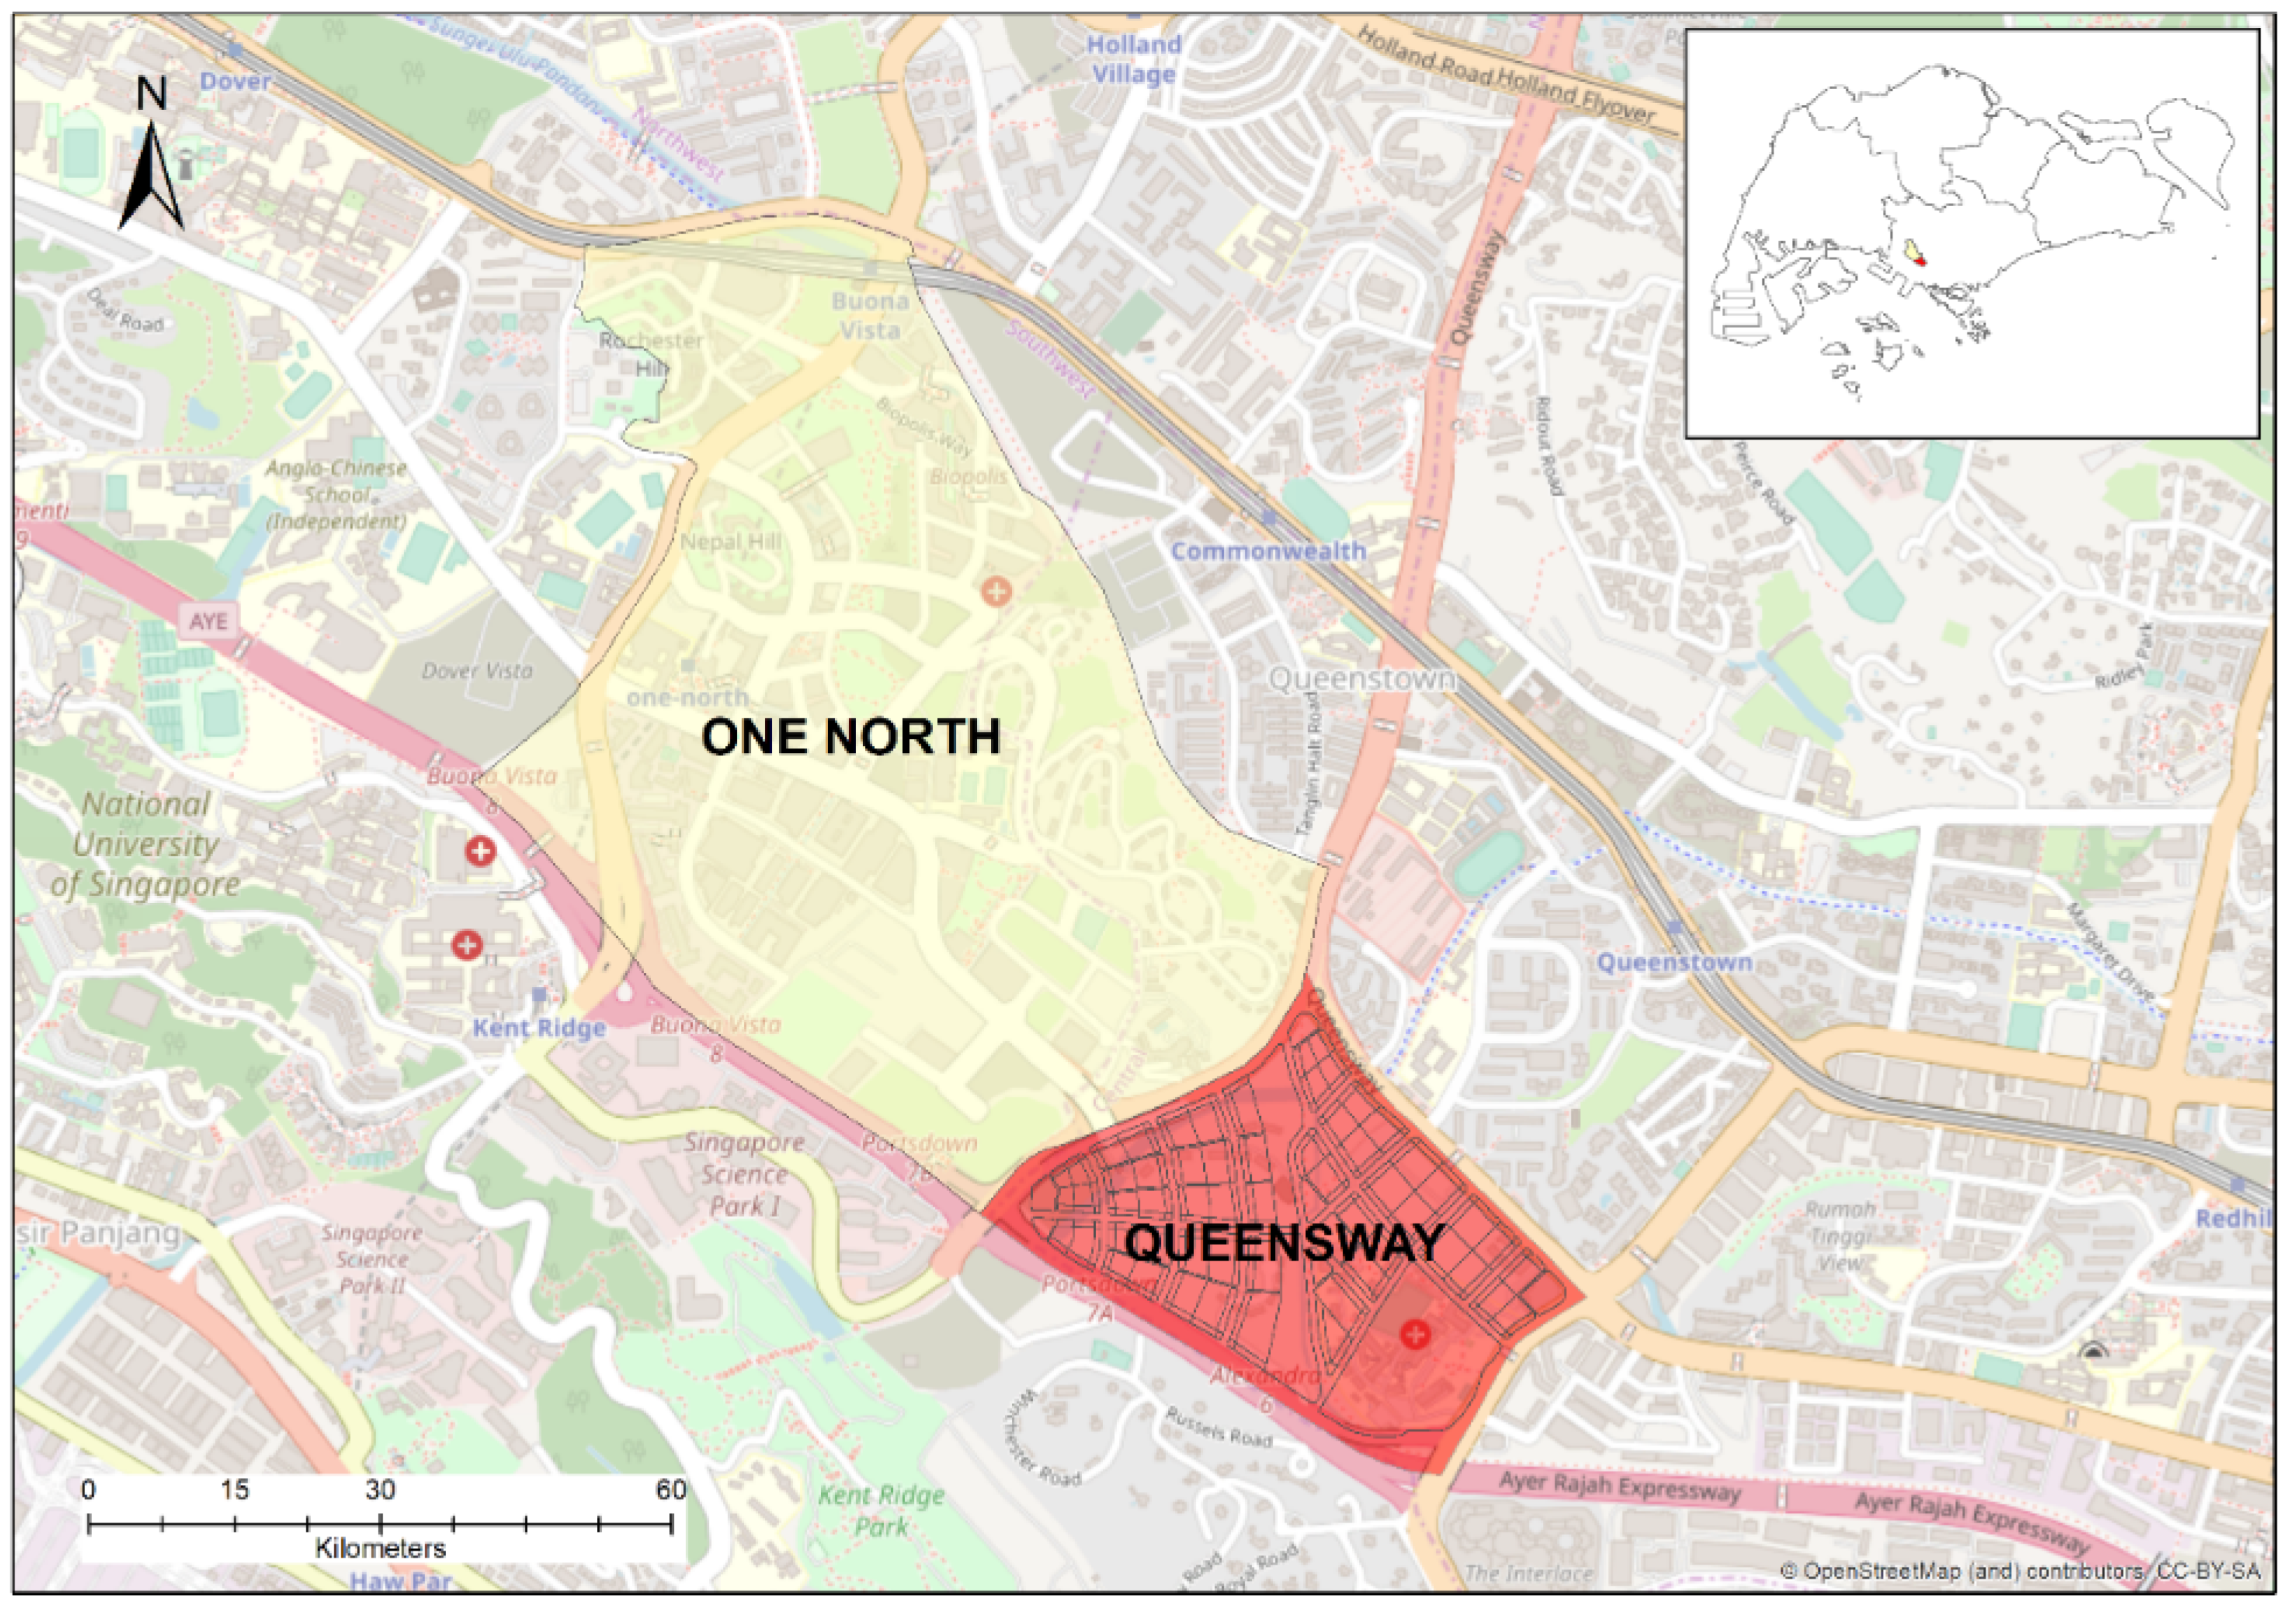
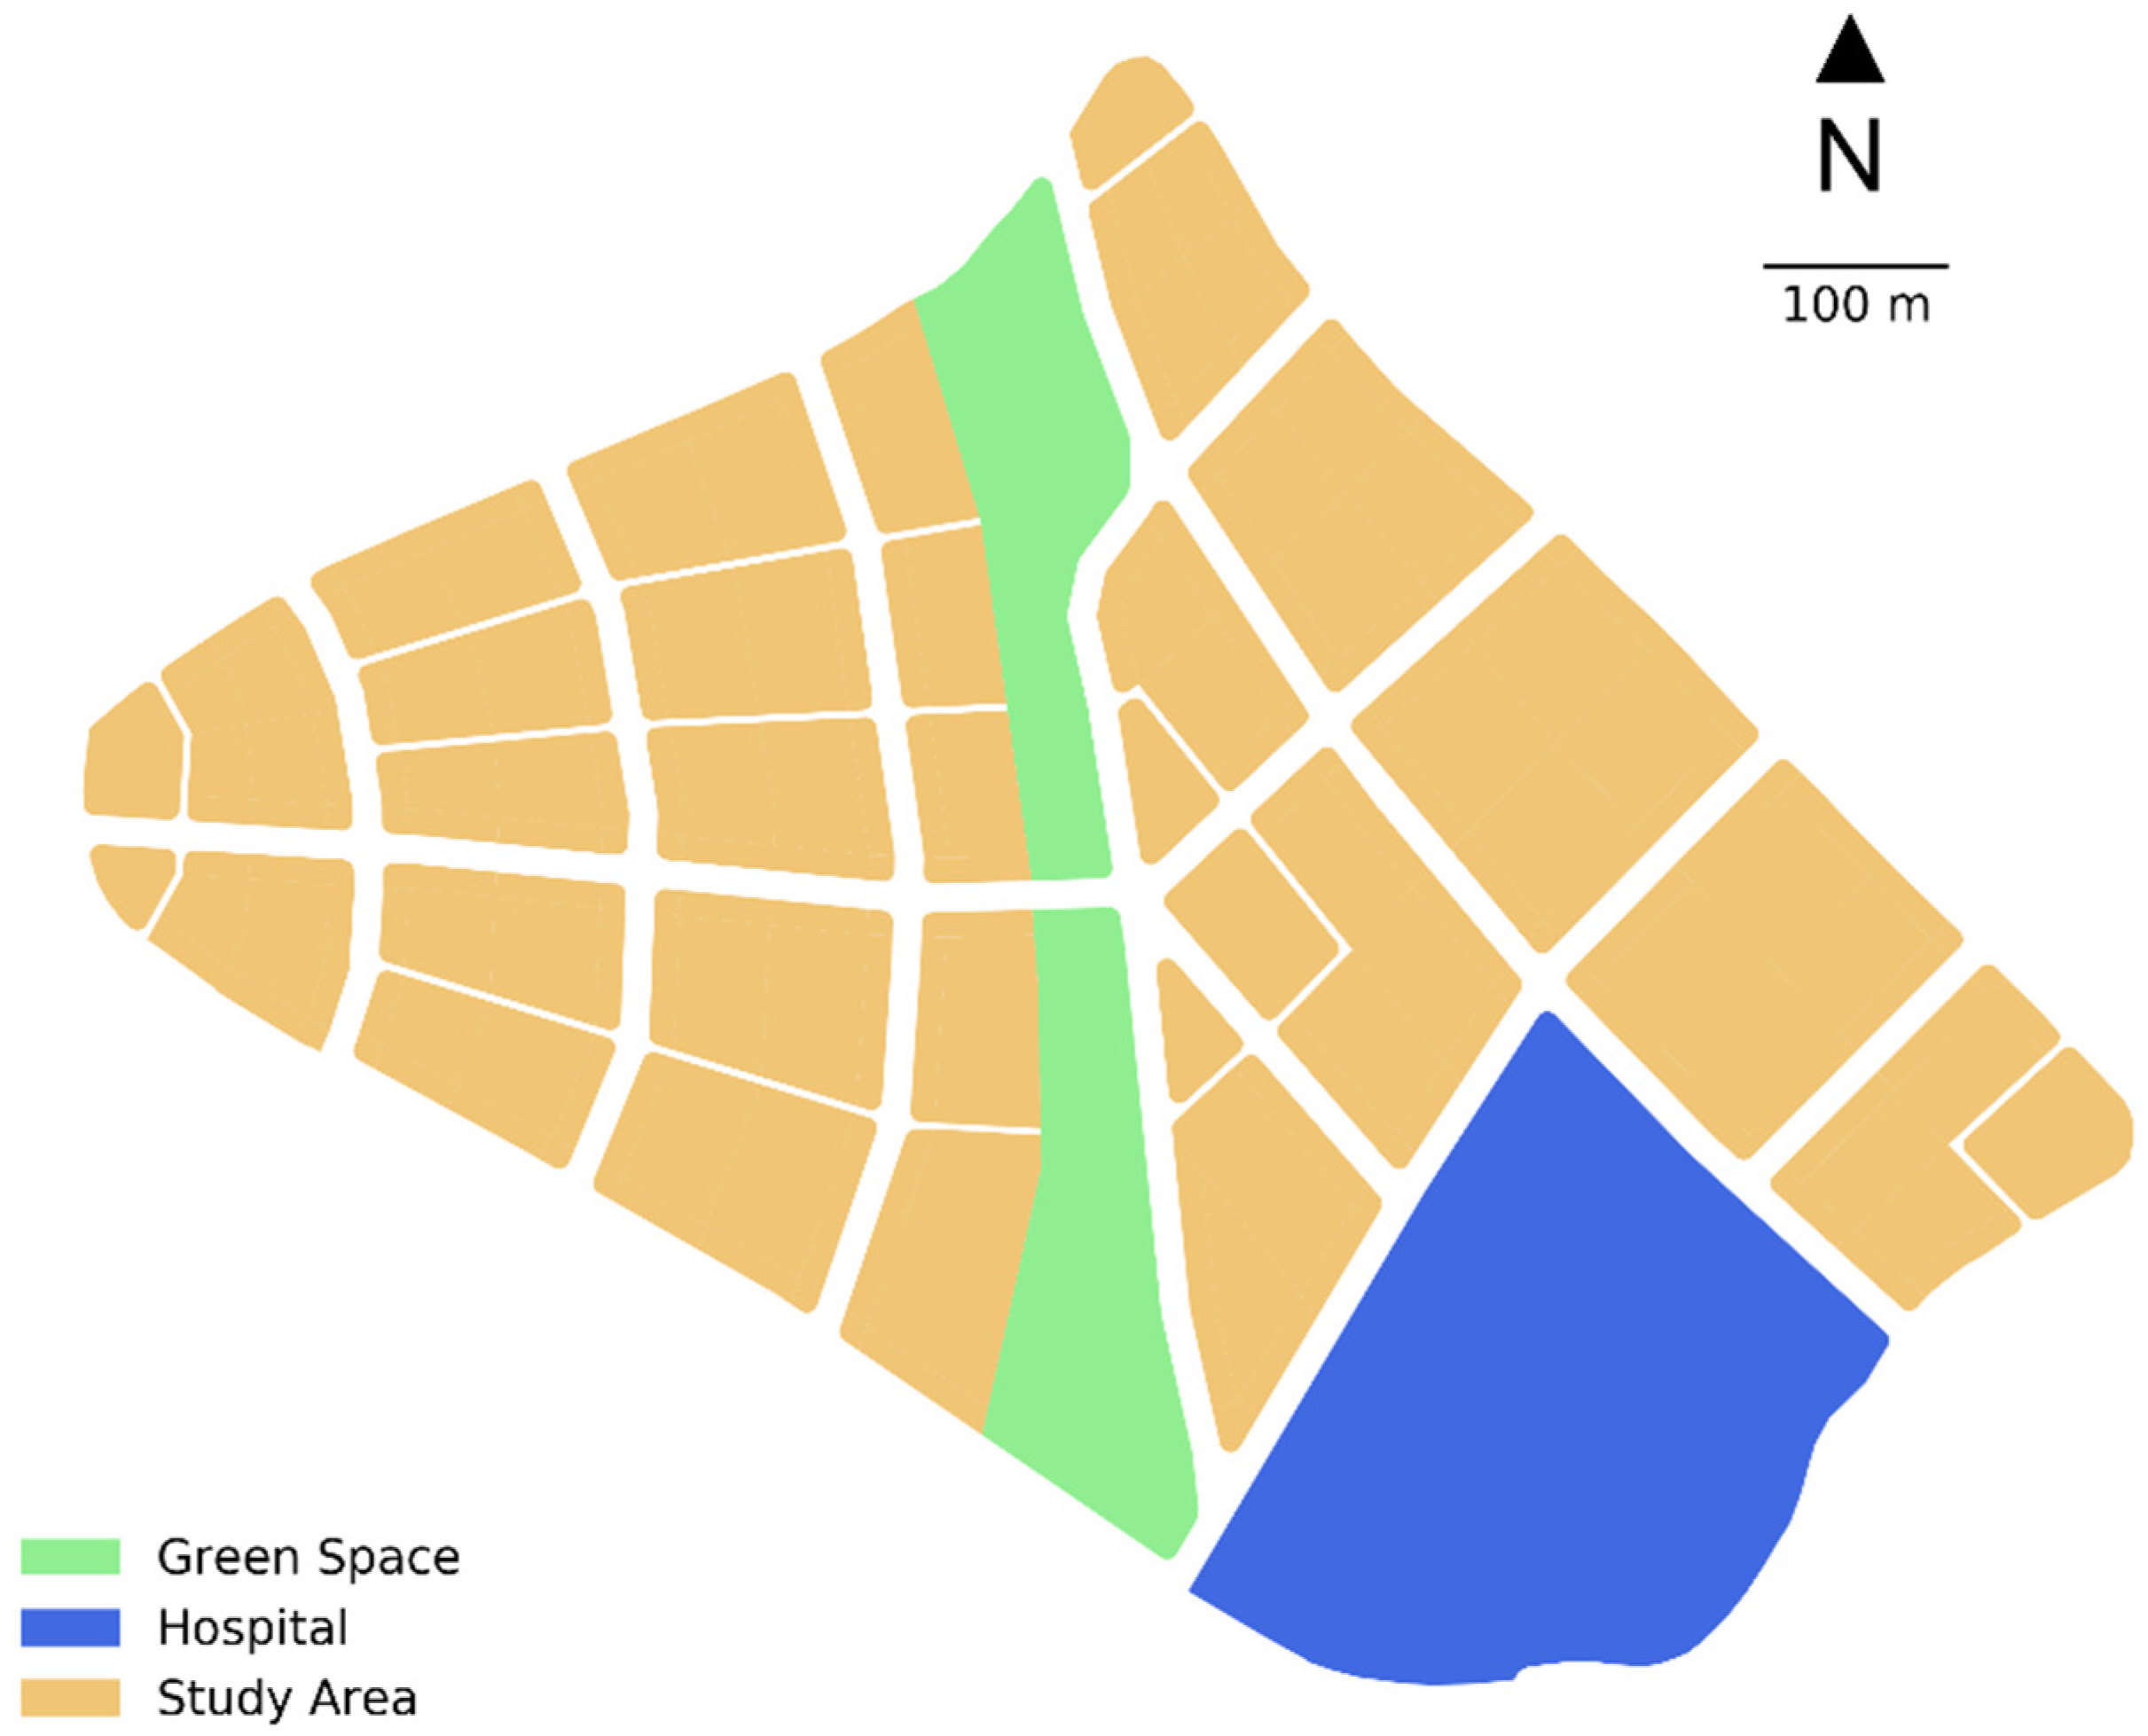
How to optimize the land use allocation has been discussed in various studies towards long-term sustainability in the past. Besides the idea of long-term sustainability, promoting current livability to create a desirable living environment should also be seen as another appealing direction or objective in land use planning and optimization. For land use planning and optimization, to raise livability is to create a more desired and livable environment through the allocation of land use types and reasonable use of natural resources while allowing the environment, economy, and society to have superior performance. It is necessary to not only endorse long term sustainability but to achieve the local livability preference through reasonable planning. This research aims to study how livability could quantitatively contribute to the understanding and modelling of spatial multi-objective land use optimization. The concept of livability in the context of land use planning and optimization is comprehensively reviewed and interpreted in this research, and then a spatial multi-objective optimization model based on boundary-based genetic algorithm is adapted and utilized to accommodate these interpreted objectives and constraints for optimizing the land use scenarios in the case study of Central Region of Queenstown Planning Area in Singapore towards livability. Lastly, the experiments results, reflections, conclusions and future research are also covered in the remainder of the manuscript.
2. Literature Review
Land use optimization has been broadly studied in the past decades towards various concerns or objectives [
5,
6,
7,
8,
9,
10,
11,
12,
13,
14]. However, there has not been many studies specifically on the livability oriented land use optimization except some general discussions and interpretation on livability from various perspectives of researchers. Balsas [
15] presented an exploratory study of the key performance indicators (KPI) for measuring the livability of urban centres. By describing a social, economic, or physical reality using a measure or a set of measures, and determining the performance of an act are the responsibilities of an indicator [
16]. Six dimensions of performance were used in Balsas [
15] KPI, including vitality, sense, fit, access, control, and viability. The first five dimensions were adopted from Lynch [
17]’s perception of what makes a livable city. While viability refers to the ability of an urban to appeal itself and bring in investment, vitality points out whether the city can remain alive or not [
15]. Antognelli and Vizzari [
18] believed that the key for assessing the urban livability is through using ecosystem service and urban service, which can affect the landscape planning as well as the policy-making process. They had developed a livability spatial assessment model (LISAM), which both local access to service and its significance to stakeholders were considered. Ecosystem service (ES) mostly comes from or had natural resources as inputs to benefit human society; urban service (US) considers more socio-economic and public services and facilities [
19,
20]. The model with spatial indices weighting and aggregation was generated from spatial accessibility modelling, and stakeholders’ interviews were applied to a service weight calculation (AHP), which was used for mapping the ecosystem service and urban services accessibility to examine the livability of the study area [
18]. Wang et al. [
21] conducted a comparative study with a focus on the livable level integrated index (LLII) to evaluate the livability for global cities. The index was derived according to three aspects, including social development, living standard, and environmental quality. The LLII was assessed by a linear weighted sum approach. Higgs et al. [
22] proposed a spatial urban livability index for examining the relationship with travel behaviour where walkability, social infrastructure mix, public transport access, large public open space, affordable housing, and local working opportunities are the main indicators.
In addition to a variety of livability index systems proposed by different researchers based on different contexts and levels of details, there have also been many studies that are focusing on how urban livability can be improved. Accessibility is one of the main targets for increasing the living quality. The level of accessibility can be measured from different aspects such as accessibility to transportation facilities, to civil and community facilities, or green spaces. Litman [
23] argues in this research that accessibility examination can bring positive effect to all the aspects of sustainability, which could also improve community livability in the social aspects. Similarly, Miller and Witlox [
24] also depicted accessibility as a significant factor for livability, which contributes significantly to urban and transportation planning. On the other hand, La Rocca [
25] introduced that soft mobility, which includes all kinds of non-motorized transport, is able to optimize the urban livability due to its "zero-impact", which can ease the environmental burden (level of noise, air pollution, and traffic congestion) created by human activities. Besides accessibility, compactness is another issue that has been broadly discussed. High density and compact land use is able to lead to efficient lifestyles. Urban compactness aims to make the best use of the land resource without wasteful sprawl in the metropolitan [
10]. Abdullahi et al. [
26] integrated multi-criteria decision-making, Bayes theorem, and RADAR images to assess the city compactness of Kajang City in Malaysia. Ward et al. [
27] in their research combined cellular automata and spatial optimization for evaluating urban changes, and they deliberately considered spatial compactness and accessibility in the optimization model for pursuing higher livability in the cities. Moreover, spatial compatibility usually considers the relationship of adjacent land use types [
7,
28], which is also quite commonly used in addressing land use optimization issues. Land uses scenarios with good compatibility require that each functional unit would have the most positive interaction with their neighbouring units [
29]. It is evident that the spatial compatibility of different land use units (e.g., grid or parcels) could contribute to the harmony and livability of the entire area. Zhang et al. [
30] estimated compatibility index between different land uses for simulating the spatial multi-objective spatial optimization with multi-agent system and genetic algorithm. Haque and Asami [
31] have successfully tried to maximize land price and reduce incompatibility when generating feasible land use plans. It is obvious that higher compatibility between land use types would lead to a more livable environment since the compatibility index is expected to engage with the human-environment interaction in the land use planning process. In this research, compatibility scores have been obtained and utilized to be one of the major objectives in our model and experiments for generating compatible land use planning scenarios.
Land use optimization problems are rather complex, as such decisions must be made not only on what to allocate (selection of land use types), and on how much to allocate, but also on where to allocate. Therefore, the model for integrating these spatial multi-objectives and algorithms for addressing this kind of spatial optimization problem might be critical bottlenecks. In the past, lots of multi-objective optimization problems including land use optimization problems were solved by linear programming (LP) [
32]. However, one of the problems in that is determining the relative weights of each objective. At the same time, the “Pareto front” method brought the other mode to consider the multi-objective optimization problems, which was derived from Pareto’s original work [
33]. One characteristic of the “Pareto front” method is the independence of the objectives. Until now, it has been broadly and successfully utilized for solving spatial multi-objective spatial optimization problems [
10,
34,
35]. A drawback is the low efficiency of the optimization process. Another kind of effective method is the abovementioned “weighted-sum” method. Although it cannot yield non-convex optimal solutions, it has still been commonly used because of its simplicity and effectiveness for most of the multi-objective optimization problems [
6,
9,
36,
37]. In this research, the goal programming and weighted-sum methods are used to construct the land use optimization model.
All the multi-objective models mentioned above create a need for efficient optimization algorithms for addressing various land use optimization problems while the deterministic optimization turns to be impossible or inappropriate given the complexity of spatial optimization problems. A switch can be observed from strict optimization to the use of heuristics. Genetic algorithm (GA), as one kind of effective heuristic methods for optimization problems, has also been successfully applied in various domains and studies [
38]. Stewart et al. [
37] have taken advantage of GA to perform multi-objective land use allocation in a small research area based on grids. Janssen, van Herwijnen, Stewart and Aerts [
36] have also utilized GA for land use allocation on a small area (20 by 20 cells). Cao et al. [
6,
10,
12] have successfully and effectively employed various kinds of GA to address land use optimization problems. In this research, a boundary-based GA, which follows the principles of traditional GA and adapted from Cao, Huang, Wang and Lin [
6], is integrated into a land use optimization model to tackle the land use optimization problem towards livability in the case study of Singapore.
5. Reflection, Conclusions, and Future Research
Land use optimization problems remain a challenge due to the complexity of spatial characteristics and non-linearity of the objectives and constraints. In this research, livability has been quantitatively and comprehensively reviewed and interpreted to contribute to spatial multi-objective land use optimization modelling at first. Second, a spatial multi-objective land use optimization model is constructed based on goal programming and weighted-sum approaches, followed by that a boundary-based GA is adapted to help address the spatial multi-objective land use optimization problem. Last but not least, the model is successfully and effectively applied to the case study in the Central Region of Queenstown Planning Area of Singapore towards livability.
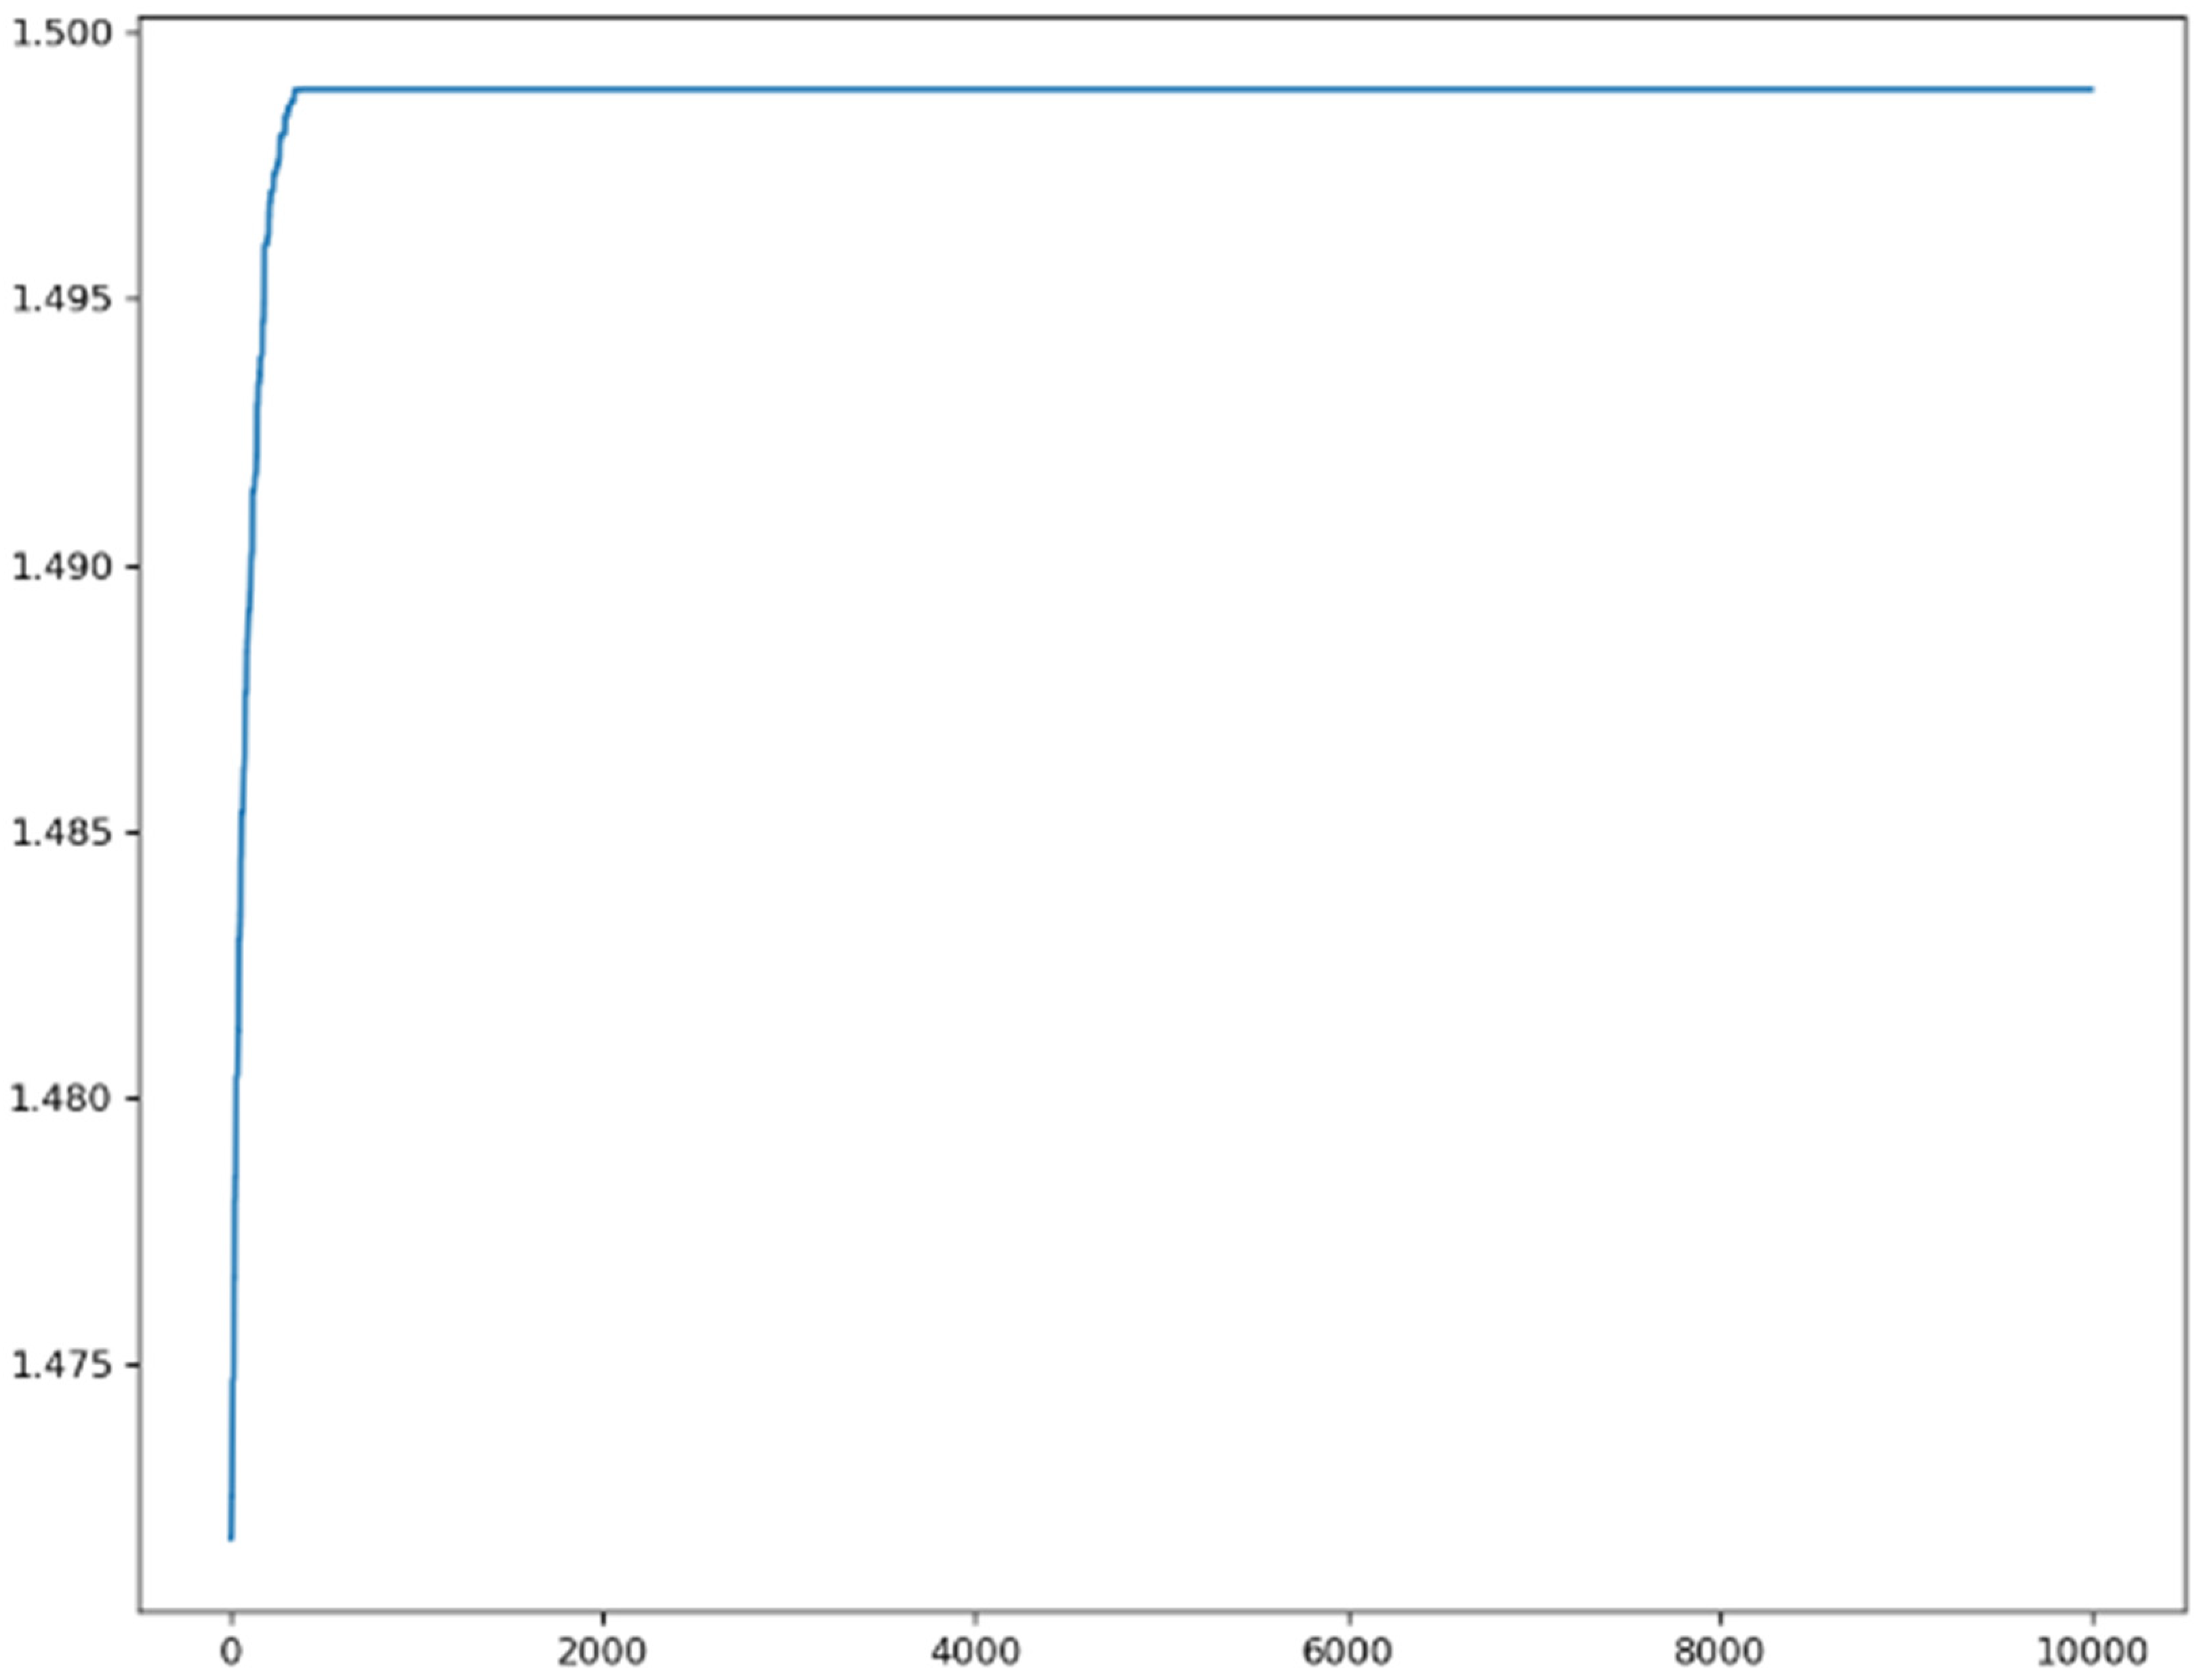
In the case study, the experiments based on equal weights and experiments based on different weights combination have been successfully conducted, which can demonstrate the effectiveness of the spatial multi-objective land use optimization model we have constructed as well as the robustness and reliability of solutions given the similarity between the solutions form 10 repeated experiments in terms of fitness value and the spatial patterns. In addition, the generated solutions maps have also been compared with two real planned scenarios by the planners. The comparison has clearly demonstrated that our proposed or generated solutions maps are much better than these two planned scenarios in terms of fitness values even though the planners have declared that they have probably considered the same objectives as we did. Of course, we cannot draw the conclusion that the computer-generated solutions maps could replace the planners’ plan even though the quantitative fitness values outperform these two real planned scenarios, but still, it is evident that our proposed model and the generated planning scenarios are effective in terms of fitness values and the layout of different land use types, which could be utilized as the suggested planning scenarios to support the planners’ or decision-makers’ planning process. For instance, these generated planning scenarios could help the planners to more quantitatively consider the criteria they want to consider given the limitation of human’s ability, and the planners can use these computer-generated planning scenarios as draft plans and design their own plans based on them, or they can refer to these computer-generated solution scenarios to improve their own design with better consideration of these aspects in their mind. In addition, the generated planning scenarios could also initiate some debates between different stakeholders while different preferences or criteria could be more scientifically considered into the planning process. Moreover, the achievement could also help to check the implementation of planning strategies. Specifically, for planners, expressing all the planning ideas clearly and accurately in a draft plan is impossible, especially for large-scale city planning with massive spatial units and criteria. For example, the computer has generated several small green spaces in the residential area. While in planner’s design, the focus is mostly on the layout of central green belt, under which circumstance demands for small-scale green space in the residential area are likely to be ignored. Therefore, on the one hand, computer-generated design or planning scenarios can help verify the rationality of planner’s design at a large scale, and help to correct small omissions (Note: Small omissions seem insignificant at a city scale, but they are vital to forging the livability of residents in a neighbourhood).
On the other hand, there are still some drawbacks or limitation of this kind of generated planning scenarios. For example, some typical planning strategies employed in the planner’s design cannot be reflected in the computer-generated planning scenarios. In the designed planning scenarios, planners have designed a commercial street aiming to increase street’s vitality, however, there is no such observation from the generated planning scenario. Of course, it could be somehow integrated into the land use optimization model but the complexity and computing might be a huge challenge. At the same time, these empirical judgments might be able to better contribute to the shaping of urban characteristics, although they are inexhaustible and there might be some omissions. Hence, we would argue or suggest that it would be ideal if planners’ design and computer-generated solutions could be integrated and utilized together in an effective manner, so as to supplement each other for a better and more effective “smart planning”.
However, there is still a significant gap between different groups of scholars and planners working in this field and even some bias from some planners on these computer-generated planning scenarios. Therefore, future efforts first should be put into encouraging the collaboration between planners and GIS or computing specialists. Second, it would be much helpful if more empirical judgments on planning could be well quantified and incorporated into the spatial multi-objective land use optimization models for generating more and better planning scenarios to support the practical planning or decision-making process. For example, more effective objectives towards livability could be better discussed and considered, different levels of livable planning scenarios according to the quantified fitness values could also be better defined and incorporated into the practical planning or decision-making process. Third, the interaction and communications between the planners and GIS or computing specialists could be standardized by designing and implementing some effective protocols and interactive planning support systems. All these abovementioned aspects would also be our future research directions.

 ,
, 


