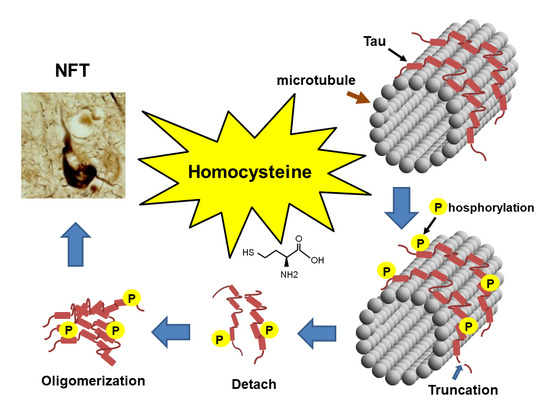
Homocysteine Increases Tau Phosphorylation, Truncation and Oligomerization

 , , ,
, , ,
Abstract
:
1. Introduction
2. Results
2.1. Homocysteine Reduces Tau Turnover
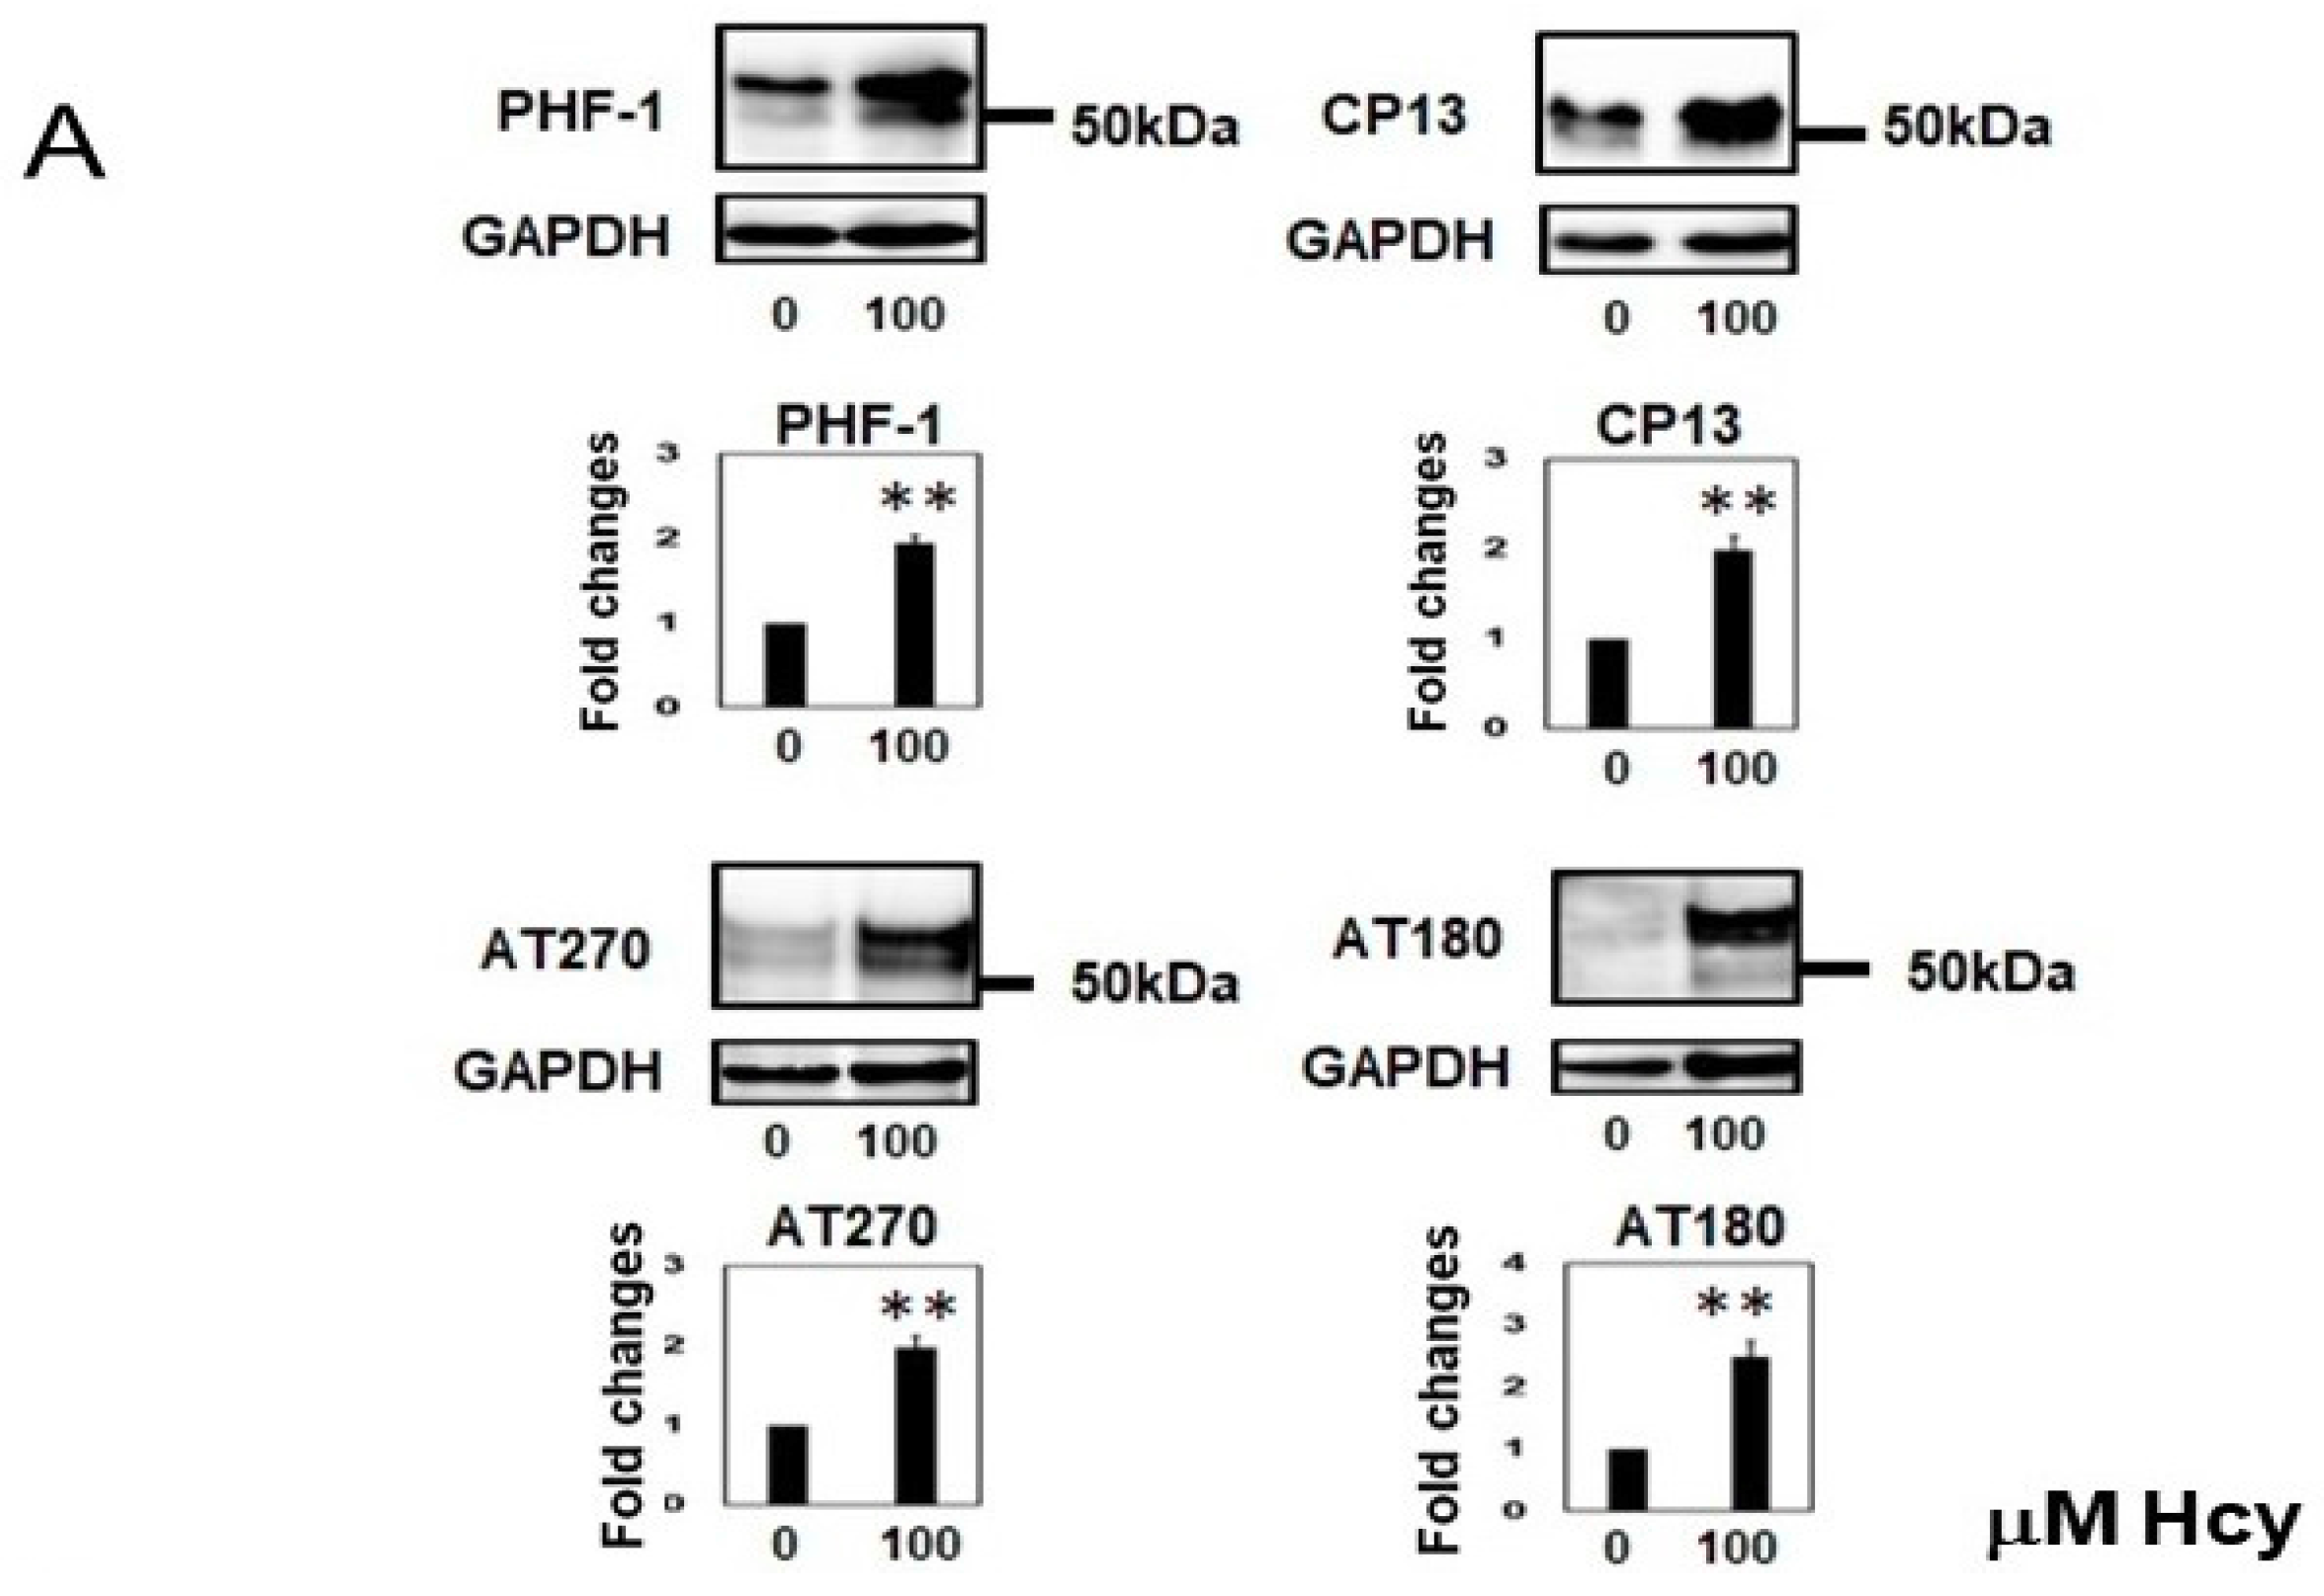
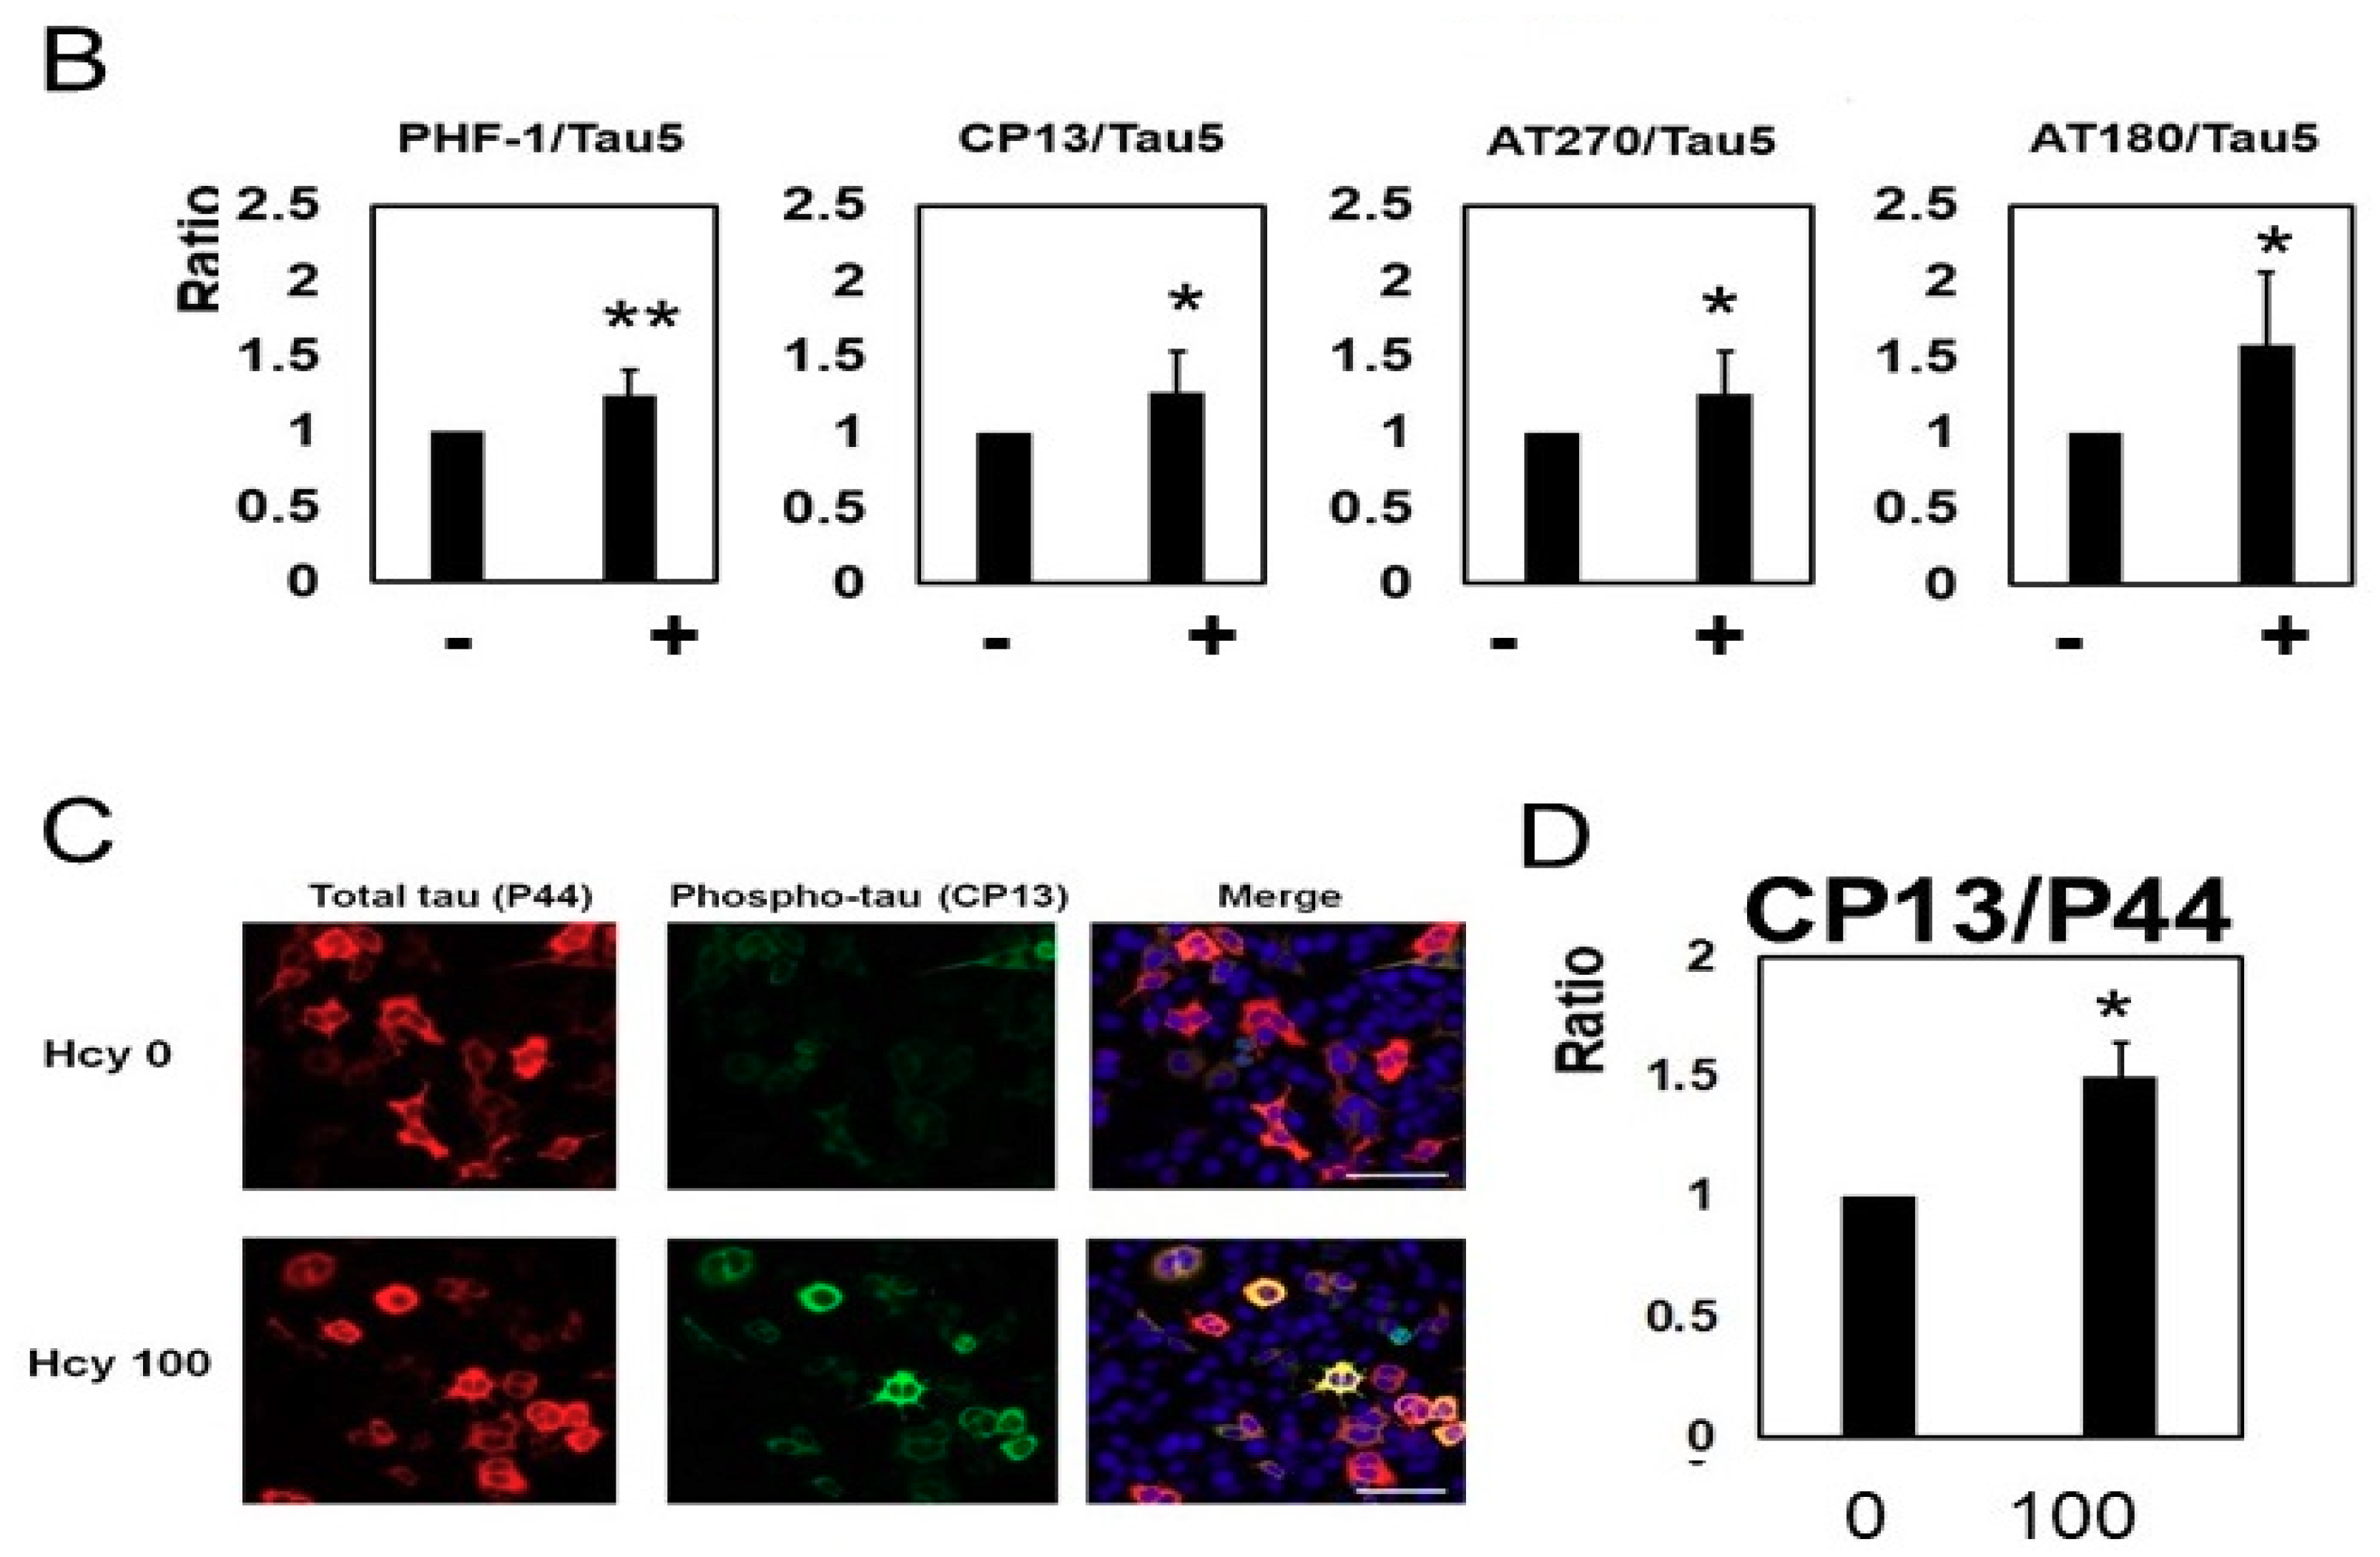
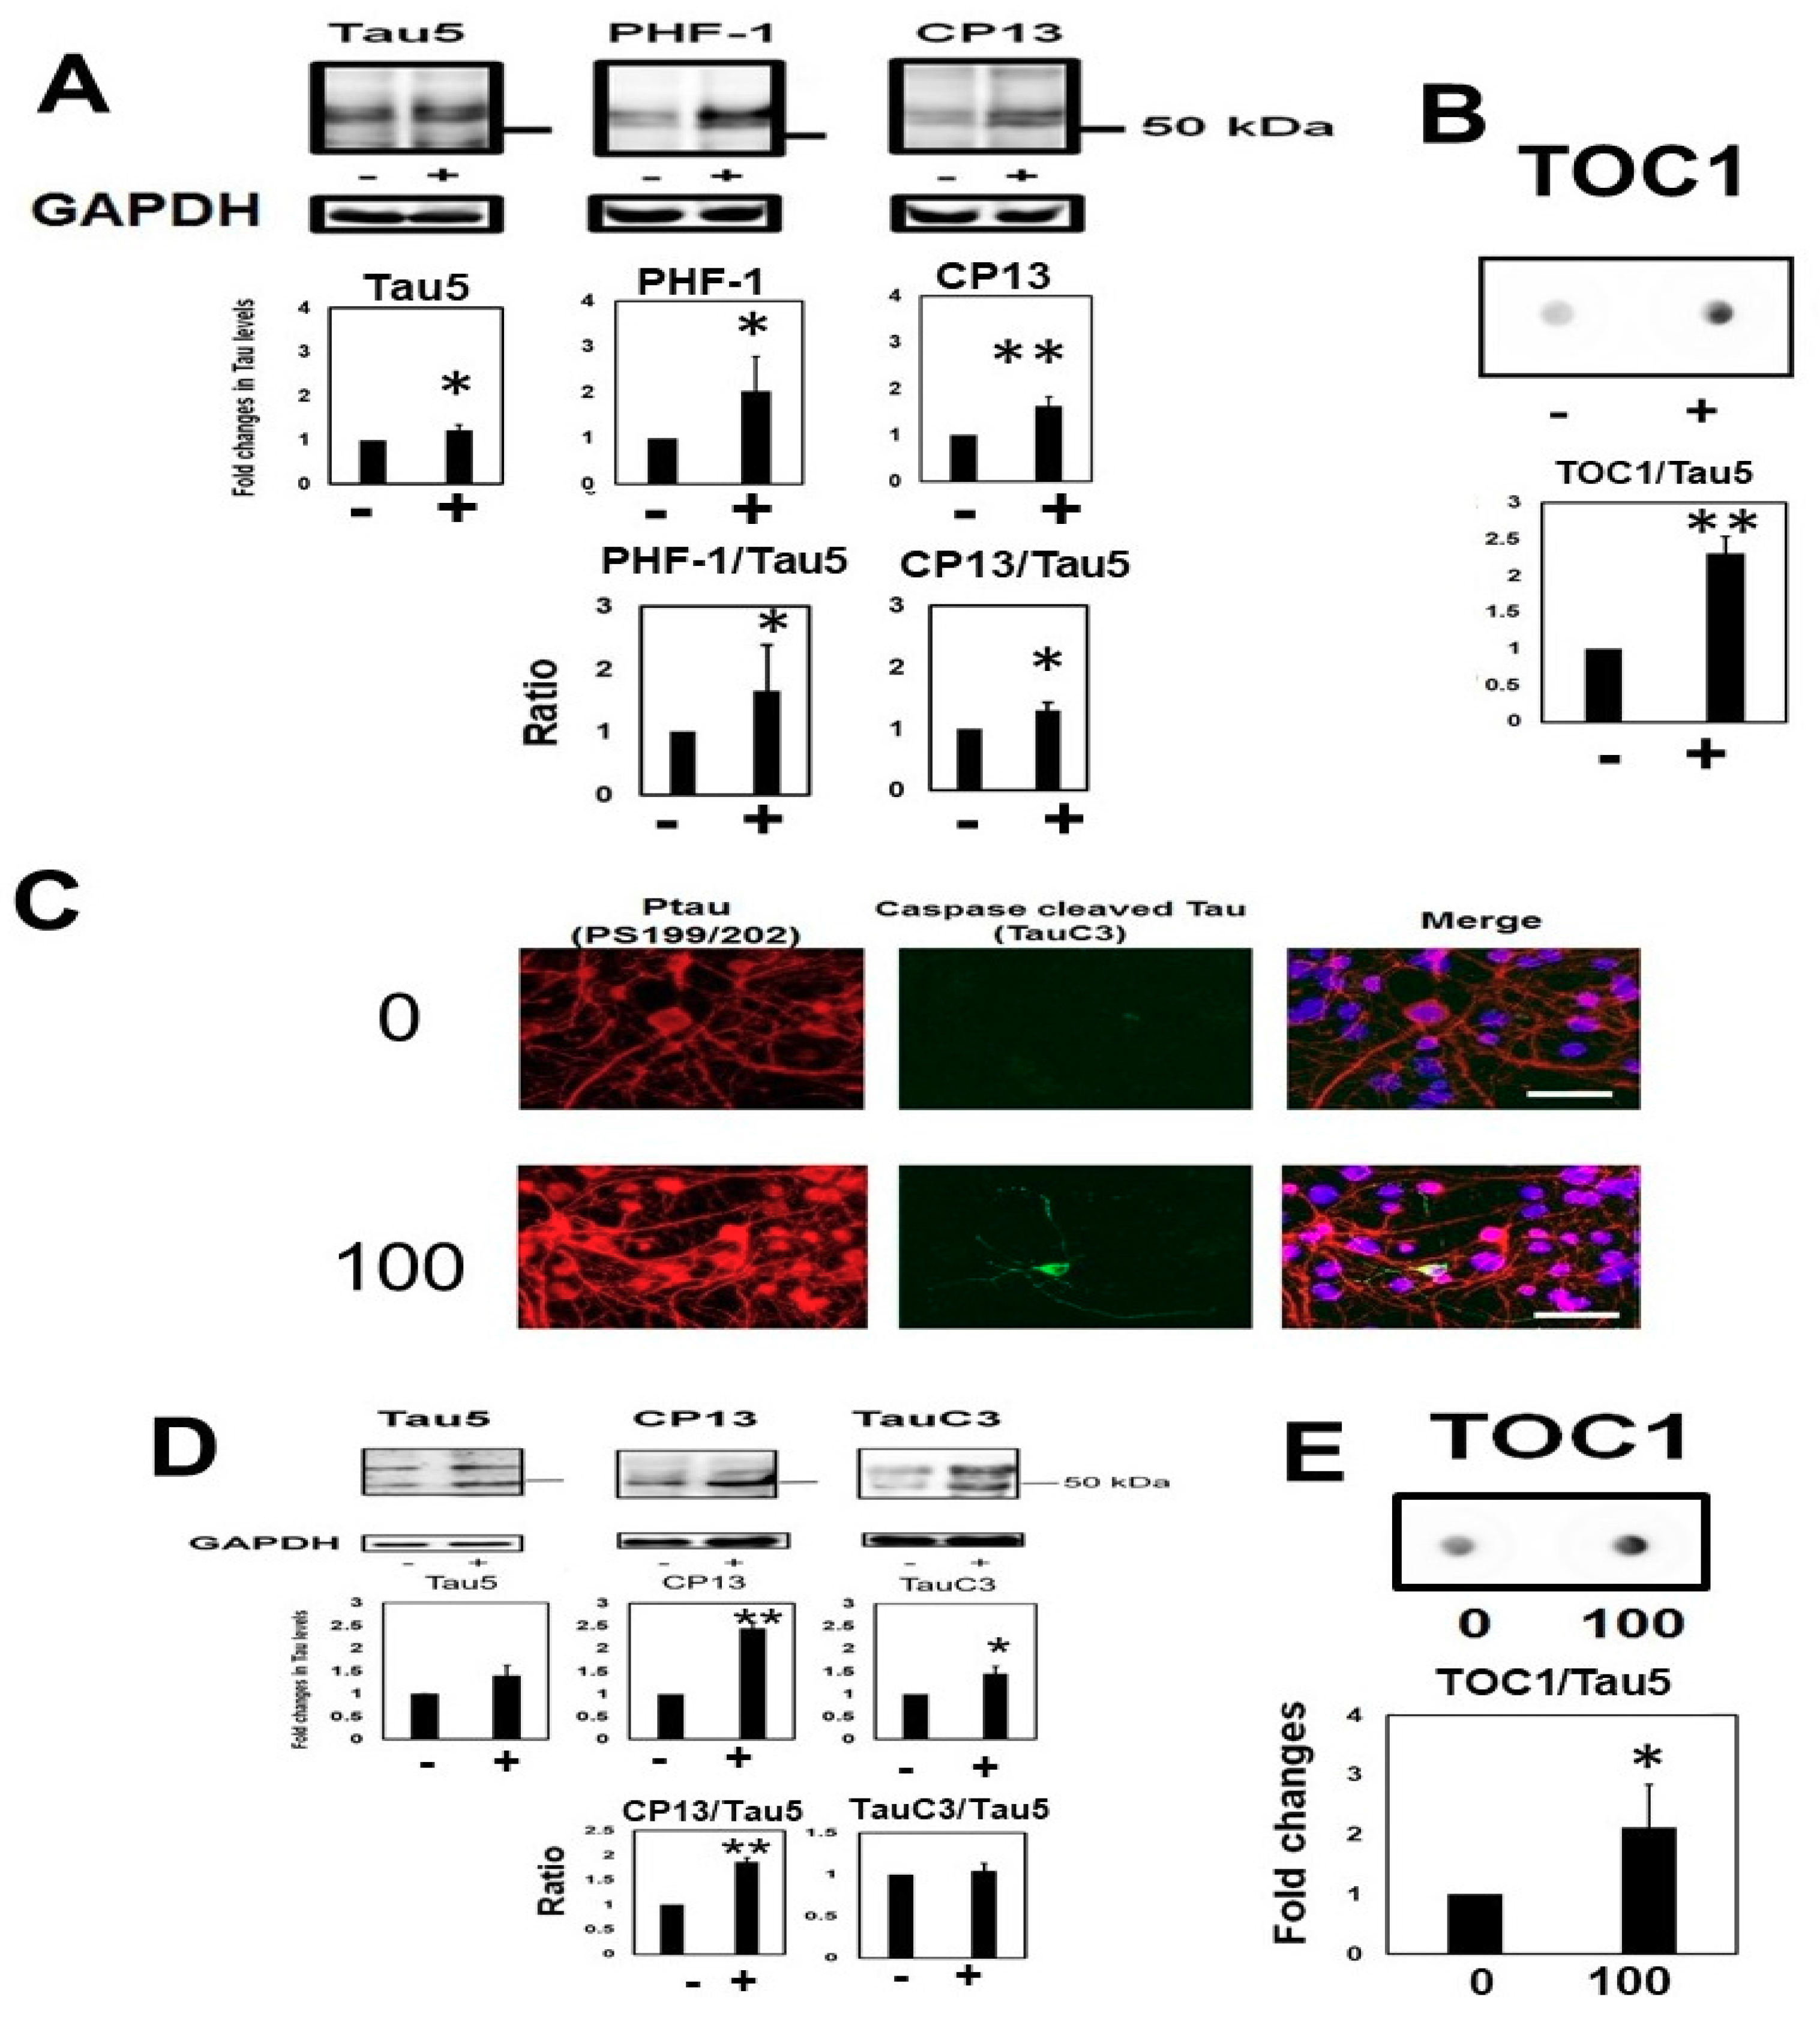
2.2. Homocysteine Increases Phosphorylated Tau
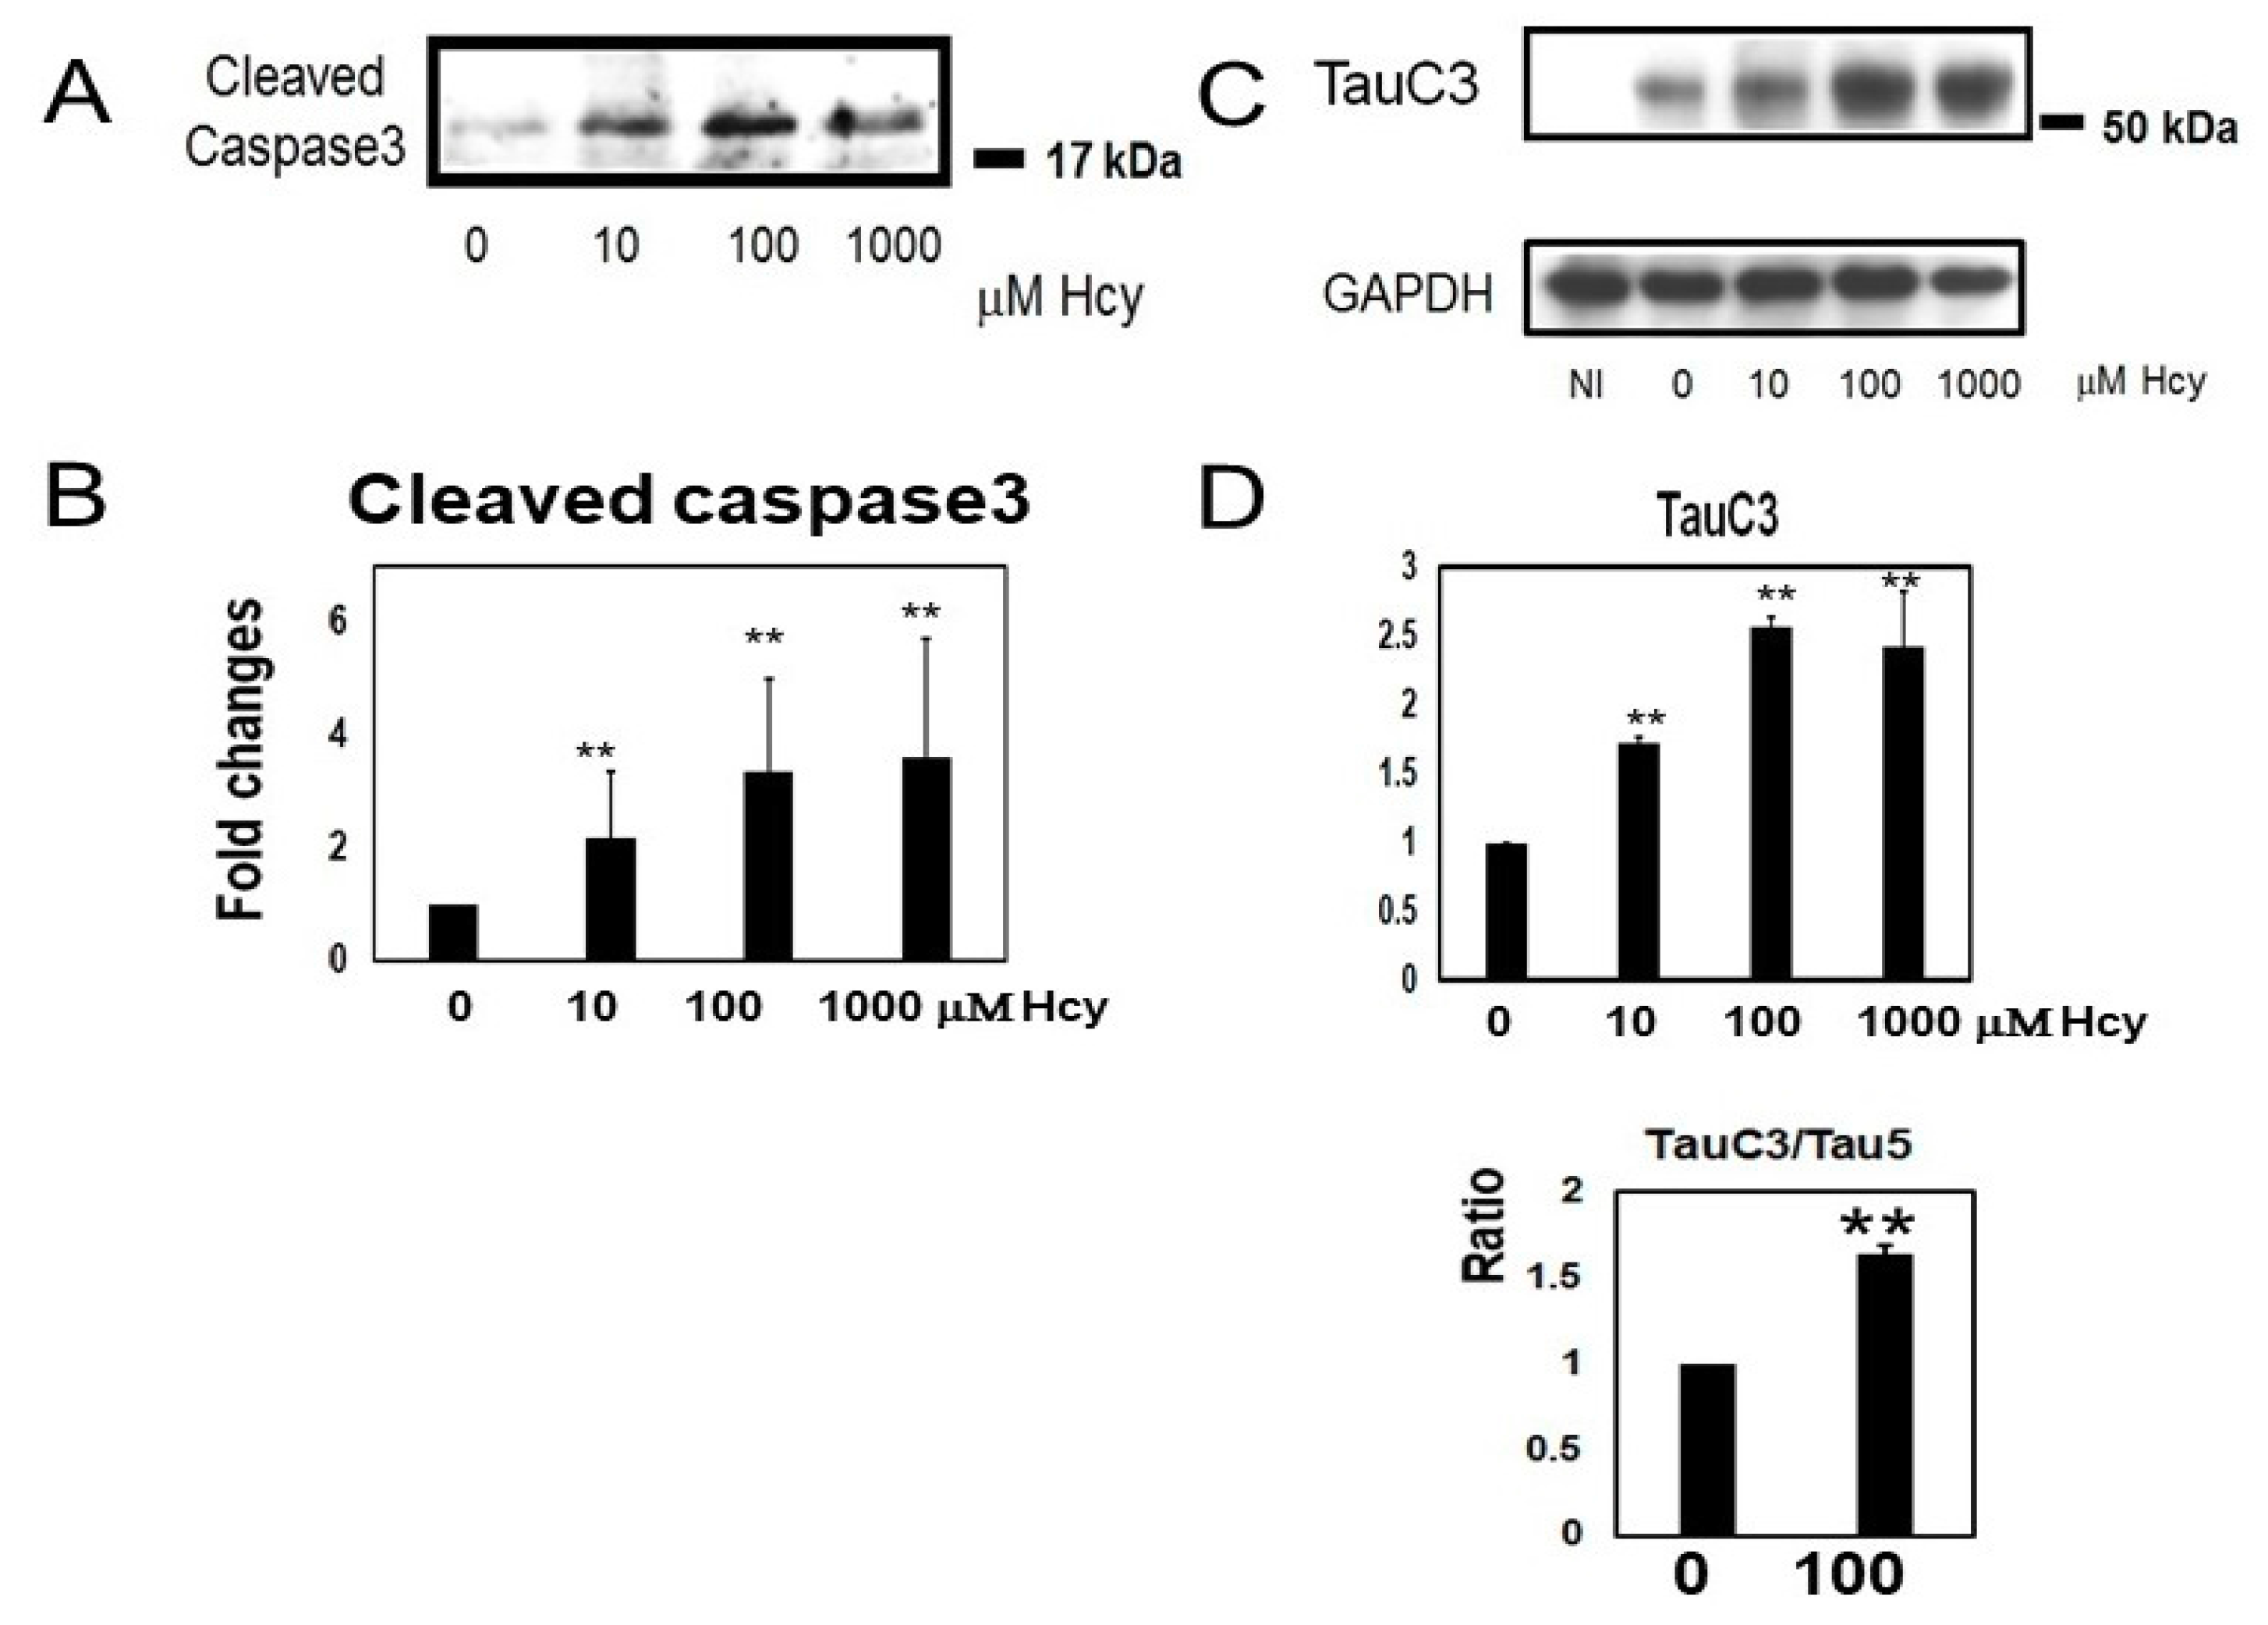
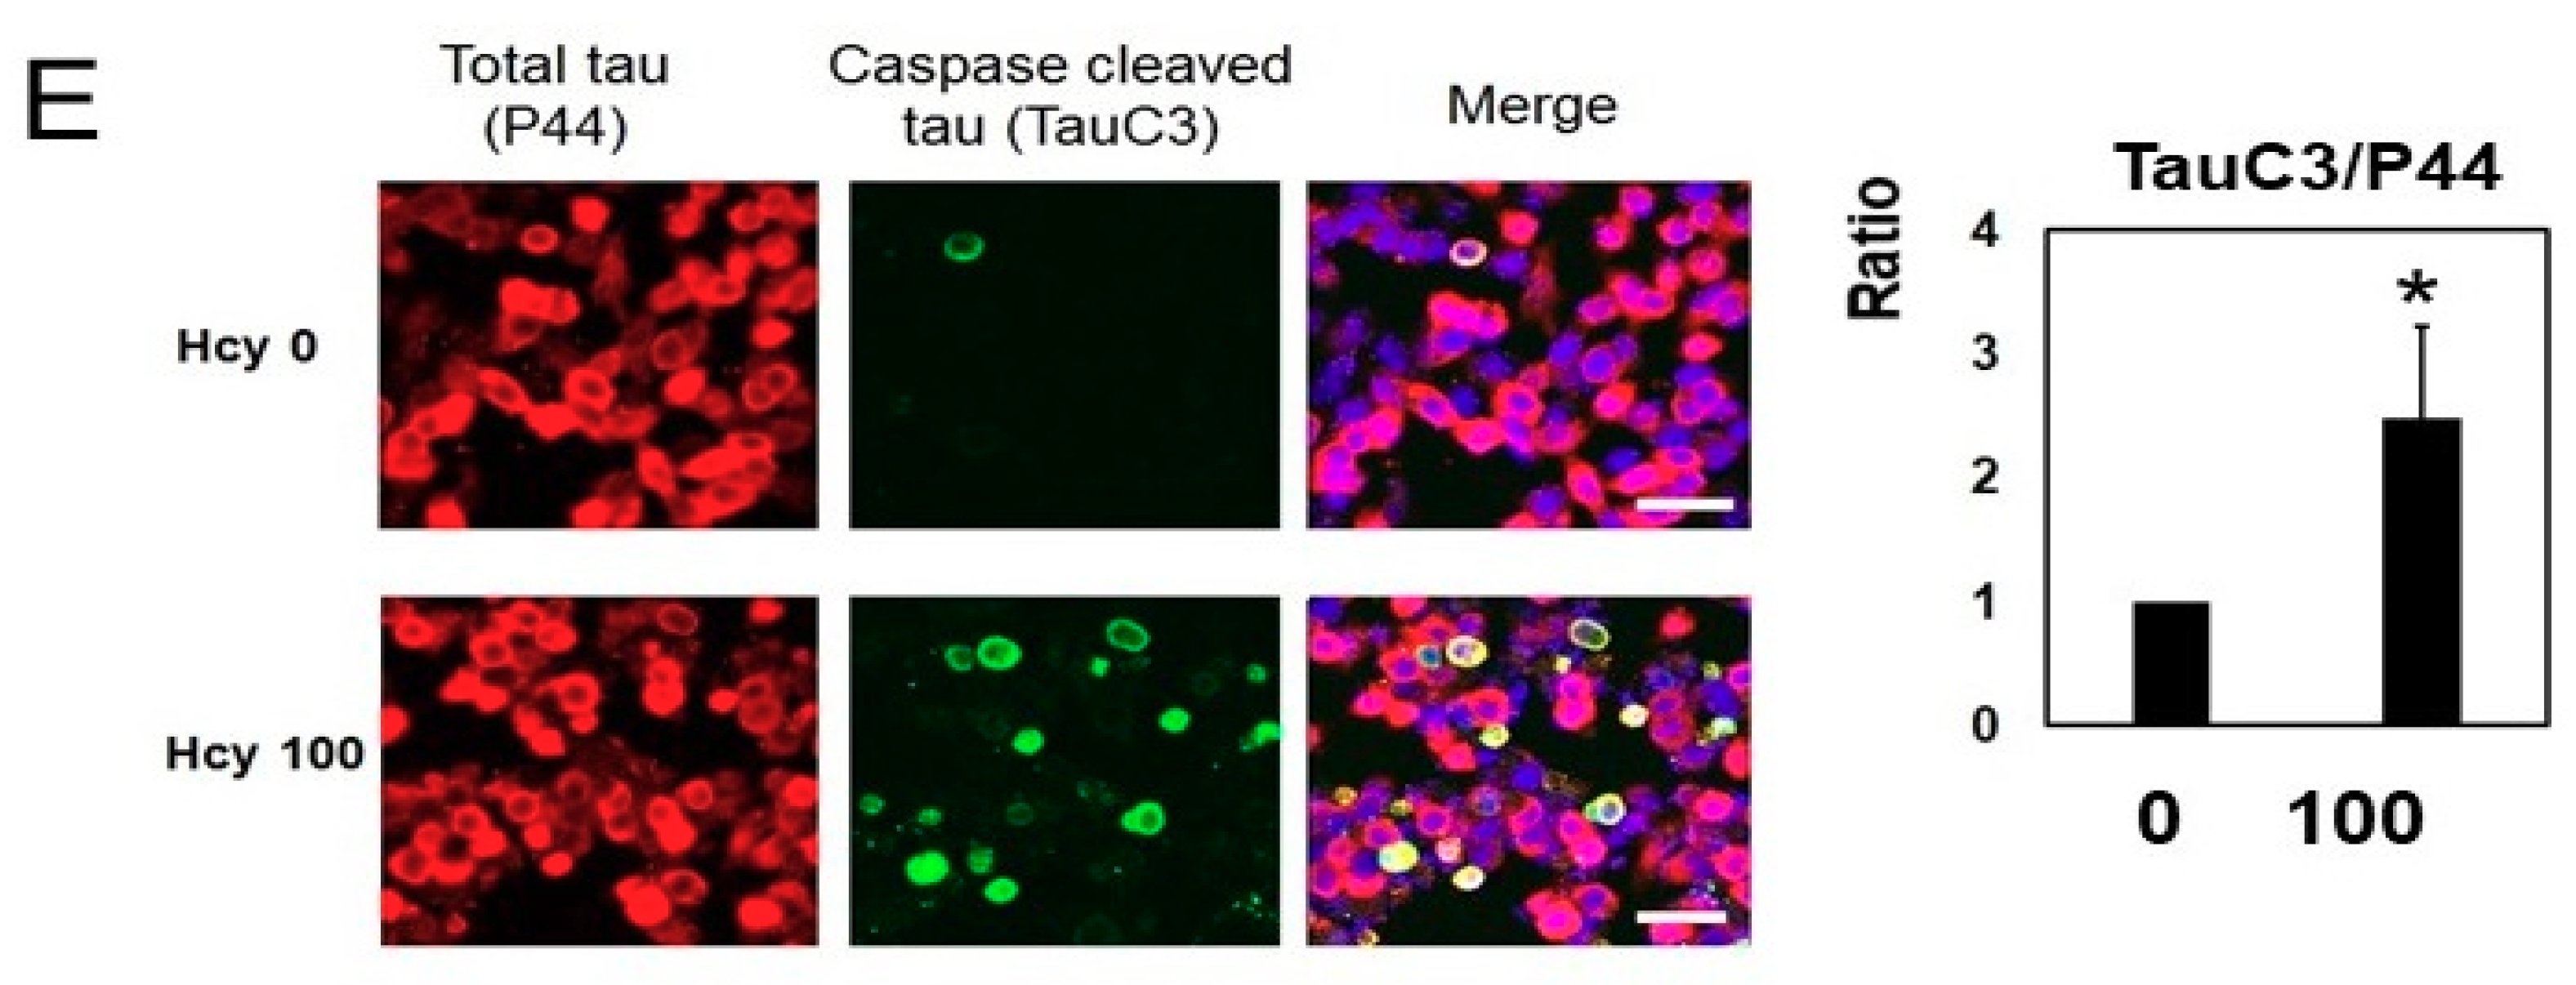
2.3. Homocysteine Treatment Activates Caspase 3 and Increases C-Terminal Truncated Tau
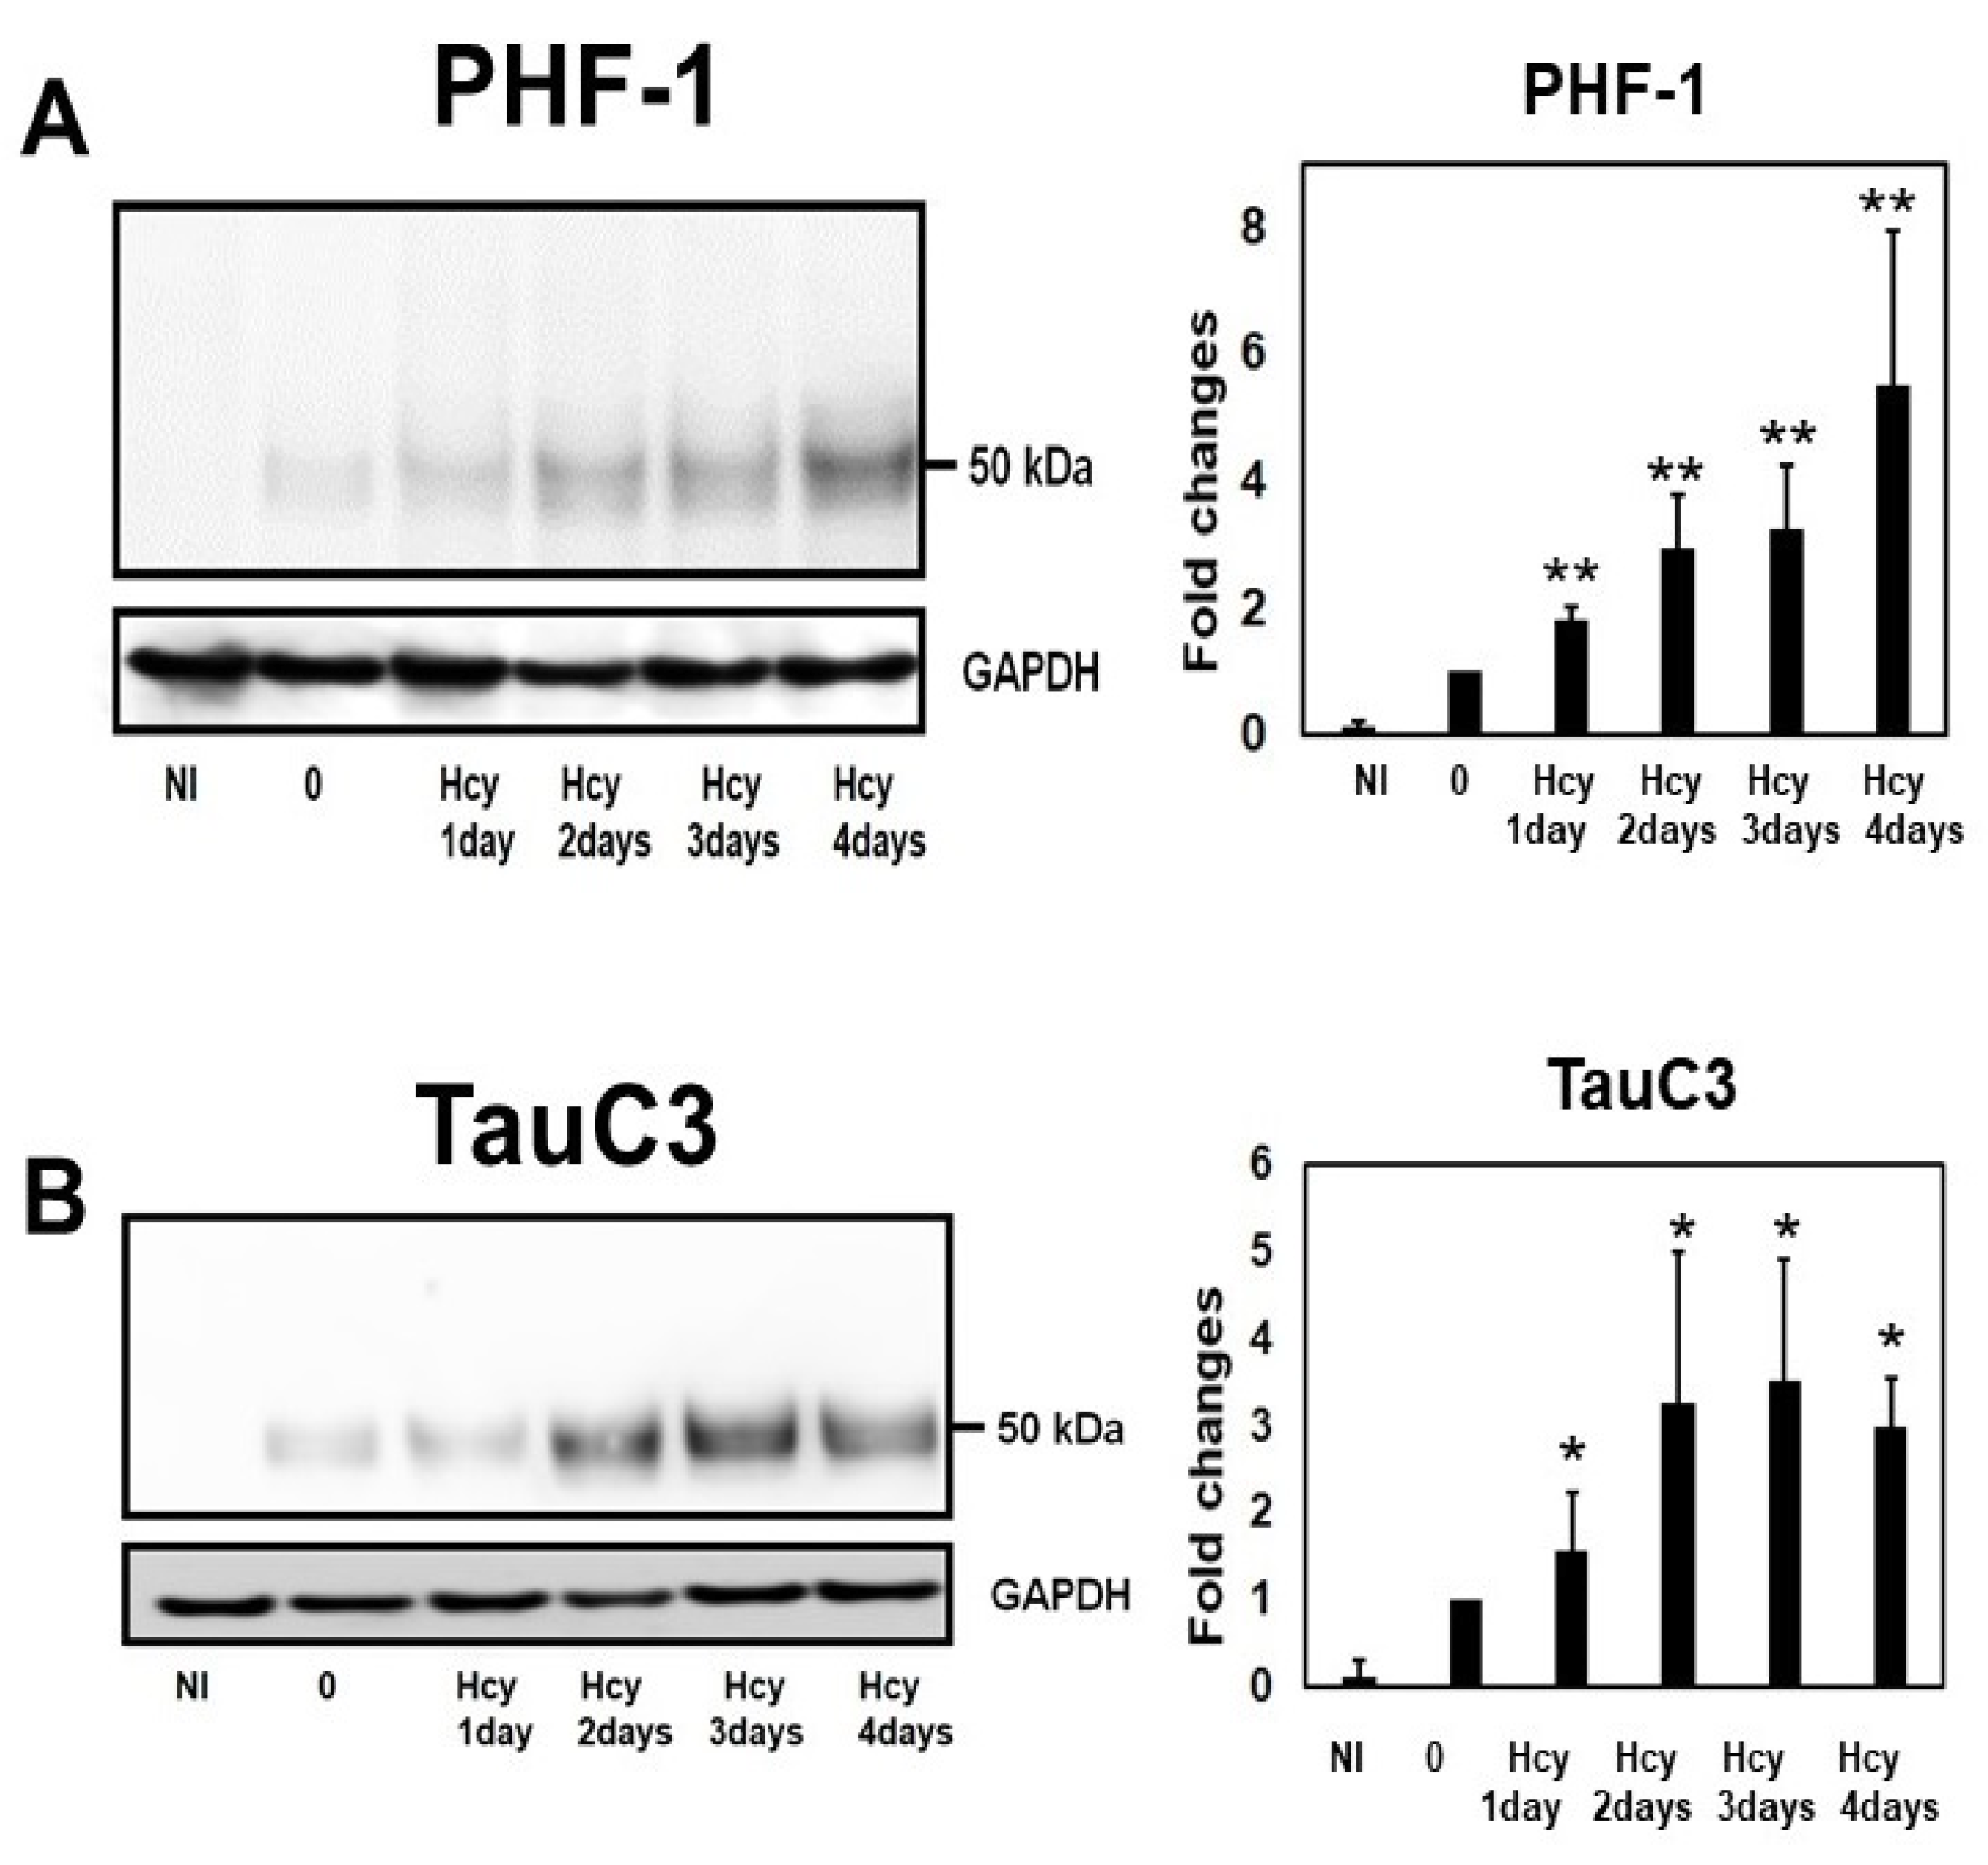
2.4. Temporal Profile of Phosphorylated Tau and Caspase-Cleaved Tau Following Homocysteine Treatment
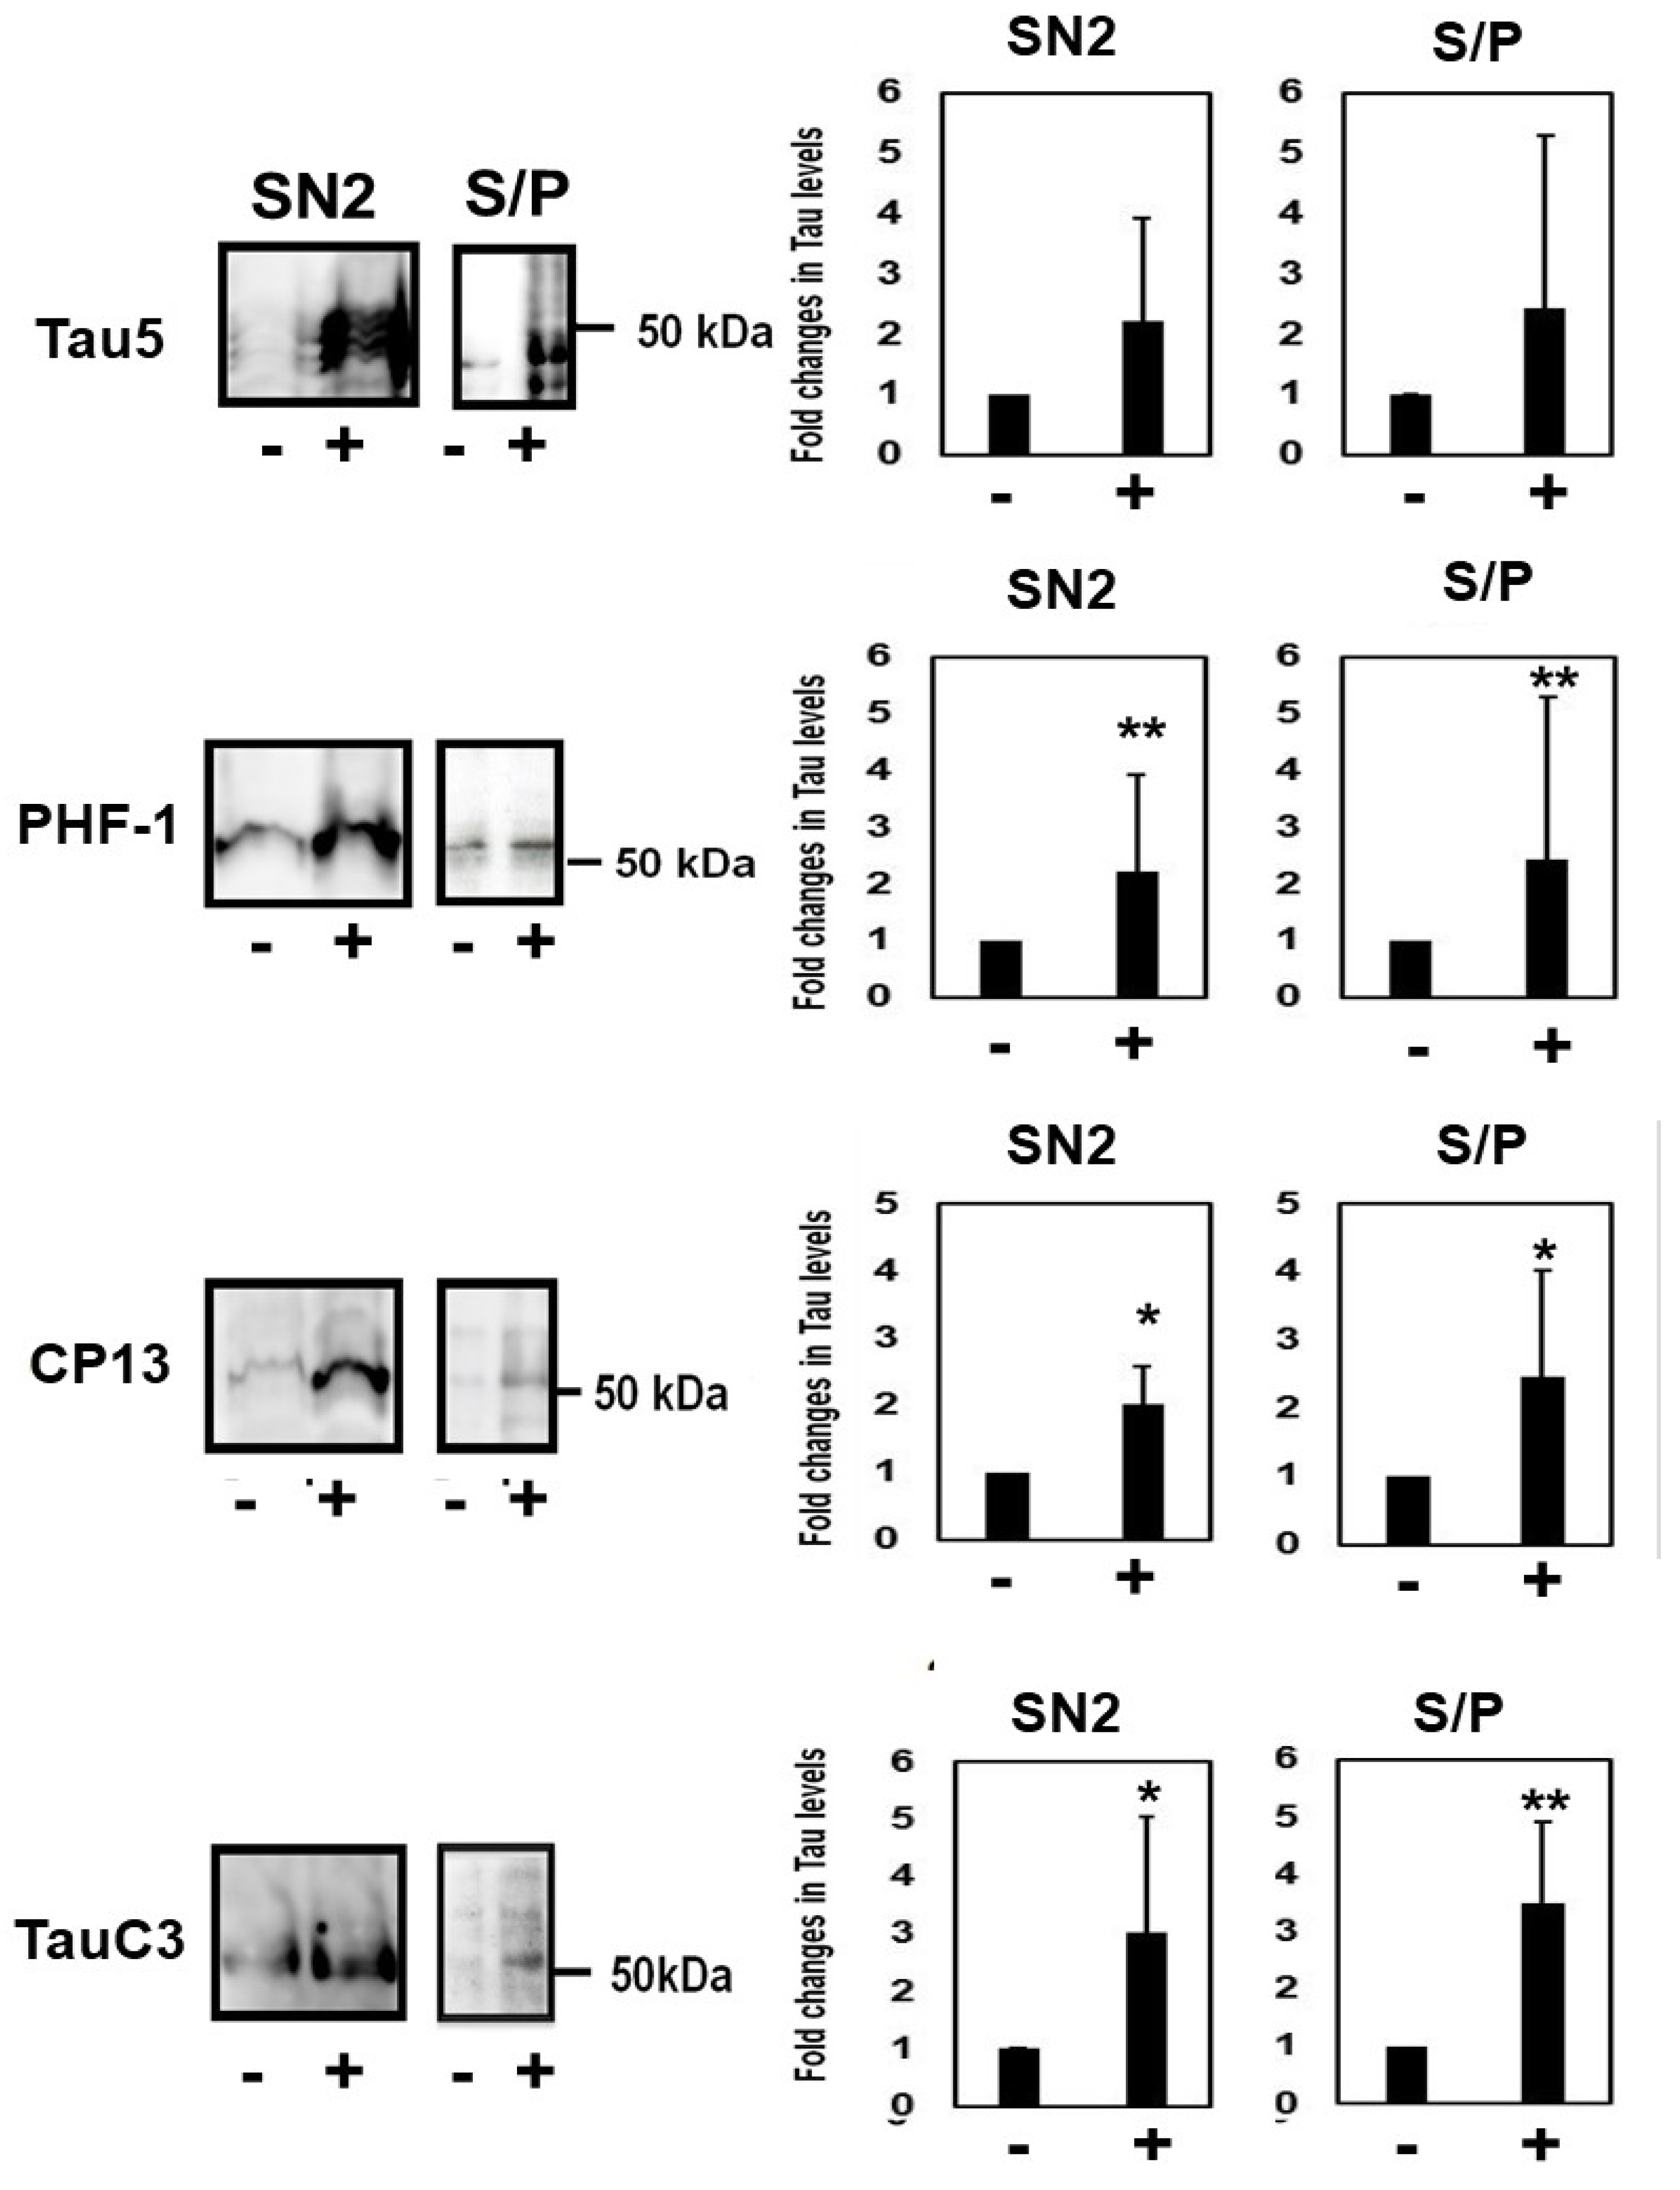
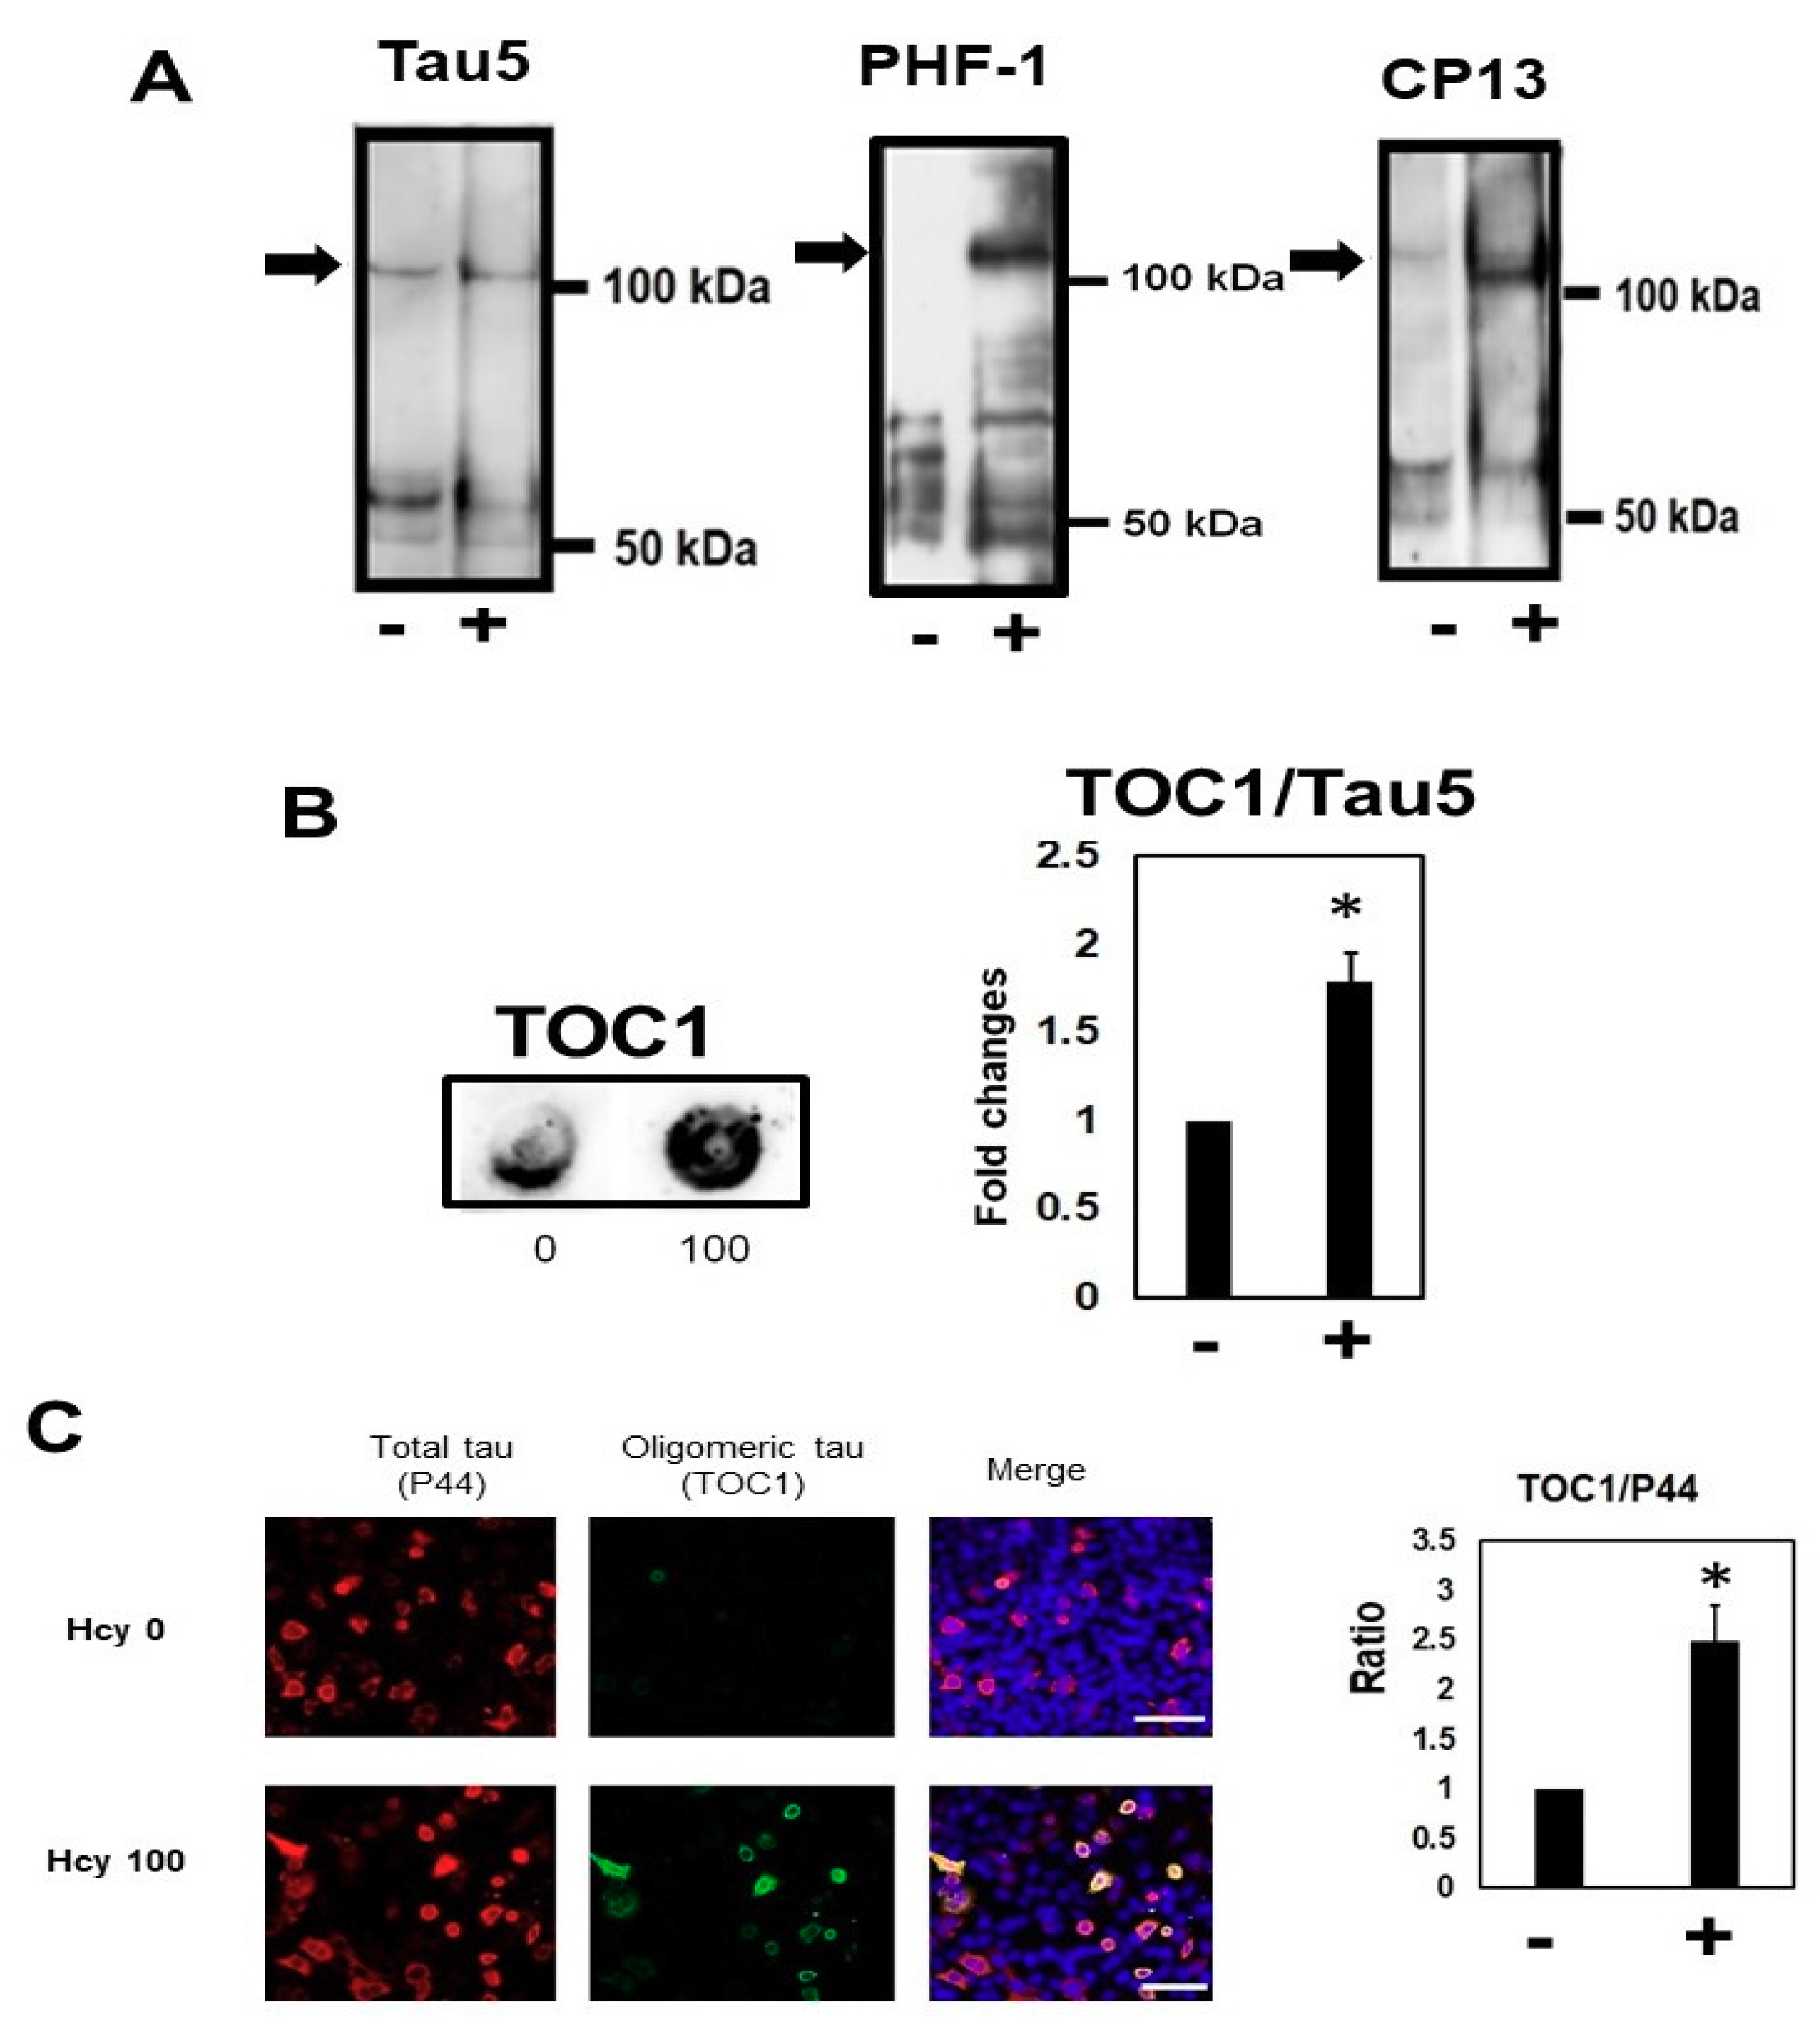
2.5. Homocysteine Increases Sarkosyl Insoluble Tau and Oligomeric Tau
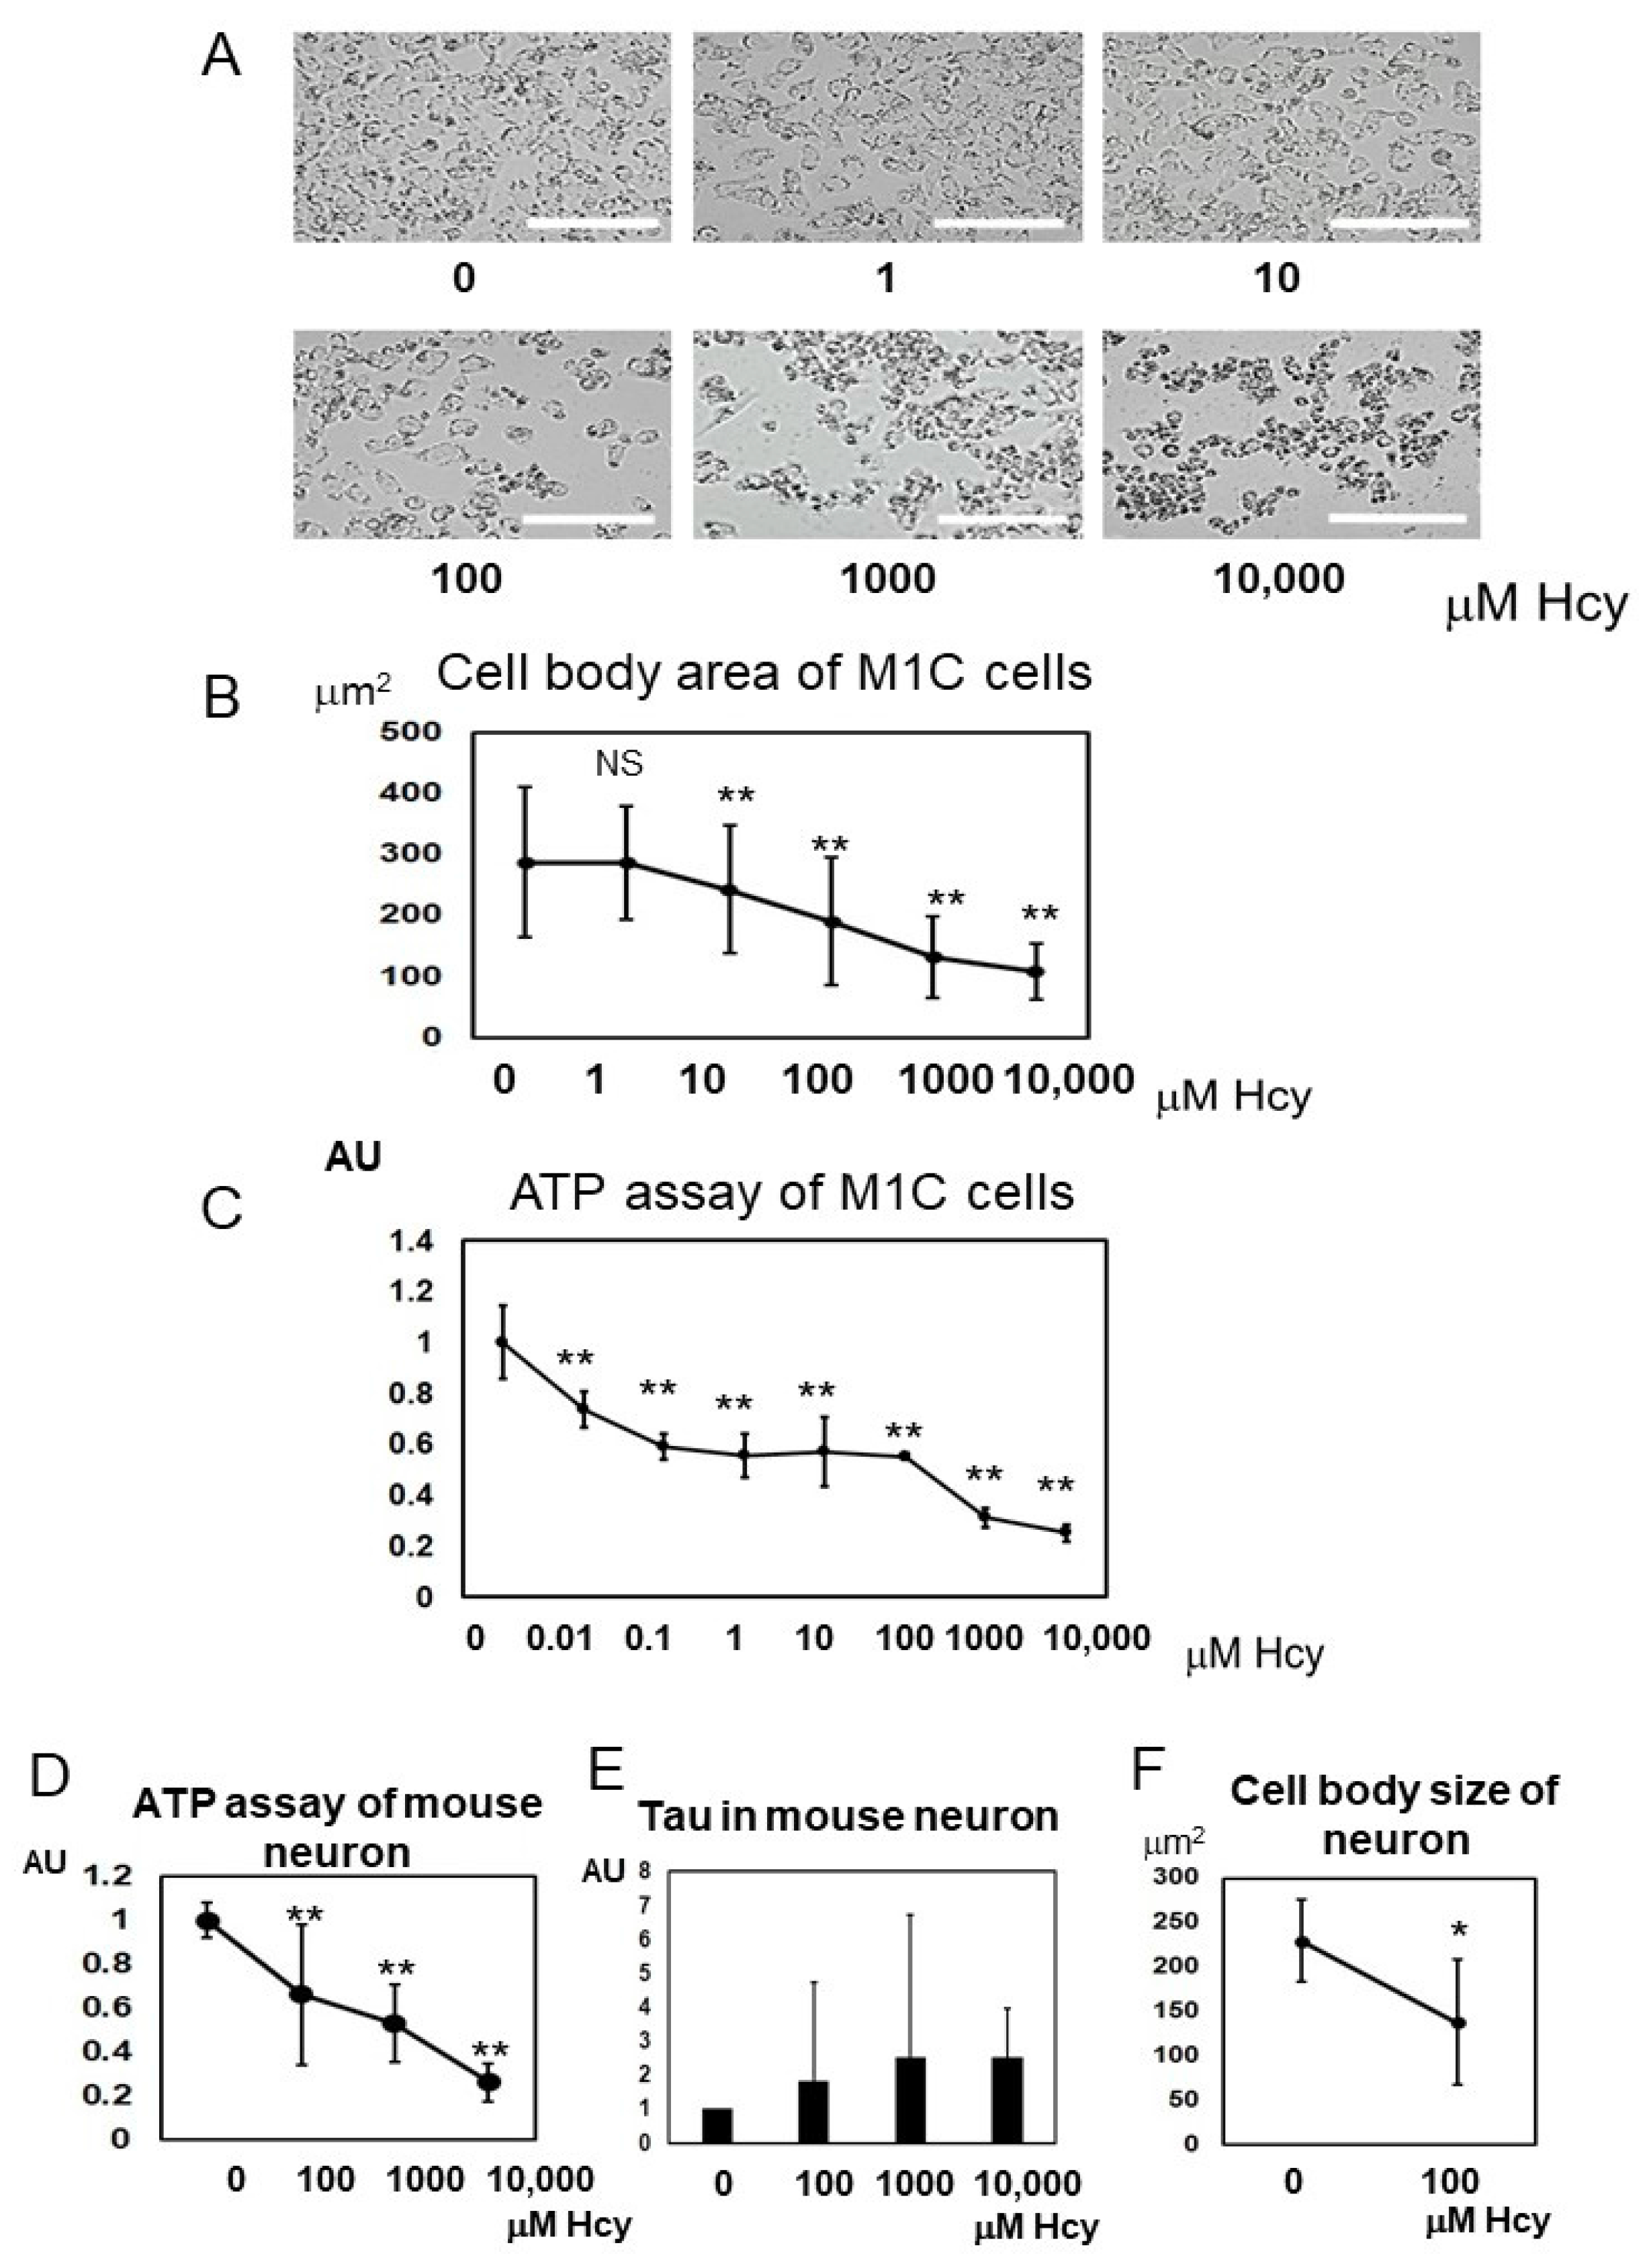
2.6. Homocysteine Induces Cell Death
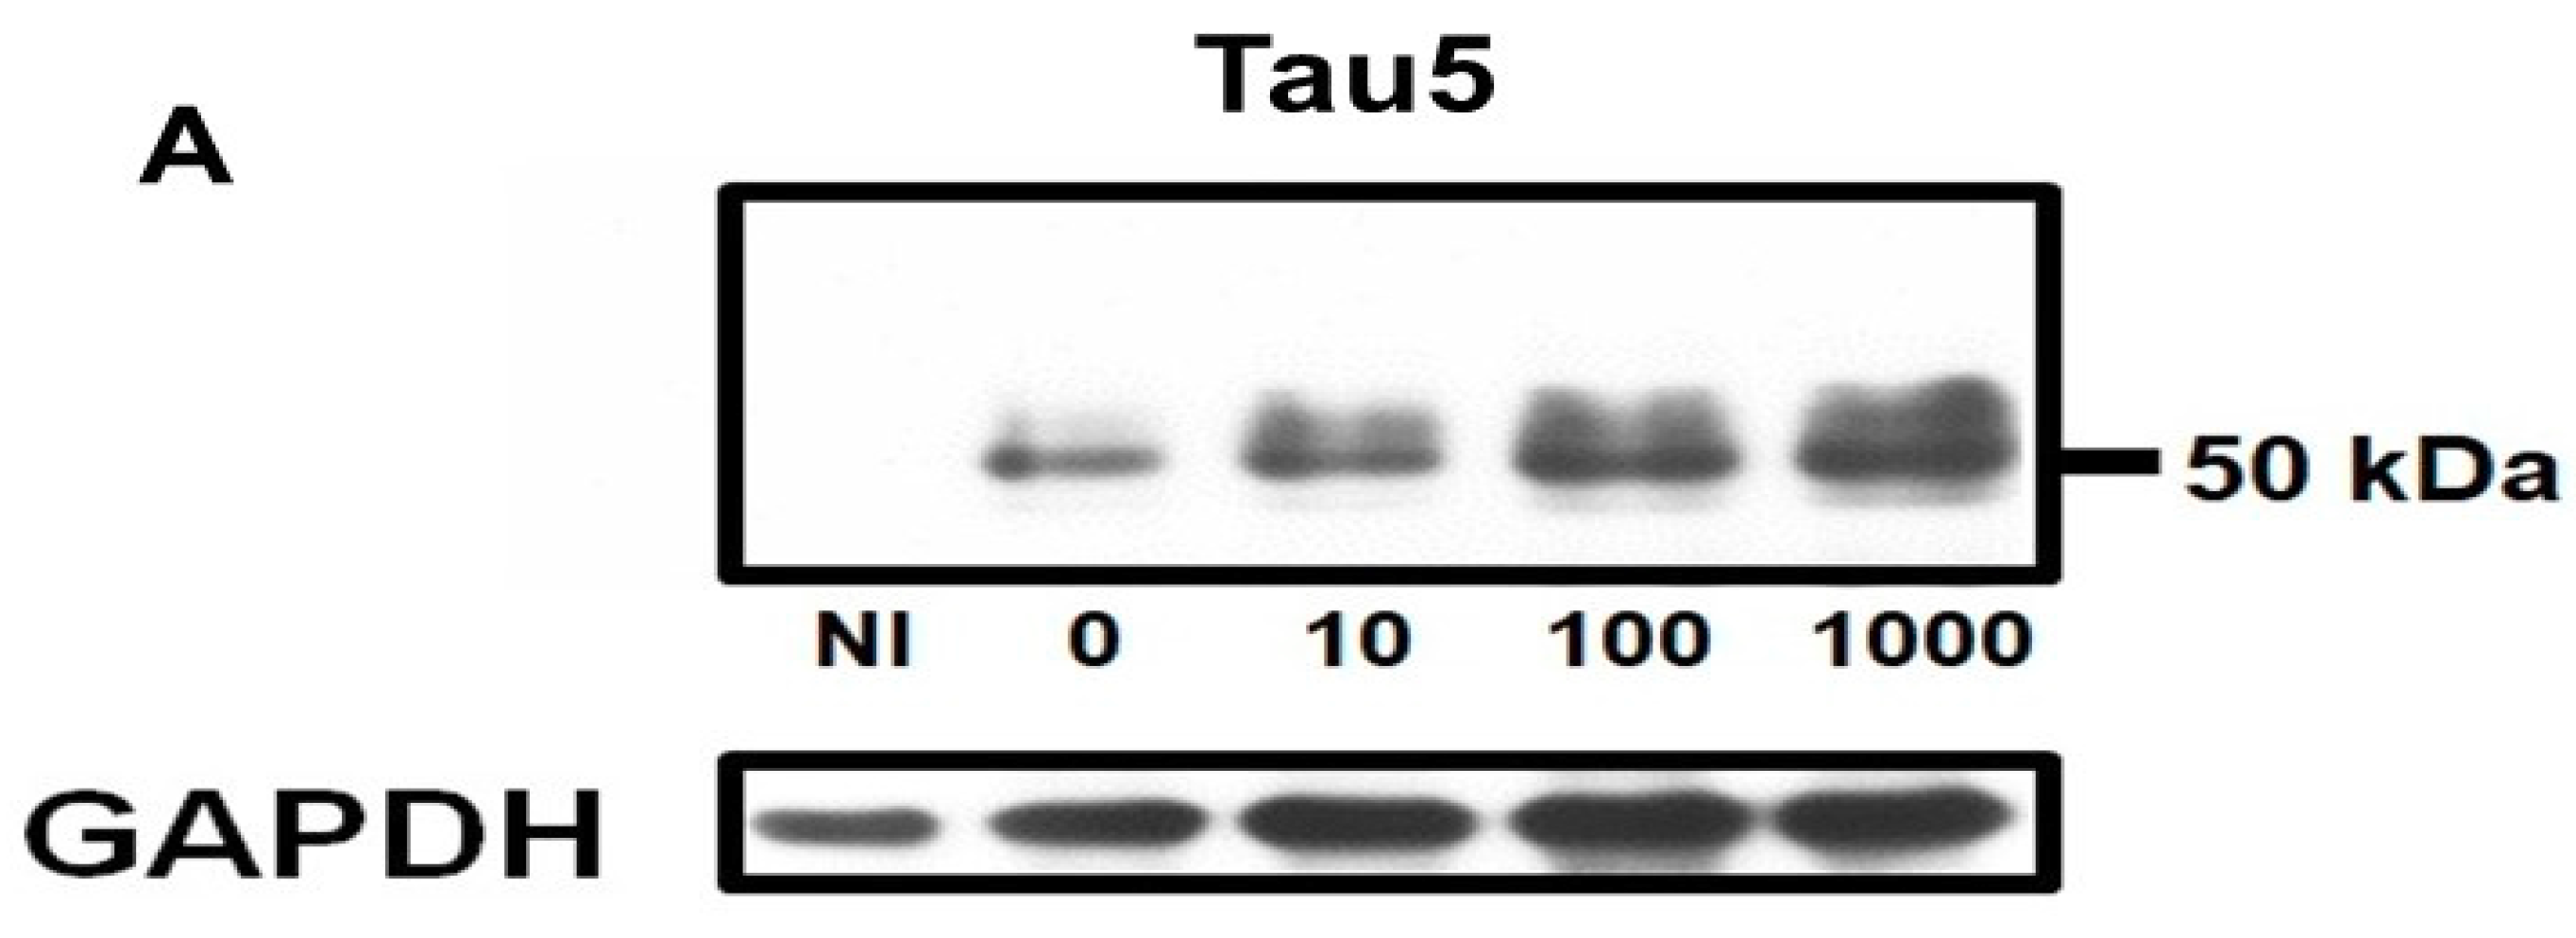
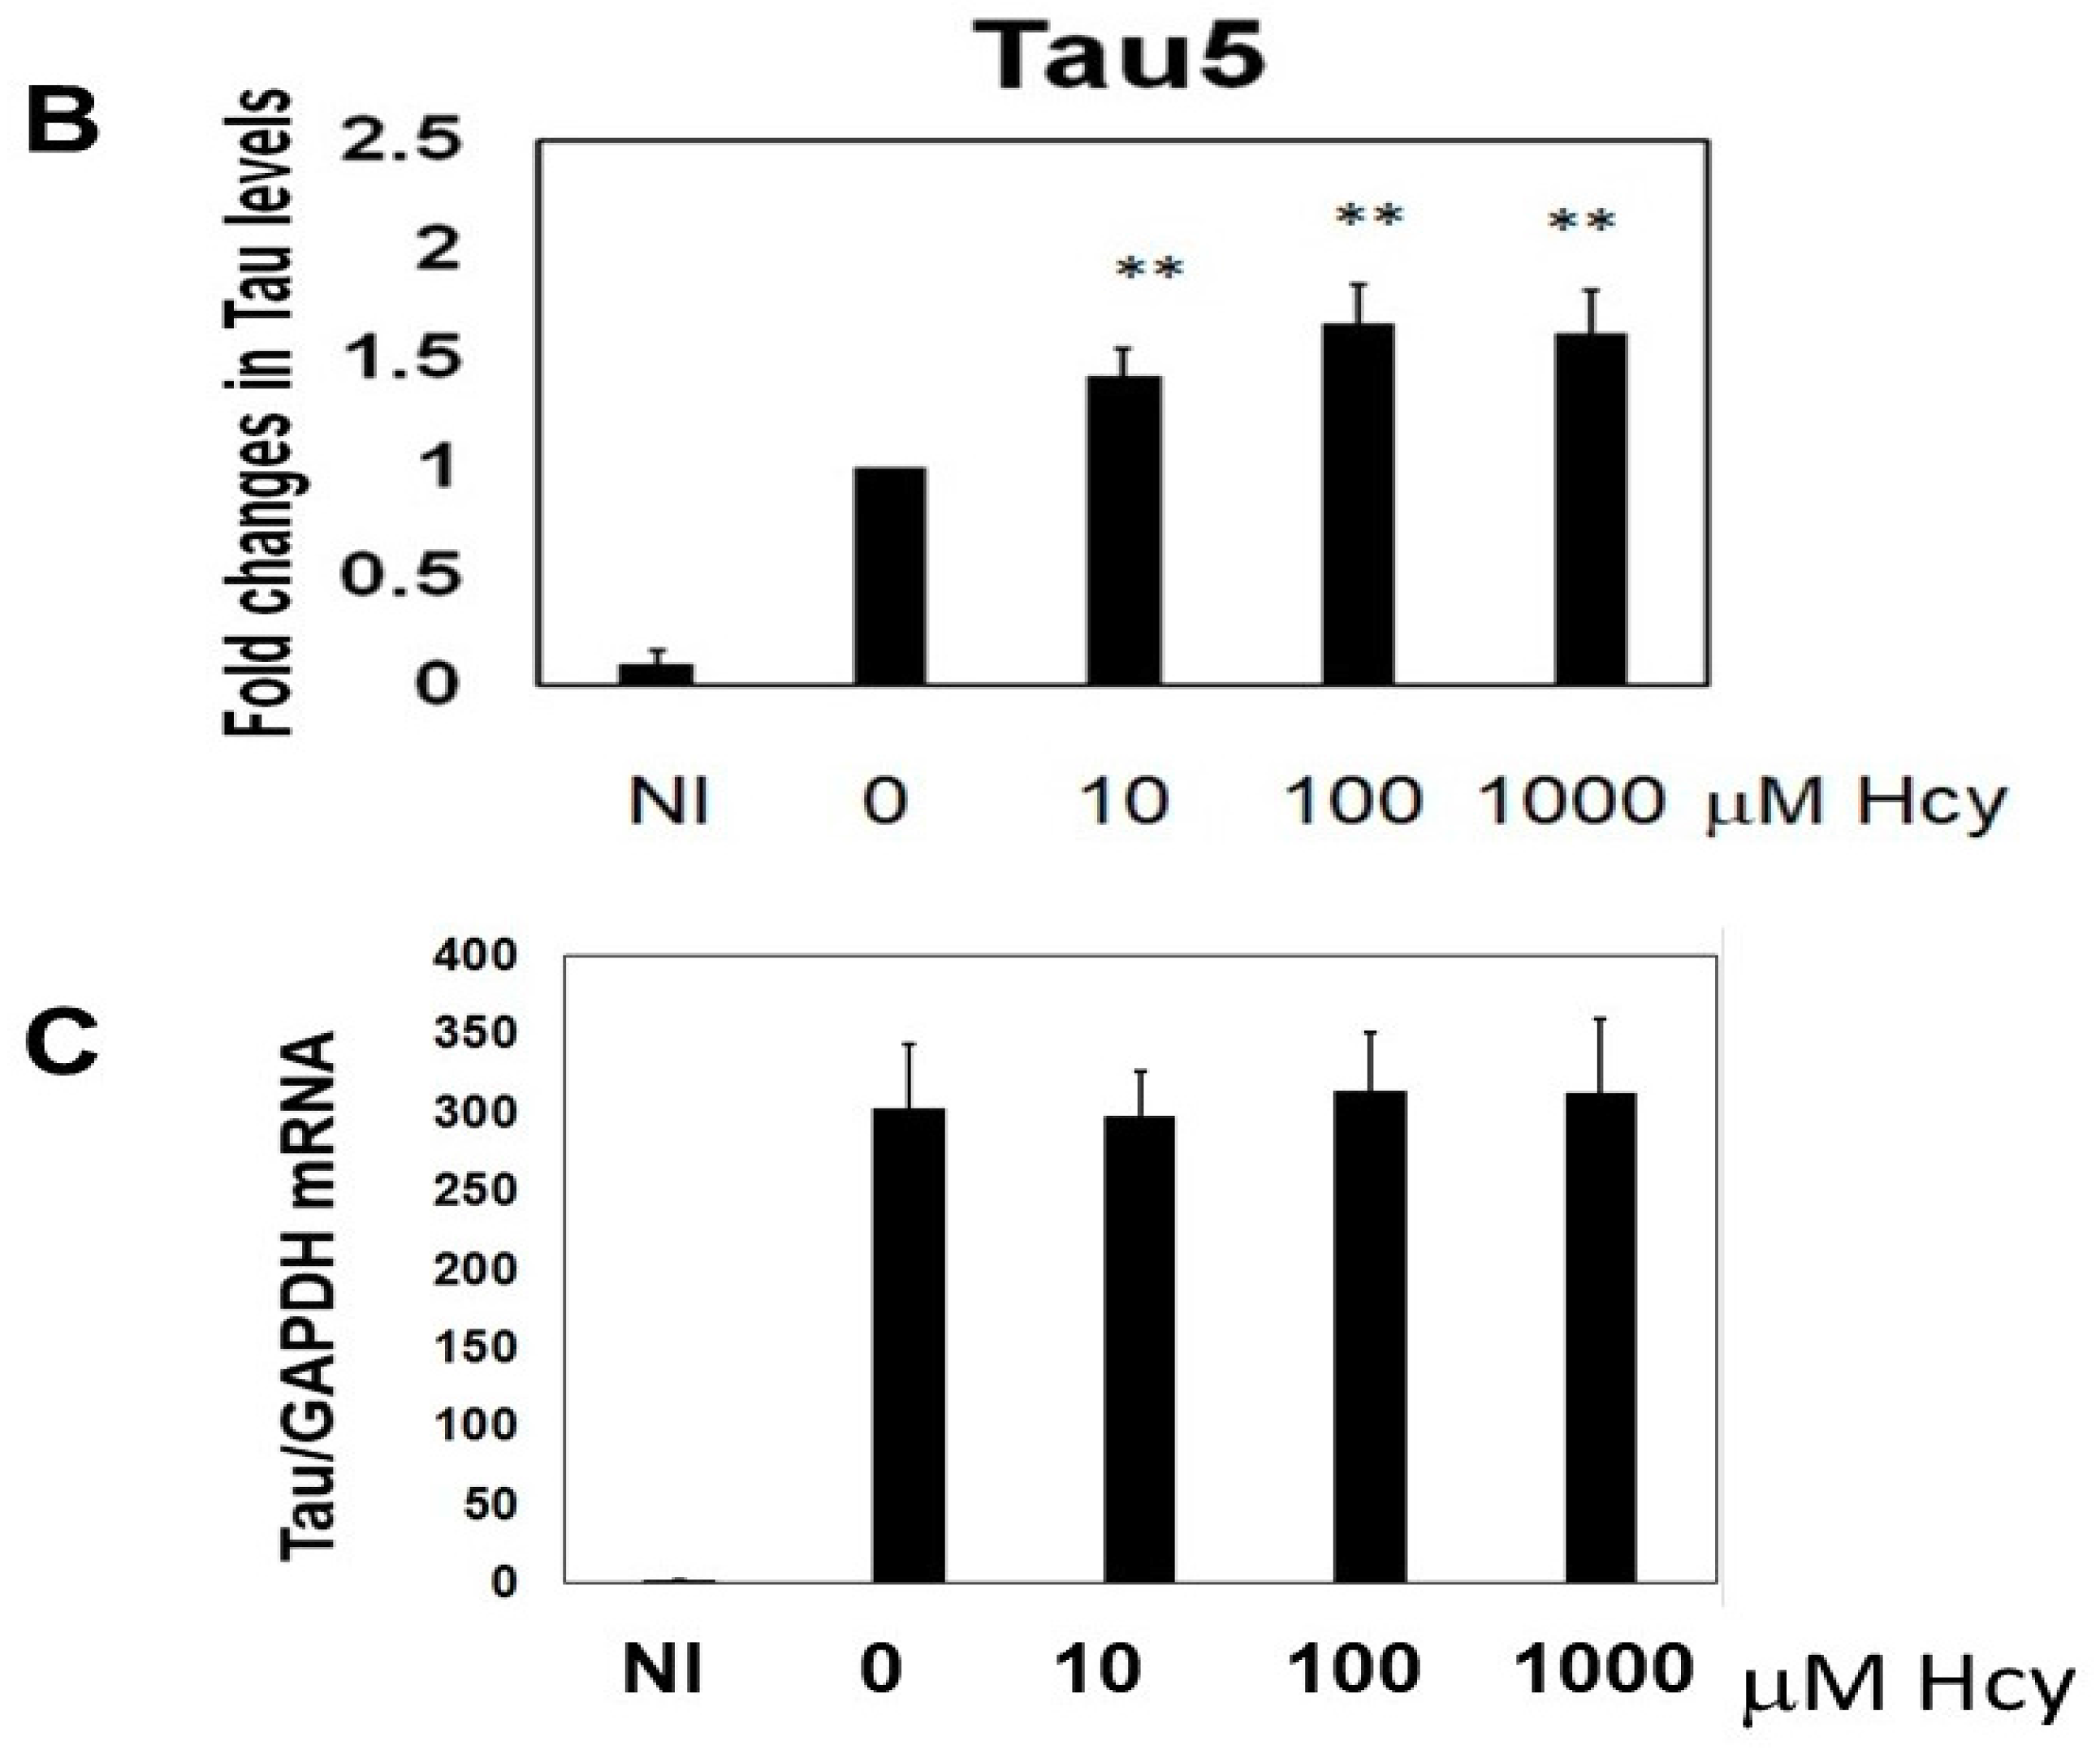
2.7. Homocysteine Induces Endogenous Tau Accumulation
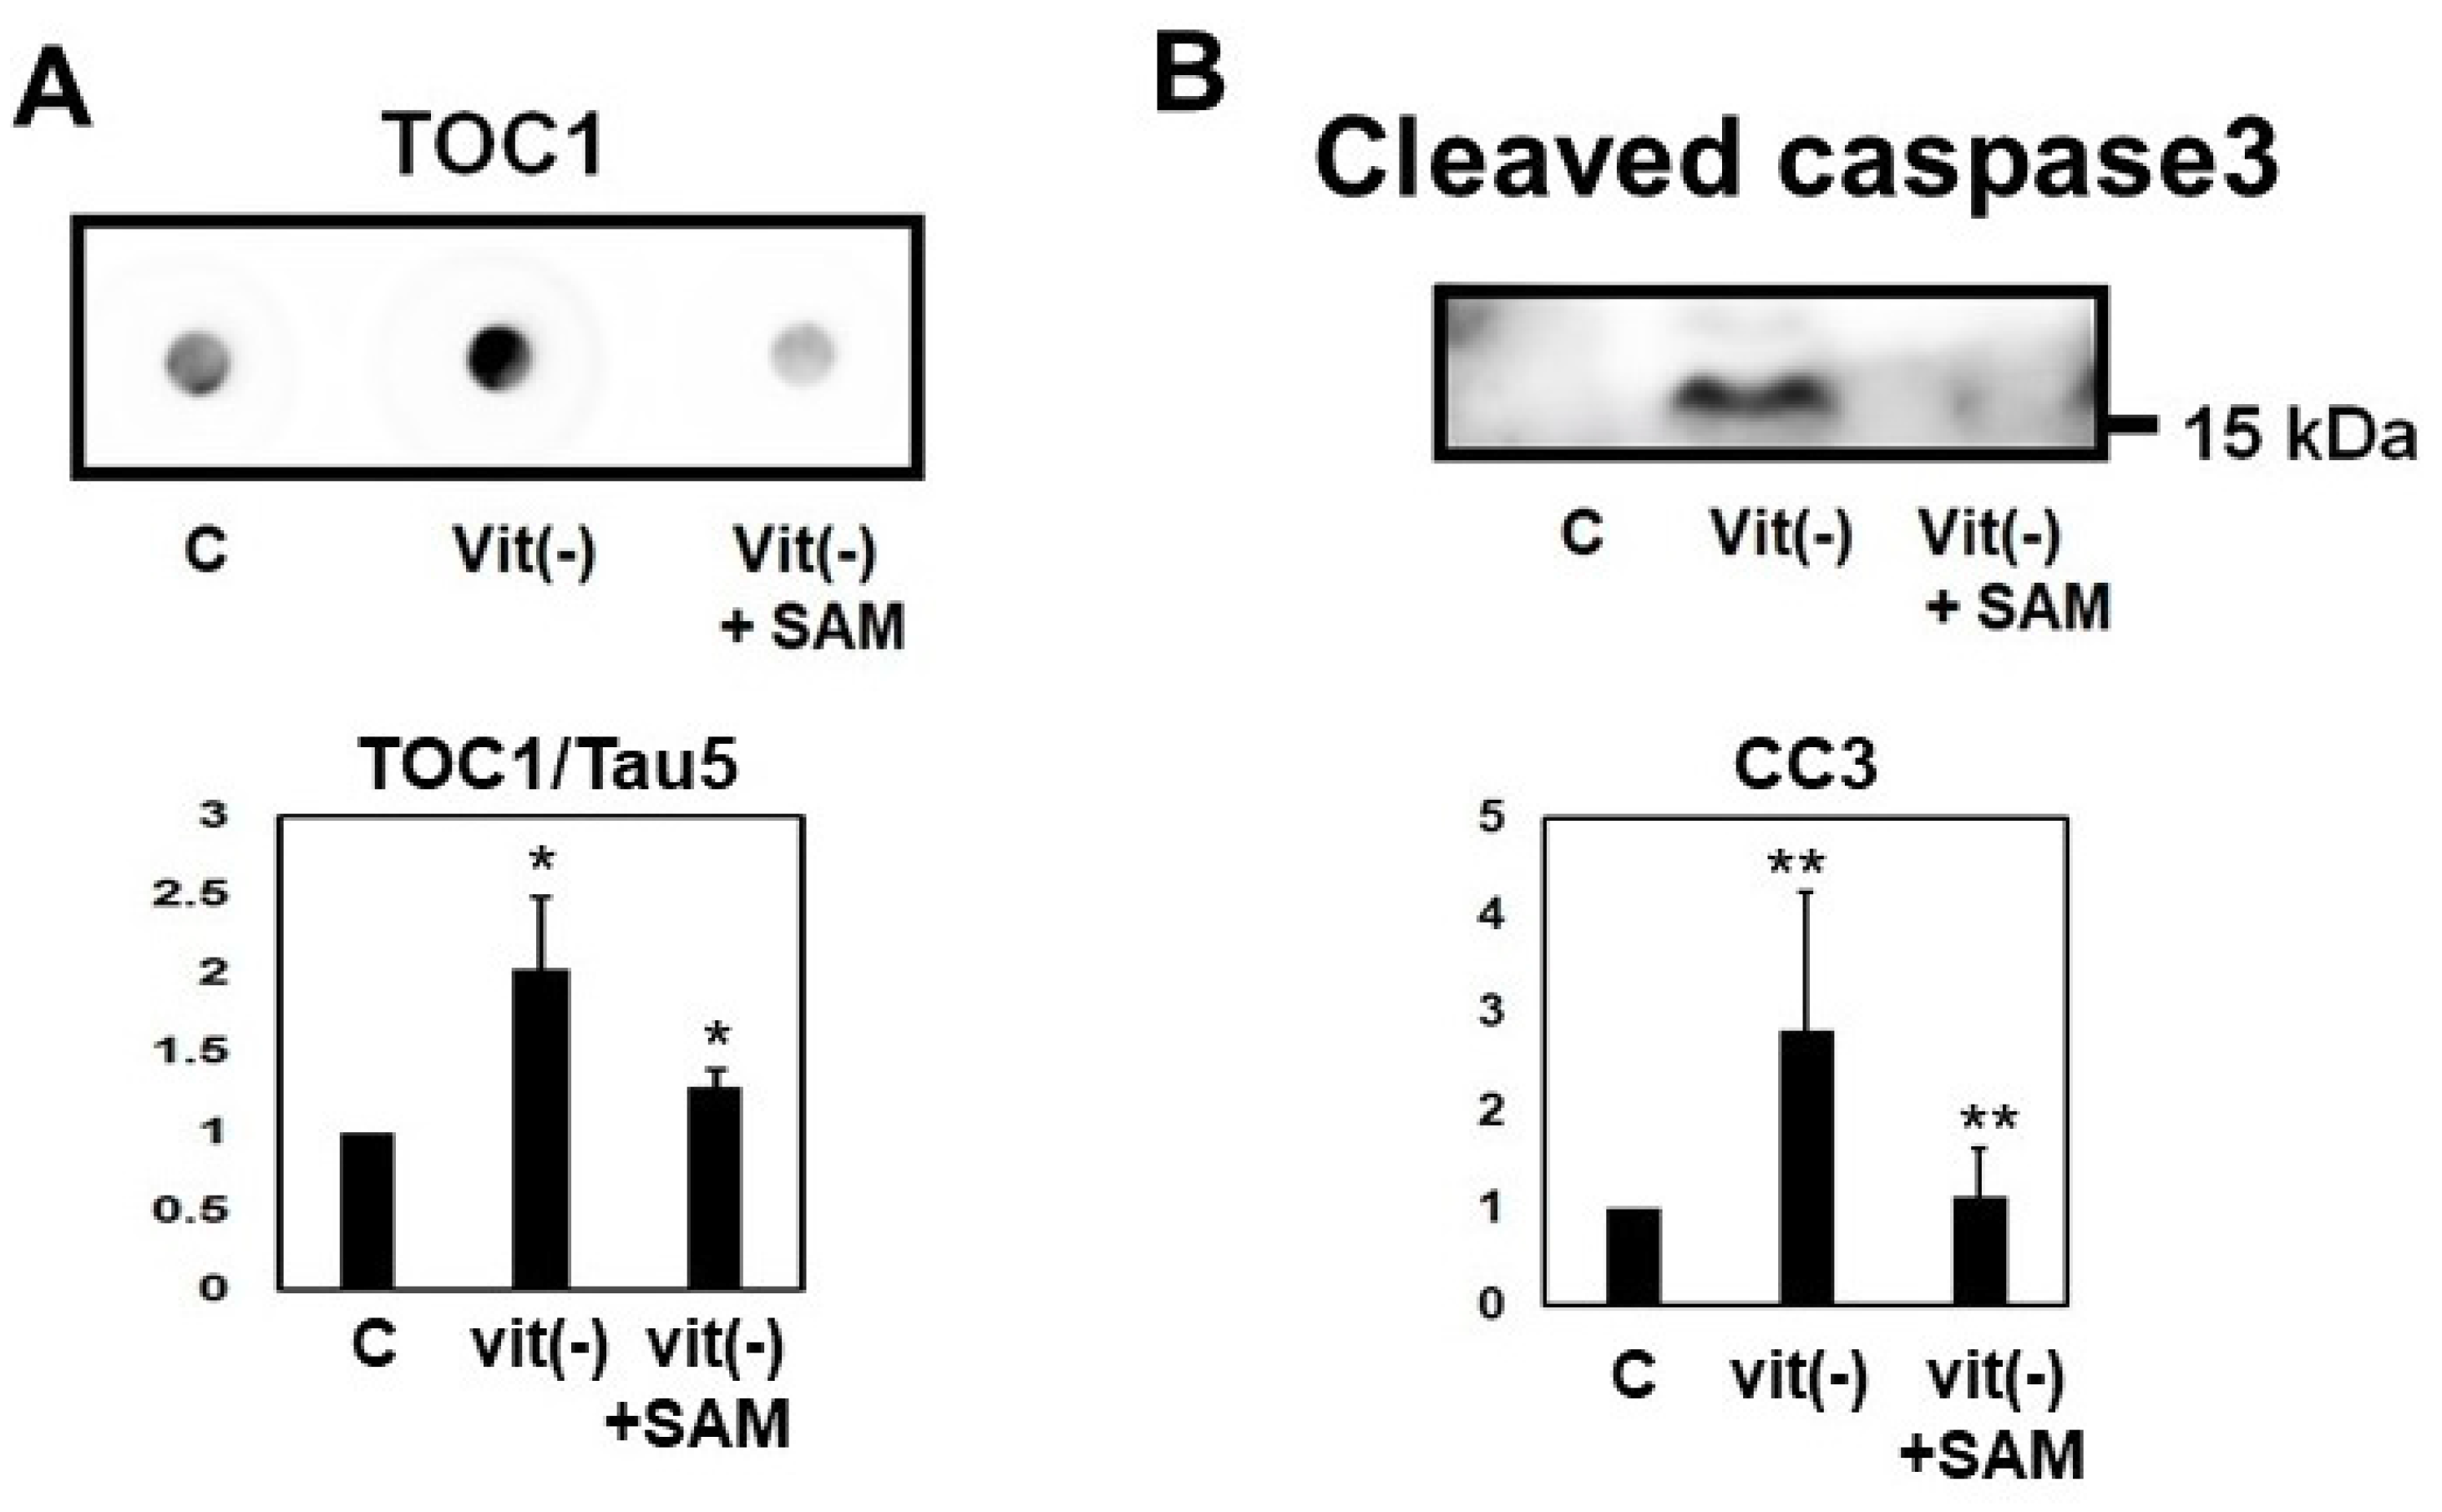
2.8. Induction of Hyperhomocysteinema in P301L Mice Increased Tau Phosphorylation, Cleavage and Oligomerization, an Effect Reversed by S-Adnosylmethionine Supplementation
2.9. Tau Accumulation Induced by Homocysteine Was Reversed by the Addition of Folic Acid
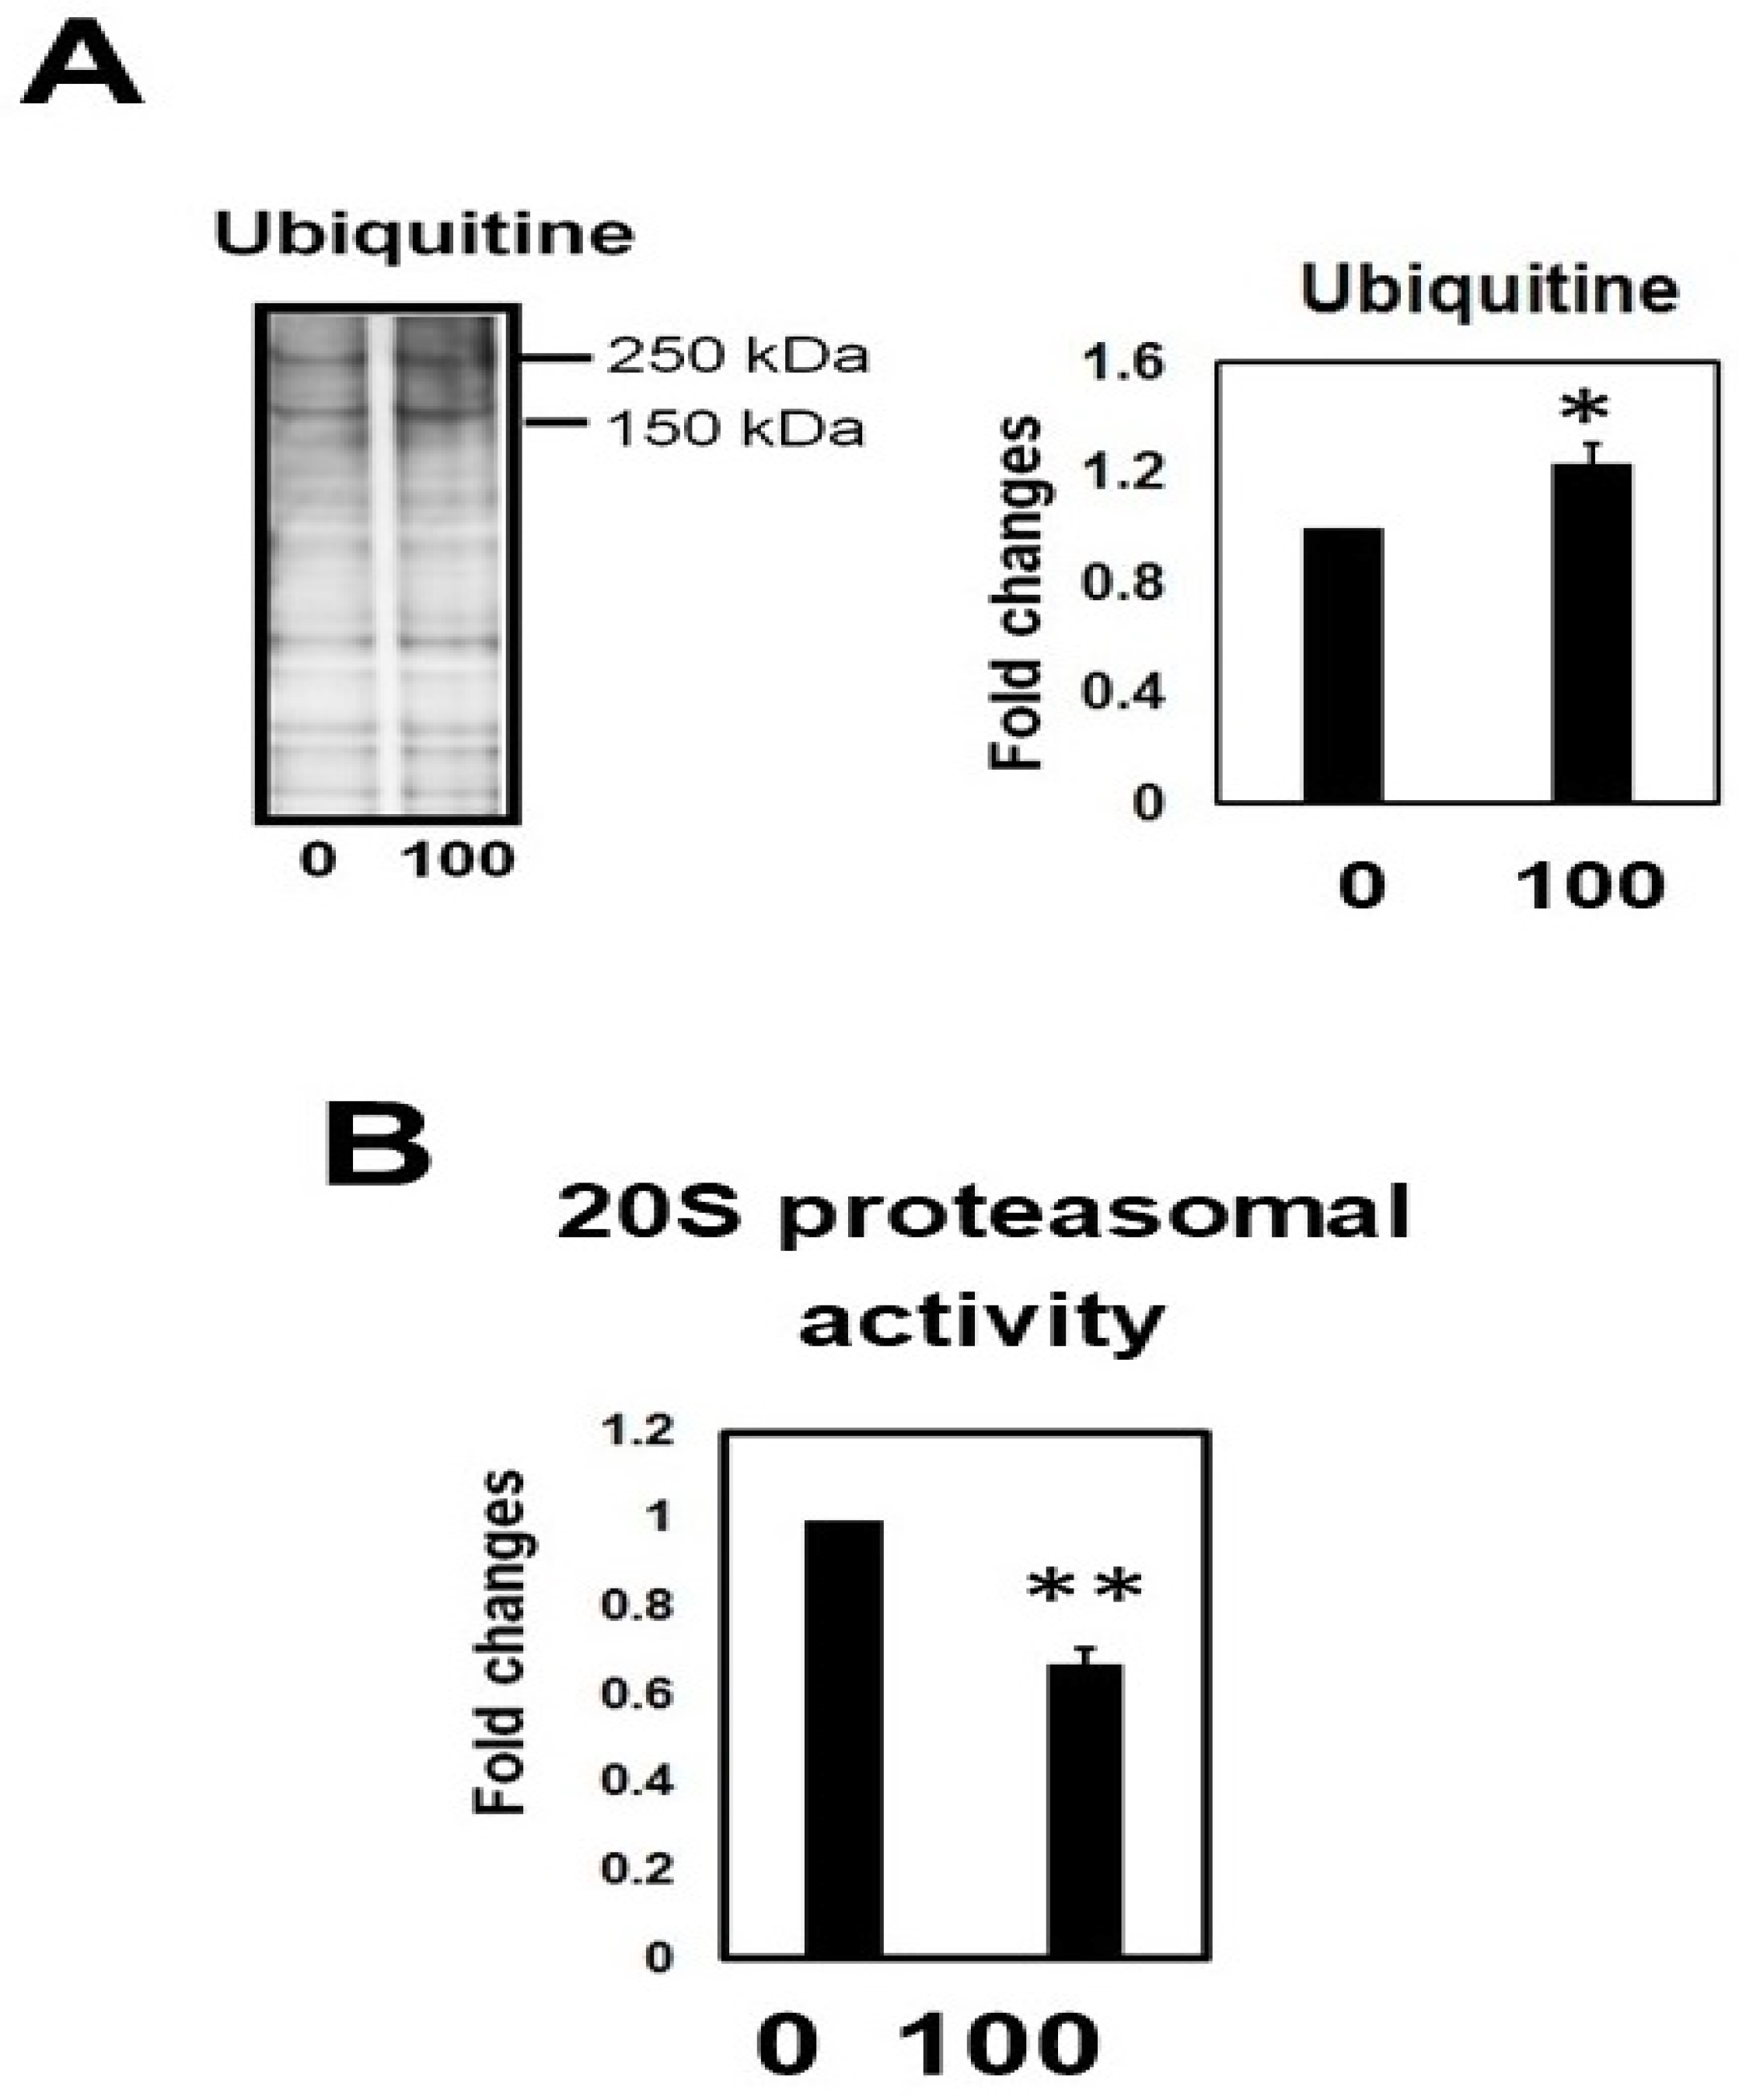
2.10. Hcy Treatment Inactivates the 20S Proteasome
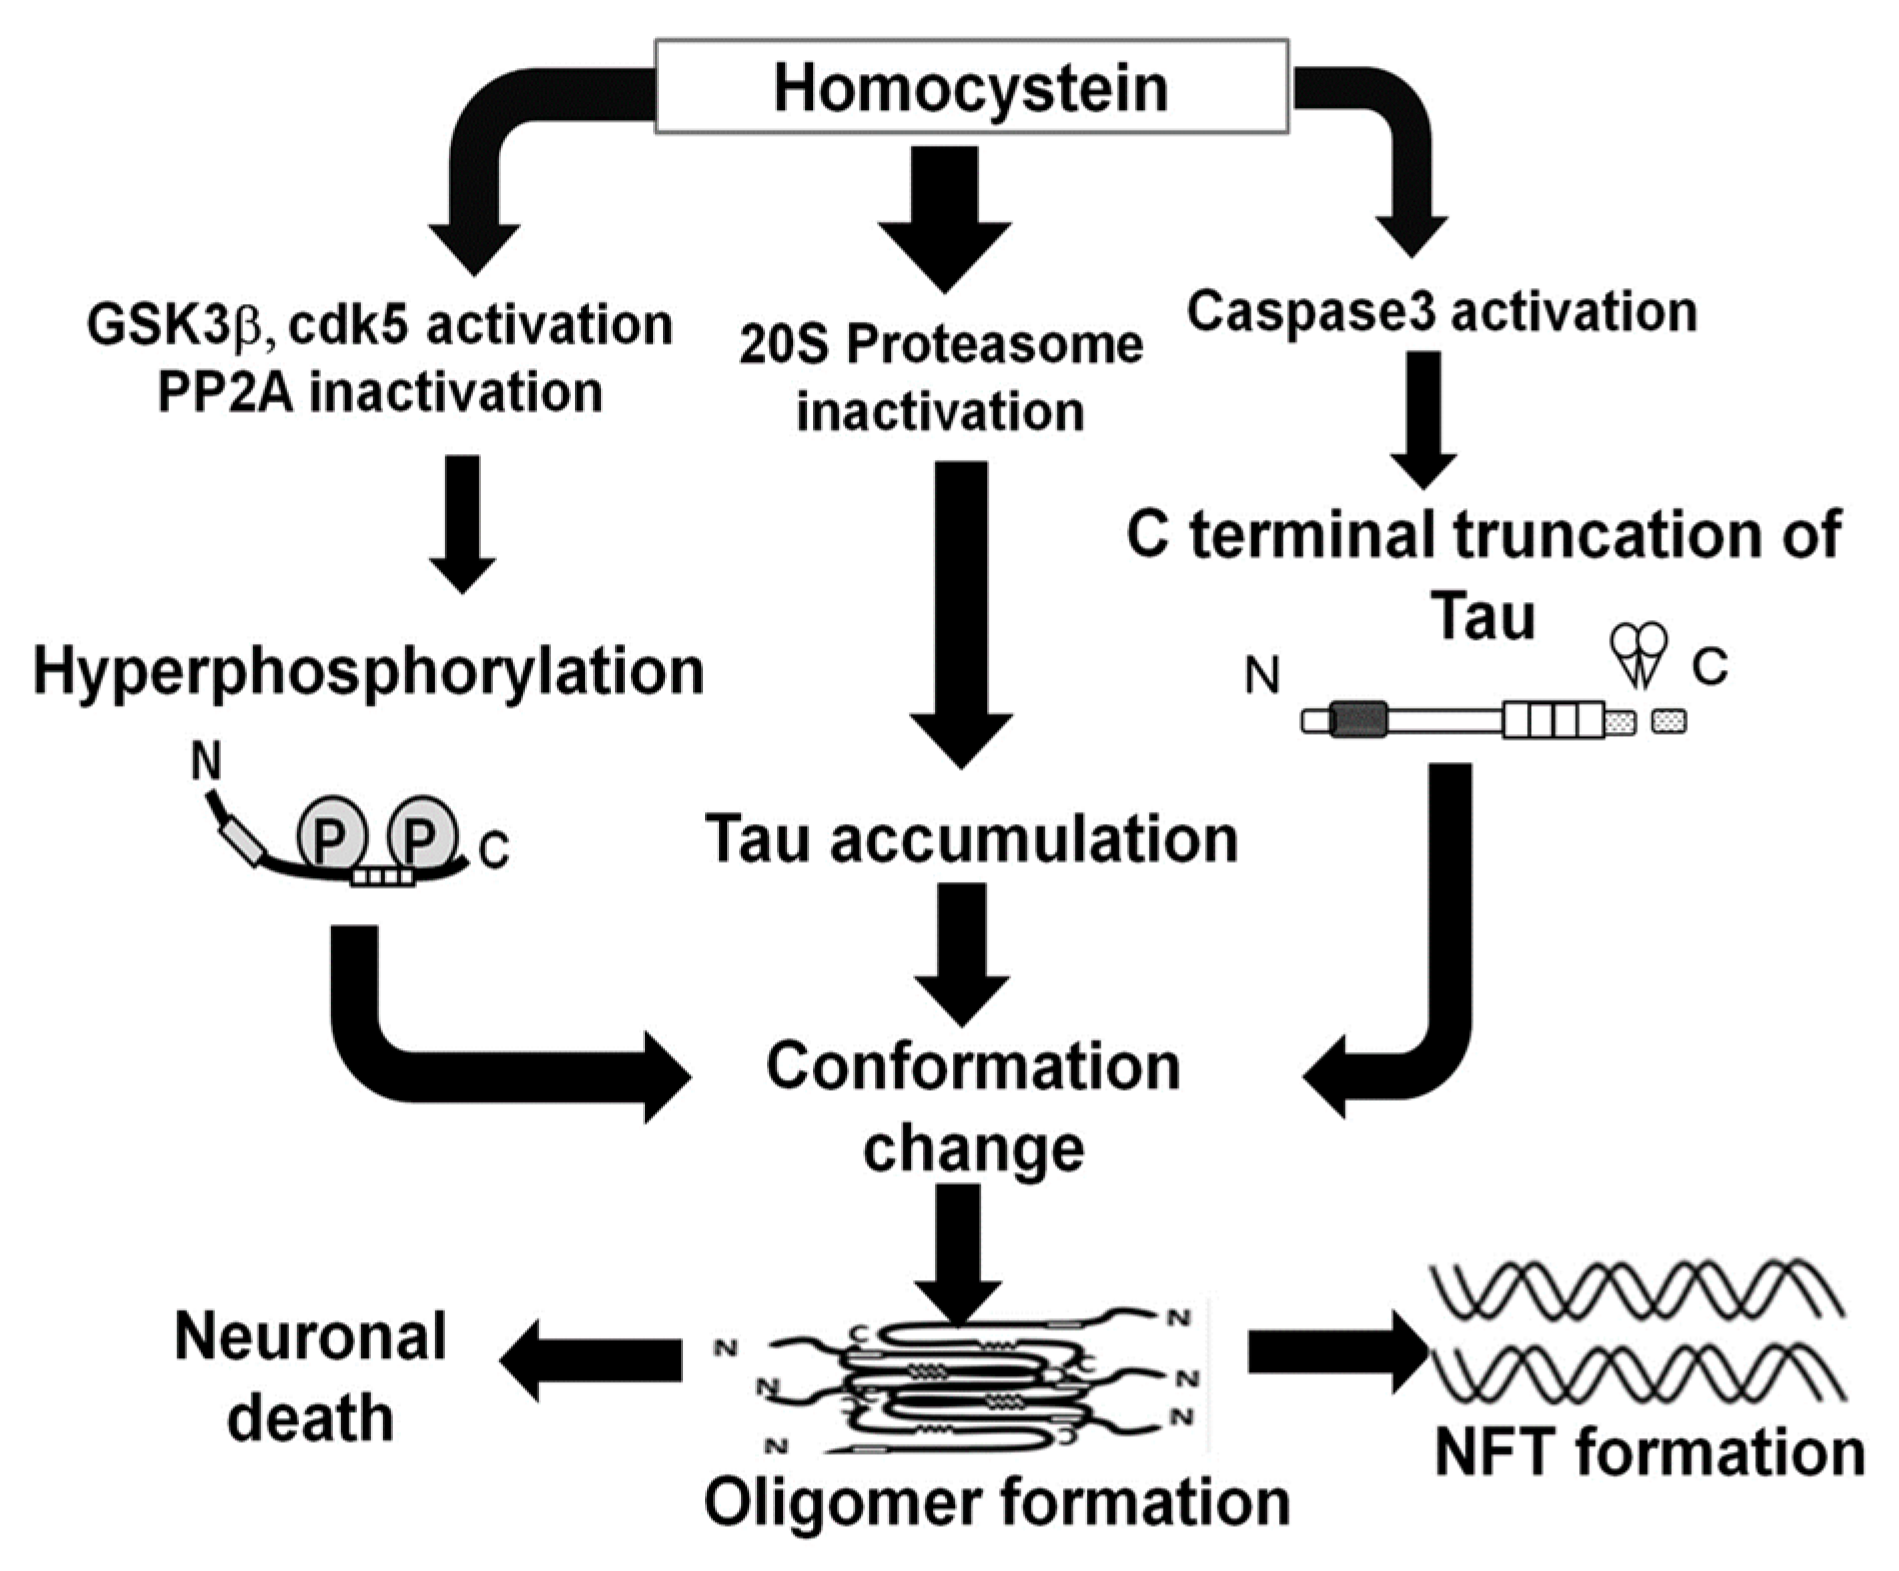
3. Discussion
4. Materials and Methods
4.1. Materials
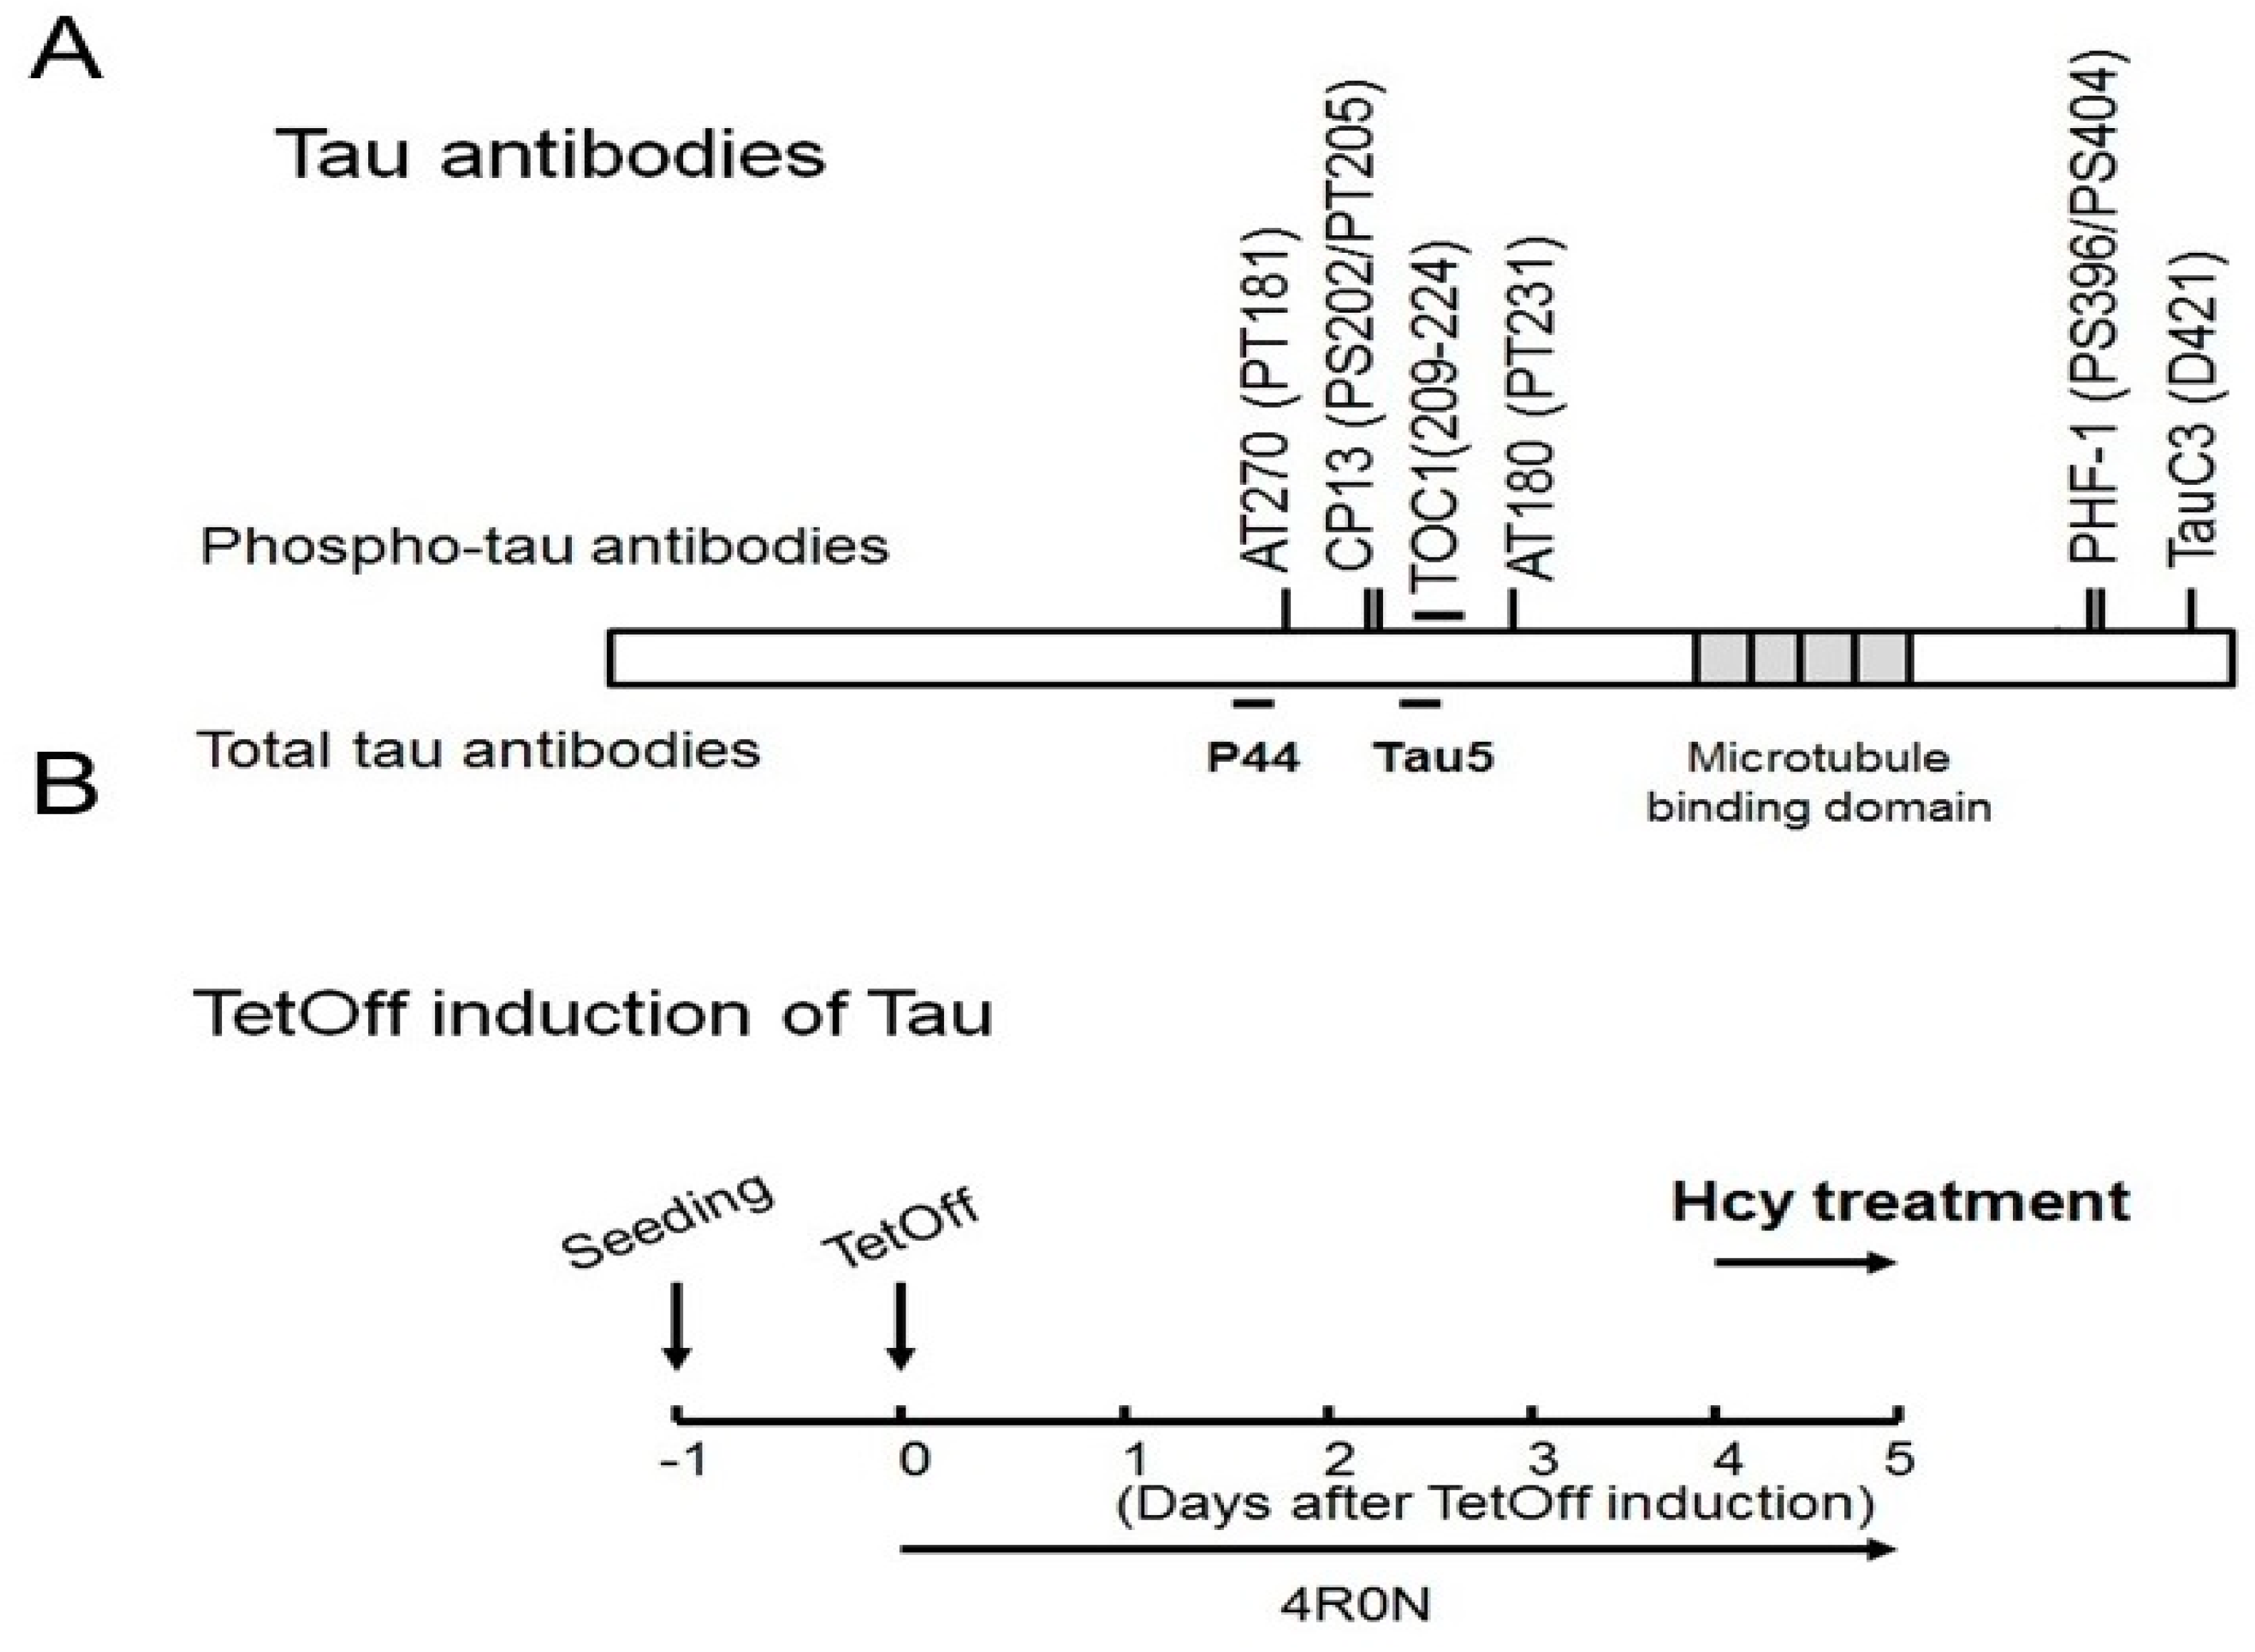
4.2. Antibodies
4.3. Cell Culture
4.4. Animals and Treatment
4.5. Fractionation Analysis
4.6. Western Blotting and Dot Blot
4.7. Immunocytochemistry
4.8. Morphological Study and Cell Viability Assay
4.9. mRNA Expression
4.10. Primary Neuronal Cell Culture
4.11. 20S Proteasome Activity Assay
4.12. Statistical Analysis
5. Conclusions
Supplementary Materials
Acknowledgments
Author Contributions
Conflicts of Interest
Abbreviations
| AD | Alzheimer’s disease |
| HHCy | Hyperhomocysteinemia |
| Hcy | Homocysteine |
| SAH | S-adenosylhomocysteine |
| SAM | S-adenosylmethionine |
| cdk5 | cyclin-dependent kinase 5 |
| PP2A | protein phosphatase 2A |
| GSK3β | glycogen synthase kinase 3β |
References
- Lee, V.M.; Goedert, M.; Trojanowski, J.Q. Neurodegenerative tauopathies. Annu. Rev. Neurosci. 2001, 24, 1121–1159. [Google Scholar] [CrossRef] [PubMed]
- Saito, Y.; Ruberu, N.N.; Sawabe, M.; Arai, T.; Tanaka, N.; Kakuta, Y.; Yamanouchi, H.; Murayama, S. Staging of argyrophilic grains: An age-associated tauopathy. J. Neuropathol. Exp. Neurol. 2004, 63, 911–918. [Google Scholar] [CrossRef] [PubMed]
- Kanaan, N.M.; Cox, K.; Alvarez, V.E.; Stein, T.D.; Poncil, S.; McKee, A.C. Characterization of early pathological tau conformations and phosphorylation in chronic traumatic encephalopathy. J. Neuropathol. Exp. Neurol. 2016, 75, 19–34. [Google Scholar] [CrossRef] [PubMed]
- Leszek, J.; Sochocka, M.; Gąsiorowski, K. Vascular factors and epigenetic modifications in the pathogenesis of Alzheimer’s disease. J. Neurol. Sci. 2012, 323, 25–32. [Google Scholar] [CrossRef] [PubMed]
- Ott, A.; Stolk, R.P.; van Harskamp, F.; Pols, H.A.; Hofman, A.; Breteler, M.M. Diabetes mellitus and the risk of dementia: The Rotterdam Study. Neurology 1999, 53, 1937–1942. [Google Scholar] [CrossRef] [PubMed]
- Hamano, T.; Shirafuji, N.; Makino, C.; Yen, S.H.; Kanaan, N.M.; Ueno, A.; Suzuki, J.; Ikawa, M.; Matsunaga, A.; Yamamura, O.; et al. Pioglitazone Prevents Tau Oligomerization. Biochem. Biophys. Res. Commun. 2016, 478, 1035–1042. [Google Scholar] [CrossRef] [PubMed]
- Carnevale, D.; Mascio, G.; D’Andrea, I.; Fardella, V.; Bell, R.D.; Branchi, I.; Pallante, F.; Zlokovic, B.; Yan, S.S.; Lembo, G. Hypertension induces brain β-amyloid accumulation, cognitive impairment, and memory deterioration through activation of receptor for advanced glycation end products in brain vasculature. Hypertension 2012, 60, 188–197. [Google Scholar] [CrossRef] [PubMed]
- Cifuentes, D.; Poittevin, M.; Dere, E.; Broquères-You, D.; Bonnin, P.; Benessiano, J.; Pocard, M.; Mariani, J.; Kubis, N.; Merkulova-Rainon, T.; et al. Hypertension accelerates the progression of Alzheimer-like pathology in a mouse model of the disease. Hypertension 2015, 65, 218–224. [Google Scholar] [CrossRef] [PubMed]
- Di Paolo, G.; Kim, T.W. Linking lipids to Alzheimer’ disease. Nat. Rev. Neurosci. 2011, 12, 284–296. [Google Scholar] [CrossRef] [PubMed]
- Hamano, T.; Yen, S.H.; Gendron, T.; Ko, L.-W.; Kuriyama, M. Pitavastatin decreases tau levels via the inactivation of Rho/ROCK. Neurobiol. Aging 2012, 33, 2306–2320. [Google Scholar] [CrossRef] [PubMed]
- Seshadri, S.; Beiser, A.; Selhub, J.; Jacques, P.F.; Rosenberg, I.H.; D’Agostino, R.B.; Wilson, P.W.; Wolf, P.A. Plasma homocysteine as a risk factor for dementia and Alzheimer’s disease. N. Engl. J. Med. 2002, 346, 476–483. [Google Scholar] [CrossRef] [PubMed]
- Nilsson, K.; Gustafson, L.; Hultberg, B. Elevated plasma homocysteine level in vascular dementia reflects the vascular disease process. Dement. Geriatr. Cogn. Dis. Extr. 2013, 3, 16–24. [Google Scholar] [CrossRef] [PubMed]
- Mattson, M.P.; Shea, T.B. Folate and homocysteine metabolism in neural plasticity and neurodegenerative disorders. Trends Neurosci. 2003, 26, 137–146. [Google Scholar] [CrossRef]
- Finkelstein, J.D. Metabolic regulatory properties of S-adenosylmethionine and S-adenosylhomocysteine. Clin. Chem. Lab. Med. 2007, 45, 1694–1699. [Google Scholar] [CrossRef] [PubMed]
- Li, J.G.; Chu, J.; Barrero, C.; Merali, S.; Praticò, D. Homocysteine exacerbates β-amyloid pathology, tau pathology, and cognitive deficit in a mouse model of Alzheimer disease with plaques and tangles. Ann. Neurol. 2014, 75, 851–863. [Google Scholar] [CrossRef] [PubMed]
- Zhang, C.E.; Tian, Q.; Wei, W.; Peng, J.H.; Liu, G.P.; Zhou, X.W.; Wang, Q.; Wang, D.W.; Wang, J.Z. Homocysteine induces tau phosphorylation by inactivating protein phosphatase 2A in rat hippocampus. Neurobiol. Aging 2008, 29, 1654–1665. [Google Scholar] [CrossRef] [PubMed]
- Gamblin, T.C.; Berry, R.W.; Binder, L.I. Modeling tau polymerization in vitro: A review and synthesis. Biochemistry 2003, 42, 15009–15017. [Google Scholar] [CrossRef] [PubMed]
- Alonso, A.C.; Grundke-Iqbal, I.; Iqbal, K. Alzheimer’s disease hyperphosphorylated tau sequesters normal tau into tangles of filaments and disassembles microtubules. Nat. Med. 1996, 2, 783–787. [Google Scholar] [CrossRef] [PubMed]
- Kanaan, N.M.; Pigino, G.F.; Brady, S.T.; Lazarov, O.; Binder, L.I.; Morfini, G.A. Axonal degeneration in Alzheimer’s disease: When signaling abnormalities meet the axonal transport system. Exp. Neurol. 2013, 246, 44–53. [Google Scholar] [CrossRef] [PubMed]
- Cavallini, A.; Brewerton, S.; Bell, A.; Sargent, S.; Glover, S.; Hardy, C.; Moore, R.; Calley, J.; Ramachandran, D.; Poidinger, M. An unbiased approach to identifying tau kinases that phosphorylate tau at sites associated with Alzheimer disease. J. Biol. Chem. 2013, 288, 23331–23347. [Google Scholar] [CrossRef] [PubMed]
- Han, P.; Dou, F.; Li, F.; Zhang, X.; Zhang, Y.W.; Zheng, H.; Lipton, S.A.; Xu, H.; Liao, F.F. Suppression of cyclin-dependent kinase 5 activation by amyloid precursor protein: A novel excitoprotective mechanism involving modulation of tau phosphorylation. J. Neurosci. 2005, 25, 11542–11552. [Google Scholar] [CrossRef] [PubMed]
- Sontag, E.; Nunbhakdi-Craig, V.; Lee, G.; Bloom, G.S.; Mumby, M.C. Regulation of the phosphorylation state and microtubule-binding activity of Tau by protein phosphatase 2A. Neuron 1996, 17, 1201–1207. [Google Scholar] [CrossRef]
- Li, W.; Jiang, M.; Xiao, Y.; Zhang, X.; Cui, S.; Huang, G. Folic acid inhibits tau phosphorylation through regulation of PP2A methylation in SH-SY5Y cells. J. Nutr. Health Aging 2015, 19, 123–129. [Google Scholar] [CrossRef] [PubMed]
- Gamblin, T.C.; Chen, F.; Zambrano, A.; Abraha, A.; Lagalwar, S.; Guillozet, A.L.; Lu, M.; Fu, Y.; Garcia-Sierra, F.; LaPointe, N.; et al. Caspase cleavage of tau: Linking amyloid and neurofibrillary tangles in Alzheimer’s disease. Proc. Natl. Acad. Sci. USA 2003, 100, 10032–10037. [Google Scholar] [CrossRef] [PubMed]
- Chung, C.W.; Song, Y.H.; Kim, I.K.; Yoon, W.J.; Ryu, B.R.; Jo, D.G.; Woo, H.N.; Kwon, Y.K.; Kim, H.H.; Gwag, B.J.; et al. Proapoptotic effects of tau cleavage product generated by caspase-3. Neurobiol. Dis. 2001, 8, 162–172. [Google Scholar] [CrossRef] [PubMed]
- De Calignon, A.; Fox, L.M.; Pitstick, R.; Carlson, G.A.; Bacskai, B.J.; Spires-Jones, T.L.; Hyman, B.T. Caspase activation precedes and leads to tangles. Nature 2010, 464, 1201–1204. [Google Scholar] [CrossRef] [PubMed]
- Melo, F.R.; Bressan, R.B.; Costa-Silva, B.; Trentin, A.G. Effects of Folic Acid and Homocysteine on the Morphogenesis of Mouse Cephalic Neural Crest Cells In Vitro. Cell Mol. Neurobiol. 2017, 37, 371–376. [Google Scholar] [CrossRef] [PubMed]
- Kruman, I.I.; Culmsee, C.; Chan, S.L.; Kruman, Y.; Guo, Z.; Penix, L.; Mattson, M.P. Homocysteine elicits a DNA damage response in neurons that promotes apoptosis and hypersensitivity to excitotoxicity. J. Neurosci. 2000, 20, 6920–6926. [Google Scholar] [PubMed]
- Tyagi, N.; Ovechkin, A.V.; Lominadze, D.; Moshal, K.S.; Tyagi, S.C. Mitochondrial mechanism of microvascular endothelial cells apoptosis in hyperhomocysteinemia. J. Cell. Biochem. 2006, 98, 1150–1162. [Google Scholar] [CrossRef] [PubMed]
- Outinen, P.A.; Sood, S.K.; Pfeifer, S.I.; Pamidi, S.; Podor, T.J.; Li, J.; Weitz, J.I.; Austin, R.C. Homocysteine-induced endoplasmic reticulum stress and growth arrest leads to specific changes in gene expression in human vascular endothelial cells. Blood 1999, 94, 959–967. [Google Scholar] [PubMed]
- Lipton, S.A.; Kim, W.K.; Choi, Y.B.; Kumar, S.; D’Emilia, D.M.; Rayudu, P.V.; Arnelle, D.R.; Stamler, J.S. Neurotoxicity associated with dual actions of homocysteine at the N-methyl-D-aspartate receptor. Proc. Natl. Acad. Sci. USA 1997, 94, 5923–5928. [Google Scholar] [CrossRef] [PubMed]
- Chan, A.Y.; Alsaraby, A.; Shea, T.B. Folate deprivation increases tau phosphorylation by homocysteine-induced calcium influx and by inhibition of phosphatase activity: Alleviation by S-adenosyl methionine. Brain Res. 2008, 1199, 133–137. [Google Scholar] [CrossRef] [PubMed]
- Berry, R.W.; Abraha, A.; Lagalwar, S.; LaPointe, N.; Gamblin, T.C.; Cryns, V.L.; Binder, L.I. Inhibition of tau polymerization by its carboxy-terminal caspase cleavage fragment. Biochemistry 2003, 42, 8325–8331. [Google Scholar] [CrossRef] [PubMed]
- Plouffe, V.; Mohamed, N.V.; Rivest-McGraw, J.; Bertrand, J.; Lauzon, M.; Leclerc, N. Hyperphosphorylation and cleavage at D421 enhance tau secretion. PLoS ONE 2012, 7, e36873. [Google Scholar] [CrossRef] [PubMed]
- López Salon, M.; Morelli, L.; Castaño, E.M.; Soto, E.F.; Pasquini, J.M. Defective ubiquitination of cerebral proteins in Alzheimer’s disease. J. Neurosci. Res. 2000, 62, 302–310. [Google Scholar] [CrossRef]
- Keck, S.; Nitsch, R.; Grune, T.; Ullrich, O. Proteasome inhibition by paired helical filament-tau in brains of patients with Alzheimer’s disease. J. Neurochem. 2003, 85, 15–22. [Google Scholar] [CrossRef]
- Ward, S.M.; Himmelstein, D.S.; Lancia, J.K.; Fu, Y.; Patterson, K.R.; Binder, L.I. TOC1: Characterization of a selective oligomeric tau antibody. J. Alzheimer’s Dis. 2013, 37, 593–602. [Google Scholar]
- Maeda, S.; Sahara, N.; Saito, Y.; Murayama, S.; Ikai, A.; Takashima, A. Increased levels of granular tau oligomers: An early sign of brain aging and Alzheimer’s disease. Neurosci. Res. 2006, 54, 197–201. [Google Scholar] [CrossRef] [PubMed]
- Sahara, N.; Maeda, S.; Murayama, S.; Suzuki, T.; Dohmae, N.; Yen, S.H.; Takashima, A. Assembly of two distinct dimers and higher-order oligomers from full-length tau. Eur. J. Neurosci. 2007, 25, 3020–3029. [Google Scholar] [CrossRef] [PubMed]
- Meraz-Ríos, M.A.; Lira-De León, K.I.; Campos-Peña, V.; De Anda-Hernández, M.A.; Mena-López, R. Tau oligomers and aggregation in Alzheimer’s disease. J. Neurochem. 2010, 112, 1353–1367. [Google Scholar] [CrossRef] [PubMed]
- Lasagna-Reeves, C.A.; Castillo-Carranza, D.L.; Sengupta, U.; Sarmiento, J.; Troncoso, J.; Jackson, G.R.; Kayed, R. Identification of oligomers at early stages of tau aggregation in Alzheimer’s disease. FASEB J. 2012, 26, 1946–1959. [Google Scholar] [CrossRef] [PubMed]
- Patterson, K.R.; Remmers, C.; Fu, Y.; Brooker, S.; Kanaan, N.M.; Vana, L.; Ward, S.; Reyes, J.F.; Philibert, K.; Glucksman, M.J.; et al. Characterization of prefibrillar Tau oligomers in vitro and in Alzheimer disease. J. Biol. Chem. 2011, 286, 23063–23076. [Google Scholar] [CrossRef] [PubMed]
- Cox, K.; Combs, B.; Abdelmesih, B.; Morfini, G.; Brady, S.T.; Kanaan, N.M. Analysis of isoform—Specific tau aggregates suggests a common toxic mechanism involving similar pathological conformations and axonal transport inhibition. Neurobiol. Aging 2016, 47, 113–126. [Google Scholar] [CrossRef] [PubMed]
- Patterson, K.R.; Ward, S.M.; Combs, B.; Voss, K.; Kanaan, N.M.; Morfini, G.; Brady, S.T.; Gamblin, T.C.; Binder, L.I. Heat shock protein 70 prevents both tau aggregation and the inhibitory effects of preexisting tau aggregates on fast axonal transport. Biochemistry 2011, 50, 10300–10310. [Google Scholar] [CrossRef] [PubMed]
- Holmes, B.B.; Diamond, M.I. Prion-like properties of Tau protein: the importance of extracellular Tau as a therapeutic target. J. Biol. Chem. 2014, 289, 19855–19861. [Google Scholar] [CrossRef] [PubMed]
- Hasegawa, T.; Mikoda, N.; Kitazawa, M.; LaFerla, F.M. Treatment of Alzheimer’s diseasewith anti-homocysteic acid antibody in 3xTg-AD male mice. PLoS ONE 2010, 5, e8593. [Google Scholar]
- Rodriguez-Oroz, M.C.; Martinez Lage, P.; Sanchez-Mut, J. Homocysteine and cognitive impairment in Parkinson’s disease: A biochemical, neuroimaging, and genetic study. Mov. Disord. 2009, 24, 1437–1444. [Google Scholar] [CrossRef] [PubMed]
- Madsen, S.K.; Rajagopalan, P.; Joshi, S.H.; Toga, A.W.; Thompson, P.M. Alzheimer’s Disease Neuroimaging Initiative (ADNI). Higher homocysteine associated with thinner cortical gray matter in 803 participants from the Alzheimer’s Disease Neuroimaging Initiative. Neurobiol. Aging 2015, 36 (Suppl. 1), S203–S210. [Google Scholar] [CrossRef] [PubMed]
- Selhub, J.; Jacques, P.F.; Bostom, A.G. Association between plasma homocysteine concentrations and extracranial carotid-artery stenosis. N. Engl. J. Med. 1995, 332, 286–291. [Google Scholar] [CrossRef] [PubMed]
- Bostom, A.G.; Rosenberg, I.H.; Silbershatz, H. Nonfasting plasma total homocysteine levels and stroke incidence in elderly persons. Ann. Intern. Med. 1999, 131, 352–355. [Google Scholar] [CrossRef] [PubMed]
- Stampfer, M.J.; Malinow, M.R.; Willett, W.C.; Newcomer, L.M.; Upson, B.; Ullmann, D.; Tishler, P.V.; Hennekens, C.H. A prospective study of plasma homocyst(e)ine and risk of myocardial infarction in US physicians. JAMA 1992, 268, 877–881. [Google Scholar] [CrossRef] [PubMed]
- Welch, G.N.; Loscalzo, J. Homocysteine and atherothrombosis. N. Engl. J. Med. 1998, 338, 1042–1050. [Google Scholar] [CrossRef] [PubMed]
- Chao, C.L.; Kuo, T.L.; Lee, Y.T. Effects of methionine-induced hyperhomocysteinemia on endothelium-dependent vasodilation and oxidative status in healthy adults. Circulation 2000, 101, 485–490. [Google Scholar] [CrossRef] [PubMed]
- Starkebaum, G.; Harlan, J.M. Endothelial cell injury due to copper-catalyzed hydrogen peroxide generation from homocysteine. J. Clin. Investig. 1986, 77, 1370–1376. [Google Scholar] [CrossRef] [PubMed]
- Fassbender, K.; Mielke, O.; Bertsch, T.; Nafe, B.; Froschen, S.; Hennerici, M. Homocysteine in cerebral macroangiopathy and microangiopathy. Lancet 1999, 353, 1586–1587. [Google Scholar] [CrossRef]
- Ko, L.W.; Rush, T.; Sahara, N.; Kersh, J.S.; Easson, C.; Deture, M.; Lin, W.L.; Connor, Y.D.; Yen, S.H. Assembly of filamentous tau aggregates in human neuronal cells. J. Alzheimer’s Dis. 2004, 6, 605–622. [Google Scholar] [CrossRef]
- Hamano, T.; Gendron, T.F.; Causevic, E.; Yen, S.H.; Lin, W.L.; Isidoro, C.; Deture, M.; Ko, L.W. Autophagic-lysosomal perturbation enhances tau aggregation in transfectants with induced wild-type tau expression. Eur. J. Neurosci. 2008, 27, 1119–1130. [Google Scholar] [CrossRef] [PubMed]
- LoPresti, P.; Szuchet, S.; Papasozomenos, S.C.; Zinkowski, R.P.; Binder, L.I. Functional implications for the microtubule—Associated protein tau: Localization in oligodendrocytes. Proc. Natl. Acad. Sci. USA 1995, 92, 10369–10373. [Google Scholar] [CrossRef] [PubMed]
- Porzig, R.; Singer, D.; Hoffmann, R. Epitope mapping of mAbs AT8 and Tau5 directed against hyperphosphorylated regions of the human tau protein. Biochem. Biophys. Res. Commun. 2007, 29, 644–649. [Google Scholar] [CrossRef] [PubMed]
- Carmel, G.; Mager, E.M.; Binder, L.I.; Kuret, J. The structural basis of monoclonal antibody Alz50’s selectivity for Alzheimer’s disease pathology. J. Biol. Chem. 1996, 271, 32789–32795. [Google Scholar] [CrossRef] [PubMed]
- Ward, S.M.; Himmelstein, D.S.; Ren, Y.; Fu, Y.; Yu, X.W.; Roberts, K.; Binder, L.I.; Sahara, N. TOC1: A valuable tool in assessing disease progression in the rTg4510 mouse model of tauopathy. Neurobiol. Dis. 2014, 67, 37–48. [Google Scholar] [CrossRef] [PubMed]
- Hamano, T.; Gendron, T.F.; Ko, L.W.; Yen, S.H. Concentration-dependent effects of proteasomal inhibition on tau processing in a cellular model of tauopathy. Int. J. Clin. Exp. Pathol. 2009, 2, 561–573. [Google Scholar] [PubMed]
- Santacruz, K.; Lewis, J.; Spires, T.; Paulson, J.; Kotilinek, L.; Ingelsson, M.; Guimaraes, A.; DeTure, M.; Ramsden, M.; McGowan, E.; et al. Tau suppression in a Neurodegenerative mouse model improves memory function. Science 2005, 309, 476–481. [Google Scholar] [CrossRef] [PubMed]
- Zhuo, J.M.; Praticò, D. Acceleration of brain amyloidosis in an Alzheimer’s disease mouse model by a folate, vitamin B6 and B12-deficient diet. Exp. Gerontol. 2010, 45, 195–201. [Google Scholar] [CrossRef] [PubMed]
- Bunpo, P.; Dudley, A.; Cundiff, J.K.; Cavener, D.R.; Wek, R.C.; Anthony, T.G. GCN2 proteinkinase is required to activate amino acid deprivation responses in mice treatedwith the anti-cancer agent L-asparaginase. J. Biol. Chem. 2009, 284, 32742–32749. [Google Scholar] [CrossRef] [PubMed]
- Osna, N.A.; White, R.L.; Donohue, T.M., Jr.; Beard, M.R.; Tuma, D.J.; Kharbanda, K.K. Impaired methylation as a novel mechanism for proteasome suppression in liver cells. Biochem. Biophys. Res. Commun. 2010, 391, 1291–1296. [Google Scholar] [CrossRef] [PubMed]


© 2018 by the authors. Licensee MDPI, Basel, Switzerland. This article is an open access article distributed under the terms and conditions of the Creative Commons Attribution (CC BY) license (http://creativecommons.org/licenses/by/4.0/).
Share and Cite
Shirafuji, N.; Hamano, T.; Yen, S.-H.; Kanaan, N.M.; Yoshida, H.; Hayashi, K.; Ikawa, M.; Yamamura, O.; Kuriyama, M.; Nakamoto, Y. Homocysteine Increases Tau Phosphorylation, Truncation and Oligomerization. Int. J. Mol. Sci. 2018, 19, 891. https://0-doi-org.brum.beds.ac.uk/10.3390/ijms19030891
Shirafuji N, Hamano T, Yen S-H, Kanaan NM, Yoshida H, Hayashi K, Ikawa M, Yamamura O, Kuriyama M, Nakamoto Y. Homocysteine Increases Tau Phosphorylation, Truncation and Oligomerization. International Journal of Molecular Sciences. 2018; 19(3):891. https://0-doi-org.brum.beds.ac.uk/10.3390/ijms19030891
Chicago/Turabian StyleShirafuji, Norimichi, Tadanori Hamano, Shu-Hui Yen, Nicholas M. Kanaan, Hirotaka Yoshida, Kouji Hayashi, Masamichi Ikawa, Osamu Yamamura, Masaru Kuriyama, and Yasunari Nakamoto. 2018. "Homocysteine Increases Tau Phosphorylation, Truncation and Oligomerization" International Journal of Molecular Sciences 19, no. 3: 891. https://0-doi-org.brum.beds.ac.uk/10.3390/ijms19030891