Differential and Overlapping Effects of 20,23(OH)2D3 and 1,25(OH)2D3 on Gene Expression in Human Epidermal Keratinocytes: Identification of AhR as an Alternative Receptor for 20,23(OH)2D3

 , , , ,
Abstract
:1. Introduction
2. Results and Discussion
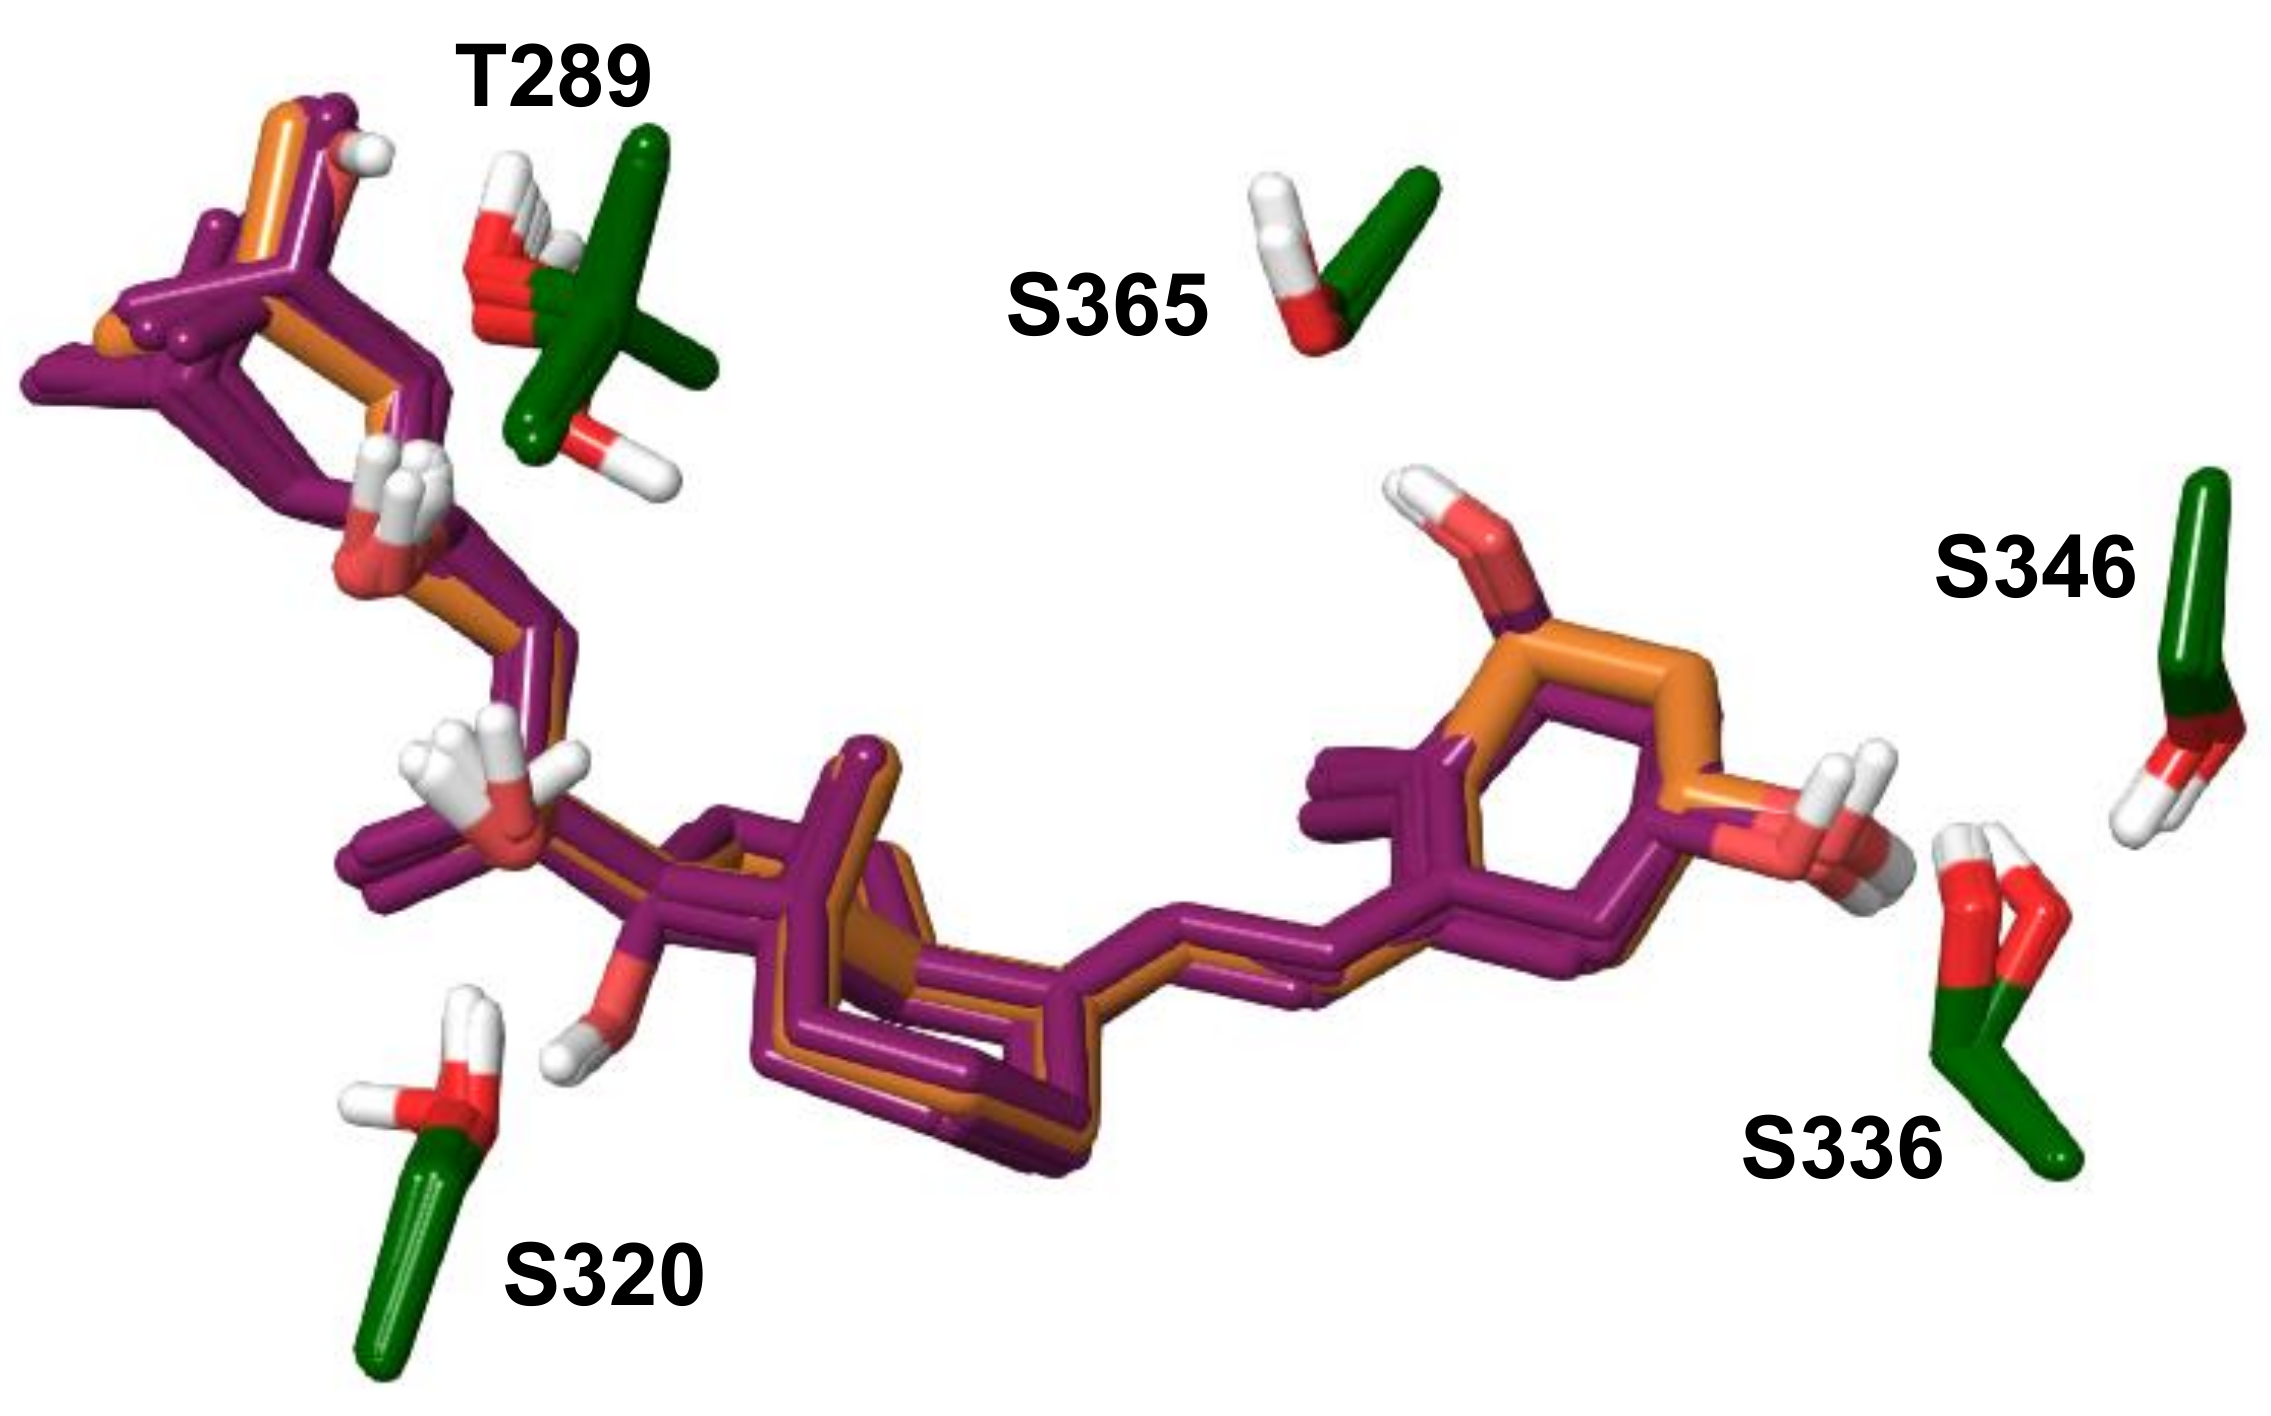
Modelling Conclusions
3. Materials and Methods
3.1. Materials
3.2. Cell Culture
3.3. Microarray Assays
3.4. Bioinformatics Analysis
3.5. Real-Time Reverse Transcription Polymerase Chain Reaction (qRT-PCR)
3.6. Interaction of Hydroxyvitamin D Derivatives with AhR
3.7. Statistical Analyses
3.8. Data Deposition
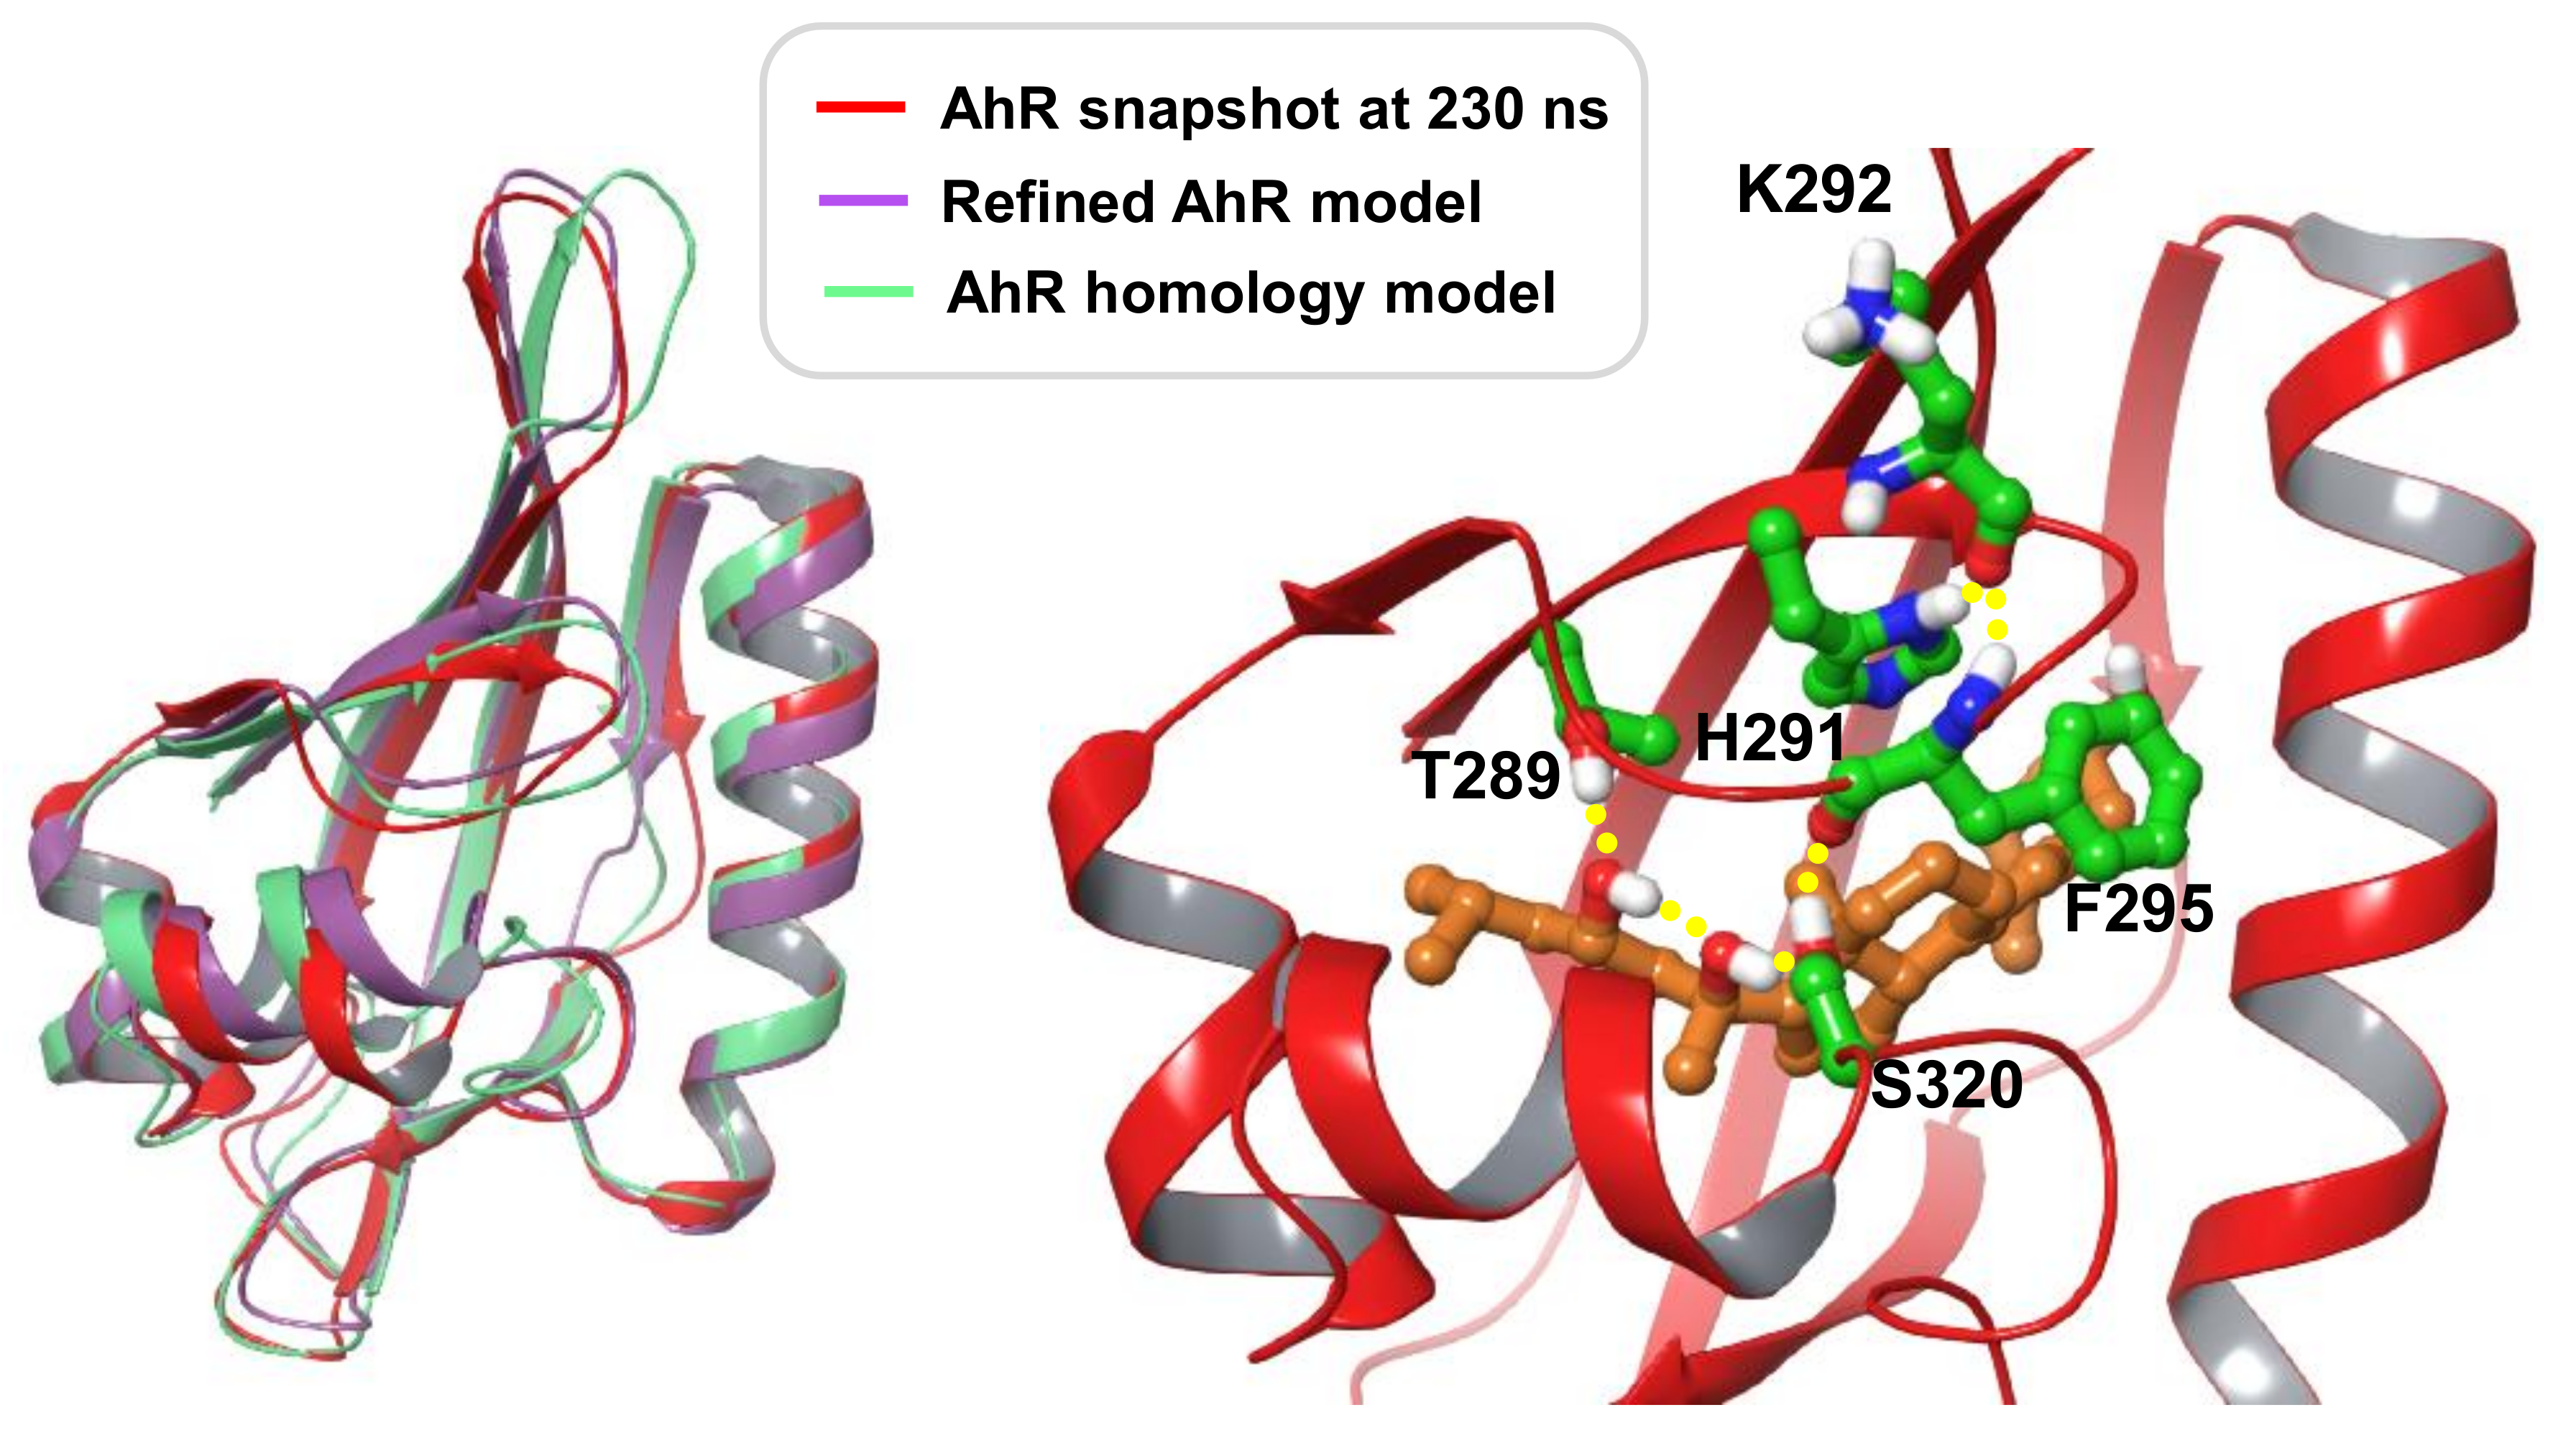
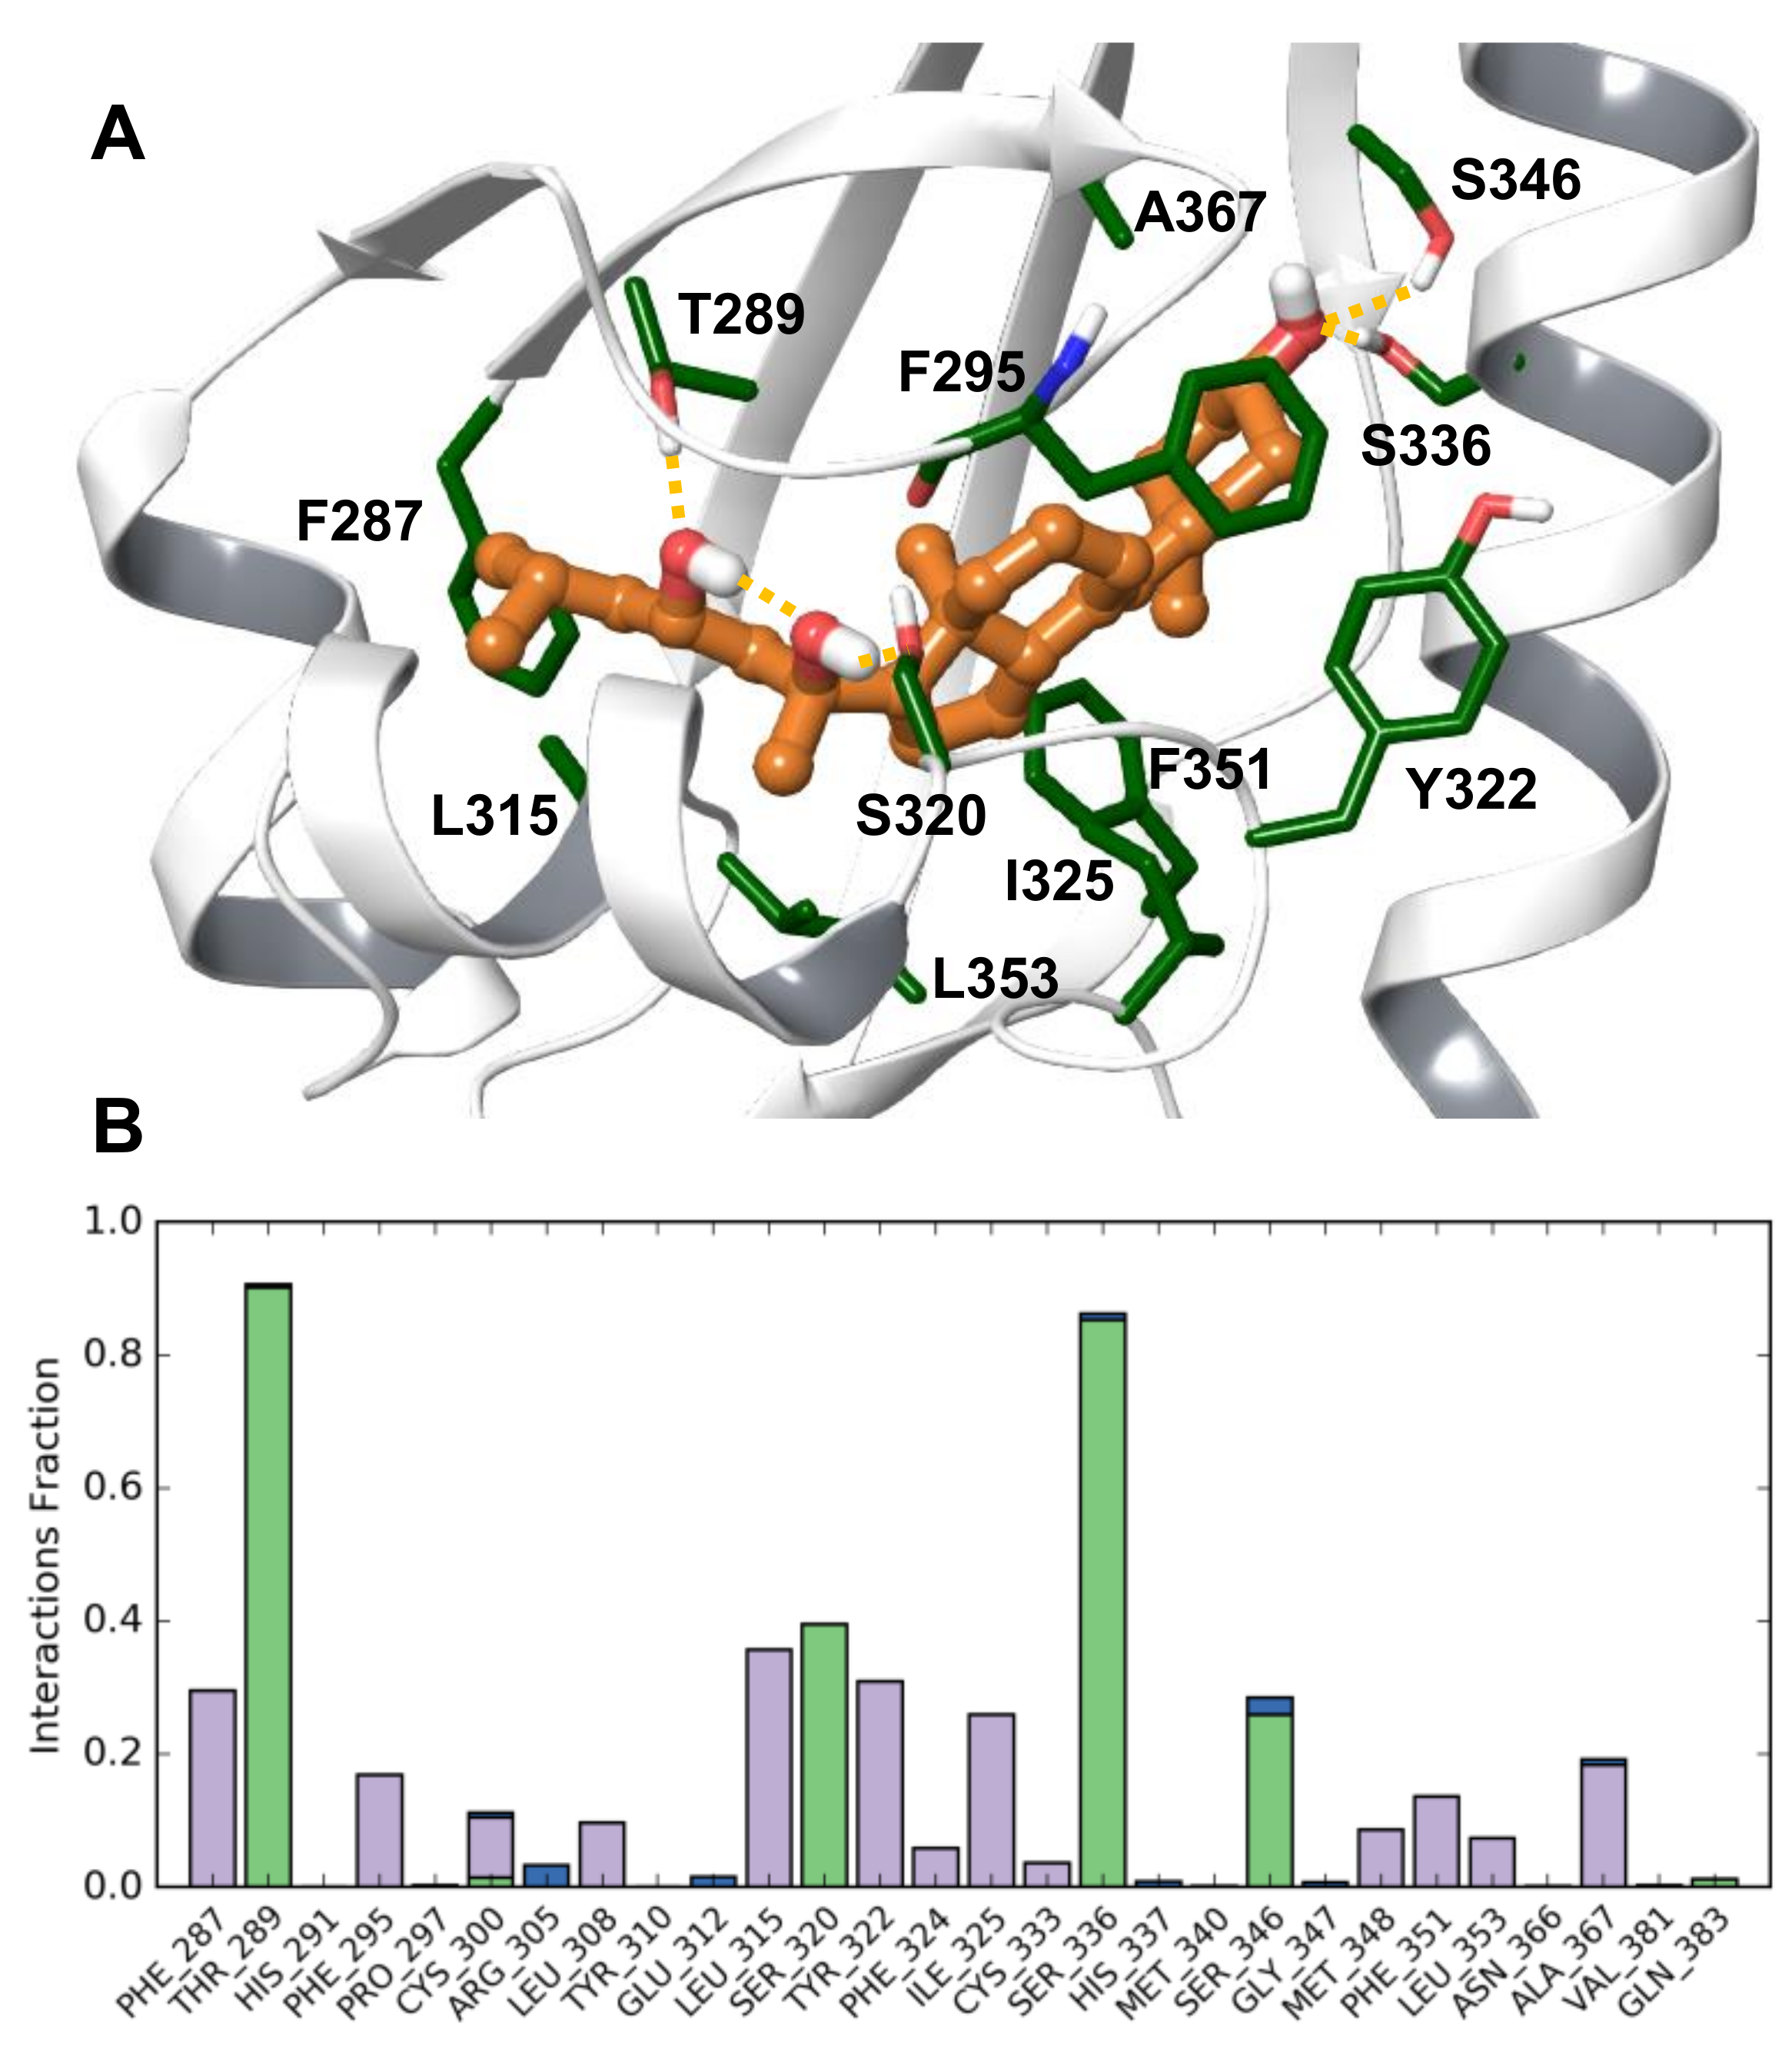
3.9. Development of a Human AhR LBD Model Complexed with 20S,23S(OH)2D3
3.10. Docking Method
3.11. Molecular Dynamic Simulation Method
4. Conclusions
Supplementary Materials
Author Contributions
Funding
Acknowledgments
Conflicts of Interest
Abbreviations
| 1,20(OH)2D3 | 1,20-dihyhydroxyvitamin D3 |
| 17,20,23(OH)2D3 | 17,20,23-trihyhydroxyvitamin D3 |
| 1α,25(OH)2D3 | 1α,25-dihydroxyvitamin D3 |
| 20(OH)D3 | 20-hydroxyvitamin D3 |
| 20,23(OH)2D3 | 20,23-dihyhydroxyvitamin D3 |
| 25(OH)D3 | 25-hydroxyvitamin D3 |
| 7-DHC | 7-dehydrocholesterol |
| AA | African-American |
| AhR | aryl hydrocarbon receptor |
| GR | glucocorticoid receptor |
| LBD | ligand binding domain |
| LXR | liver X receptor |
| PPAR | peroxisome proliferator-activated receptor |
| RAR | retinoic acid receptor |
| RXR | retinoid X receptor |
| VDR | vitamin D receptor |
| UVB | ultraviolet B radiation |
References
- Holick, M.F. Vitamin D: A millenium perspective. J. Cell. Biochem. 2003, 88, 296–307. [Google Scholar] [CrossRef] [PubMed]
- Wacker, M.; Holick, M.F. Sunlight and vitamin D: A global perspective for health. Dermato-Endocrinology 2013, 5, 51–108. [Google Scholar] [CrossRef] [PubMed]
- Holick, M.F. Vitamin D deficiency. N. Engl. J. Med. 2007, 357, 266–281. [Google Scholar] [CrossRef] [PubMed]
- Zhu, J.; DeLuca, H.F. Vitamin d 25-hydroxylase—Four decades of searching, are we there yet? Arch. Biochem. Biophys. 2012, 523, 30–36. [Google Scholar] [CrossRef] [PubMed]
- Jones, G.; Prosser, D.E.; Kaufmann, M. Cytochrome P450-mediated metabolism of vitamin D. J. Lipid Res. 2014, 55, 13–31. [Google Scholar] [CrossRef] [PubMed]
- Christakos, S.; Dhawan, P.; Verstuyf, A.; Verlinden, L.; Carmeliet, G. Vitamin D: Metabolism, molecular mechanism of action, and pleiotropic effects. Physiol. Rev. 2016, 96, 365–408. [Google Scholar] [CrossRef] [PubMed]
- Adams, J.S.; Hewison, M. Extrarenal expression of the 25-hydroxyvitamin D-1-hydroxylase. Arch. Biochem. Biophys. 2012, 523, 95–102. [Google Scholar] [CrossRef] [PubMed] [Green Version]
- Slominski, A.T.; Li, W.; Kim, T.K.; Semak, I.; Wang, J.; Zjawiony, J.K.; Tuckey, R.C. Novel activities of CYP11A1 and their potential physiological significance. J. Steroid Biochem. Mol. Biol. 2015, 151, 25–37. [Google Scholar] [CrossRef] [PubMed] [Green Version]
- Tuckey, R.C. Progesterone synthesis by the human placenta. Placenta 2005, 26, 273–281. [Google Scholar] [CrossRef] [PubMed]
- Miller, W.L.; Auchus, R.J. The molecular biology, biochemistry, and physiology of human steroidogenesis and its disorders. Endocr. Rev. 2011, 32, 81–151. [Google Scholar] [CrossRef] [PubMed]
- Guryev, O.; Carvalho, R.A.; Usanov, S.; Gilep, A.; Estabrook, R.W. A pathway for the metabolism of vitamin D3: Unique hydroxylated metabolites formed during catalysis with cytochrome P450scc (CYP11A1). Proc. Natl. Acad. Sci. USA 2003, 100, 14754–14759. [Google Scholar] [CrossRef] [PubMed] [Green Version]
- Slominski, A.; Zjawiony, J.; Wortsman, J.; Semak, I.; Stewart, J.; Pisarchik, A.; Sweatman, T.; Marcos, J.; Dunbar, C.; R, C.T. A novel pathway for sequential transformation of 7-dehydrocholesterol and expression of the P450scc system in mammalian skin. Eur. J. Biochem. 2004, 271, 4178–4188. [Google Scholar] [CrossRef] [PubMed] [Green Version]
- Slominski, A.; Semak, I.; Zjawiony, J.; Wortsman, J.; Li, W.; Szczesniewski, A.; Tuckey, R.C. The cytochrome P450scc system opens an alternate pathway of vitamin D3 metabolism. FEBS J. 2005, 272, 4080–4090. [Google Scholar] [CrossRef] [PubMed] [Green Version]
- Tuckey, R.C.; Li, W.; Zjawiony, J.K.; Zmijewski, M.A.; Nguyen, M.N.; Sweatman, T.; Miller, D.; Slominski, A. Pathways and products for the metabolism of vitamin D3 by cytochrome P450scc. FEBS J. 2008, 275, 2585–2596. [Google Scholar] [CrossRef] [PubMed] [Green Version]
- Slominski, A.; Semak, I.; Wortsman, J.; Zjawiony, J.; Li, W.; Zbytek, B.; Tuckey, R.C. An alternative pathway of vitamin D metabolism. Cytochrome P450scc (CYP11A1)-mediated conversion to 20-hydroxyvitamin D2 and 17,20-dihydroxyvitamin D2. FEBS J. 2006, 273, 2891–2901. [Google Scholar] [CrossRef] [PubMed]
- Nguyen, M.N.; Slominski, A.; Li, W.; Ng, Y.R.; Tuckey, R.C. Metabolism of vitamin D2 to 17,20,24-trihydroxyvitamin D2 by cytochrome P450scc (CYP11A1). Drug Metab. Dispos. 2009, 37, 761–767. [Google Scholar] [CrossRef] [PubMed]
- Lin, Z.; Marepally, S.R.; Ma, D.; Myers, L.K.; Postlethwaite, A.E.; Tuckey, R.C.; Cheng, C.Y.; Kim, T.K.; Yue, J.; Slominski, A.T.; et al. Chemical synthesis and biological activities of 20s,24s/r-dihydroxyvitamin D3 epimers and their 1alpha-hydroxyl derivatives. J. Med. Chem. 2015, 58, 7881–7887. [Google Scholar] [CrossRef] [PubMed]
- Slominski, A.T.; Kim, T.K.; Shehabi, H.Z.; Semak, I.; Tang, E.K.; Nguyen, M.N.; Benson, H.A.; Korik, E.; Janjetovic, Z.; Chen, J.; et al. In vivo evidence for a novel pathway of vitamin D(3) metabolism initiated by P450scc and modified by CYP27B1. FASEB J. 2012, 26, 3901–3915. [Google Scholar] [CrossRef] [PubMed]
- Slominski, A.T.; Kim, T.K.; Shehabi, H.Z.; Tang, E.K.; Benson, H.A.; Semak, I.; Lin, Z.; Yates, C.R.; Wang, J.; Li, W.; et al. In vivo production of novel vitamin D2 hydroxy-derivatives by human placentas, epidermal keratinocytes, Caco-2 colon cells and the adrenal gland. Mol. Cell. Endocrinol. 2014, 383, 181–192. [Google Scholar] [CrossRef] [PubMed] [Green Version]
- Slominski, A.T.; Kim, T.K.; Li, W.; Tuckey, R.C. Classical and non-classical metabolic transformation of vitamin D in dermal fibroblasts. Exp. Dermatol. 2016, 25, 231–232. [Google Scholar] [CrossRef] [PubMed] [Green Version]
- Slominski, A.T.; Zmijewski, M.A.; Semak, I.; Sweatman, T.; Janjetovic, Z.; Li, W.; Zjawiony, J.K.; Tuckey, R.C. Sequential metabolism of 7-dehydrocholesterol to steroidal 5,7-dienes in adrenal glands and its biological implication in the skin. PLoS ONE 2009, 4, e4309. [Google Scholar] [CrossRef] [PubMed]
- Slominski, A.T.; Kim, T.K.; Chen, J.; Nguyen, M.N.; Li, W.; Yates, C.R.; Sweatman, T.; Janjetovic, Z.; Tuckey, R.C. Cytochrome P450scc-dependent metabolism of 7-dehydrocholesterol in placenta and epidermal keratinocytes. Int. J. Biochem. Cell Biol. 2012, 44, 2003–2018. [Google Scholar] [CrossRef] [PubMed] [Green Version]
- Slominski, A.T.; Janjetovic, Z.; Kim, T.K.; Wasilewski, P.; Rosas, S.; Hanna, S.; Sayre, R.M.; Dowdy, J.C.; Li, W.; Tuckey, R.C. Novel non-calcemic secosteroids that are produced by human epidermal keratinocytes protect against solar radiation. J. Steroid Biochem. Mol. Biol. 2015, 148, 52–63. [Google Scholar] [CrossRef] [PubMed] [Green Version]
- Slominski, A.T.; Kim, T.K.; Li, W.; Postlethwaite, A.; Tieu, E.W.; Tang, E.K.; Tuckey, R.C. Detection of novel CYP11A1-derived secosteroids in the human epidermis and serum and pig adrenal gland. Sci. Rep. 2015, 5, 14875. [Google Scholar] [CrossRef] [PubMed] [Green Version]
- DeLuca, H.F. Overview of general physiologic features and functions of vitamin D. Am. J. Clin. Nutr. 2004, 80, 1689S–1696S. [Google Scholar] [CrossRef] [PubMed]
- Holick, M.F. Vitamin D and bone health. J. Nutr. 1996, 126, 1159S–1164S. [Google Scholar] [CrossRef] [PubMed]
- Bikle, D.D. Vitamin D: An ancient hormone. Exp. Dermatol. 2011, 20, 7–13. [Google Scholar] [CrossRef] [PubMed]
- Pike, J.W.; Christakos, S. Biology and mechanisms of action of the vitamin D hormone. Endocrinol. Metab. Clin. N. Am. 2017, 46, 815–843. [Google Scholar] [CrossRef] [PubMed]
- Van Driel, M.; van Leeuwen, J. Vitamin D endocrinology of bone mineralization. Mol. Cell. Endocrinol. 2017, 453, 46–51. [Google Scholar] [CrossRef] [PubMed]
- Hewison, M. An update on vitamin D and human immunity. Clin. Endocrinol. 2012, 76, 315–325. [Google Scholar] [CrossRef] [PubMed] [Green Version]
- Vanherwegen, A.S.; Gysemans, C.; Mathieu, C. Regulation of immune function by vitamin d and its use in diseases of immunity. Endocrinol. Metab. Clin. N. Am. 2017, 46, 1061–1094. [Google Scholar] [CrossRef] [PubMed]
- Berridge, M.J. Vitamin D deficiency: Infertility and neurodevelopmental diseases (attention deficit hyperactivity disorder, autism, and schizophrenia). Am. J. Physiol. Cell Physiol. 2018, 314, C135–C151. [Google Scholar] [CrossRef] [PubMed]
- Liu, N.Q.; Hewison, M. Vitamin d, the placenta and pregnancy. Arch. Biochem. Biophys. 2012, 523, 37–47. [Google Scholar] [CrossRef] [PubMed]
- Ganguly, A.; Tamblyn, J.A.; Finn-Sell, S.; Chan, S.Y.; Westwood, M.; Gupta, J.; Kilby, M.D.; Gross, S.R.; Hewison, M. Vitamin D, the placenta and early pregnancy: Effects on trophoblast function. J. Endocrinol. 2018, 236, R93–R103. [Google Scholar] [CrossRef] [PubMed]
- Shin, J.S.; Choi, M.Y.; Longtine, M.S.; Nelson, D.M. Vitamin d effects on pregnancy and the placenta. Placenta 2010, 31, 1027–1034. [Google Scholar] [CrossRef] [PubMed]
- Knabl, J.; Vattai, A.; Ye, Y.; Jueckstock, J.; Hutter, S.; Kainer, F.; Mahner, S.; Jeschke, U. Role of placental VDR expression and function in common late pregnancy disorders. Int. J. Mol. Sci. 2017, 18, 2340. [Google Scholar] [CrossRef] [PubMed]
- Lorenzen, M.; Boisen, I.M.; Mortensen, L.J.; Lanske, B.; Juul, A.; Blomberg Jensen, M. Reproductive endocrinology of vitamin D. Mol. Cell. Endocrinol. 2017, 453, 103–112. [Google Scholar] [CrossRef] [PubMed]
- Cui, X.; Gooch, H.; Petty, A.; McGrath, J.J.; Eyles, D. Vitamin D and the brain: Genomic and non-genomic actions. Mol. Cell. Endocrinol. 2017, 453, 131–143. [Google Scholar] [CrossRef] [PubMed]
- Di Somma, C.; Scarano, E.; Barrea, L.; Zhukouskaya, V.V.; Savastano, S.; Mele, C.; Scacchi, M.; Aimaretti, G.; Colao, A.; Marzullo, P. Vitamin D and neurological diseases: An endocrine view. Int. J. Mol. Sci. 2017, 18, 2482. [Google Scholar] [CrossRef] [PubMed]
- Welsh, J. Function of the vitamin D endocrine system in mammary gland and breast cancer. Mol. Cell. Endocrinol. 2017, 453, 88–95. [Google Scholar] [CrossRef] [PubMed]
- Angellotti, E.; Pittas, A.G. The role of vitamin d in the prevention of type 2 diabetes: To D or not to D? Endocrinology 2017, 158, 2013–2021. [Google Scholar] [CrossRef] [PubMed]
- Dimova, R.; Tankova, T.; Chakarova, N. Vitamin d in the spectrum of prediabetes and cardiovascular autonomic dysfunction. J. Nutr. 2017, 147, 1607–1615. [Google Scholar] [CrossRef] [PubMed]
- Berridge, M.J. Vitamin D deficiency and diabetes. Biochem. J. 2017, 474, 1321–1332. [Google Scholar] [CrossRef] [PubMed]
- Kassi, E.; Nasiri-Ansari, N.; Papavassiliou, A.G. Vitamin d affects glucocorticoid action in target cells. Oncotarget 2017, 8, 7220–7221. [Google Scholar] [CrossRef] [PubMed]
- Plum, L.A.; DeLuca, H.F. Vitamin D, disease and therapeutic opportunities. Nat. Rev. Drug Discov. 2010, 9, 941–955. [Google Scholar] [CrossRef] [PubMed]
- Feldman, D.; Krishnan, A.V.; Swami, S.; Giovannucci, E.; Feldman, B.J. The role of vitamin d in reducing cancer risk and progression. Nat. Rev. Cancer 2014, 14, 342–357. [Google Scholar] [CrossRef] [PubMed]
- Fleet, J.C.; DeSmet, M.; Johnson, R.; Li, Y. Vitamin d and cancer: A review of molecular mechanisms. Biochem. J. 2012, 441, 61–76. [Google Scholar] [CrossRef] [PubMed]
- Masuda, S.; Jones, G. Promise of vitamin d analogues in the treatment of hyperproliferative conditions. Mol. Cancer Ther. 2006, 5, 797–808. [Google Scholar] [CrossRef] [PubMed]
- Slominski, A.T.; Brozyna, A.A.; Skobowiat, C.; Zmijewski, M.A.; Kim, T.K.; Janjetovic, Z.; Oak, A.S.; Jozwicki, W.; Jetten, A.M.; Mason, R.S.; et al. On the role of classical and novel forms of vitamin d in melanoma progression and management. J. Steroid Biochem. Mol. Biol. 2018, 177, 159–170. [Google Scholar] [CrossRef] [PubMed]
- Slominski, A.T.; Brozyna, A.A.; Zmijewski, M.A.; Jozwicki, W.; Jetten, A.M.; Mason, R.S.; Tuckey, R.C.; Elmets, C.A. Vitamin D signaling and melanoma: Role of vitamin d and its receptors in melanoma progression and management. Lab. Investig. 2017, 97, 706–724. [Google Scholar] [CrossRef] [PubMed]
- Norman, A.W. Minireview: Vitamin d receptor: New assignments for an already busy receptor. Endocrinology 2006, 147, 5542–5548. [Google Scholar] [CrossRef] [PubMed]
- Mason, R.S.; Reichrath, J. Sunlight vitamin d and skin cancer. Anticancer Agents Med. Chem. 2013, 13, 83–97. [Google Scholar] [CrossRef] [PubMed]
- Bikle, D.D.; Elalieh, H.; Welsh, J.; Oh, D.; Cleaver, J.; Teichert, A. Protective role of vitamin D signaling in skin cancer formation. J. Steroid Biochem. Mol. Biol. 2013, 136, 271–279. [Google Scholar] [CrossRef] [PubMed] [Green Version]
- Neme, A.; Seuter, S.; Carlberg, C. Selective regulation of biological processes by vitamin d based on the spatio-temporal cistrome of its receptor. Biochim. Biophys. Acta 2017, 1860, 952–961. [Google Scholar] [CrossRef] [PubMed]
- Bikle, D.D. Vitamin D receptor, UVR, and skin cancer: A potential protective mechanism. J. Investig. Dermatol. 2008, 128, 2357–2361. [Google Scholar] [CrossRef] [PubMed]
- Elias, P.M. Structure and function of the stratum corneum extracellular matrix. J. Investig. Dermatol. 2012, 132, 2131–2133. [Google Scholar] [CrossRef] [PubMed]
- Dixon, K.M.; Norman, A.W.; Sequeira, V.B.; Mohan, R.; Rybchyn, M.S.; Reeve, V.E.; Halliday, G.M.; Mason, R.S. 1alpha,25(OH)(2)-vitamin D and a nongenomic vitamin d analogue inhibit ultraviolet radiation-induced skin carcinogenesis. Cancer Prev. Res. (Phila) 2011, 4, 1485–1494. [Google Scholar] [CrossRef] [PubMed]
- Makarova, A.; Wang, G.; Dolorito, J.A.; Kc, S.; Libove, E.; Epstein, E.H., Jr. Vitamin D3 produced by skin exposure to UVR inhibits murine basal cell carcinoma carcinogenesis. J. Investig. Dermatol. 2017, 137, 2613–2619. [Google Scholar] [CrossRef] [PubMed]
- Slominski, A.T.; Zmijewski, M.A.; Semak, I.; Zbytek, B.; Pisarchik, A.; Li, W.; Zjawiony, J.; Tuckey, R.C. Cytochromes P450 and skin cancer: Role of local endocrine pathways. Anticancer Agents Med. Chem. 2014, 14, 77–96. [Google Scholar] [CrossRef] [PubMed]
- Slominski, A.T.; Kim, T.K.; Hobrath, J.V.; Oak, A.S.W.; Tang, E.K.Y.; Tieu, E.W.; Li, W.; Tuckey, R.C.; Jetten, A.M. Endogenously produced nonclassical vitamin D hydroxy-metabolites act as “Biased” Agonists on VDR and inverse agonists on RORalpha and RORgamma. J. Steroid Biochem. Mol. Biol. 2017, 173, 42–56. [Google Scholar] [CrossRef] [PubMed]
- Wang, J.; Slominski, A.; Tuckey, R.C.; Janjetovic, Z.; Kulkarni, A.; Chen, J.; Postlethwaite, A.E.; Miller, D.; Li, W. 20-Hydroxyvitamin D(3) inhibits proliferation of cancer cells with high efficacy while being non-toxic. Anticancer Res. 2012, 32, 739–746. [Google Scholar] [PubMed]
- Slominski, A.T.; Janjetovic, Z.; Fuller, B.E.; Zmijewski, M.A.; Tuckey, R.C.; Nguyen, M.N.; Sweatman, T.; Li, W.; Zjawiony, J.; Miller, D.; et al. Products of vitamin D3 or 7-dehydrocholesterol metabolism by cytochrome P450scc show anti-leukemia effects, having low or absent calcemic activity. PLoS ONE 2010, 5, e9907. [Google Scholar] [CrossRef] [PubMed]
- Chen, J.; Wang, J.; Kim, T.K.; Tieu, E.W.; Tang, E.K.; Lin, Z.; Kovacic, D.; Miller, D.D.; Postlethwaite, A.; Tuckey, R.C.; et al. Novel vitamin d analogs as potential therapeutics: Metabolism, toxicity profiling, and antiproliferative activity. Anticancer Res. 2014, 34, 2153–2163. [Google Scholar] [PubMed]
- Tongkao-On, W.; Carter, S.; Reeve, V.E.; Dixon, K.M.; Gordon-Thomson, C.; Halliday, G.M.; Tuckey, R.C.; Mason, R.S. Cyp11a1 in skin: An alternative route to photoprotection by vitamin D compounds. J. Steroid Biochem. Mol. Biol. 2015, 148, 72–78. [Google Scholar] [CrossRef] [PubMed]
- Slominski, A.; Janjetovic, Z.; Tuckey, R.C.; Nguyen, M.N.; Bhattacharya, K.G.; Wang, J.; Li, W.; Jiao, Y.; Gu, W.; Brown, M.; et al. 20s-hydroxyvitamin D3, noncalcemic product of CYP11A1 action on vitamin D3, exhibits potent antifibrogenic activity in vivo. J. Clin. Endocrinol. Metab. 2013, 98, E298–E303. [Google Scholar] [CrossRef] [PubMed]
- Tuckey, R.C.; Li, W.; Shehabi, H.Z.; Janjetovic, Z.; Nguyen, M.N.; Kim, T.K.; Chen, J.; Howell, D.E.; Benson, H.A.; Sweatman, T.; et al. Production of 22-hydroxy metabolites of vitamin D3 by cytochrome P450scc (CYP11A1) and analysis of their biological activities on skin cells. Drug Metab. Dispos. 2011, 39, 1577–1588. [Google Scholar] [CrossRef] [PubMed]
- Zbytek, B.; Janjetovic, Z.; Tuckey, R.C.; Zmijewski, M.A.; Sweatman, T.W.; Jones, E.; Nguyen, M.N.; Slominski, A.T. 20-Hydroxyvitamin D3, a product of vitamin D3 hydroxylation by cytochrome P450scc, stimulates keratinocyte differentiation. J. Investig. Dermatol. 2008, 128, 2271–2280. [Google Scholar] [CrossRef] [PubMed]
- Janjetovic, Z.; Zmijewski, M.A.; Tuckey, R.C.; DeLeon, D.A.; Nguyen, M.N.; Pfeffer, L.M.; Slominski, A.T. 20-Hydroxycholecalciferol, product of vitamin D3 hydroxylation by P450scc, decreases NF-kappaB activity by increasing IkappaB alpha levels in human keratinocytes. PLoS ONE 2009, 4, e5988. [Google Scholar] [CrossRef] [PubMed]
- Janjetovic, Z.; Tuckey, R.C.; Nguyen, M.N.; Thorpe, E.M., Jr.; Slominski, A.T. 20,23-dihydroxyvitamin D3, novel P450scc product, stimulates differentiation and inhibits proliferation and NF-kappaB activity in human keratinocytes. J. Cell. Physiol. 2010, 223, 36–48. [Google Scholar] [PubMed]
- Wasiewicz, T.; Szyszka, P.; Cichorek, M.; Janjetovic, Z.; Tuckey, R.C.; Slominski, A.T.; Zmijewski, M.A. Antitumor effects of vitamin D analogs on hamster and mouse melanoma cell lines in relation to melanin pigmentation. Int. J. Mol. Sci. 2015, 16, 6645–6667. [Google Scholar] [CrossRef] [PubMed]
- Wierzbicka, J.M.; Zmijewski, M.A.; Piotrowska, A.; Nedoszytko, B.; Lange, M.; Tuckey, R.C.; Slominski, A.T. Bioactive forms of vitamin d selectively stimulate the skin analog of the hypothalamus-pituitary-adrenal axis in human epidermal keratinocytes. Mol. Cell. Endocrinol. 2016, 437, 312–322. [Google Scholar] [CrossRef] [PubMed]
- Skobowiat, C.; Oak, A.S.; Kim, T.K.; Yang, C.H.; Pfeffer, L.M.; Tuckey, R.C.; Slominski, A.T. Noncalcemic 20-hydroxyvitamin D3 inhibits human melanoma growth in in vitro and in vivo models. Oncotarget 2017, 8, 9823–9834. [Google Scholar] [CrossRef] [PubMed]
- Janjetovic, Z.; Brozyna, A.A.; Tuckey, R.C.; Kim, T.K.; Nguyen, M.N.; Jozwicki, W.; Pfeffer, S.R.; Pfeffer, L.M.; Slominski, A.T. High basal NF-kappaB activity in nonpigmented melanoma cells is associated with an enhanced sensitivity to vitamin D3 derivatives. Br. J. Cancer 2011, 105, 1874–1884. [Google Scholar] [CrossRef] [PubMed]
- Wierzbicka, J.M.; Binek, A.; Ahrends, T.; Nowacka, J.D.; Szydlowska, A.; Turczyk, L.; Wasiewicz, T.; Wierzbicki, P.M.; Sadej, R.; Tuckey, R.C.; et al. Differential antitumor effects of vitamin d analogues on colorectal carcinoma in culture. Int. J. Oncol. 2015, 47, 1084–1096. [Google Scholar] [CrossRef] [PubMed]
- Piotrowska, A.; Wierzbicka, J.; Slebioda, T.; Wozniak, M.; Tuckey, R.C.; Slominski, A.T.; Zmijewski, M.A. Vitamin D derivatives enhance cytotoxic effects of H2O2 or cisplatin on human keratinocytes. Steroids 2016, 110, 49–61. [Google Scholar] [CrossRef] [PubMed]
- Lin, Z.; Marepally, S.R.; Goh, E.S.Y.; Cheng, C.Y.S.; Janjetovic, Z.; Kim, T.K.; Miller, D.D.; Postlethwaite, A.E.; Slominski, A.T.; Tuckey, R.C.; et al. Investigation of 20s-hydroxyvitamin D3 analogs and their 1alpha-OH derivatives as potent vitamin d receptor agonists with anti-inflammatory activities. Sci. Rep. 2018, 8, 1478. [Google Scholar] [CrossRef] [PubMed]
- Lin, Z.; Chen, H.; Belorusova, A.Y.; Bollinger, J.C.; Tang, E.K.Y.; Janjetovic, Z.; Kim, T.K.; Wu, Z.; Miller, D.D.; Slominski, A.T.; et al. 1alpha,20S-dihydroxyvitamin D3 interacts with vitamin D receptor: Crystal structure and route of chemical synthesis. Sci. Rep. 2017, 7, 10193. [Google Scholar] [CrossRef] [PubMed]
- Slominski, A.T.; Kim, T.K.; Takeda, Y.; Janjetovic, Z.; Brozyna, A.A.; Skobowiat, C.; Wang, J.; Postlethwaite, A.; Li, W.; Tuckey, R.C.; et al. RORalpha and ROR gamma are expressed in human skin and serve as receptors for endogenously produced noncalcemic 20-hydroxy- and 20,23-dihydroxyvitamin D. FASEB J. 2014, 28, 2775–2789. [Google Scholar] [CrossRef] [PubMed]
- Le Poole, I.C.; van den Berg, F.M.; van den Wijngaard, R.M.; Galloway, D.A.; van Amstel, P.J.; Buffing, A.A.; Smits, H.L.; Westerhof, W.; Das, P.K. Generation of a human melanocyte cell line by introduction of HPV16 E6 and E7 genes. In Vitro Cell. Dev. Biol. Anim. 1997, 33, 42–49. [Google Scholar] [CrossRef] [PubMed]
- Slominski, A.T.; Kim, T.K.; Li, W.; Yi, A.K.; Postlethwaite, A.; Tuckey, R.C. The role of CYP11A1 in the production of vitamin D metabolites and their role in the regulation of epidermal functions. J. Steroid Biochem. Mol. Biol. 2014, 144PA, 28–39. [Google Scholar] [CrossRef] [PubMed]
- Bikle, D.D.; Oda, Y.; Tu, C.L.; Jiang, Y. Novel mechanisms for the vitamin d receptor (VDR) in the skin and in skin cancer. J. Steroid Biochem. Mol. Biol. 2015, 148, 47–51. [Google Scholar] [CrossRef] [PubMed]
- Carlberg, C. What do we learn from the genome-wide perspective on vitamin D3? Anticancer Res. 2015, 35, 1143–1151. [Google Scholar] [PubMed]
- Kim, T.K.; Wang, J.; Janjetovic, Z.; Chen, J.; Tuckey, R.C.; Nguyen, M.N.; Tang, E.K.; Miller, D.; Li, W.; Slominski, A.T. Correlation between secosteroid-induced vitamin D receptor activity in melanoma cells and computer-modeled receptor binding strength. Mol. Cell. Endocrinol. 2012, 361, 143–152. [Google Scholar] [CrossRef] [PubMed] [Green Version]
- Slominski, A.T.; Janjetovic, Z.; Kim, T.K.; Wright, A.C.; Grese, L.N.; Riney, S.J.; Nguyen, M.N.; Tuckey, R.C. Novel vitamin D hydroxyderivatives inhibit melanoma growth and show differential effects on normal melanocytes. Anticancer Res. 2012, 32, 3733–3742. [Google Scholar] [PubMed]
- Soshilov, A.A.; Denison, M.S. Ligand promiscuity of aryl hydrocarbon receptor agonists and antagonists revealed by site-directed mutagenesis. Mol. Cell. Biol. 2014, 34, 1707–1719. [Google Scholar] [CrossRef] [PubMed]
- Soshilov, A.; Denison, M.S. Ligand displaces heat shock protein 90 from overlapping binding sites within the aryl hydrocarbon receptor ligand-binding domain. J. Biol. Chem. 2011, 286, 35275–35282. [Google Scholar] [CrossRef] [PubMed]
- Tuckey, R.C.; Janjetovic, Z.; Li, W.; Nguyen, M.N.; Zmijewski, M.A.; Zjawiony, J.; Slominski, A. Metabolism of 1alpha-hydroxyvitamin D3 by cytochrome P450scc to biologically active 1alpha,20-dihydroxyvitamin D3. J. Steroid Biochem. Mol. Biol. 2008, 112, 213–219. [Google Scholar] [CrossRef] [PubMed]
- Hiwatashi, A.; Nishii, Y.; Ichikawa, Y. Purification of cytochrome P-450d1 alpha (25-hydroxyvitamin D3-1 alpha-hydroxylase) of bovine kidney mitochondria. Biochem. Biophys. Res. Commun. 1982, 105, 320–327. [Google Scholar] [CrossRef]
- Janjetovic, Z.; Nahmias, Z.P.; Hanna, S.; Jarrett, S.G.; Kim, T.K.; Reiter, R.J.; Slominski, A.T. Melatonin and its metabolites ameliorate ultraviolet b-induced damage in human epidermal keratinocytes. J. Pineal Res. 2014, 57, 90–102. [Google Scholar] [CrossRef] [PubMed]


| Time | Genes | 1,25(OH)2D3 | 20,23(OH)2D3 | ||||
|---|---|---|---|---|---|---|---|
| >1.5-Fold | >2-Fold | >4-Fold | >1.5-Fold | >2-Fold | >4-Fold | ||
| 6 h | Upregulated | 116 | 35 | 3 | 33 | 21 | 0 |
| Downregulated | 32 | 3 | 0 | 4 | 0 | 0 | |
| 24 h | Upregulated | 266 | 98 | 12 | 2013 | 763 | 98 |
| Downregulated | 144 | 21 | 0 | 2066 | 848 | 101 | |
| Ingenuity Canonical Pathways | p-Value | Overlap (%) | Downregulated | No Change | Upregulated | No Overlap with Dataset |
|---|---|---|---|---|---|---|
| VDR/RXR Activation | 1.0 ×10⁻¹⁰ | 12.8 | 34/78 (44%) | 0/78 (0%) | 43/78 (55%) | 1/78 (1%) |
| Role of Osteoblasts, Osteoclasts and Chondrocytes in Rheumatoid Arthritis | 2.2 × 10⁻⁷ | 5.02 | 100/219 (46%) | 0/219 (0%) | 114/219 (52%) | 5/219 (2%) |
| Role of Macrophages, Fibroblasts and Endothelial Cells in Rheumatoid Arthritis | 4.4 × 10⁻⁶ | 3.72 | 144/296 (49%) | 0/296 (0%) | 138/296 (47%) | 14/296 (5%) |
| Toll-like Receptor Signaling | 9.3 × 10⁻⁶ | 8.11 | 39/74 (53%) | 0/74 (0%) | 33/74 (45%) | 2/74 (3%) |
| Hepatic Cholestasis | 1.2 × 10⁻⁵ | 4.94 | 83/162 (51%) | 0/162 (0%) | 75/162 (46%) | 4/162 (2%) |
| Glucocorticoid Receptor Signaling | 1.5 × 10⁻⁵ | 3.64 | 152/275 (55%) | 0/275 (0%) | 117/275 (43%) | 6/275 (2%) |
| Role of Cytokines in Mediating Communication between Immune Cells | 3.1 × 10⁻⁵ | 9.09 | 32/55 (58%) | 0/55 (0%) | 20/55 (36%) | 3/55 (5%) |
| IL-10 Signaling | 8.5 × 10⁻⁵ | 7.35 | 33/68 (49%) | 0/68 (0%) | 34/68 (50%) | 1/68 (1%) |
| IL-6 Signaling | 0.00012 | 5.17 | 57/116 (49%) | 0/116 (0%) | 59/116 (51%) | 0/116 (0%) |
| p38 MAPK Signaling | 0.000126 | 5.13 | 62/117 (53%) | 0/117 (0%) | 52/117 (44%) | 3/117 (3%) |
| MIF Regulation of Innate Immunity | 0.000151 | 9.76 | 19/41 (46%) | 0/41 (0%) | 21/41 (51%) | 1/41 (2%) |
| Molecular Mechanisms of Cancer | 0.000155 | 2.74 | 201/365 (55%) | 0/365 (0%) | 157/365 (43%) | 7/365 (2%) |
| iNOS Signaling | 0.0002 | 9.09 | 23/44 (52%) | 0/44 (0%) | 20/44 (45%) | 1/44 (2%) |
| Aryl Hydrocarbon Receptor Signaling | 0.000331 | 4.29 | 73/140 (52%) | 0/140 (0%) | 61/140 (44%) | 6/140 (4%) |
| PPAR Signaling | 0.000398 | 5.32 | 52/94 (55%) | 0/94 (0%) | 38/94 (40%) | 4/94 (4%) |
| LPS/IL-1 Mediated Inhibition of RXR Function | 0.000631 | 3.2 | 119/219 (54%) | 0/219 (0%) | 88/219 (40%) | 12/219 (5%) |
| TNFR2 Signaling | 0.000891 | 10.3 | 14/29 (48%) | 0/29 (0%) | 14/29 (48%) | 1/29 (3%) |
| HMGB1 Signaling | 0.001202 | 4.17 | 54/120 (45%) | 0/120 (0%) | 63/120 (53%) | 3/120 (3%) |
| MIF-mediated Glucocorticoid Regulation | 0.001318 | 9.09 | 16/33 (48%) | 0/33 (0%) | 16/33 (48%) | 1/33 (3%) |
| ILK Signaling | 0.001479 | 3.23 | 102/186 (55%) | 0/186 (0%) | 77/186 (41%) | 7/186 (4%) |
| IL-17A Signaling in Fibroblasts | 0.001549 | 8.57 | 20/35 (57%) | 0/35 (0%) | 15/35 (43%) | 0/35 (0%) |
| Role of JAK2 in Hormone-like Cytokine Signaling | 0.001549 | 8.57 | 18/35 (51%) | 0/35 (0%) | 14/35 (40%) | 3/35 (9%) |
| PI3K Signaling in B Lymphocytes | 0.001585 | 3.91 | 66/128 (52%) | 0/128 (0%) | 57/128 (45%) | 5/128 (4%) |
| Factors Promoting Cardiogenesis in Vertebrates | 0.003236 | 4.35 | 52/92 (57%) | 0/92 (0%) | 37/92 (40%) | 3/92 (3%) |
| TNFR1 Signaling | 0.004169 | 6.12 | 27/49 (55%) | 0/49 (0%) | 20/49 (41%) | 2/49 (4%) |
| Antioxidant Action of Vitamin C | 0.004169 | 4.04 | 51/99 (52%) | 0/99 (0%) | 42/99 (42%) | 6/99 (6%) |
| Acute Phase Response Signaling | 0.005248 | 2.96 | 88/169 (52%) | 0/169 (0%) | 79/169 (47%) | 2/169 (1%) |
| Differential Regulation of Cytokine Production in Macrophages and T Helper Cells by IL-17A and IL-17F | 0.006166 | 11.1 | 7/18 (39%) | 0/18 (0%) | 11/18 (61%) | 0/18 (0%) |
| PPARα/RXRα Activation | 0.006607 | 2.79 | 98/179 (55%) | 0/179 (0%) | 67/179 (37%) | 14/179 (8%) |
| Hepatic Fibrosis/Hepatic Stellate Cell Activation | 0.007244 | 2.73 | 96/183 (52%) | 0/183 (0%) | 84/183 (46%) | 3/183 (2%) |
| Type II Diabetes Mellitus Signaling | 0.007586 | 3.42 | 50/117 (43%) | 0/117 (0%) | 64/117 (55%) | 3/117 (3%) |
| Estrogen-Dependent Breast Cancer Signaling | 0.008318 | 4.76 | 30/63 (48%) | 0/63 (0%) | 33/63 (52%) | 0/63 (0%) |
| LXR/RXR Activation | 0.008511 | 3.31 | 68/121 (56%) | 0/121 (0%) | 53/121 (44%) | 0/121 (0%) |
| RAR Activation | 0.008511 | 2.63 | 86/190 (45%) | 0/190 (0%) | 100/190 (53%) | 4/190 (2%) |
| Ingenuity Canonical Pathways | p-Value | Overlap (%) | Downregulated | No change | Upregulated | No Overlap with Dataset |
|---|---|---|---|---|---|---|
| 2-ketoglutarate Dehydrogenase Complex | 0.004898 | 25 | 2/4 (50%) | 0/4 (0%) | 2/4 (50%) | 0/4 (0%) |
| Aryl Hydrocarbon Receptor Signaling | 0.012589 | 1.43 | 64/140 (46%) | 0/140 (0%) | 70/140 (50%) | 6/140 (4%) |
| Aldosterone Signaling in Epithelial Cells | 0.014791 | 1.32 | 80/152 (53%) | 0/152 (0%) | 69/152 (45%) | 3/152 (2%) |
| TCA Cycle II (Eukaryotic) | 0.027542 | 4.35 | 14/23 (61%) | 0/23 (0%) | 9/23 (39%) | 0/23 (0%) |
| Bupropion Degradation | 0.0302 | 4 | 12/25 (48%) | 0/25 (0%) | 12/25 (48%) | 1/25 (4%) |
| D-myo-inositol (1,4,5)-Trisphosphate Biosynthesis | 0.032359 | 3.7 | 13/27 (48%) | 0/27 (0%) | 13/27 (48%) | 1/27 (4%) |
| Acetone Degradation I (to Methylglyoxal) | 0.032359 | 3.7 | 13/27 (48%) | 0/27 (0%) | 13/27 (48%) | 1/27 (4%) |
| Xenobiotic Metabolism Signaling | 0.042658 | 0.738 | 133/271 (49%) | 0/271 (0%) | 122/271 (45%) | 16/271 (6%) |
| Estrogen Biosynthesis | 0.045709 | 2.63 | 17/38 (45%) | 0/38 (0%) | 20/38 (53%) | 1/38 (3%) |
| Nicotine Degradation III | 0.064565 | 1.85 | 23/54 (43%) | 0/54 (0%) | 22/54 (41%) | 9/54 (17%) |
| Melatonin Degradation I | 0.067608 | 1.75 | 25/57 (44%) | 0/57 (0%) | 24/57 (42%) | 8/57 (14%) |
| Superpathway of Melatonin Degradation | 0.072444 | 1.61 | 27/62 (44%) | 0/62 (0%) | 27/62 (44%) | 8/62 (13%) |
| GM-CSF Signaling | 0.072444 | 1.61 | 26/62 (42%) | 0/62 (0%) | 36/62 (58%) | 0/62 (0%) |
| Nicotine Degradation II | 0.074131 | 1.59 | 26/63 (41%) | 0/63 (0%) | 25/63 (40%) | 12/63 (19%) |
| VDR/RXR Activation | 0.091201 | 1.28 | 34/78 (44%) | 0/78 (0%) | 43/78 (55%) | 1/78 (1%) |
| Acute Myeloid Leukemia Signaling | 0.091201 | 1.27 | 39/79 (49%) | 0/79 (0%) | 38/79 (48%) | 2/79 (3%) |
| TR/RXR Activation | 0.097724 | 1.18 | 39/85 (46%) | 0/85 (0%) | 46/85 (54%) | 0/85 (0%) |
| Regulation of Actin-based Motility by Rho | 0.105196 | 1.1 | 45/91 (49%) | 0/91 (0%) | 39/91 (43%) | 7/91 (8%) |
| Antioxidant Action of Vitamin C | 0.114025 | 1.01 | 53/99 (54%) | 0/99 (0%) | 40/99 (40%) | 6/99 (6%) |
| Rac Signaling | 0.119399 | 0.962 | 47/104 (45%) | 0/104 (0%) | 55/104 (53%) | 2/104 (2%) |
| Type I Diabetes Mellitus Signaling | 0.125893 | 0.909 | 54/110 (49%) | 1/110 (1%) | 46/110 (42%) | 9/110 (8%) |
| RhoA Signaling | 0.138676 | 0.82 | 56/122 (46%) | 0/122 (0%) | 61/122 (50%) | 5/122 (4%) |
| 3-phosphoinositide Biosynthesis | 0.175792 | 0.633 | 72/158 (46%) | 0/158 (0%) | 76/158 (48%) | 10/158 (6%) |
| RhoGDI Signaling | 0.190985 | 0.578 | 75/173 (43%) | 0/173 (0%) | 94/173 (54%) | 4/173 (2%) |
| Superpathway of Inositol Phosphate Compounds | 0.212814 | 0.513 | 87/195 (45%) | 0/195 (0%) | 96/195 (49%) | 12/195 (6%) |
| Actin Cytoskeleton Signaling | 0.233884 | 0.461 | 93/217 (43%) | 0/217 (0%) | 115/217 (53%) | 9/217 (4%) |
| Signaling by Rho Family GTPases | 0.249459 | 0.427 | 106/234 (45%) | 0/234 (0%) | 124/234 (53%) | 4/234 (2%) |
| Protein Ubiquitination Pathway | 0.268534 | 0.392 | 121/255 (47%) | 0/255 (0%) | 126/255 (49%) | 8/255 (3%) |
| Ingenuity Toxicity Lists | p-Value | Overlap (%) | Downregulated | No Change | Upregulated | No Overlap with Dataset |
|---|---|---|---|---|---|---|
| VDR/RXR Activation | 1.0 × 10⁻¹⁰ | 12.8 | 34/78 (44%) | 0/78 (0%) | 43/78 (55%) | 1/78 (1%) |
| Hepatic Cholestasis | 1.4 × 10⁻⁵ | 4.85 | 85/165 (52%) | 0/165 (0%) | 76/165 (46%) | 4/165 (2%) |
| Renal Necrosis/Cell Death | 2.8 × 10⁻⁵ | 2.59 | 241/501 (48%) | 0/501 (0%) | 242/501 (48%) | 18/501 (4%) |
| Aryl Hydrocarbon Receptor Signaling | 9.6 × 10⁻⁵ | 4.35 | 79/161 (49%) | 0/161 (0%) | 67/161 (42%) | 15/161 (9%) |
| Liver Necrosis/Cell Death | 0.000525 | 2.87 | 131/279 (47%) | 0/279 (0%) | 136/279 (49%) | 12/279 (4%) |
| Liver Proliferation | 0.000776 | 3.08 | 110/227 (48%) | 0/227 (0%) | 106/227 (47%) | 11/227 (5%) |
| Cardiac Hypertrophy | 0.00138 | 2.24 | 207/401 (52%) | 0/401 (0%) | 171/401 (43%) | 23/401 (6%) |
| LPS/IL-1 Mediated Inhibition of RXR Function | 0.00138 | 2.79 | 124/251 (49%) | 0/251 (0%) | 93/251 (37%) | 34/251 (14%) |
| Hepatic Stellate Cell Activation | 0.001549 | 8.57 | 17/35 (49%) | 0/35 (0%) | 18/35 (51%) | 0/35 (0%) |
| Increases Liver Steatosis | 0.002188 | 4.82 | 43/83 (52%) | 0/83 (0%) | 37/83 (45%) | 3/83 (4%) |
| Mechanism of Gene Regulation by Peroxisome Proliferators via PPARα | 0.003631 | 4.21 | 54/95 (57%) | 0/95 (0%) | 40/95 (42%) | 1/95 (1%) |
| Hepatic Fibrosis | 0.004169 | 4.04 | 42/99 (42%) | 0/99 (0%) | 54/99 (55%) | 3/99 (3%) |
| Increases Liver Damage | 0.005495 | 3.74 | 48/107 (45%) | 0/107 (0%) | 56/107 (52%) | 3/107 (3%) |
| PPARα/RXRα Activation | 0.007244 | 2.73 | 100/183 (55%) | 0/183 (0%) | 69/183 (38%) | 14/183 (8%) |
| Acute Renal Failure Panel (Rat) | 0.007943 | 4.84 | 31/62 (50%) | 0/62 (0%) | 24/62 (39%) | 7/62 (11%) |
| RAR Activation | 0.008511 | 2.63 | 86/190 (45%) | 0/190 (0%) | 100/190 (53%) | 4/190 (2%) |
| Cardiac Necrosis/Cell Death | 0.008913 | 2.23 | 141/269 (52%) | 0/269 (0%) | 114/269 (42%) | 14/269 (5%) |
| Cardiac Fibrosis | 0.008913 | 2.6 | 104/192 (54%) | 0/192 (0%) | 72/192 (38%) | 16/192 (8%) |
| LXR/RXR Activation | 0.008913 | 3.25 | 69/123 (56%) | 0/123 (0%) | 54/123 (44%) | 0/123 (0%) |
| Nongenotoxic Hepatocarcinogenicity Biomarker Panel | 0.00912 | 9.09 | 11/22 (50%) | 0/22 (0%) | 10/22 (45%) | 1/22 (5%) |
| Increases Renal Damage | 0.016218 | 3.7 | 38/81 (47%) | 0/81 (0%) | 36/81 (44%) | 7/81 (9%) |
| NRF2-mediated Oxidative Stress Response | 0.019498 | 2.14 | 99/234 (42%) | 0/234 (0%) | 103/234 (44%) | 32/234 (14%) |
| TGF-β Signaling | 0.021878 | 3.33 | 54/90 (60%) | 0/90 (0%) | 35/90 (39%) | 1/90 (1%) |
| Ingenuity Toxicity Lists | p-Value | Overlap (%) | Downregulated | No Change | Upregulated | No Overlap with Dataset |
|---|---|---|---|---|---|---|
| Cytochrome P450 Panel—Substrate is a Vitamin (Human) | 0.007244 | 16.7 | 2/6 (33%) | 0/6 (0%) | 4/6 (67%) | 0/6 (0%) |
| Aryl Hydrocarbon Receptor Signaling | 0.016218 | 1.24 | 71/161 (44%) | 0/161 (0%) | 75/161 (47%) | 15/161 (9%) |
| Cytochrome P450 Panel—Substrate is a Sterol (Human) | 0.016982 | 7.14 | 5/14 (36%) | 0/14 (0%) | 9/14 (64%) | 0/14 (0%) |
| Cytochrome P450 Panel—Substrate is a Xenobiotic (Human) | 0.021878 | 5.56 | 7/18 (39%) | 0/18 (0%) | 9/18 (50%) | 2/18 (11%) |
| Nongenotoxic Hepatocarcinogenicity Biomarker Panel | 0.026303 | 4.55 | 12/22 (55%) | 0/22 (0%) | 9/22 (41%) | 1/22 (5%) |
| Cytochrome P450 Panel—Substrate is a Xenobiotic (Mouse) | 0.0302 | 4 | 5/25 (20%) | 0/25 (0%) | 7/25 (28%) | 13/25 (52%) |
| Cytochrome P450 Panel—Substrate is a Xenobiotic (Rat) | 0.030903 | 3.85 | 5/26 (19%) | 0/26 (0%) | 7/26 (27%) | 14/26 (54%) |
| Xenobiotic Metabolism Signaling | 0.063096 | 0.595 | 155/336 (46%) | 0/336 (0%) | 139/336 (41%) | 42/336 (13%) |
| VDR/RXR Activation | 0.091201 | 1.28 | 34/78 (44%) | 0/78 (0%) | 43/78 (55%) | 1/78 (1%) |
| TR/RXR Activation | 0.097724 | 1.18 | 39/85 (46%) | 0/85 (0%) | 46/85 (54%) | 0/85 (0%) |
| Hepatic Fibrosis | 0.114025 | 1.01 | 49/99 (49%) | 0/99 (0%) | 47/99 (47%) | 3/99 (3%) |
| Increases Liver Hyperplasia/ Hyperproliferation | 0.116145 | 0.99 | 39/101 (39%) | 0/101 (0%) | 52/101 (51%) | 10/101 (10%) |
| Renal Necrosis/Cell Death | 0.12388 | 0.399 | 224/501 (45%) | 1/501 (0%) | 258/501 (51%) | 18/501 (4%) |
| Fatty Acid Metabolism | 0.133352 | 0.855 | 57/117 (49%) | 0/117 (0%) | 39/117 (33%) | 21/117 (18%) |
| Cardiac Fibrosis | 0.209894 | 0.521 | 89/192 (46%) | 0/192 (0%) | 87/192 (45%) | 16/192 (8%) |
| Liver Proliferation | 0.24322 | 0.441 | 98/227 (43%) | 0/227 (0%) | 118/227 (52%) | 11/227 (5%) |
| Categories of Biological Function | Diseases or Functions Annotation | p-Value | Activation z-Score | # of Genes |
|---|---|---|---|---|
| Cancer, Organismal Injury and Abnormalities | growth of tumor | 1.5 × 10⁻¹² | 0.033 | 31 |
| Cellular Movement | cell movement | 4.5 × 10⁻¹² | 1.845 | 52 |
| Cancer, Cellular Development, Cellular Growth and Proliferation, Organismal Injury and Abnormalities, Tumor Morphology | proliferation of tumor cells | 7.5 × 10⁻¹² | −0.27 | 23 |
| Cellular Movement | migration of cells | 1.3 × 10⁻¹¹ | 1.801 | 48 |
| Cellular Growth and Proliferation | proliferation of cells | 4.2 × 10⁻¹¹ | 0.347 | 70 |
| Carbohydrate Metabolism | metabolism of polysaccharide | 4.4 × 10⁻¹¹ | 0.755 | 16 |
| Cell Death and Survival | apoptosis of tumor cell lines | 8.3 × 10⁻¹¹ | 1.089 | 36 |
| Cellular Movement | invasion of cells | 8.7 × 10⁻¹¹ | 0.571 | 30 |
| Inflammatory Response | inflammatory response | 1.4 × 10⁻¹⁰ | 0.766 | 28 |
| Cellular Development | differentiation of cells | 1.5 × 10⁻¹⁰ | 2.774 | 51 |
| Cell Death and Survival | cell survival | 3.1 × 10⁻¹⁰ | 2.346 | 38 |
| Cell Death and Survival | apoptosis | 5.7 × 10⁻¹⁰ | 1.307 | 55 |
| Cell Death and Survival | necrosis | 6.3 × 10⁻¹⁰ | 1.7 | 54 |
| Cell Death and Survival | cell viability | 6.4 × 10⁻¹⁰ | 2.547 | 36 |
| Tissue Morphology | quantity of cells | 7.1 × 10⁻¹⁰ | 1.065 | 43 |
| Cardiovascular System Development and Function, Organismal Development | vasculogenesis | 9.4 × 10⁻¹⁰ | 0.844 | 26 |
| Carbohydrate Metabolism | synthesis of polysaccharide | 9.6 × 10⁻¹⁰ | 0.297 | 13 |
| Cellular Growth and Proliferation, Tissue Development | proliferation of connective tissue cells | 1.2 × 10⁻⁹ | 1.232 | 23 |
| Cellular Movement | cell movement of tumor cell lines | 1.2 × 10⁻⁹ | 0.955 | 28 |
| Cell Death and Survival | cell death of tumor cell lines | 1.2 × 10⁻⁹ | 0.81 | 39 |
| Cellular Development, Cellular Growth and Proliferation | proliferation of tumor cell lines | 1.9 × 10⁻⁹ | 0.324 | 39 |
| Organismal Survival | morbidity or mortality | 2.3 × 10⁻⁹ | −1.006 | 51 |
| Embryonic Development, Organismal Development | development of body trunk | 2.7 × 10⁻⁹ | 0.06 | 32 |
| Cell Death and Survival | cell death | 3.1 × 10⁻⁹ | 1.556 | 62 |
| Cancer, Organismal Injury and Abnormalities | growth of malignant tumor | 3.3 × 10⁻⁹ | 0.518 | 19 |
| Cellular Development, Cellular Growth and Proliferation, Connective Tissue Development and Function, Tissue Development | proliferation of fibroblasts | 4.0 × 10⁻⁹ | 0.604 | 17 |
| Cellular Function and Maintenance, Hematological System Development and Function | function of myeloid cells | 4.5 × 10⁻⁹ | 14 | |
| Cell Signaling, Small Molecule Biochemistry | synthesis of nitric oxide | 4.7 × 10⁻⁹ | 0.89 | 15 |
| Dermatological Diseases and Conditions | psoriasis | 5.0 × 10⁻⁹ | 22 |
| Categories of Biological Function | Diseases or Functions Annotation | p-Value | # of Genes |
|---|---|---|---|
| Cancer, Organismal Injury and Abnormalities, Respiratory Disease | carcinoma in lung | 6.5 × 10⁻⁵ | 8 |
| Vitamin and Mineral Metabolism | metabolism of vitamin | 0.000254 | 3 |
| Developmental Disorder, Skeletal and Muscular Disorders | hypertrophy of smooth muscle | 0.000325 | 2 |
| Cancer, Organismal Injury and Abnormalities, Respiratory Disease | non-small cell lung cancer | 0.000334 | 7 |
| Infectious Diseases | internalization of virus | 0.000355 | 2 |
| Cancer, Organismal Injury and Abnormalities | adenocarcinoma | 0.000603 | 20 |
| Cancer, Organismal Injury and Abnormalities, Reproductive System Disease | prostate cancer | 0.000618 | 7 |
| Cancer, Gastrointestinal Disease, Hepatic System Disease, Organismal Injury and Abnormalities | liver adenoma | 0.000692 | 2 |
| Cancer, Endocrine System Disorders, Organismal Injury and Abnormalities | endocrine gland tumor | 0.000718 | 9 |
| Cell Death and Survival | apoptosis of germ cells | 0.000799 | 3 |
| Lipid Metabolism, Small Molecule Biochemistry, Vitamin and Mineral Metabolism | catabolism of terpenoid | 0.000828 | 2 |
| Cancer, Organismal Injury and Abnormalities | epithelial cancer | 0.000989 | 23 |
| Endocrine System Development and Function, Lipid Metabolism, Small Molecule Biochemistry, Vitamin and Mineral Metabolism | synthesis of estrogen | 0.00114 | 2 |
| Ophthalmic Disease, Organismal Injury and Abnormalities | age-related macular degeneration type 6 | 0.00122 | 1 |
| Cell Cycle | arrest in sub-G1 phase of endometrial cancer cell lines | 0.00122 | 1 |
| Cell Morphology, Connective Tissue Development and Function | blebbing of pulmonary fibroblasts | 0.00122 | 1 |
| Organismal Injury and Abnormalities | calcification of uterus | 0.00122 | 1 |
| Cell Cycle, Cell Death and Survival | chromosome condensation of pulmonary fibroblasts | 0.00122 | 1 |
| Cell-To-Cell Signaling and Interaction, Inflammatory Response | cytotoxic reaction of bone marrow cells | 0.00122 | 1 |
| Tissue Morphology | deficiency of mast cells | 0.00122 | 1 |
| Cell Cycle | delay in G1/S phase transition of hepatoma cell lines | 0.00122 | 1 |
| Embryonic Development, Organ Development, Organismal Development, Tissue Development, Visual System Development and Function | development of outflow pathway | 0.00122 | 1 |
| Embryonic Development, Organ Development, Organismal Development, Reproductive System Development and Function, Tissue Development | development of placenta decidua | 0.00122 | 1 |
| Embryonic Development, Organ Development, Organismal Development, Reproductive System Development and Function, Tissue Development | development of placental spongiotrophoblast layer | 0.00122 | 1 |
| Cardiovascular System Development and Function, Tissue Morphology | diameter of portal vein | 0.00122 | 1 |
| Cardiovascular System Development and Function, Tissue Morphology | diameter of umbilical vein | 0.00122 | 1 |
| Hereditary Disorder, Ophthalmic Disease, Organismal Injury and Abnormalities | digenic early-onset glaucoma | 0.00122 | 1 |
| Cancer, Organismal Injury and Abnormalities, Reproductive System Disease | estrogen receptor positive endometrial cancer | 0.00122 | 1 |
| Connective Tissue Disorders, Organismal Injury and Abnormalities | fibrosis of submucosa | 0.00122 | 1 |
| Digestive System Development and Function, Embryonic Development, Organ Development, Organismal Development, Tissue Development | formation of salivary duct | 0.00122 | 1 |
| Cardiovascular System Development and Function, Embryonic Development, Lymphoid Tissue Structure and Development, Organ Development, Organismal Development, Respiratory System Development and Function, Tissue Development | formation of tracheal duct | 0.00122 | 1 |
| Cancer, Gastrointestinal Disease, Organismal Injury and Abnormalities | hyperplasia of pylorus | 0.00122 | 1 |
| Cancer, Cardiovascular Disease, Organismal Injury and Abnormalities | hyperplasia of vasculature | 0.00122 | 1 |
| Developmental Disorder, Gastrointestinal Disease | hypertrophy of gastric epithelium | 0.00122 | 1 |
| Dermatological Diseases and Conditions, Developmental Disorder | hypertrophy of skin | 0.00122 | 1 |
| Ingenuity Canonical Pathways | p-Value | Overlap (%) | Downregulated | No Change | Upregulated | No Overlap with Dataset |
|---|---|---|---|---|---|---|
| VDR/RXR Activation | 7.9 × 10⁻¹⁵ | 15.4 | 23/78 (29%) | 0/78 (0%) | 54/78 (69%) | 1/78 (1%) |
| MIF-mediated Glucocorticoid Regulation | 2.6 × 10⁻⁵ | 12.1 | 12/33 (36%) | 0/33 (0%) | 20/33 (61%) | 1/33 (3%) |
| MIF Regulation of Innate Immunity | 6.3 × 10⁻⁵ | 9.76 | 19/41 (46%) | 0/41 (0%) | 21/41 (51%) | 1/41 (2%) |
| α-tocopherol Degradation | 0.000162181 | 50 | 0/4 (0%) | 0/4 (0%) | 4/4 (100%) | 0/4 (0%) |
| Antioxidant Action of Vitamin C | 0.000177828 | 5.05 | 43/99 (43%) | 0/99 (0%) | 50/99 (51%) | 6/99 (6%) |
| Retinoate Biosynthesis I | 0.000691831 | 9.09 | 9/33 (27%) | 0/33 (0%) | 20/33 (61%) | 4/33 (12%) |
| Coagulation System | 0.000831764 | 8.57 | 17/35 (49%) | 0/35 (0%) | 18/35 (51%) | 0/35 (0%) |
| Estrogen Biosynthesis | 0.001047129 | 7.89 | 18/38 (47%) | 0/38 (0%) | 19/38 (50%) | 1/38 (3%) |
| iNOS Signaling | 0.00162181 | 6.82 | 17/44 (39%) | 0/44 (0%) | 26/44 (59%) | 1/44 (2%) |
| Role of IL-17A in Arthritis | 0.002884032 | 5.56 | 27/54 (50%) | 0/54 (0%) | 27/54 (50%) | 0/54 (0%) |
| Parkinson’s Signaling | 0.003162278 | 12.5 | 9/16 (56%) | 0/16 (0%) | 7/16 (44%) | 0/16 (0%) |
| LXR/RXR Activation | 0.003890451 | 3.31 | 61/121 (50%) | 0/121 (0%) | 60/121 (50%) | 0/121 (0%) |
| CD40 Signaling | 0.004897788 | 4.62 | 31/65 (48%) | 0/65 (0%) | 33/65 (51%) | 1/65 (2%) |
| IL-10 Signaling | 0.005495409 | 4.41 | 32/68 (47%) | 0/68 (0%) | 35/68 (51%) | 1/68 (1%) |
| Role of MAPK Signaling in the Pathogenesis of Influenza | 0.005754399 | 4.35 | 27/69 (39%) | 0/69 (0%) | 39/69 (57%) | 3/69 (4%) |
| LPS/IL-1 Mediated Inhibition of RXR Function | 0.006025596 | 2.28 | 102/219 (47%) | 0/219 (0%) | 105/219 (48%) | 12/219 (5%) |
| Role of Osteoblasts, Osteoclasts and Chondrocytes in Rheumatoid Arthritis | 0.006025596 | 2.28 | 111/219 (51%) | 0/219 (0%) | 103/219 (47%) | 5/219 (2%) |
| IL-17 Signaling | 0.006456542 | 4.17 | 33/72 (46%) | 0/72 (0%) | 39/72 (54%) | 0/72 (0%) |
| LPS-stimulated MAPK Signaling | 0.00676083 | 4.11 | 33/73 (45%) | 0/73 (0%) | 40/73 (55%) | 0/73 (0%) |
| Toll-like Receptor Signaling | 0.007079458 | 4.05 | 32/74 (43%) | 0/74 (0%) | 40/74 (54%) | 2/74 (3%) |
| BMP signaling pathway | 0.007585776 | 3.95 | 43/76 (57%) | 0/76 (0%) | 31/76 (41%) | 2/76 (3%) |
| Intrinsic Prothrombin Activation Pathway | 0.01023293 | 6.9 | 12/29 (41%) | 0/29 (0%) | 16/29 (55%) | 1/29 (3%) |
| 4-1BB Signaling in T Lymphocytes | 0.011481536 | 6.45 | 19/31 (61%) | 0/31 (0%) | 12/31 (39%) | 0/31 (0%) |
| Acute Phase Response Signaling | 0.012302688 | 2.37 | 76/169 (45%) | 0/169 (0%) | 91/169 (54%) | 2/169 (1%) |
| Endothelin-1 Signaling | 0.013182567 | 2.33 | 89/172 (52%) | 0/172 (0%) | 77/172 (45%) | 6/172 (3%) |
| Inhibition of Angiogenesis by TSP1 | 0.013803843 | 5.88 | 21/34 (62%) | 0/34 (0%) | 11/34 (32%) | 2/34 (6%) |
| Xenobiotic Metabolism Signaling | 0.014454398 | 1.85 | 127/271 (47%) | 0/271 (0%) | 128/271 (47%) | 16/271 (6%) |
| IL-17A Signaling in Fibroblasts | 0.014454398 | 5.71 | 15/35 (43%) | 0/35 (0%) | 20/35 (57%) | 0/35 (0%) |
| Interferon Signaling | 0.015488166 | 5.56 | 28/36 (78%) | 0/36 (0%) | 8/36 (22%) | 0/36 (0%) |
| Thyroid Hormone Biosynthesis | 0.015848932 | 33.3 | 1/3 (33%) | 0/3 (0%) | 2/3 (67%) | 0/3 (0%) |
| April Mediated Signaling | 0.016982437 | 5.26 | 18/38 (47%) | 0/38 (0%) | 20/38 (53%) | 0/38 (0%) |
| Inhibition of Matrix Metalloproteases | 0.017782794 | 5.13 | 17/39 (44%) | 0/39 (0%) | 21/39 (54%) | 1/39 (3%) |
| RAR Activation | 0.018197009 | 2.11 | 87/190 (46%) | 0/190 (0%) | 99/190 (52%) | 4/190 (2%) |
| Thrombin Signaling | 0.018620871 | 2.09 | 90/191 (47%) | 0/191 (0%) | 96/191 (50%) | 5/191 (3%) |
| B Cell Activating Factor Signaling | 0.018620871 | 5 | 21/40 (53%) | 0/40 (0%) | 19/40 (48%) | 0/40 (0%) |
| Dermatan Sulfate Biosynthesis (Late Stages) | 0.022387211 | 4.55 | 16/44 (36%) | 0/44 (0%) | 26/44 (59%) | 2/44 (5%) |
| IL-6 Signaling | 0.023442288 | 2.59 | 52/116 (45%) | 0/116 (0%) | 64/116 (55%) | 0/116 (0%) |
| p38 MAPK Signaling | 0.023988329 | 2.56 | 52/117 (44%) | 0/117 (0%) | 62/117 (53%) | 3/117 (3%) |
| Ingenuity Canonical Pathways | p-Value | Overlap (%) | Downregulated | No Change | Upregulated | No Overlap with Dataset |
|---|---|---|---|---|---|---|
| Aryl Hydrocarbon Receptor Signaling | 9.5 × 10⁻¹⁰ | 22.9 | 80/140 (57%) | 0/140 (0%) | 54/140 (39%) | 6/140 (4%) |
| Superpathway of Cholesterol Biosynthesis | 9.1 × 10⁻⁹ | 46.4 | 22/28 (79%) | 0/28 (0%) | 4/28 (14%) | 2/28 (7%) |
| Cell Cycle Control of Chromosomal Replication | 6.3 × 10⁻⁸ | 44.4 | 21/27 (78%) | 0/27 (0%) | 6/27 (22%) | 0/27 (0%) |
| Mismatch Repair in Eukaryotes | 2.3 × 10⁻⁷ | 56.2 | 15/16 (94%) | 0/16 (0%) | 1/16 (6%) | 0/16 (0%) |
| Unfolded protein response | 3.5 × 10⁻⁷ | 29.6 | 24/54 (44%) | 0/54 (0%) | 29/54 (54%) | 1/54 (2%) |
| Fatty Acid α-oxidation | 1.5 × 10⁻⁶ | 47.4 | 10/19 (53%) | 0/19 (0%) | 6/19 (32%) | 3/19 (16%) |
| Ethanol Degradation IV | 6.8 × 10⁻⁶ | 40.9 | 17/22 (77%) | 0/22 (0%) | 2/22 (9%) | 3/22 (14%) |
| Cholesterol Biosynthesis I | 7.9 × 10⁻⁶ | 53.8 | 12/13 (92%) | 0/13 (0%) | 1/13 (8%) | 0/13 (0%) |
| p53 Signaling | 8.3 × 10⁻⁶ | 20.4 | 53/98 (54%) | 0/98 (0%) | 45/98 (46%) | 0/98 (0%) |
| VDR/RXR Activation | 1.5 × 10⁻⁵ | 21.8 | 26/78 (33%) | 0/78 (0%) | 51/78 (65%) | 1/78 (1%) |
| GADD45 Signaling | 1.7 × 10⁻⁵ | 42.1 | 14/19 (74%) | 0/19 (0%) | 5/19 (26%) | 0/19 (0%) |
| Putrescine Degradation III | 2.8 × 10⁻⁵ | 40 | 12/20 (60%) | 0/20 (0%) | 5/20 (25%) | 3/20 (15%) |
| Histamine Degradation | 4.5 × 10⁻⁵ | 43.8 | 10/16 (63%) | 0/16 (0%) | 3/16 (19%) | 3/16 (19%) |
| Dopamine Degradation | 4.7 × 10⁻⁵ | 33.3 | 16/27 (59%) | 0/27 (0%) | 6/27 (22%) | 5/27 (19%) |
| Tryptophan Degradation X (Mammalian, via Tryptamine) | 6.2 × 10⁻⁵ | 36.4 | 13/22 (59%) | 0/22 (0%) | 5/22 (23%) | 4/22 (18%) |
| Xenobiotic Metabolism Signaling | 9.3 × 10⁻⁵ | 13.3 | 131/271 (48%) | 0/271 (0%) | 124/271 (46%) | 16/271 (6%) |
| Oxidative Ethanol Degradation III | 0.000109648 | 38.9 | 13/18 (72%) | 0/18 (0%) | 2/18 (11%) | 3/18 (17%) |
| Mevalonate Pathway I | 0.000112202 | 46.2 | 8/13 (62%) | 0/13 (0%) | 3/13 (23%) | 2/13 (15%) |
| Estrogen-mediated S-phase Entry | 0.000125893 | 33.3 | 18/24 (75%) | 0/24 (0%) | 6/24 (25%) | 0/24 (0%) |
| Hereditary Breast Cancer Signaling | 0.000165959 | 16.3 | 77/129 (60%) | 0/129 (0%) | 45/129 (35%) | 7/129 (5%) |
| Glucocorticoid Receptor Signaling | 0.000269153 | 12.7 | 122/275 (44%) | 0/275 (0%) | 147/275 (53%) | 6/275 (2%) |
| Adipogenesis pathway | 0.000371535 | 15.7 | 66/127 (52%) | 0/127 (0%) | 55/127 (43%) | 6/127 (5%) |
| Interferon Signaling | 0.000537032 | 25 | 24/36 (67%) | 0/36 (0%) | 12/36 (33%) | 0/36 (0%) |
| Superpathway of Serine and Glycine Biosynthesis I | 0.000630957 | 57.1 | 3/7 (43%) | 0/7 (0%) | 4/7 (57%) | 0/7 (0%) |
| Superpathway of Geranylgeranyldiphosphate Biosynthesis I (via Mevalonate) | 0.000630957 | 35.3 | 11/17 (65%) | 0/17 (0%) | 4/17 (24%) | 2/17 (12%) |
| Semaphorin Signaling in Neurons | 0.000758578 | 20.8 | 27/53 (51%) | 0/53 (0%) | 24/53 (45%) | 2/53 (4%) |
| Glutaryl-CoA Degradation | 0.000776247 | 41.7 | 7/12 (58%) | 0/12 (0%) | 4/12 (33%) | 1/12 (8%) |
| Pancreatic Adenocarcinoma Signaling | 0.000794328 | 16 | 53/106 (50%) | 0/106 (0%) | 53/106 (50%) | 0/106 (0%) |
| Role of CHK Proteins in Cell Cycle Checkpoint Control | 0.001047129 | 20 | 35/55 (64%) | 0/55 (0%) | 20/55 (36%) | 0/55 (0%) |
| Glycolysis I | 0.001096478 | 28 | 20/25 (80%) | 0/25 (0%) | 4/25 (16%) | 1/25 (4%) |
| NRF2-mediated Oxidative Stress Response | 0.001230269 | 13.3 | 89/180 (49%) | 0/180 (0%) | 87/180 (48%) | 4/180 (2%) |
| HIF1α Signaling | 0.001412538 | 15.7 | 52/102 (51%) | 0/102 (0%) | 48/102 (47%) | 2/102 (2%) |
| Aldosterone Signaling in Epithelial Cells | 0.001548817 | 13.8 | 82/152 (54%) | 0/152 (0%) | 67/152 (44%) | 3/152 (2%) |
| Serotonin Degradation | 0.001737801 | 17.9 | 38/67 (57%) | 0/67 (0%) | 16/67 (24%) | 13/67 (19%) |
| Ingenuity Toxicity Lists | p-Value | Overlap (%) | Downregulated | No Change | Upregulated | No Overlap with Dataset |
|---|---|---|---|---|---|---|
| VDR/RXR Activation | 7.9 × 10⁻¹⁵ | 15.4 | 23/78 (29%) | 0/78 (0%) | 54/78 (69%) | 1/78 (1%) |
| Xenobiotic Metabolism Signaling | 0.00040738 | 2.38 | 144/336 (43%) | 0/336 (0%) | 150/336 (45%) | 42/336 (13%) |
| Cardiac Fibrosis | 0.000537032 | 3.12 | 85/192 (44%) | 0/192 (0%) | 91/192 (47%) | 16/192 (8%) |
| Cytochrome P450 Panel—Substrate is an Eicosanoid (Human) | 0.000562341 | 28.6 | 1/7 (14%) | 0/7 (0%) | 6/7 (86%) | 0/7 (0%) |
| Cytochrome P450 Panel—Substrate is a Fatty Acid (Human) | 0.001202264 | 20 | 3/10 (30%) | 0/10 (0%) | 7/10 (70%) | 0/10 (0%) |
| Cardiac Hypertrophy | 0.00128825 | 2 | 193/401 (48%) | 0/401 (0%) | 185/401 (46%) | 23/401 (6%) |
| Liver Proliferation | 0.00128825 | 2.64 | 103/227 (45%) | 0/227 (0%) | 113/227 (50%) | 11/227 (5%) |
| Hepatic Fibrosis | 0.001862087 | 4.04 | 49/99 (49%) | 1/99 (1%) | 46/99 (46%) | 3/99 (3%) |
| LXR/RXR Activation | 0.004073803 | 3.25 | 62/123 (50%) | 0/123 (0%) | 61/123 (50%) | 0/123 (0%) |
| Renal Necrosis/Cell Death | 0.005011872 | 1.6 | 238/501 (48%) | 0/501 (0%) | 245/501 (49%) | 18/501 (4%) |
| LPS/IL-1 Mediated Inhibition of RXR Function | 0.010715193 | 1.99 | 107/251 (43%) | 0/251 (0%) | 110/251 (44%) | 34/251 (14%) |
| Positive Acute Phase Response Proteins | 0.010964782 | 6.67 | 11/30 (37%) | 0/30 (0%) | 19/30 (63%) | 0/30 (0%) |
| Liver Necrosis/Cell Death | 0.016218101 | 1.79 | 118/279 (42%) | 0/279 (0%) | 149/279 (53%) | 12/279 (4%) |
| RAR Activation | 0.018197009 | 2.11 | 87/190 (46%) | 0/190 (0%) | 99/190 (52%) | 4/190 (2%) |
| Increases Liver Damage | 0.019054607 | 2.8 | 46/107 (43%) | 0/107 (0%) | 58/107 (54%) | 3/107 (3%) |
| Fatty Acid Metabolism | 0.023988329 | 2.56 | 48/117 (41%) | 0/117 (0%) | 48/117 (41%) | 21/117 (18%) |
| Increases Liver Hepatitis | 0.030902954 | 3.85 | 22/52 (42%) | 0/52 (0%) | 29/52 (56%) | 1/52 (2%) |
| Ingenuity Toxicity Lists | p-Value | Overlap (%) | Downregulated | No Change | Upregulated | No Overlap with Dataset |
|---|---|---|---|---|---|---|
| Aryl Hydrocarbon Receptor Signaling | 2.6 × 10⁻⁹ | 21.1 | 90/161 (56%) | 0/161 (0%) | 56/161 (35%) | 15/161 (9%) |
| Cholesterol Biosynthesis | 1.1 × 10⁻⁸ | 62.5 | 13/16 (81%) | 0/16 (0%) | 3/16 (19%) | 0/16 (0%) |
| Renal Necrosis/Cell Death | 1.9 × 10⁻⁷ | 13.2 | 228/501 (46%) | 0/501 (0%) | 255/501 (51%) | 18/501 (4%) |
| Primary Glomerulonephritis Biomarker Panel (Human) | 1.7 × 10⁻⁶ | 63.6 | 5/11 (45%) | 0/11 (0%) | 6/11 (55%) | 0/11 (0%) |
| p53 Signaling | 2.6 × 10⁻⁶ | 21.2 | 54/99 (55%) | 0/99 (0%) | 45/99 (45%) | 0/99 (0%) |
| VDR/RXR Activation | 1.5 × 10⁻⁵ | 21.8 | 26/78 (33%) | 0/78 (0%) | 51/78 (65%) | 1/78 (1%) |
| Liver Proliferation | 3.0 × 10⁻⁵ | 14.5 | 96/227 (42%) | 0/227 (0%) | 120/227 (53%) | 11/227 (5%) |
| Cardiac Hypertrophy | 5.1 × 10⁻⁵ | 12.2 | 176/401 (44%) | 0/401 (0%) | 202/401 (50%) | 23/401 (6%) |
| Liver Necrosis/Cell Death | 7.8 × 10⁻⁵ | 13.3 | 117/279 (42%) | 0/279 (0%) | 150/279 (54%) | 12/279 (4%) |
| Oxidative Stress | 0.000380189 | 21.1 | 39/57 (68%) | 0/57 (0%) | 17/57 (30%) | 1/57 (2%) |
| Mechanism of Gene Regulation by Peroxisome Proliferators via PPARα | 0.000645654 | 16.8 | 38/95 (40%) | 0/95 (0%) | 56/95 (59%) | 1/95 (1%) |
| Xenobiotic Metabolism Signaling | 0.000794328 | 11.6 | 152/336 (45%) | 0/336 (0%) | 142/336 (42%) | 42/336 (13%) |
| Increases Renal Proliferation | 0.002398833 | 13.9 | 68/137 (50%) | 0/137 (0%) | 62/137 (45%) | 7/137 (5%) |
| Fatty Acid Metabolism | 0.002398833 | 14.5 | 65/117 (56%) | 0/117 (0%) | 31/117 (26%) | 21/117 (18%) |
| Increases Liver Steatosis | 0.003890451 | 15.7 | 32/83 (39%) | 0/83 (0%) | 48/83 (58%) | 3/83 (4%) |
| Decreases Depolarization of Mitochondria and Mitochondrial Membrane | 0.004570882 | 25 | 18/24 (75%) | 0/24 (0%) | 5/24 (21%) | 1/24 (4%) |
| Cell Cycle: G1/S Checkpoint Regulation | 0.004677351 | 16.7 | 35/66 (53%) | 0/66 (0%) | 28/66 (42%) | 3/66 (5%) |
| Categories of Biological Function | Diseases or Functions Annotation | p-Value | Activation z-Score | # of Genes |
|---|---|---|---|---|
| Cancer, Organismal Injury and Abnormalities | benign neoplasia | 1.0 × 10⁻⁹ | 0.927 | 26 |
| Dermatological Diseases and Conditions | psoriasis | 2.6 × 10⁻⁹ | 20 | |
| Cardiovascular System Development and Function, Cellular Movement | cell movement of endothelial cells | 8.8 × 10⁻⁹ | 1.37 | 15 |
| Cancer, Cellular Movement, Organismal Injury and Abnormalities, Tumor Morphology | invasion of tumor cells | 1.2 × 10⁻⁸ | 1.596 | 11 |
| Cell Signaling, Small Molecule Biochemistry | synthesis of nitric oxide | 1.9 × 10⁻⁸ | −0.217 | 13 |
| Cardiovascular System Development and Function, Cellular Movement | homing of endothelial cells | 3.2 × 10⁻⁸ | 1.597 | 7 |
| Cancer, Organismal Injury and Abnormalities, Tumor Morphology | invasion of tumor | 3.4 × 10⁻⁸ | 1.63 | 12 |
| Lipid Metabolism, Small Molecule Biochemistry | metabolism of eicosanoid | 3.4 × 10⁻⁸ | 2.747 | 12 |
| Cardiovascular Disease, Hematological Disease | Thrombosis | 5.9 × 10⁻⁸ | −0.946 | 10 |
| Organismal Injury and Abnormalities | Fibrosis | 1.1 × 10⁻⁷ | −1.401 | 17 |
| Lipid Metabolism, Small Molecule Biochemistry | metabolism of prostaglandin | 1.2 × 10⁻⁷ | 2.589 | 10 |
| Immunological Disease | hypersensitive reaction | 1.5 × 10⁻⁷ | 0.914 | 15 |
| Cardiovascular System Development and Function, Organismal Development | vasculogenesis | 1.6 × 10⁻⁷ | 1.825 | 20 |
| Inflammatory Response | inflammation of organ | 1.8 × 10⁻⁷ | −0.022 | 26 |
| Dermatological Diseases and Conditions, Inflammatory Disease, Inflammatory Response | Dermatitis | 1.8 × 10⁻⁷ | −0.355 | 15 |
| Cardiovascular System Development and Function, Organismal Development | vascularization of hindlimb | 2.3 X 10⁻⁷ | 1.994 | 4 |
| Cellular Movement | homing | 3.4 × 10⁻⁷ | 1.468 | 17 |
| Cancer, Cellular Development, Cellular Growth and Proliferation, Organismal Injury and Abnormalities, Tumor Morphology | proliferation of tumor cells | 5.4 × 10⁻⁷ | −0.189 | 15 |
| Cancer, Organismal Injury and Abnormalities | growth of tumor | 6.0 × 10⁻⁷ | 0.402 | 20 |
| Cellular Movement | invasion of cells | 6.3 × 10⁻⁷ | 1.731 | 21 |
| Categories of Biological Function | Diseases or Functions Annotation | p-Value | Activation z-Score | # of Genes |
|---|---|---|---|---|
| Cellular Growth and Proliferation | proliferation of cells | 7.0 × 10⁻³³ | −3.052 | 551 |
| Dermatological Diseases and Conditions | psoriasis | 4.6 × 10⁻²⁹ | 142 | |
| Cell Death and Survival | cell death | 1.2 × 10⁻²⁷ | 1.116 | 493 |
| Cell Death and Survival | necrosis | 1.9 × 10⁻²⁶ | 1.15 | 400 |
| Cell Death and Survival | apoptosis | 1.9 × 10⁻²⁵ | 0.619 | 405 |
| Cell Death and Survival | cell death of tumor cell lines | 7.2 × 10⁻²⁵ | 0.971 | 266 |
| Cell Death and Survival | apoptosis of tumor cell lines | 7.6 × 10⁻²³ | 0.672 | 219 |
| Cellular Movement | cell movement | 1.3 × 10⁻²² | −0.187 | 334 |
| Cellular Movement | migration of cells | 6.7 × 10⁻²¹ | −0.554 | 301 |
| Cancer, Organismal Injury and Abnormalities | abdominal neoplasm | 8.7 × 10⁻²⁰ | −1.733 | 1030 |
| Infectious Diseases | Viral Infection | 1.2 × 10⁻¹⁹ | 0.737 | 261 |
| Cancer, Organismal Injury and Abnormalities | tumorigenesis of tissue | 6.5 × 10⁻¹⁹ | −0.349 | 1047 |
| Cancer, Organismal Injury and Abnormalities | abdominal cancer | 2.3 × 10⁻¹⁸ | −1.938 | 1014 |
| Cancer, Organismal Injury and Abnormalities | cancer | 4.2 × 10⁻¹⁸ | 1.528 | 1215 |
| Cancer, Organismal Injury and Abnormalities | neoplasia of epithelial tissue | 2.3 × 10⁻¹⁷ | −0.365 | 1026 |
| Cellular Development, Cellular Growth and Proliferation | proliferation of tumor cell lines | 3.0 × 10⁻¹⁷ | −2.431 | 245 |
| Cancer, Organismal Injury and Abnormalities | benign neoplasia | 3.5 × 10⁻¹⁷ | −0.029 | 165 |
| Cell Death and Survival | cell survival | 4.7 × 10⁻¹⁷ | −0.537 | 225 |
| Cancer, Organismal Injury and Abnormalities | advanced stage solid tumor | 7.1 × 10⁻¹⁷ | −0.397 | 106 |
| Compound | Score | Compound | Score |
|---|---|---|---|
| 20SOHD3 | −13.3 | 1,20S,23S(OH)3D3 | −16.1 |
| 1,25(OH)2D3 | −13.1 | 1,20S,23R(OH)3D3 | −16.4 |
| 20S,23S(OH)2D3 | −15.1 | 17,20S,23S(OH)3D3 | −14.9 |
| 20S,23R(OH)2D3 | −15.7 | 17,20S,23R(OH)3D3 | −15.4 |
| 1,20S(OH)2D3 | −13.0 |
© 2018 by the authors. Licensee MDPI, Basel, Switzerland. This article is an open access article distributed under the terms and conditions of the Creative Commons Attribution (CC BY) license (http://creativecommons.org/licenses/by/4.0/).
Share and Cite
Slominski, A.T.; Kim, T.-K.; Janjetovic, Z.; Brożyna, A.A.; Żmijewski, M.A.; Xu, H.; Sutter, T.R.; Tuckey, R.C.; Jetten, A.M.; Crossman, D.K. Differential and Overlapping Effects of 20,23(OH)2D3 and 1,25(OH)2D3 on Gene Expression in Human Epidermal Keratinocytes: Identification of AhR as an Alternative Receptor for 20,23(OH)2D3. Int. J. Mol. Sci. 2018, 19, 3072. https://0-doi-org.brum.beds.ac.uk/10.3390/ijms19103072
Slominski AT, Kim T-K, Janjetovic Z, Brożyna AA, Żmijewski MA, Xu H, Sutter TR, Tuckey RC, Jetten AM, Crossman DK. Differential and Overlapping Effects of 20,23(OH)2D3 and 1,25(OH)2D3 on Gene Expression in Human Epidermal Keratinocytes: Identification of AhR as an Alternative Receptor for 20,23(OH)2D3. International Journal of Molecular Sciences. 2018; 19(10):3072. https://0-doi-org.brum.beds.ac.uk/10.3390/ijms19103072
Chicago/Turabian StyleSlominski, Andrzej T., Tae-Kang Kim, Zorica Janjetovic, Anna A. Brożyna, Michal A. Żmijewski, Hui Xu, Thomas R. Sutter, Robert C. Tuckey, Anton M. Jetten, and David K. Crossman. 2018. "Differential and Overlapping Effects of 20,23(OH)2D3 and 1,25(OH)2D3 on Gene Expression in Human Epidermal Keratinocytes: Identification of AhR as an Alternative Receptor for 20,23(OH)2D3" International Journal of Molecular Sciences 19, no. 10: 3072. https://0-doi-org.brum.beds.ac.uk/10.3390/ijms19103072