Histone Hyperacetylation as a Response to Global Brain Ischemia Associated with Hyperhomocysteinemia in Rats


Abstract
:
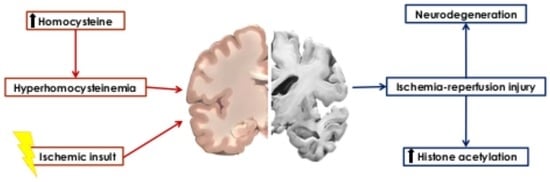
1. Introduction
2. Results
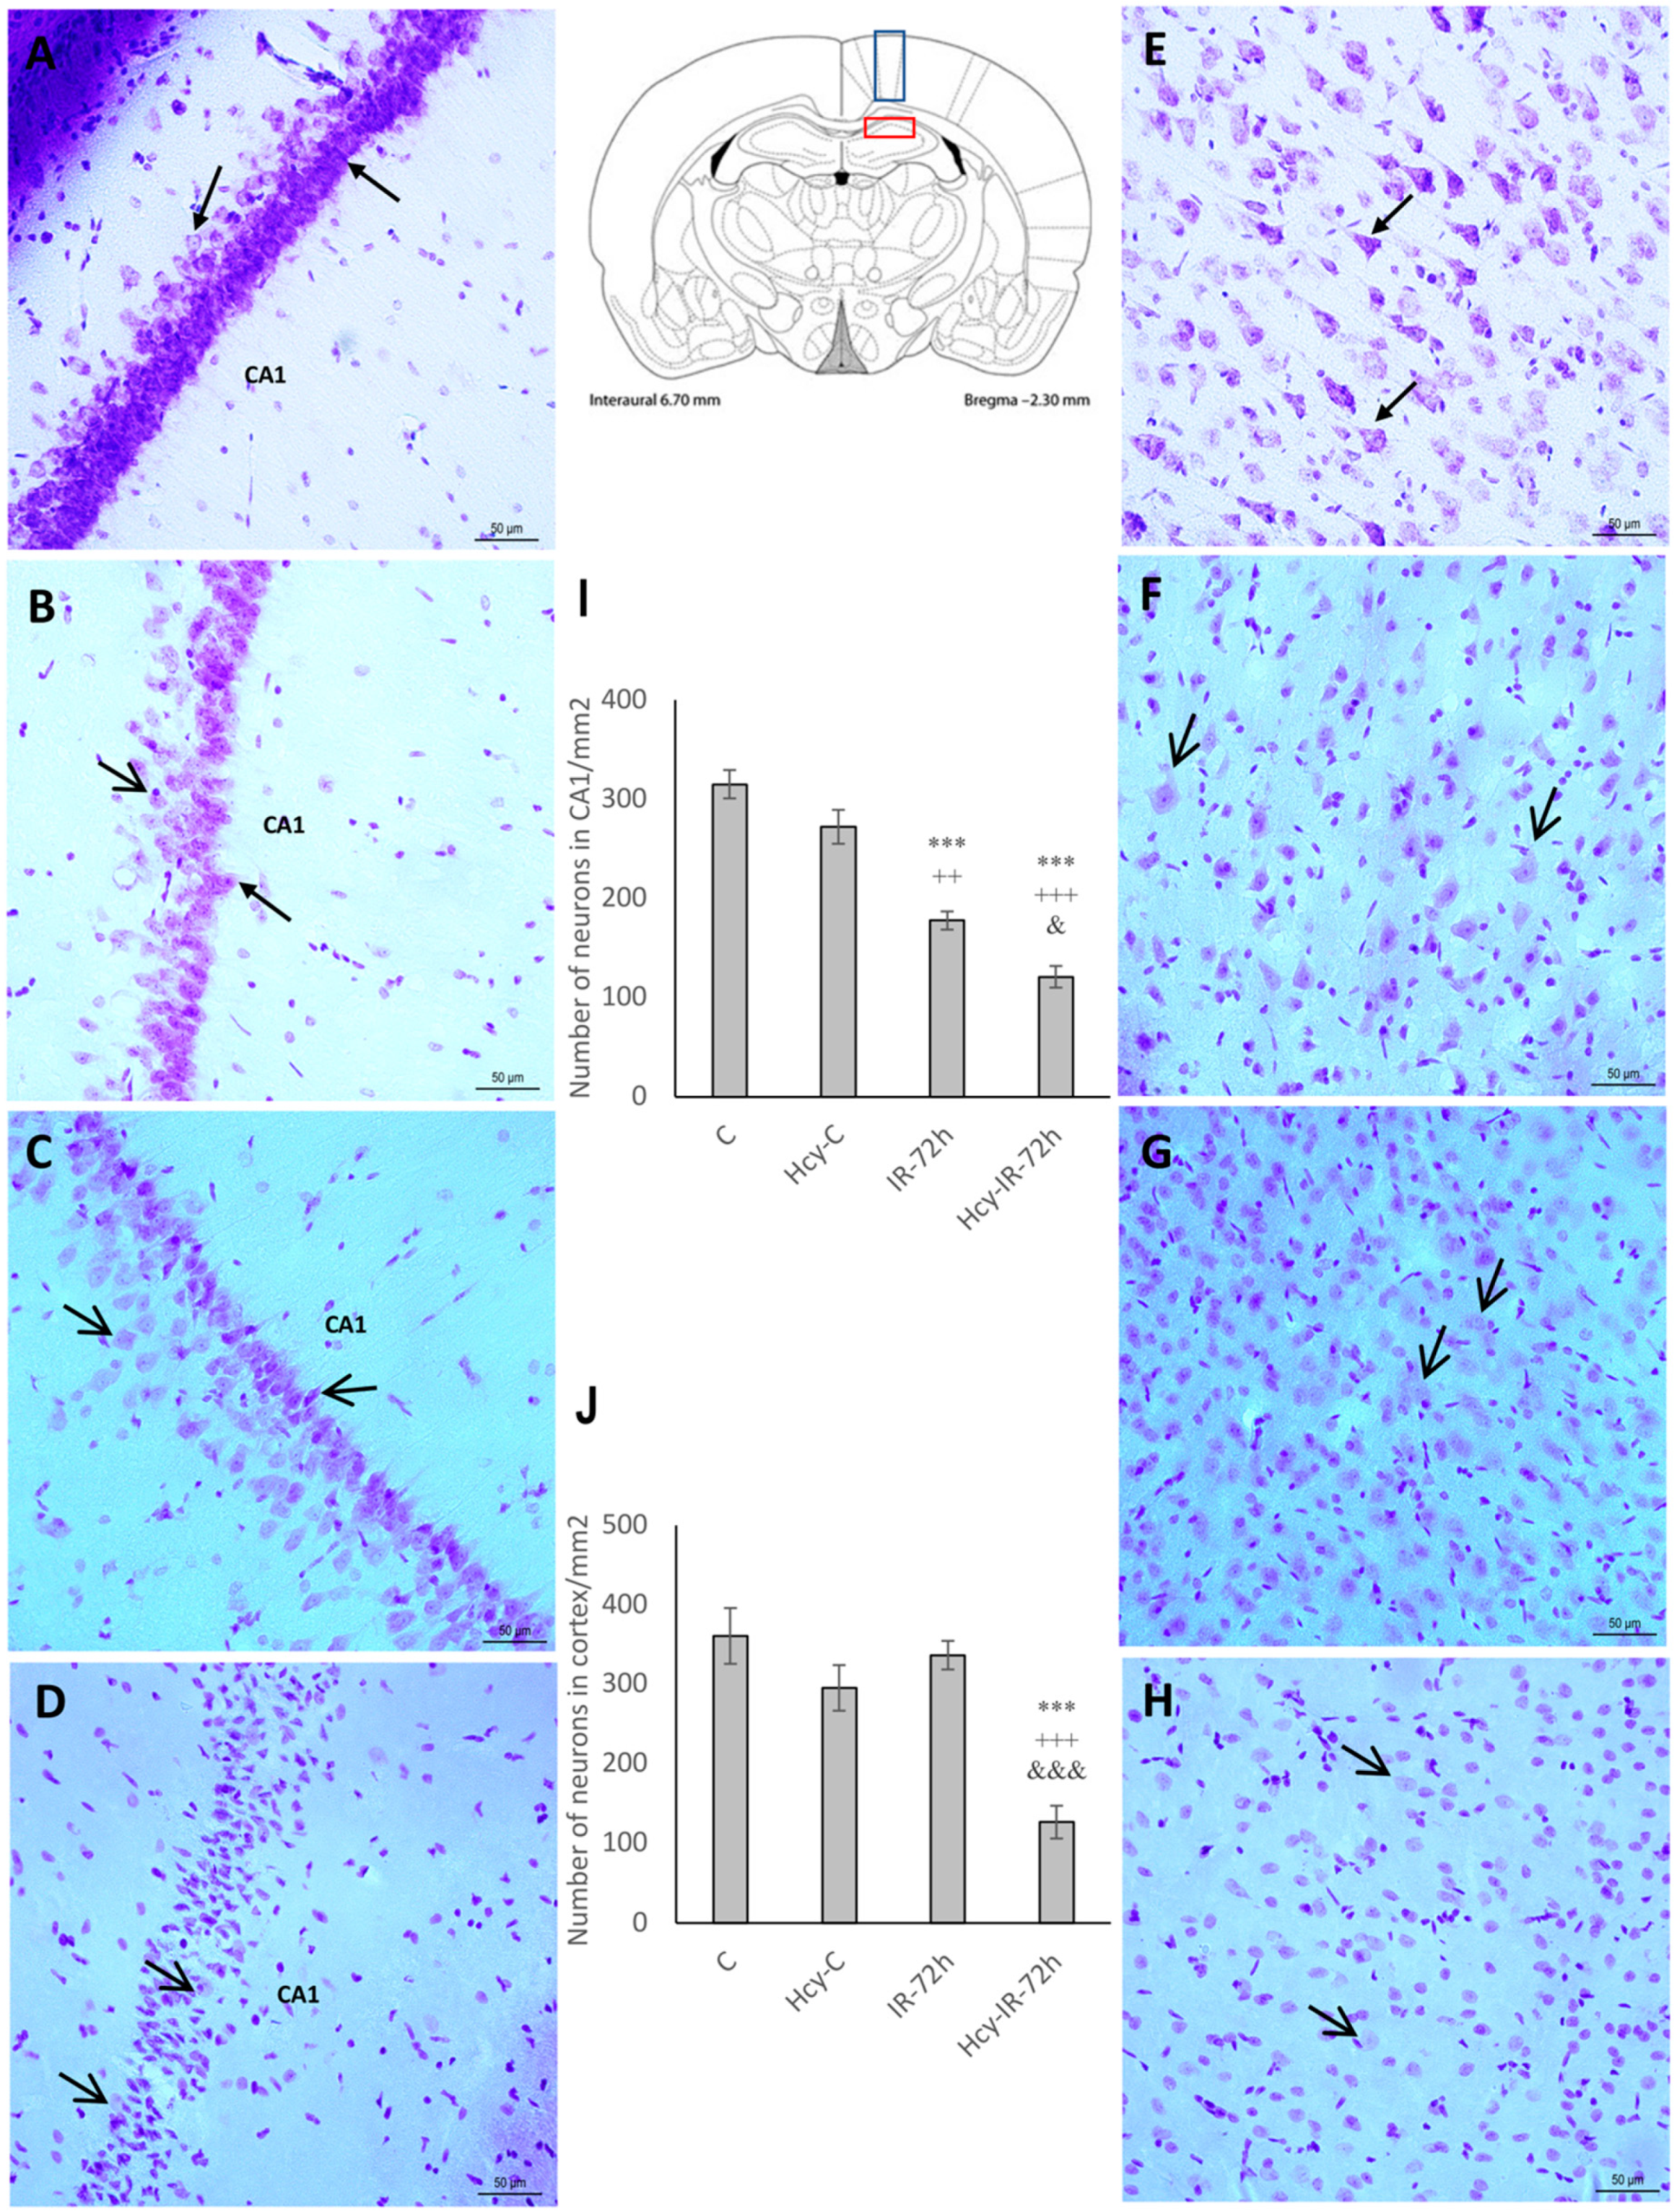
2.1. Cresyl Violet Staining
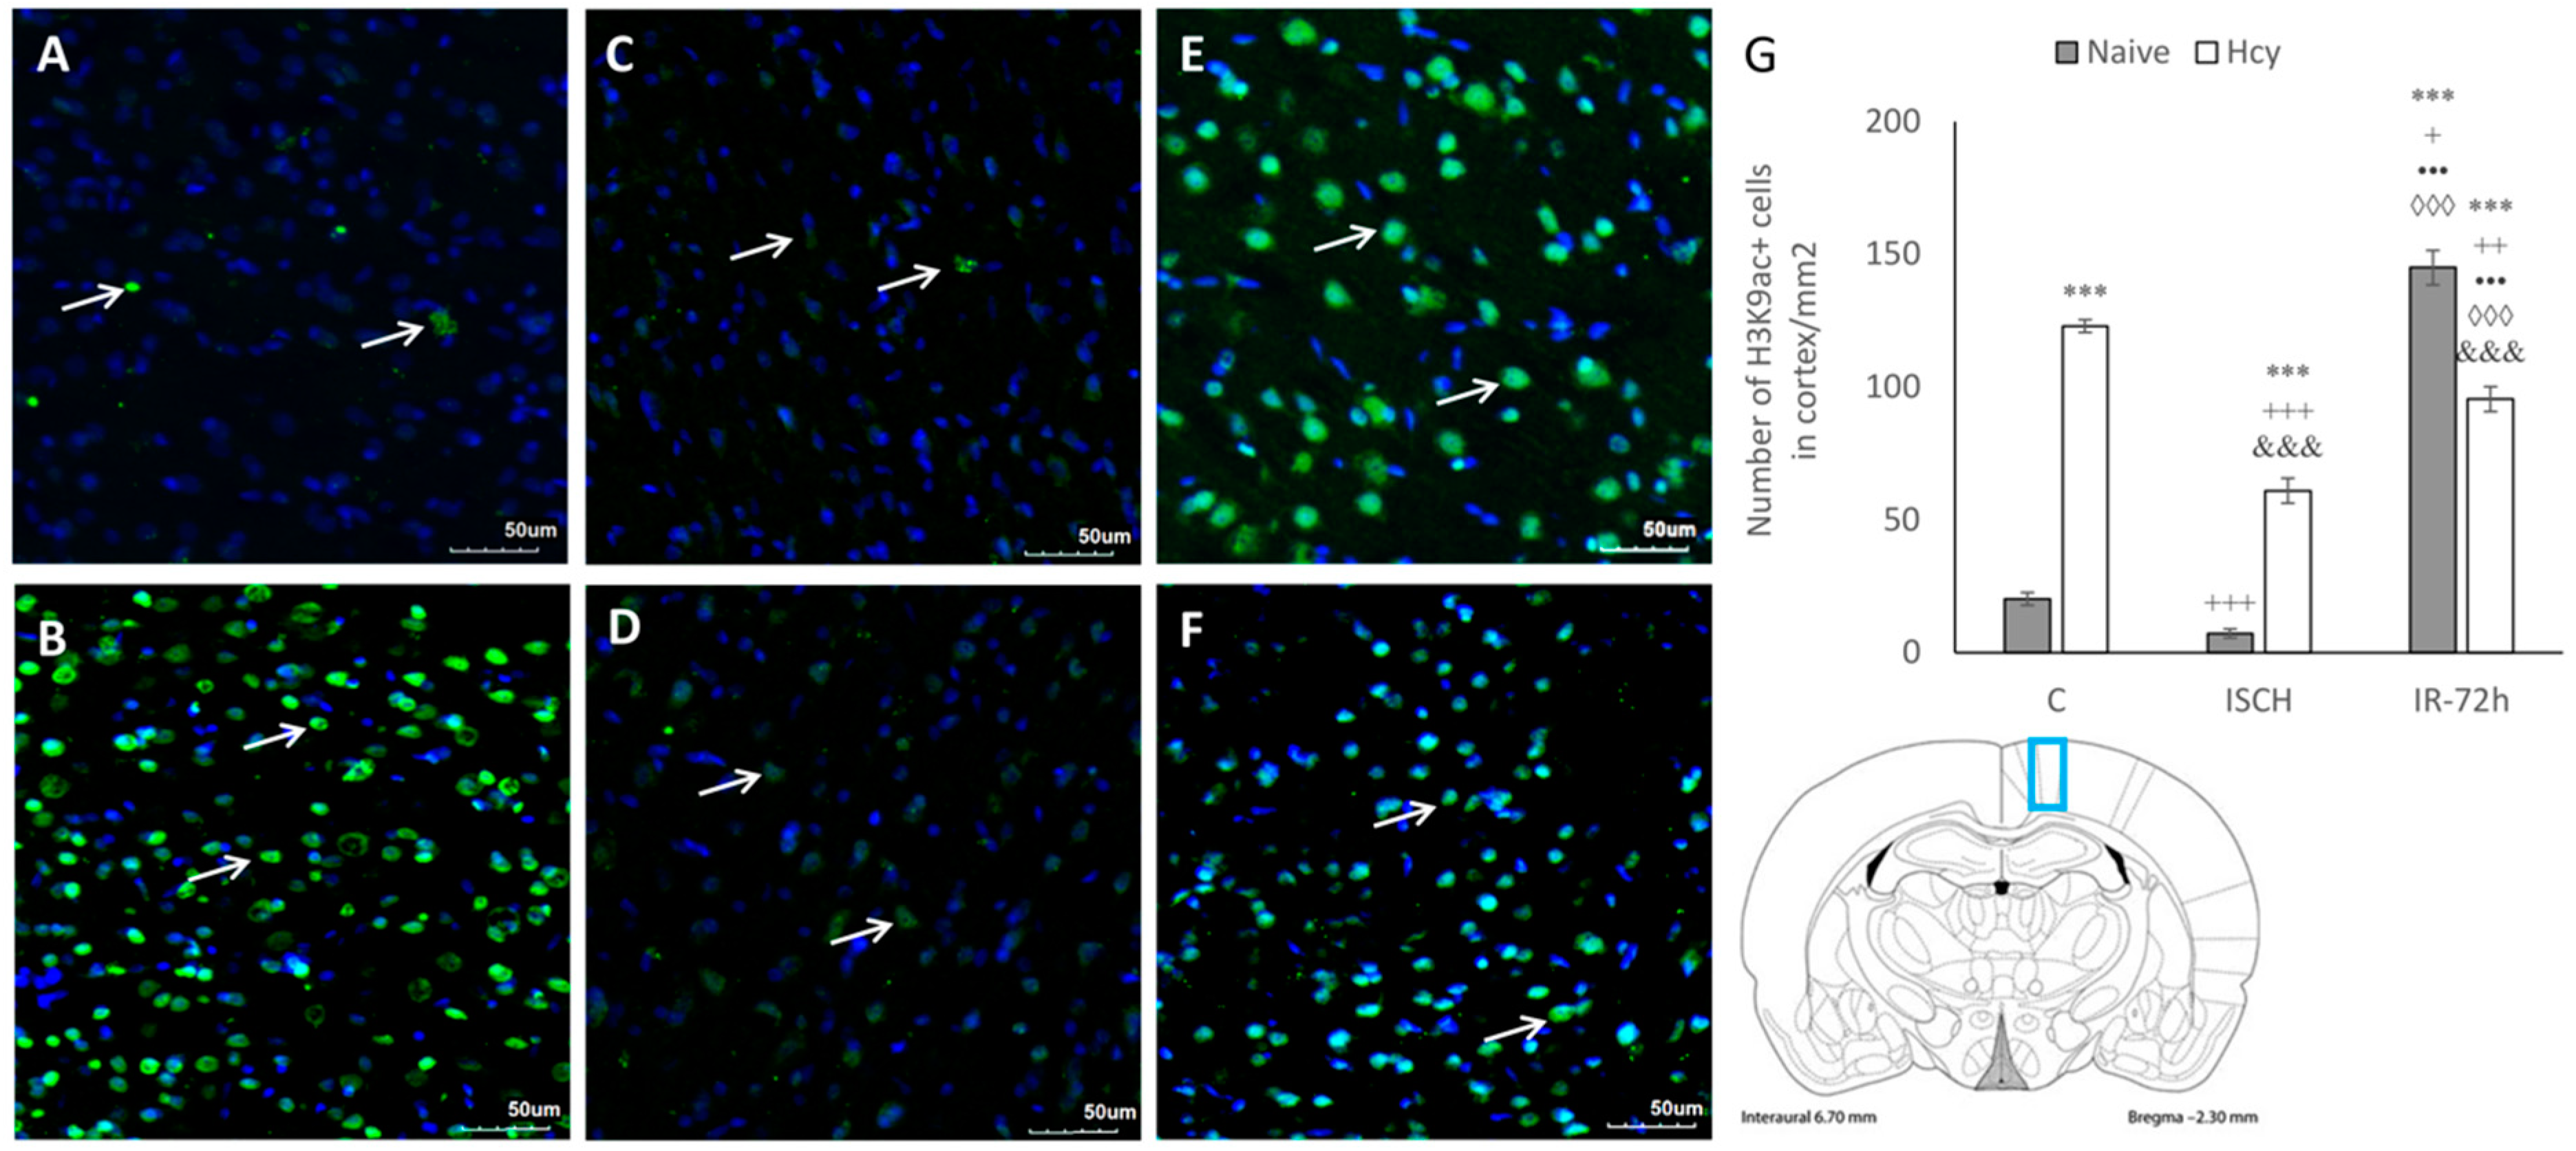
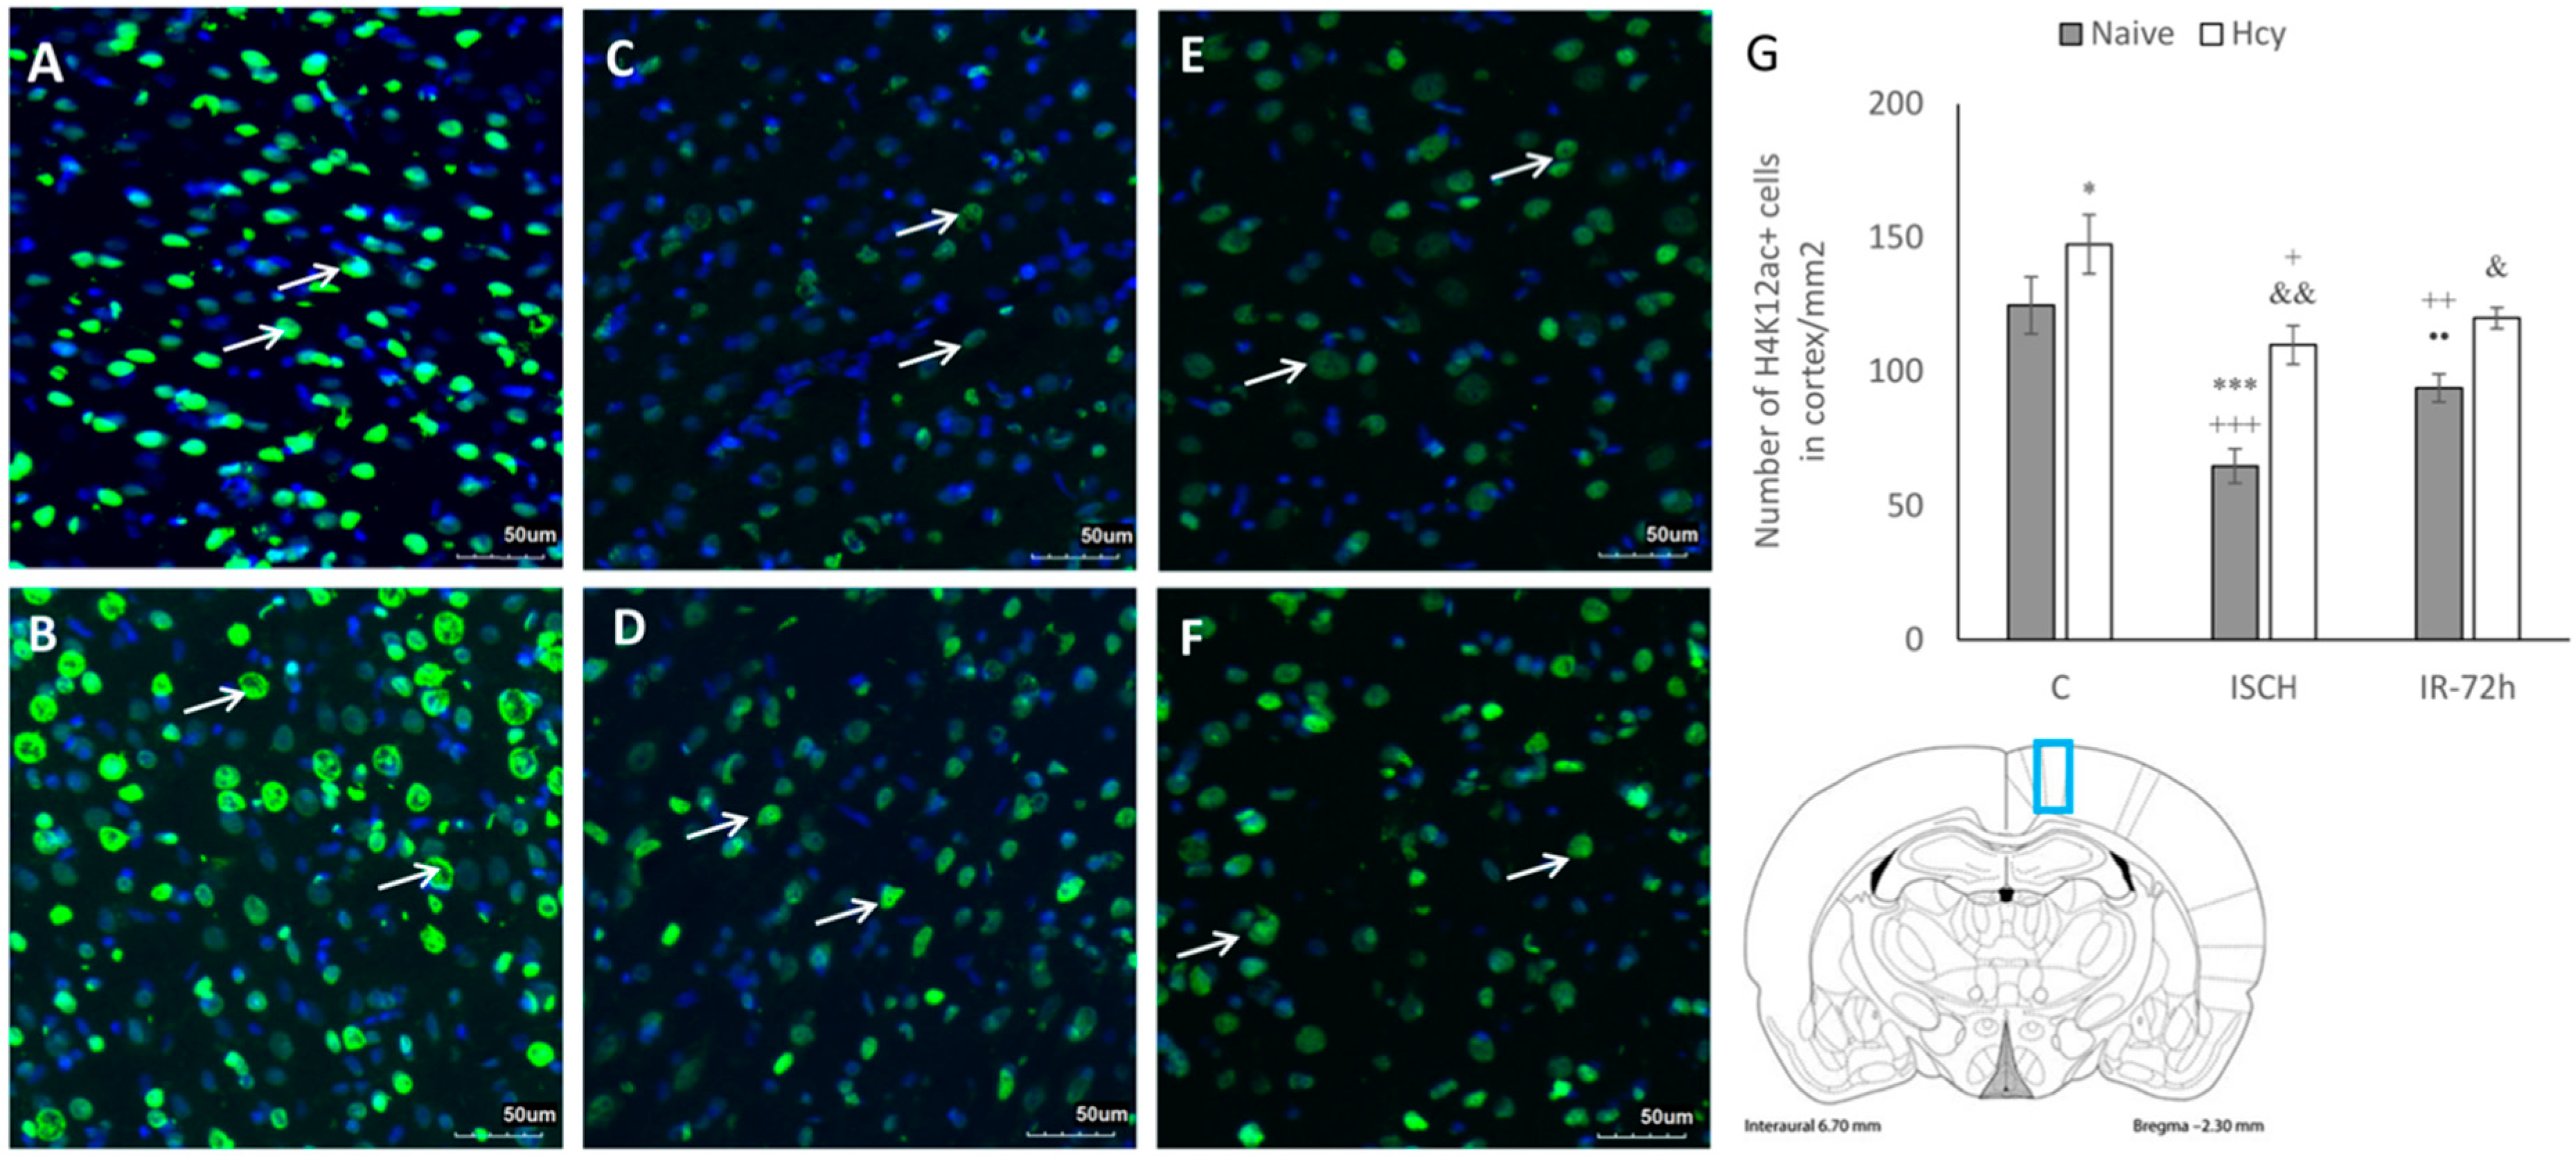
2.2. Immunohistochemical Detection of Acetylated Histone H3 (Lys9) and H4 (Lys12)
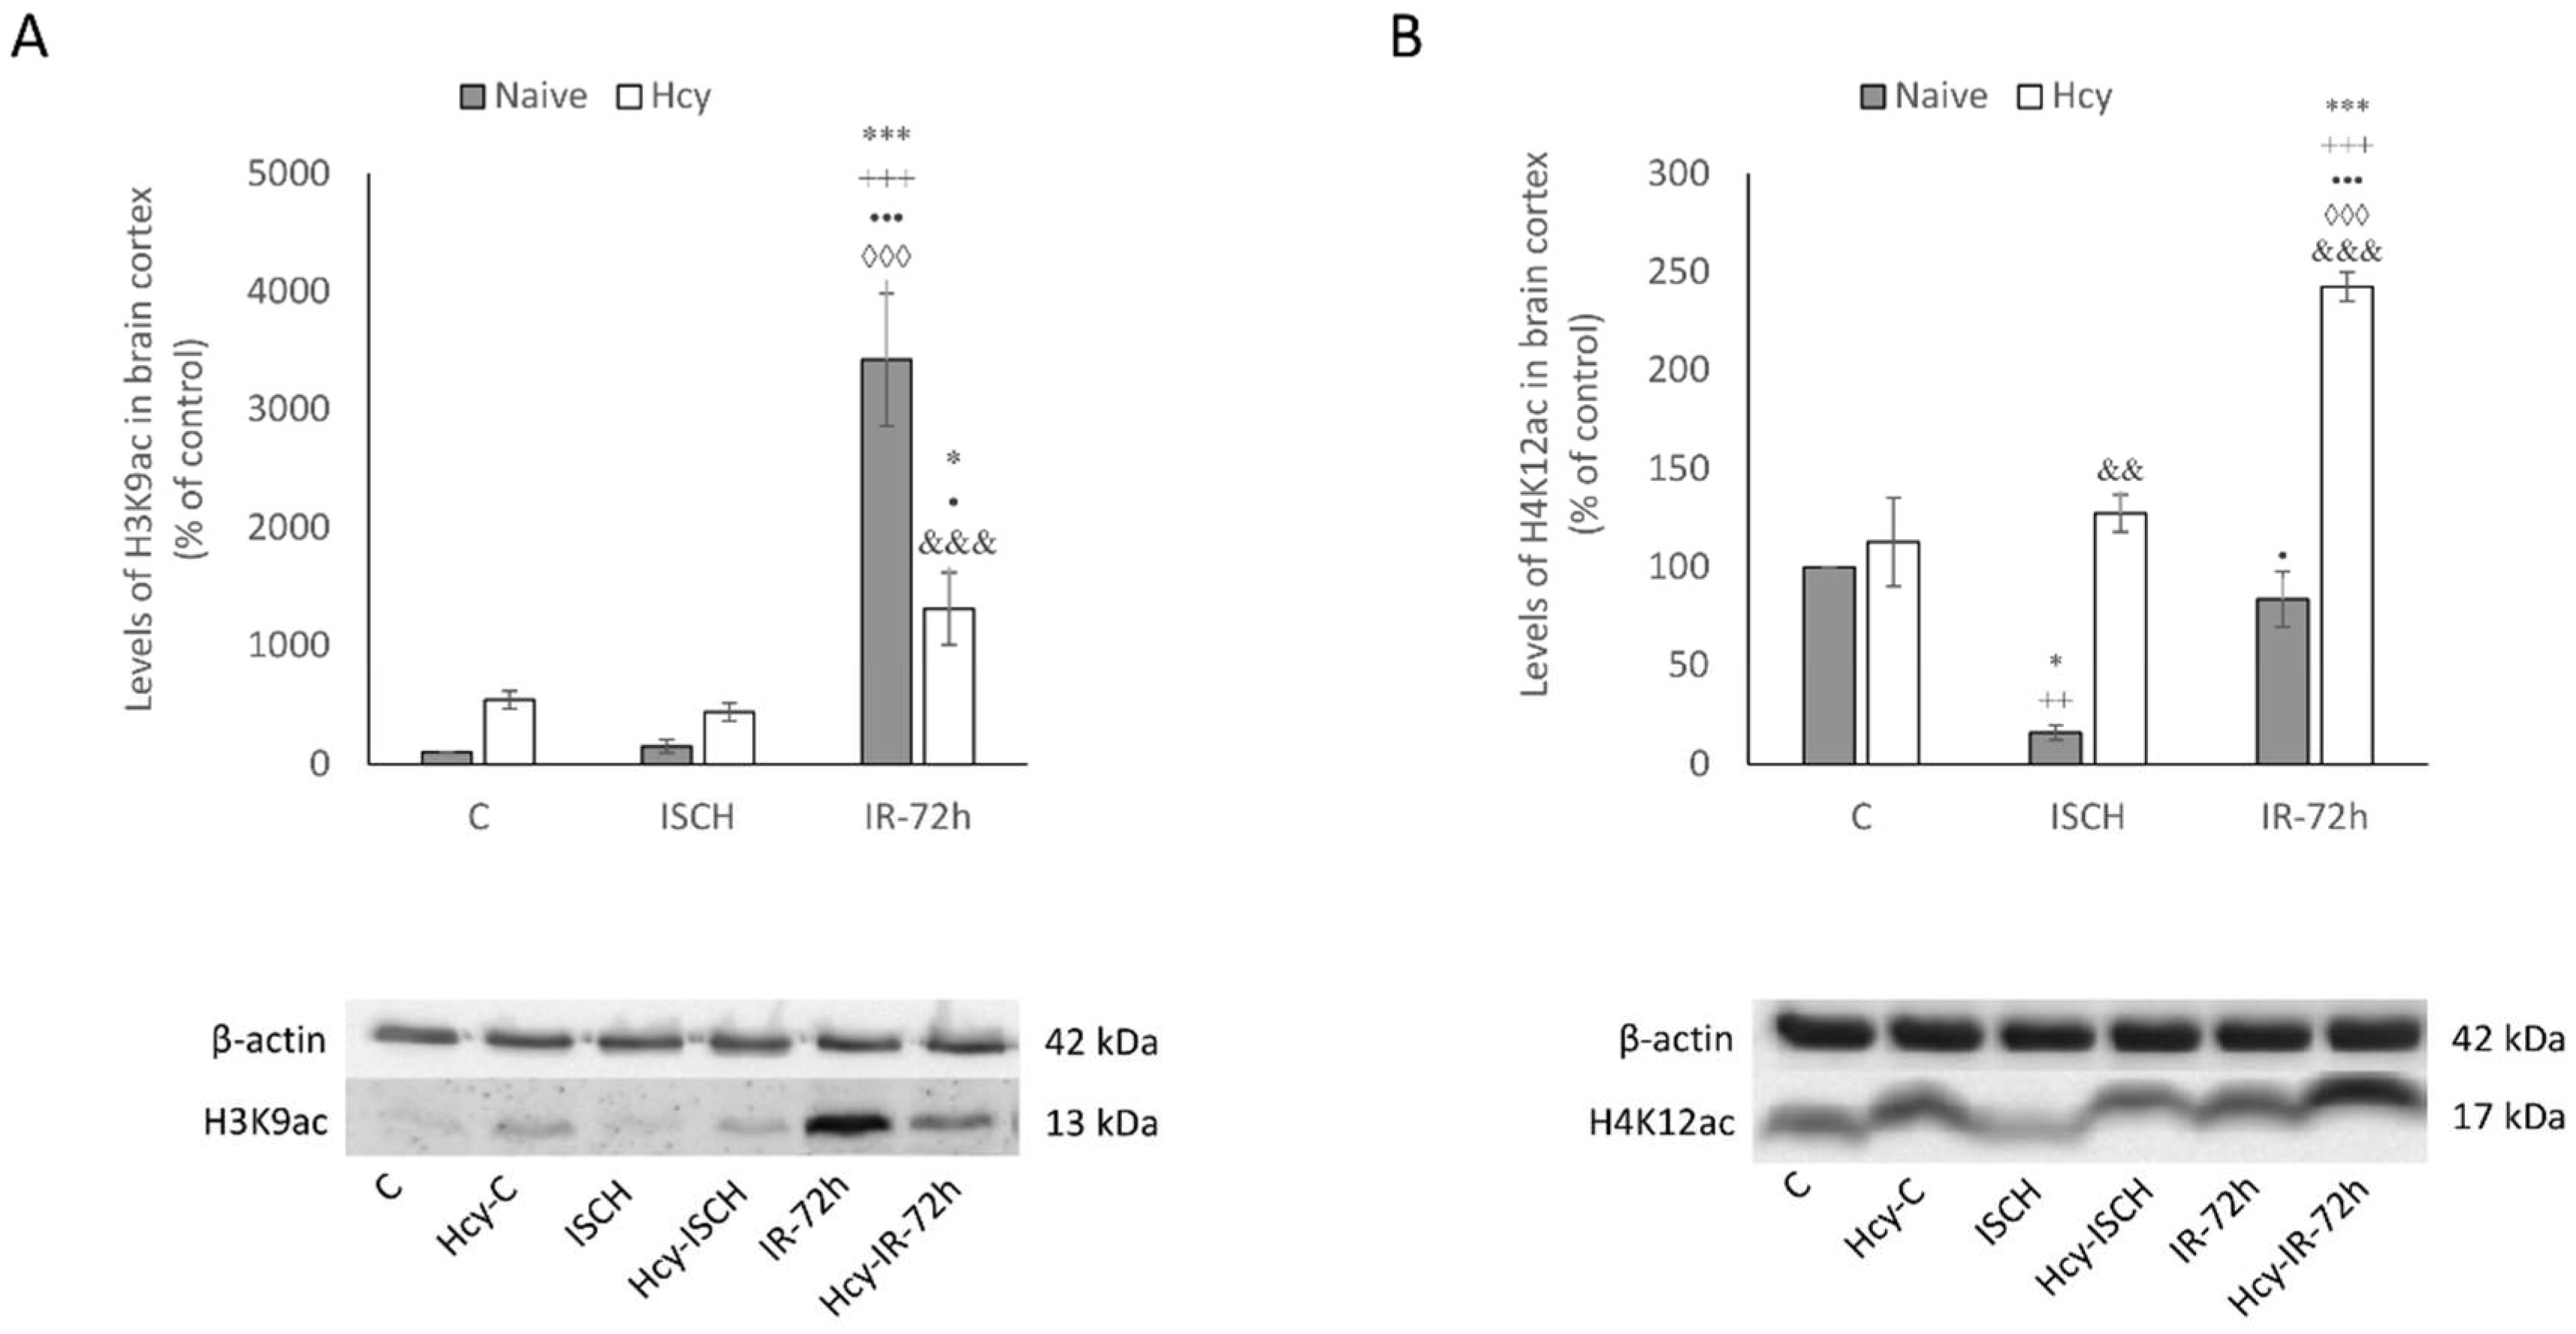
2.3. Detection of H3K9ac and H4K12ac Levels in Cortical Homogenates
3. Discussion
4. Materials and Methods
4.1. Animals and Experimental Design
4.2. Induction of hHcy
4.3. Experimental Groups of Animals
- (1)
- naive control group (C)
- (2)
- hHcy control group (Hcy-C)
- (3)
- naive animals that underwent 15 min ischemia without reperfusion (ISCH)
- (4)
- the animals after 21 days with induced hHcy that underwent 15 min ischemia without reperfusion (Hcy-ISCH)
- (5)
- naive group of animals with 15 min of ischemia followed by 72 h of reperfusion (IR-72h)
- (6)
- the animals after 21 days with induced hHcy that underwent 15 min ischemia and 72 h of reperfusion (Hcy-IR-72h)
4.4. Cresyl Violet Staining
4.5. Detection of Acetylated Histones by Fluorescent Immunohistochemistry
4.6. Tissue Homogenates Preparation and Immunodetection
4.7. Quantitative Image Analysis
4.8. Data Analysis
Author Contributions
Funding
Acknowledgments
Conflicts of Interest
Abbreviations
| BBB | Blood-brain barrier |
| CA1 | Cornu ammonis 1 |
| H3K9ac | Acetylated histone H3 at lysine 9 |
| H4K12ac | Acetylated histone H4 at lysine 12 |
| HAT | Histone acetyltransferase |
| Hcy | Homocysteine |
| HDAC | Histone deacetylase |
| hHcy | Hyperhomocysteinemia |
| IRI | Ischemia-reperfusion injury |
| M1 | Primary motor cortex |
| ROS | Reactive oxygen species |
| SAH | S-adenosylhomocysteine |
| SAM | S-adenosylmethionine |
References
- Gräff, J.; Woldemichael, B.T.; Berchtold, D.; Dewarrat, G.; Mansuy, I.M. Dynamic histone marks in the hippocampus and cortex facilitate memory consolidation. Nat. Commun. 2012, 3, 991. [Google Scholar] [CrossRef] [PubMed] [Green Version]
- Rudenko, A.; Tsai, L.H. Epigenetic regulation in memory and cognitive disorders. Neuroscience 2014, 264, 51–63. [Google Scholar] [CrossRef] [PubMed]
- Handy, D.E.; Castro, R.; Loscalzo, J. Epigenetic modifications: Basic mechanisms and role in cardiovascular disease. Circulation 2011, 123, 2145–2156. [Google Scholar] [CrossRef] [PubMed]
- Caplakova, V.; Babusikova, E.; Blahovcova, E.; Balharek, T.; Zelieskova, M.; Hatok, J. DNA methylation machinery in the endometrium and endometrial cancer. Anticancer Res. 2016, 36, 4407–4420. [Google Scholar] [CrossRef] [PubMed]
- Kalani, A.; Kamat, P.K.; Tyagi, S.C.; Tyagi, N. Synergy of homocysteine, microRNA, and epigenetics: A novel therapeutic approach for stroke. Mol. Neurobiol. 2013, 48, 157–168. [Google Scholar] [CrossRef] [PubMed]
- Mandaviya, P.R.; Stolk, L.; Heil, S.G. Homocysteine and DNA methylation: A review of animal and human literature. Mol. Genet. Metab. 2014, 113, 243–252. [Google Scholar] [CrossRef] [PubMed]
- Lehotsky, J.; Petras, M.; Kovalska, M.; Tothova, B.; Drgova, A.; Kaplan, P. Mechanisms involved in the ischemic tolerance in brain: Effect of the homocysteine. Cell. Mol. Neurobiol. 2015, 35, 7–15. [Google Scholar] [CrossRef] [PubMed]
- Loscalzo, J.; Handy, D.E. Epigenetic modifications: Basic mechanisms and role in cardiovascular disease (2013 Grover Conference series). Pulm. Circ. 2014, 4, 169–174. [Google Scholar] [CrossRef] [PubMed] [Green Version]
- Škovierová, H.; Vidomanová, E.; Mahmood, S.; Sopková, J.; Drgová, A.; Červeňová, T.; Lehotský, J. The molecular and cellular effect of homocysteine metabolism imbalance on human health. Int. J. Mol. Sci. 2016, 17, 1733. [Google Scholar] [CrossRef] [PubMed]
- Di Meco, A.; Li, J.G.; Barrero, C.; Merali, S.; Praticò, D. Elevated levels of brain homocysteine directly modulate the pathological phenotype of a mouse model of tauopathy. Mol. Psychiatr. 2018. [Google Scholar] [CrossRef] [PubMed]
- Lee, M.E.; Wang, H. Homocysteine and hypomethylation: A novel link to vascular disease. Trends Cardiovasc. Med. 1999, 9, 49–54. [Google Scholar] [CrossRef]
- Yi, P.; Melnyk, S.; Pogribna, M.; Pogribny, I.P.; Hine, R.J.; James, S.J. Increase in plasma homocysteine associated with parallel increases in plasma S-adenosylhomocysteine and lymphocyte DNA hypomethylation. J. Biol. Chem. 2000, 275, 29318–29323. [Google Scholar] [CrossRef] [PubMed]
- Jiang, Y.; Sun, T.; Xiong, J.; Cao, J.; Li, G.; Wang, S. Hyperhomocysteinemia-mediated DNA hypomethylation and its potential epigenetic role in rats. Acta Biochim. Biophys. Sin. 2007, 39, 657–667. [Google Scholar] [CrossRef] [PubMed]
- Ganguly, P.; Alam, S.F. Role of homocysteine in the development of cardiovascular disease. Nutr. J. 2015, 14, 6. [Google Scholar] [CrossRef] [PubMed] [Green Version]
- Nan, X.; Ng, H.H.; Johnson, C.A.; Laherty, C.D.; Turner, B.M.; Eisenman, R.N.; Bird, A. Transcriptional repression by the methyl-CpG-binding protein MeCP2 involves a histone deacetylase complex. Nature 1998, 393, 386–389. [Google Scholar] [CrossRef] [PubMed]
- Jamaluddin, M.S.; Chen, I.; Yang, F.; Jiang, X.; Jan, M.; Liu, X.; Wang, H. Homocysteine inhibits endothelial cell growth via DNA hypomethylation of the cyclin A gene. Blood 2007, 110, 3648–3655. [Google Scholar] [CrossRef] [PubMed]
- Mikael, L.G.; Genest, J.; Rozen, R. Elevated homocysteine reduces apolipoprotein AI expression in hyperhomocysteinemic mice and in males with coronary artery disease. Circ. Res. 2006, 98, 564–571. [Google Scholar] [CrossRef] [PubMed]
- Kim, C.S.; Kim, Y.R.; Naqvi, A.; Kumar, S.; Hoffman, T.A.; Jung, S.B.; Irani, K. Homocysteine promotes human endothelial cell dysfunction via site-specific epigenetic regulation of p66shc. Cardiovasc. Res. 2011, 92, 466–475. [Google Scholar] [CrossRef] [PubMed] [Green Version]
- He, Y.; Li, Y.; Chen, Y.; Feng, L.; Nie, Z. Homocysteine level and risk of different stroke types: A meta-analysis of prospective observational studies. Nutr. Metab. Cardiovasc. Dis. 2014, 24, 1158–1165. [Google Scholar] [CrossRef] [PubMed]
- Kwon, H.M.; Lee, Y.S.; Bae, H.J.; Kang, D.W. Homocysteine as a predictor of early neurological deterioration in acute ischemic stroke. Stroke 2014, 45, 871–873. [Google Scholar] [CrossRef] [PubMed]
- Iacobazzi, V.; Infantino, V.; Castegna, A.; Andria, G. Hyperhomocysteinemia: Related genetic diseases and congenital defects, abnormal DNA methylation and newborn screening issues. Mol. Genet. Metab. 2014, 113, 27–33. [Google Scholar] [CrossRef] [PubMed]
- Endres, M.; Meisel, A.; Biniszkiewicz, D.; Namura, S.; Prass, K.; Ruscher, K.; Dirnagl, U. DNA methyltransferase contributes to delayed ischemic brain injury. J. Neurosci. 2000, 20, 3175–3181. [Google Scholar] [CrossRef] [PubMed]
- Endres, M.; Fan, G.; Meisel, A.; Dirnagl, U.; Jaenisch, R. Effects of cerebral ischemia in mice lacking DNA methyltransferase 1 in post-mitotic neurons. Neuroreport 2001, 12, 3763–3766. [Google Scholar] [CrossRef] [PubMed]
- Faraco, G.; Pancani, T.; Formentini, L.; Mascagni, P.; Fossati, G.; Leoni, F.; Chiarugi, A. Pharmacological inhibition of histone deacetylases (HDACs) by suberoylanilide hydroxamic acid (SAHA) specifically alters gene expression and reduces ischemic injury in the mouse brain. Mol. Pharmacol. 2006, 70, 1876–1884. [Google Scholar] [CrossRef] [PubMed]
- Xuan, A.; Long, D.; Li, J.; Ji, W.; Hong, L.; Zhang, M.; Zhang, W. Neuroprotective effects of valproic acid following transient global ischemia in rats. Life Sci. 2012, 90, 463–468. [Google Scholar] [CrossRef] [PubMed]
- Kassis, H.; Shehadah, A.; Li, C.; Zhang, Y.; Cui, Y.; Roberts, C.; Sadry, N.; Liu, X.; Chopp, M.; Zhang, Z.G. Class IIa histone deacetylases affect neuronal remodeling and functional outcome after stroke. Neurochem. Int. 2016, 96, 24–31. [Google Scholar] [CrossRef] [PubMed] [Green Version]
- Wang, Z.; Zang, C.; Rosenfeld, J.A.; Schones, D.E.; Barski, A.; Cuddapah, S.; Cui, K.; Roh, T.; Peng, W.; Zhang, M.Q.; et al. Combinatorial patterns of histone acetylations and methylations in the human genome. Nat. Genet. 2008, 40, 897. [Google Scholar] [CrossRef] [PubMed]
- Patnala, R.; Arumugam, T.V.; Gupta, N.; Dheen, S.T. HDAC inhibitor sodium butyrate-mediated epigenetic regulation enhances neuroprotective function of microglia during ischemic stroke. Mol. Neurobiol. 2017, 54, 6391–6411. [Google Scholar] [CrossRef] [PubMed]
- Ng, G.Y.Q.; Yun-An, L.; Sobey, C.G.; Dheen, T.; Fann, D.Y.W.; Arumugam, T.V. Epigenetic regulation of inflammation in stroke. Ther. Adv. Neurol. Disord. 2018, 11, 1756286418771815. [Google Scholar] [CrossRef] [PubMed]
- Thompson, P.M.; Toga, A.W. Cerebral cortex diseases and cortical localization. eLS 2003. [Google Scholar] [CrossRef]
- Kovalska, M.; Kovalska, L.; Tothova, B.; Mahmood, S.; Adamkov, M.; Lehotsky, J. Combination of hyperhomocysteinemia and ischemic tolerance in experimental model of global ischemia in rats. J. Physiol. Pharmacol. 2015, 66, 887–897. [Google Scholar] [PubMed]
- Petráš, M.; Drgová, A.; Kovalská, M.; Tatarková, Z.; Tóthová, B.; Križanová, O.; Lehotský, J. Effect of hyperhomocysteinemia on redox balance and redox defence enzymes in ischemia-reperfusion injury and/or after ischemic preconditioning in rats. Cell. Mol. Neurobiol. 2017, 37, 1417–1431. [Google Scholar] [CrossRef] [PubMed]
- Kovalska, M.; Tothova, B.; Kovalska, L.; Tatarkova, Z.; Kalenska, D.; Tomascova, A.; Lehotsky, J. Association of induced hyperhomocysteinemia with Alzheimer’s disease-like neurodegeneration in rat cortical neurons after global ischemia-reperfusion injury. Neurochem. Res. 2018, 43, 1766–1778. [Google Scholar] [CrossRef] [PubMed]
- Paxinos, G.; Watson, C. The Rat Brain in Stereotaxic Coordinates: Hard Cover Edition, 6th ed.; Academic Press: London, UK, 2006; ISBN 0125476124. [Google Scholar]
- Hwang, J.Y.; Aromolaran, K.A.; Zukin, R.S. Epigenetic mechanisms in stroke and epilepsy. Neuropsychopharmacology 2013, 38, 167–182. [Google Scholar] [CrossRef] [PubMed]
- Schweizer, S.; Meisel, A.; Märschenz, S. Epigenetic mechanisms in cerebral ischemia. J. Cereb. Blood Flow Metab. 2013, 33, 1335–1346. [Google Scholar] [CrossRef] [PubMed]
- Hu, Z.; Zhong, B.; Tan, J.; Chen, C.; Lei, Q.; Zeng, L. The emerging role of epigenetics in cerebral ischemia. Mol. Neurobiol. 2017, 54, 1887–1905. [Google Scholar] [CrossRef] [PubMed]
- Streck, E.L.; Matte, C.; Vieira, P.S.; Rombaldi, F.; Wannmacher, C.M.; Wajner, M.; Wyse, A.T. Reduction of Na+, K+-ATPase activity in hippocampus of rats subjected to chemically induced hyperhomocysteinemia. Neurochem. Res. 2002, 27, 1593–1598. [Google Scholar] [CrossRef] [PubMed]
- Jin, Y.; Amaral, A.; McCann, A.; Brennan, L. Homocysteine levels impact directly on epigenetic reprogramming in astrocytes. Neurochem. Int. 2011, 58, 833–838. [Google Scholar] [CrossRef] [PubMed]
- Zhao, H.; Han, Z.; Ji, X.; Luo, Y. Epigenetic regulation of oxidative stress in ischemic stroke. Aging Dis. 2016, 7, 295. [Google Scholar] [CrossRef] [PubMed]
- James, S.J.; Melnyk, S.; Pogribna, M.; Pogribny, I.P.; Caudill, M.A. Elevation in S-adenosylhomocysteine and DNA hypomethylation: Potential epigenetic mechanism for homocysteine-related pathology. J. Nutr. 2002, 132, 2361S–2366S. [Google Scholar] [CrossRef] [PubMed]
- Tu, F.; Pang, Q.; Huang, T.; Zhao, Y.; Liu, M.; Chen, X. Apigenin ameliorates post-stroke cognitive deficits in rats through histone acetylation-mediated neurochemical alterations. Med. Sci. Monit. 2017, 23, 4004–4013. [Google Scholar] [CrossRef] [PubMed]
- Samoilov, M.; Churilova, A.; Gluschenko, T.; Vetrovoy, O.; Dyuzhikova, N.; Rybnikova, E. Acetylation of histones in neocortex and hippocampus of rats exposed to different modes of hypobaric hypoxia: Implications for brain hypoxic injury and tolerance. Acta Histochem. 2016, 2016 118, 80–89. [Google Scholar] [CrossRef]
- Kim, H.J.; Leeds, P.; Chuang, D.M. The HDAC inhibitor, sodium butyrate, stimulates neurogenesis in the ischemic brain. J. Neurochem. 2009, 110, 1226–1240. [Google Scholar] [CrossRef] [PubMed] [Green Version]
- Ren, M.; Leng, Y.; Jeong, M.; Leeds, P.R.; Chuang, D.M. Valproic acid reduces brain damage induced by transient focal cerebral ischemia in rats: Potential roles of histone deacetylase inhibition and heat shock protein induction. J. Neurochem. 2004, 89, 1358–1367. [Google Scholar] [CrossRef] [PubMed]
- Xu, L.; Chen, J.; Gao, J.; Yu, H.; Yang, P. Crosstalk of homocysteinylation, methylation and acetylation on histone H3. Analyst 2015, 140, 3057–3063. [Google Scholar] [CrossRef] [PubMed]
- Weekman, E.M.; Woolums, A.E.; Sudduth, T.L.; Wilcock, D.M. Hyperhomocysteinemia-induced gene expression changes in the cell types of the brain. ASN Neuro 2017, 9, 1759091417742296. [Google Scholar] [CrossRef] [PubMed]
- Sudduth, T.L.; Powell, D.K.; Smith, C.D.; Greenstein, A.; Wilcock, D.M. Induction of hyperhomocysteinemia models vascular dementia by induction of cerebral microhemorrhages and neuroinflammation. J. Cereb. Blood Flow Metab. 2013, 33, 708–715. [Google Scholar] [CrossRef] [PubMed]
- Sudduth, T.L.; Weekman, E.M.; Price, B.R.; Gooch, J.L.; Woolums, A.; Norris, C.M.; Wilcock, D.M. Time-course of glial changes in the hyperhomocysteinemia model of vascular cognitive impairment and dementia (VCID). Neuroscience 2017, 341, 42–51. [Google Scholar] [CrossRef] [PubMed] [Green Version]
- Kim, H.J.; Rowe, M.; Ren, M.; Hong, J.S.; Chen, P.S.; Chuang, D.M. Histone deacetylase inhibitors exhibit anti-inflammatory and neuroprotective effects in a rat permanent ischemic model of stroke: Multiple mechanisms of action. J. Pharmacol. Exp. Ther. 2007, 321, 892–901. [Google Scholar] [CrossRef] [PubMed]
- Yildirim, F.; Ji, S.; Kronenberg, G.; Barco, A.; Olivares, R.; Benito, E.; Meisel, A. Histone acetylation and CREB binding protein are required for neuronal resistance against ischemic injury. PLoS ONE 2014, 9, e95465. [Google Scholar] [CrossRef] [PubMed]
- Sutendra, G.; Kinnaird, A.; Dromparis, P.; Paulin, R.; Stenson, T.H.; Haromy, A.; Michelakis, E.D. A nuclear pyruvate dehydrogenase complex is important for the generation of acetyl-CoA and histone acetylation. Cell 2014, 158, 84–97. [Google Scholar] [CrossRef] [PubMed]
- Fan, J.; Krautkramer, K.A.; Feldman, J.L.; Denu, J.M. Metabolic regulation of histone post-translational modifications. ACS Chem. Biol. 2015, 10, 95. [Google Scholar] [CrossRef] [PubMed]
- Su, X.; Wellen, K.E.; Rabinowitz, J.D. Metabolic control of methylation and acetylation. Curr. Opin. Chem. Biol. 2016, 30, 52–60. [Google Scholar] [CrossRef] [PubMed] [Green Version]
- Niu, Y.; DesMarais, T.L.; Tong, Z.; Yao, Y.; Costa, M. Oxidative stress alters global histone modification and DNA methylation. Free Radic. Biol. Med. 2015, 82, 22–28. [Google Scholar] [CrossRef] [PubMed] [Green Version]
- Kietzmann, T.; Petry, A.; Shvetsova, A.; Gerhold, J.M.; Görlach, A. The epigenetic landscape related to reactive oxygen species formation in the cardiovascular system. Br. J. Pharmacol. 2017, 174, 1533–1554. [Google Scholar] [CrossRef] [PubMed] [Green Version]
- Frost, B.; Hemberg, M.; Lewis, J.; Feany, M.B. Tau promotes neurodegeneration through global chromatin relaxation. Nat. Neurosci. 2014, 17, 357. [Google Scholar] [CrossRef] [PubMed] [Green Version]
- Wu, J.; Bie, B.; Yang, H.; Xu, J.J.; Brown, D.L.; Naguib, M. Suppression of central chemokine fractalkine receptor signaling alleviates amyloid-induced memory deficiency. Neurobiol. Aging 2013, 34, 2843–2852. [Google Scholar] [CrossRef] [PubMed]
- Rao, J.S.; Keleshian, V.L.; Klein, S.; Rapoport, S.I. Epigenetic modifications in frontal cortex from Alzheimer’s disease and bipolar disorder patients. Transl. Psychiatry 2012, 2, e132. [Google Scholar] [CrossRef] [PubMed]
- Leon, M.; Sawmiller, D.; Shytle, R.D.; Tan, J. Therapeutic cocktail approach for treatment of hyperhomocysteinemia in Alzheimer’s disease. Cell Med. 2018, 10, 2155179017722280. [Google Scholar] [CrossRef]
- Nativio, R.; Donahue, G.; Berson, A.; Lan, Y.; Amlie-Wolf, A.; Tuzer, F.; Trojanowski, J.Q. Dysregulation of the epigenetic landscape of normal aging in Alzheimer’s disease. Nat. Neurosci. 2018, 21, 497. [Google Scholar] [CrossRef] [PubMed]
- Lithner, C.U.; Lacor, P.N.; Zhao, W.Q.; Mustafiz, T.; Klein, W.L.; Sweatt, J.D.; Hernandez, C.M. Disruption of neocortical histone H3 homeostasis by soluble Aβ: Implications for Alzheimer’s disease. Neurobiol. Aging 2013, 34, 2081–2090. [Google Scholar] [CrossRef] [PubMed]
- Gu, X.; Sun, J.; Li, S.; Wu, X.; Li, L. Oxidative stress induces DNA demethylation and histone acetylation in SH-SY5Y cells: Potential epigenetic mechanisms in gene transcription in Aβ production. Neurobiol. Aging 2013, 34, 1069–1079. [Google Scholar] [CrossRef] [PubMed]
- Narayan, P.J.; Lill, C.; Faull, R.; Curtis, M.A.; Dragunow, M. Increased acetyl and total histone levels in post-mortem Alzheimer’s disease brain. Neurobiol. Dis. 2015, 74, 281–294. [Google Scholar] [CrossRef] [PubMed]
- Pluta, R.; Ułamek-Kozioł, M.; Januszewski, S.; Czuczwar, S.J. Dysregulation of Alzheimer’s disease-related genes and proteins following cardiac arrest. Folia Neuropathol. 2017, 55, 283–288. [Google Scholar] [CrossRef] [PubMed]
- Pulsinelli, W.A.; Brierley, J.B. A new model of bilateral hemispheric ischemia in the unanesthetized rat. Stroke 1979, 10, 267–272. [Google Scholar] [CrossRef] [PubMed]
- Matté, C.; Mussulini, B.H.M.; dos Santos, T.M.; Soares, F.M.; Simão, F.; Matté, A.; Wyse, A.T. Hyperhomocysteinemia reduces glutamate uptake in parietal cortex of rats. Int. J. Dev. Neurosci. 2010, 28, 183–187. [Google Scholar] [CrossRef] [PubMed]
- Martins, P.J.F.; Galdieri, L.C.; Souza, F.G.; Andersen, M.L.; Benedito-Silva, A.A.; Tufik, S.; D’almeida, V. Physiological variation in plasma total homocysteine concentrations in rats. Life Sci. 2005, 76, 2621–2629. [Google Scholar] [CrossRef] [PubMed]
- Timkova, V.; Tatarkova, Z.; Lehotsky, J.; Racay, P.; Dobrota, D.; Kaplan, P. Effects of mild hyperhomocysteinemia on electron transport chain complexes, oxidative stress, and protein expression in rat cardiac mitochondria. Mol. Cell. Biochem. 2016, 411, 261–270. [Google Scholar] [CrossRef] [PubMed]
- Kovalska, M.; Kovalska, L.; Pavlikova, M.; Janickova, M.; Mikuskova, K.; Adamkov, M.; Lehotsky, J. Intracellular signaling MAPK pathway after cerebral ischemia-reperfusion injury. Neurochem. Res. 2012, 37, 1568–1577. [Google Scholar] [CrossRef] [PubMed]
- Pilchova, I.; Klacanova, K.; Chomova, M.; Tatarkova, Z.; Dobrota, D.; Racay, P. Possible contribution of proteins of Bcl-2 family in neuronal death following transient global brain ischemia. Cell. Mol. Neurobiol. 2015, 35, 23–31. [Google Scholar] [CrossRef] [PubMed]


© 2018 by the authors. Licensee MDPI, Basel, Switzerland. This article is an open access article distributed under the terms and conditions of the Creative Commons Attribution (CC BY) license (http://creativecommons.org/licenses/by/4.0/).
Share and Cite
Tóthová, B.; Kovalská, M.; Kalenská, D.; Tomašcová, A.; Lehotský, J. Histone Hyperacetylation as a Response to Global Brain Ischemia Associated with Hyperhomocysteinemia in Rats. Int. J. Mol. Sci. 2018, 19, 3147. https://0-doi-org.brum.beds.ac.uk/10.3390/ijms19103147
Tóthová B, Kovalská M, Kalenská D, Tomašcová A, Lehotský J. Histone Hyperacetylation as a Response to Global Brain Ischemia Associated with Hyperhomocysteinemia in Rats. International Journal of Molecular Sciences. 2018; 19(10):3147. https://0-doi-org.brum.beds.ac.uk/10.3390/ijms19103147
Chicago/Turabian StyleTóthová, Barbara, Mária Kovalská, Dagmar Kalenská, Anna Tomašcová, and Ján Lehotský. 2018. "Histone Hyperacetylation as a Response to Global Brain Ischemia Associated with Hyperhomocysteinemia in Rats" International Journal of Molecular Sciences 19, no. 10: 3147. https://0-doi-org.brum.beds.ac.uk/10.3390/ijms19103147