Zn2+ Aggravates Tau Aggregation and Neurotoxicity

1
Changchun Institute of Applied Chemistry, Chinese Academy of Sciences, Changchun 130022, China
2
School of Applied Chemistry and Engineering, University of Science and Technology of China, Hefei 230026, China
3
College of Life Sciences and Oceanography, Shenzhen Key Laboratory of Microbial Genetic Engineering, Shenzhen University, Shenzhen 518060, China
*
Authors to whom correspondence should be addressed.
Int. J. Mol. Sci. 2019, 20(3), 487; https://0-doi-org.brum.beds.ac.uk/10.3390/ijms20030487
Submission received: 31 December 2018
/
Revised: 20 January 2019
/
Accepted: 20 January 2019
/
Published: 23 January 2019
(This article belongs to the Special Issue Proteins and Protein-Ligand Interactions)
Abstract
:Alzheimer’s disease (AD) is a neurodegenerative disease with high morbidity that has received extensive attention. However, its pathogenesis has not yet been completely elucidated. It is mainly related to β-amyloid protein deposition, the hyperphosphorylation of tau protein, and the loss of neurons. The main function of tau is to assemble tubulin into stable microtubules. Under pathological conditions, tau is hyperphosphorylated, which is the major component of neurofibrillary tangles (NFT) in AD. There is considerable evidence showing that the dyshomeostasis of Zn2+ is closely related to the development of AD. Herein, by using the third repeat unit of the microtubule-binding domain of tau (tau-R3), we investigated the effect of Zn2+ on the aggregation and neurotoxicity of tau. Experimental results showed that tau-R3 probably bound Zn2+ via its Cys residue with moderate affinity (association constant (Ka) = 6.82 ± 0.29 × 10⁴ M−1). Zn2+ accelerated tau-R3 aggregation and promoted tau-R3 to form short fibrils and oligomers. Compared with tau-R3, Zn2+-tau-R3 aggregates were more toxic to Neuro-2A (N2A) cells and induced N2A cells to produce higher levels of reactive oxygen species (ROS). The dendrites and axons of Zn2+-tau-R3-treated neurons became fewer and shorter, resulting in a large number of neuronal deaths. In addition, both tau-R3 and Zn2+-tau-R3 aggregates were found to be taken up by N2A cells, and more Zn2+-tau-R3 entered the cells compared with tau-R3. Our data demonstrated that Zn2+ can aggravate tau-R3 aggregation and neurotoxicity, providing clues to understand the relationship between Zn2+ dyshomeostasis and the etiology of Alzheimer’s disease.
1. Introduction
Alzheimer’s disease (AD) was first found and named by Alois Alzheimer in 1906 [1]; it accounts for 50–60% of all forms of dementia and is characterized by the extracellular deposition of amyloid plaques consisting of amyloid-β (Aβ) peptides [2], abnormally hyperphosphorylated tau (p-tau) containing intracellular neurofibrillary tangles (NFTs) [3], and neuronal cell death. The 2018 World Alzheimer Report revealed that there were 50 million people worldwide living with AD in 2015, and this number will reach 152 million in 2050 [4]. AD has a huge impact on the economy, but the exact cause is not yet clear.
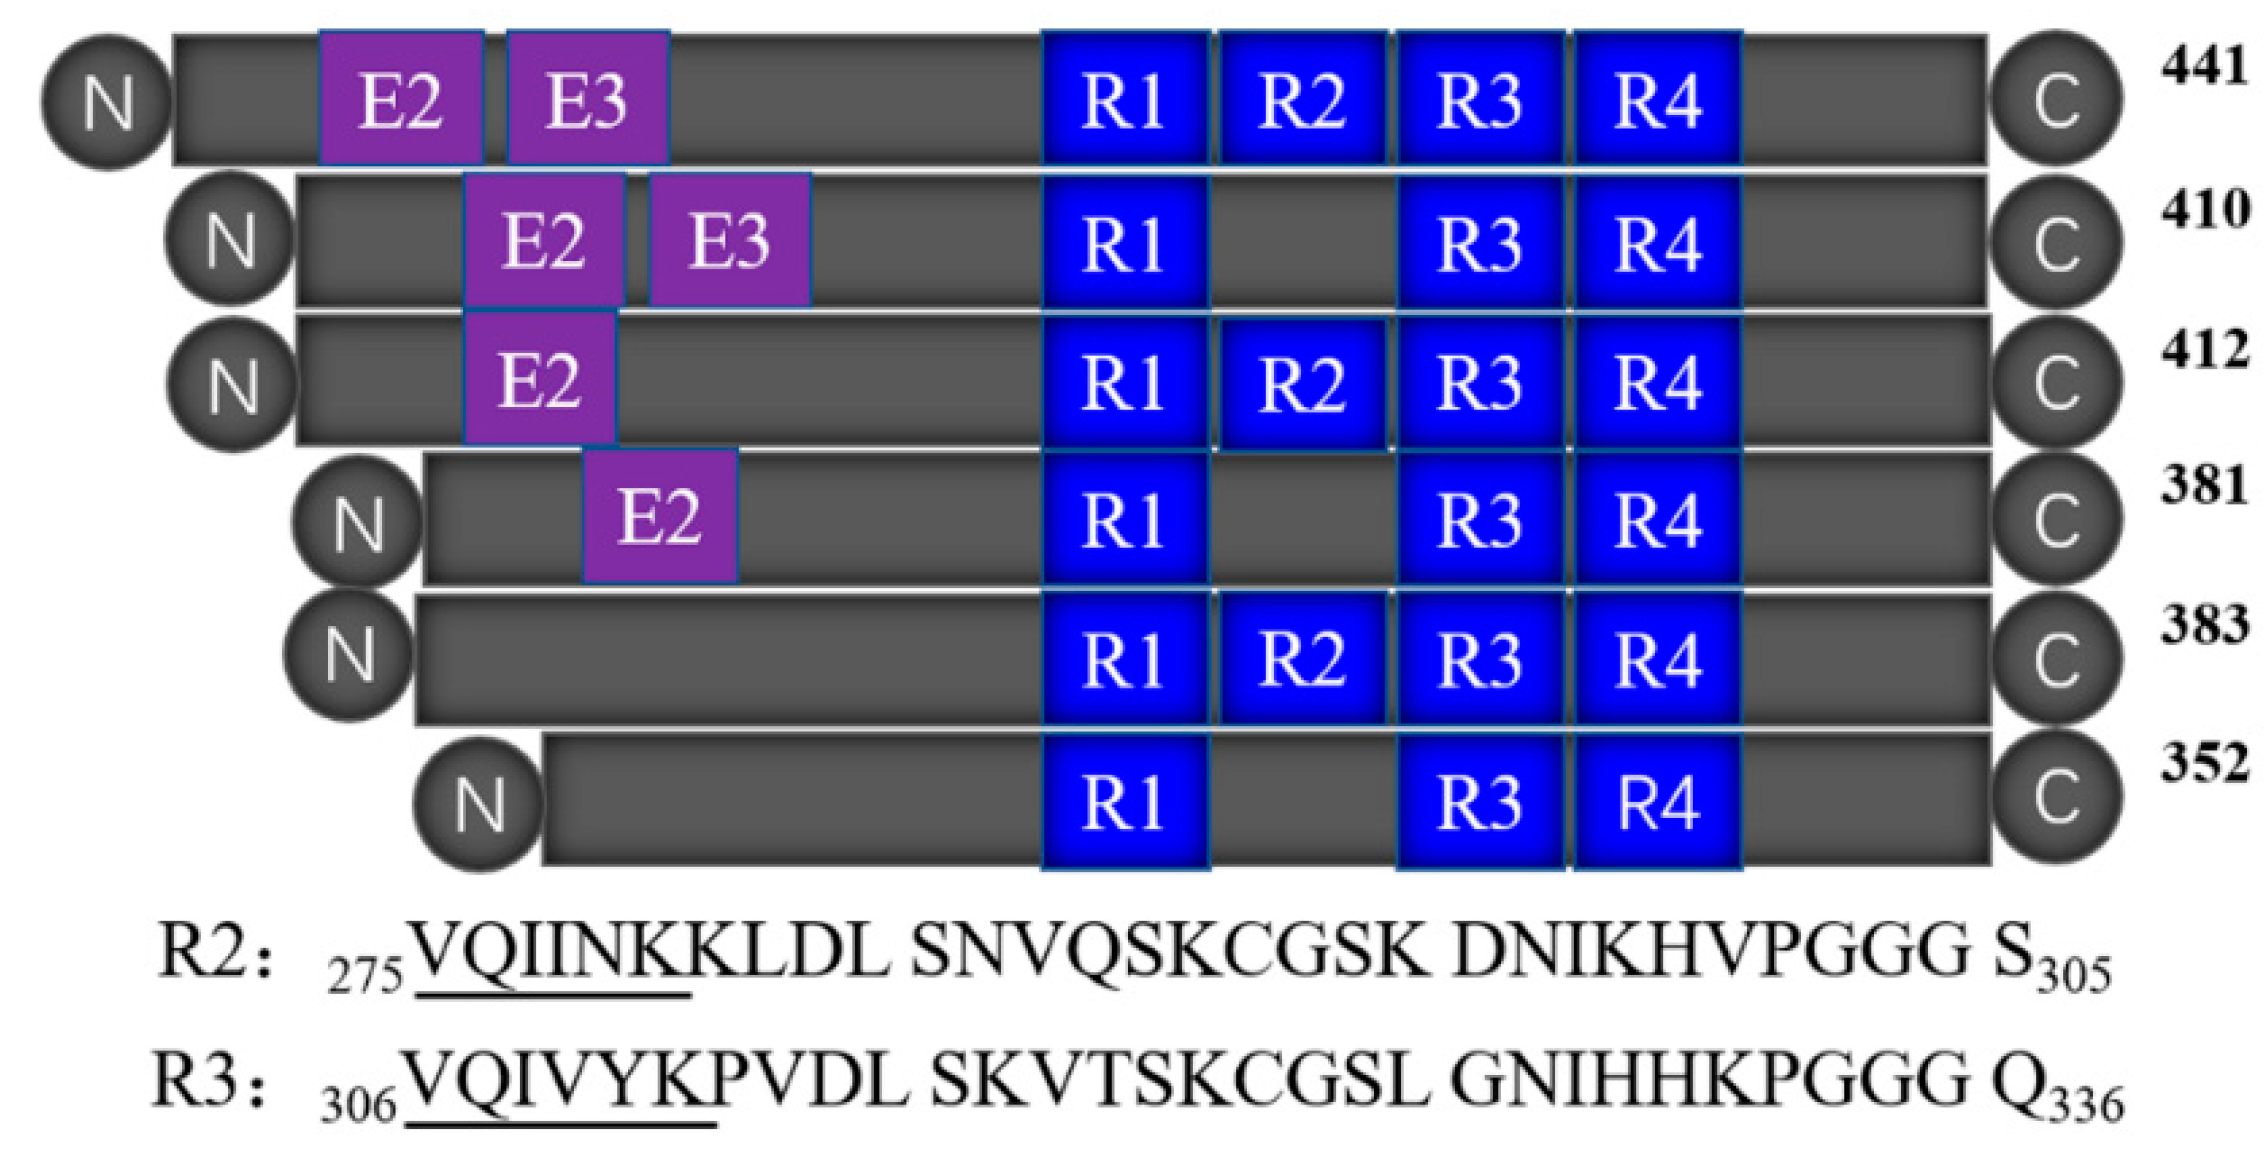
Tau is a microtubule-associated protein (MAP) [5,6] that mainly presents in the axons of nerve cells, and binds to tubulin to form the core of early assembling microtubules. The abnormal aggregation of tau proteins forms insoluble paired helix filaments (PHF) that cause nerve fiber tangles, which are one of the main pathological features of AD. Therefore, the molecular mechanism of the abnormal aggregation of tau protein has become the key to the study of AD pathology. In the human central nervous system, there are six tau isoforms obtained by the translation of mRNAs produced by different cleavage of the same gene [7]. Tau protein has two major domains: the overhanging domain at the N-terminus, and the microtubule-binding domain at the C-terminus. The latter determines the biological function of tau. As shown in Figure 1, the microtubule-binding domain of tau protein contains three (R1, R3, and R4) or four repeats (R1–R4), with each consisting of 31 or 32 amino acid residues [8]. The repeat domains not only participate in microtubule stabilization, but also form the core of the PHF [8,9,10]. R2 and R3 contain a hexapeptide (275VQIINK280 or 306VQIVYK311) motif, and exhibited similar properties to the full-length tau protein in vitro experiments, which also makes them the best polypeptide fragments to mimic tau aggregation. For example, both of them can self-aggregate to form PHFs and NFTs in the presence of an inducer [11], while only R3 is present in all the six tau isoforms. R3 also has the smallest self-aggregation concentration and the highest self-aggregation rate [12], so the R3 fragment was used in this study to simulate the aggregation behavior of full-length tau protein.
The dynamic imbalance of metal ions such as Cu2+, Fe3+, Zn2+, and Ca2+ in the brain is closely related to the pathogenic mechanism of AD [13,14,15]. Under normal conditions, the concentration of free metal ions in the brain is very low, and does not affect neurological function. Meanwhile, the brain tissue of AD patients contains large amounts of transition metal ions, such as Cu2+, Fe3+, and Zn2+ [16]. These metal ions are closely related to the aggregation of Aβ, the phosphorylation of tau, the generation of reactive oxygen species (ROS), and neuron death [17,18]. It is reported that Cu2+ is an inducer of self-assembly of the R3 peptide, and makes the R3 peptide form a structure similar to PHF [19]. Our previous studies have found that Cu+ and Cu2+ ions induced the aggregation and neurotoxicity of tau-R2, which bound 0.44 Cu2+ and 0.34 Cu+ per monomer with dissociation constants of 1.1 nM and 0.2 pM, respectively [20].
As an essential trace element, Zn2+ is involved in human growth and development, immune regulation, protein and nucleic acid synthesis, and other physiological activities [21,22]. Appropriate Zn2+ concentration plays a crucial role in nervous system development and the differentiation of neural stem cells. The imbalance of Zn2+ homeostasis is considered to be an important influencing factor for some neurodegenerative diseases [23]. It was found that the mRNA levels of Zn2+ transporters, including LIV1, ZIP1, ZnT1, ZnT4, and ZnT6 were increased in the cortex of postmortem brain tissues from AD patients, increasing the likelihood of interactions between Zn2+ and Aβ or tau protein in the brains [24]. There is increasing evidence suggesting that Zn2+ can combine Aβ and tau, which is crucially involved in the pathogenesis of AD. Zn2+ levels were higher in amyloid plaques in AD [16], and excess Zn2+ exposure could be a risk factor for AD pathological processes [25]. Huang et al. found that Arg13, His6, and His14 residues provided the primary binding sites for Zn2+ in the rat Aβ1-28 peptide, and the proper binding of Zn2+ induced the peptide to adopt a more stable conformation [26]. Mo et al. demonstrated that low micromolar Zn2+ accelerated the fibrillization of human tau protein via bridging Cys-291 and Cys-322 in physiological reducing conditions [27]. Sun et al. found that synaptically released Zn2+ promoted tau hyperphosphorylation through protein phosphatase 2A (PP2A) inhibition [28]. Thus, abnormal Zn2+ homeostasis is believed to be a contributing factor leading to tau aggregation, and the alteration of Zn2+ homeostasis is a potential therapeutic strategy for AD.
In addition, levels of manganese, molybdenum, and iron were also changed significantly among Alzheimer disease, mild cognitive impairment, subjective memory complaint, and healthy subjects [29]. Thus, in the present study, by using isothermal titration calorimetry (ITC) and UV-vis spectroscopy, the thermodynamic properties of tau-R3 binding Mn2+, Mo5+, Fe3+, and Zn2+ were characterized. By thioflavin T (ThT) fluorescence assay and circular dichroism spectroscopy (CD), the aggregation kinetics and morphology of tau-R3 in the presence or absence of metal ions were determined. The viabilities and the intracellular ROS levels of N2A cells exposed to different tau-R3 aggregates were measured by CCK-8 assay and flow cytometry. In addition, we demonstrated that exogenous tau-R3 and Zn2+-tau-R3 aggregates could enter cells, and the dendrites and axons of Zn2+-tau-R3-treated neurons become fewer and shorter, resulting in a large number of neuronal deaths. Our findings linked Zn2+-induced tau aggregation and neurotoxicity to the pathogenesis of AD.
2. Results
2.1. Tau-R3 Bound Zn2+ with Moderate Affinity
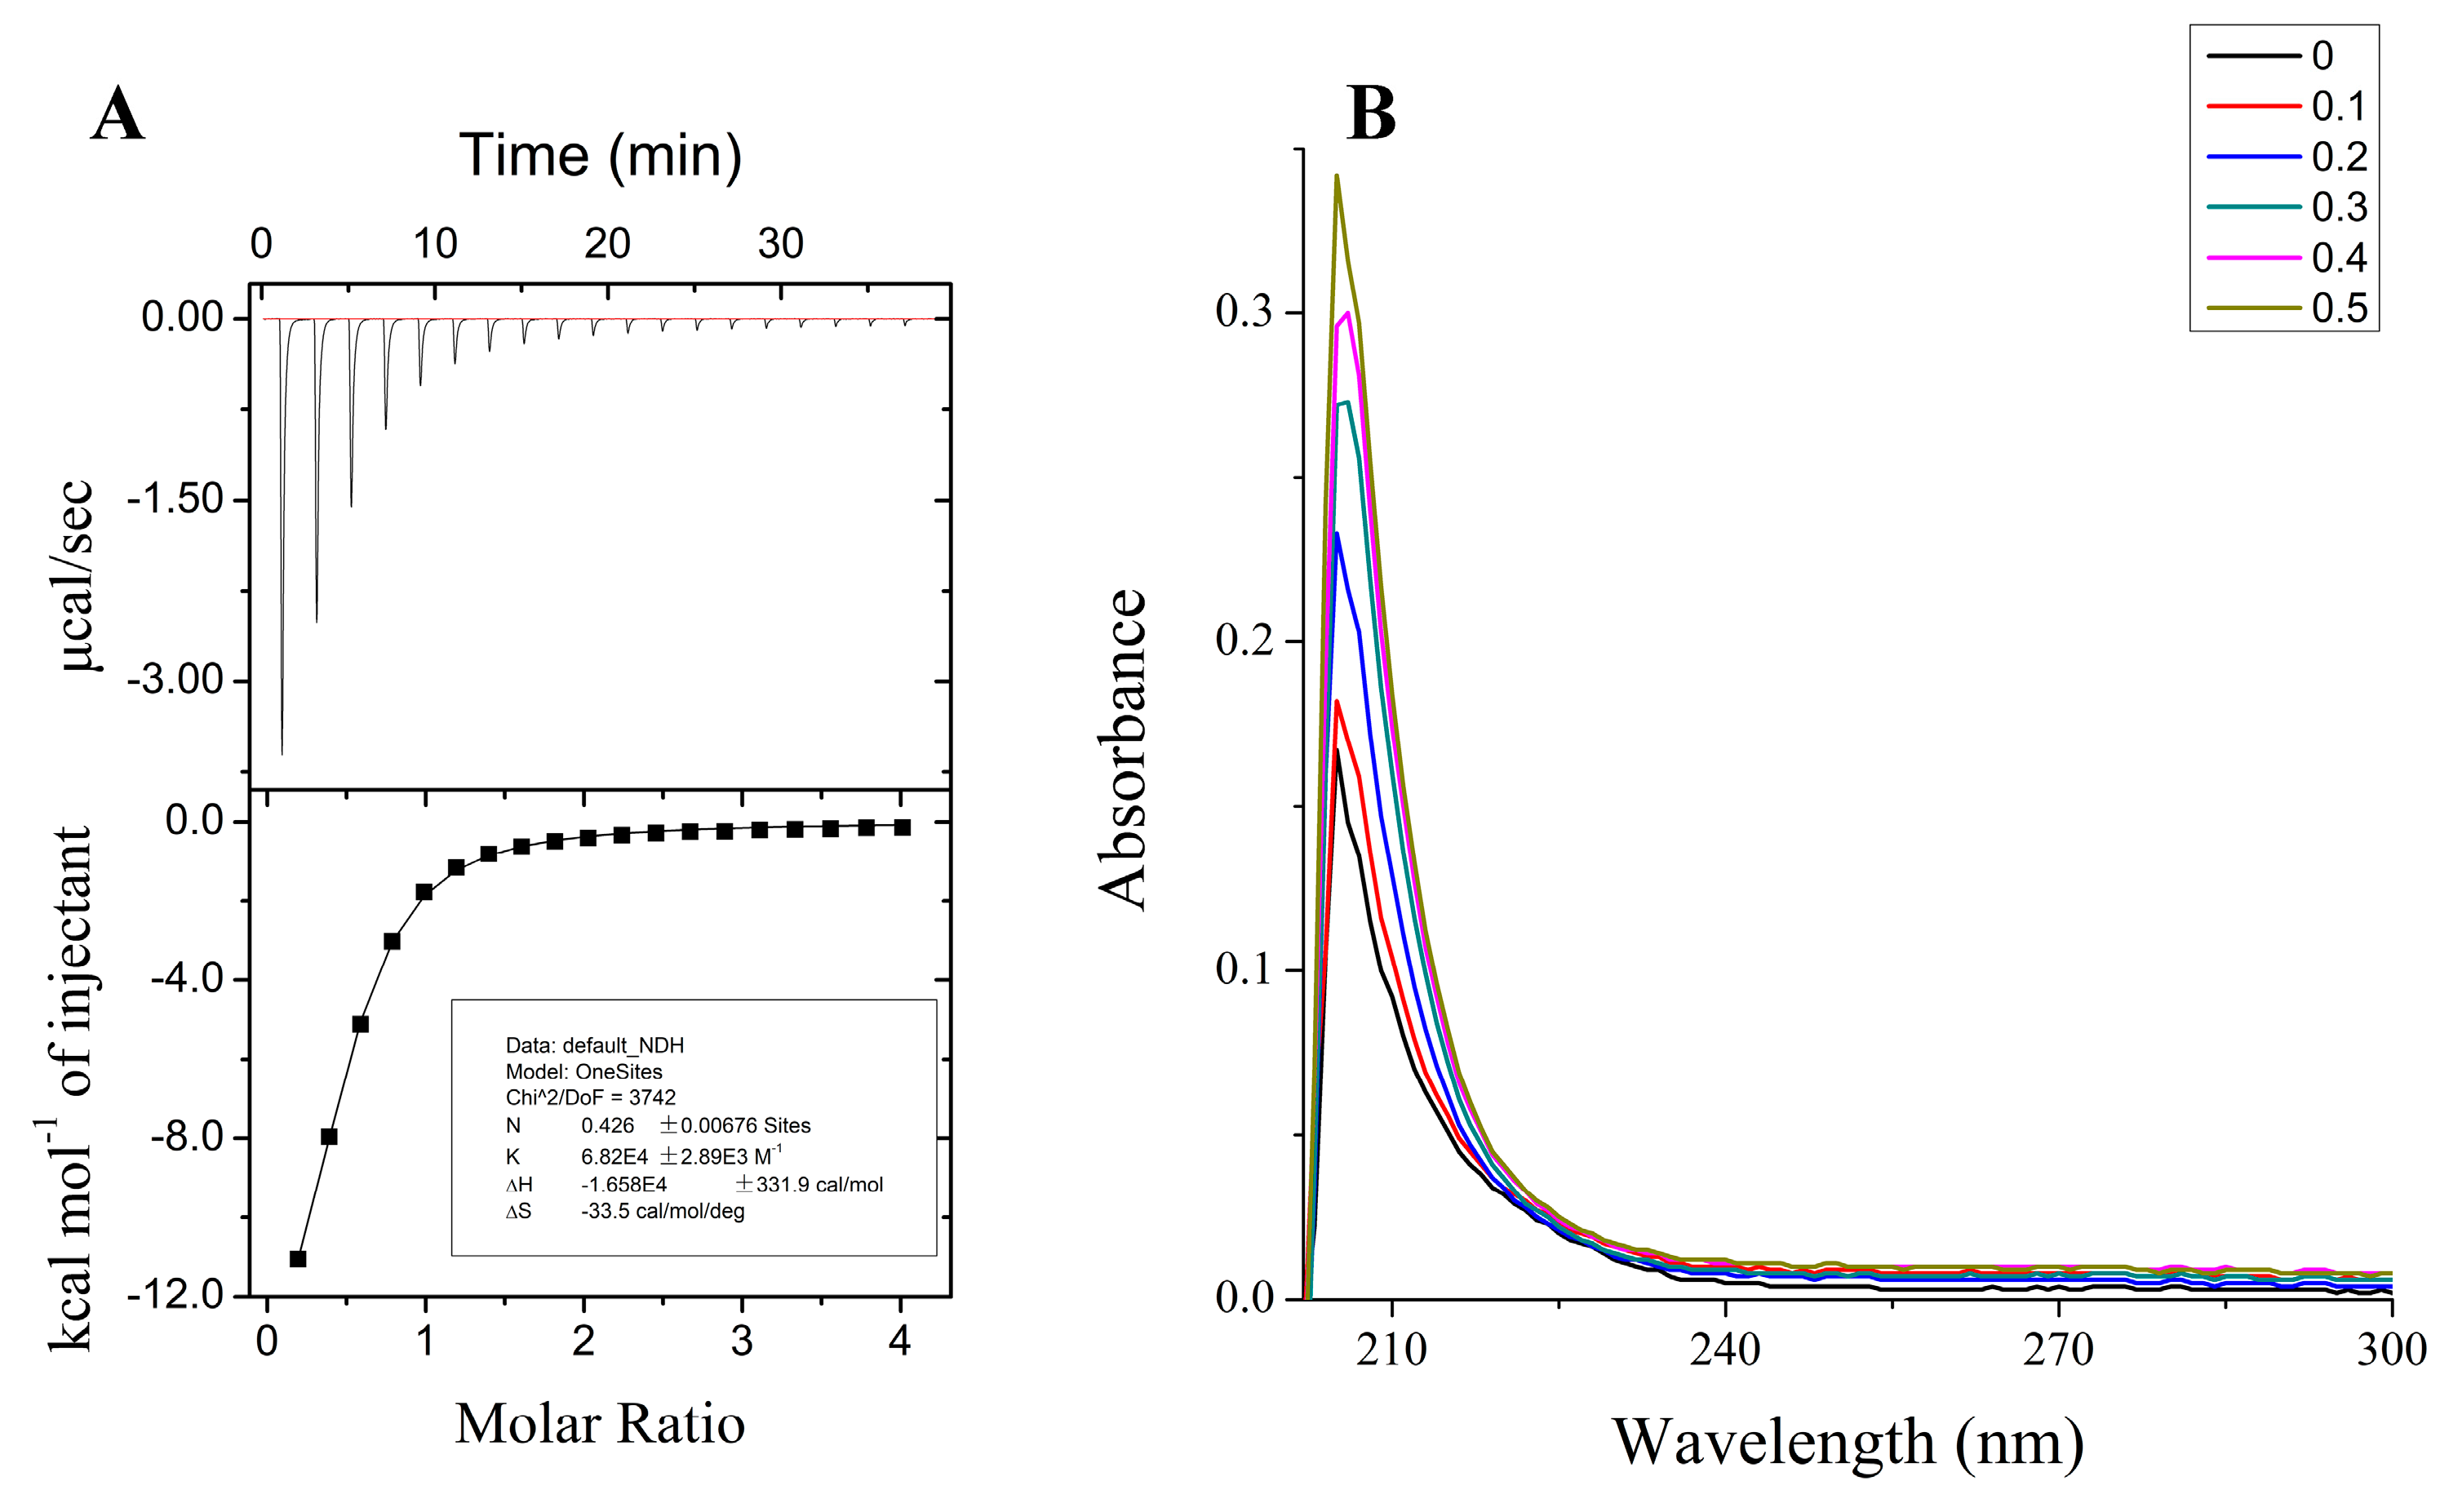
To investigate the binding of metal ions to tau-R3, the peptide (100 μM) was titrated with different metal cations (two mM) in their chloride forms, and the calorimetric changes were monitored using iTC200, which provides a direct route to the thermodynamic characterization of noncovalent equilibrium interactions. ITC profiles for the titration of Mn2+, Mo5+, or Fe3+ to tau-R3 at 25 °C suggested that there is no specific binding between tau-R3 and these metal cations (Figure S1). However, the titration of Zn2+ into the tau-R3 peptide resulted in large exothermic peaks, which eventually diminished to only the heat of the dilution after nine injections (Figure 2A). The calorimetric data were best fit to a model assuming a single set of identical binding sites, which approximated the association constant (Ka) to be 6.82 ± 0.29 × 10⁴ M−1, and the binding stoichiometry (n) to be 0.43 ± 0.01 (Figure 2A). The ΔH and ΔS were estimated to be −16.58 ± 0.33 kcal mol−1 and −33.5 cal/mol/deg, respectively. Therefore, the binding of Zn2+ to tau-R3 is an entropy-driven, but not enthalpy-driven reaction.
The binding of Zn2+ and tau-R3 was also monitored by UV-vis spectrometry, and the results are shown in Figure 2B. With the titration of Zn2+, the absorption spectrum of tau-R3 showed a peak at 218 nm assigned to an S–Zn charge transfer [30], indicating that the single cysteine in tau-R3 contributed a ligand coordinating Zn2+. In agreement with this, Mo et al. reported that Zn2+ bound to human tau via Cys-291 and Cys-322, which are located in the R2 and R3 fragments of tau, respectively [27].
2.2. Zn2+ Accelerated the Fibrillization of Tau-R3 In Vitro
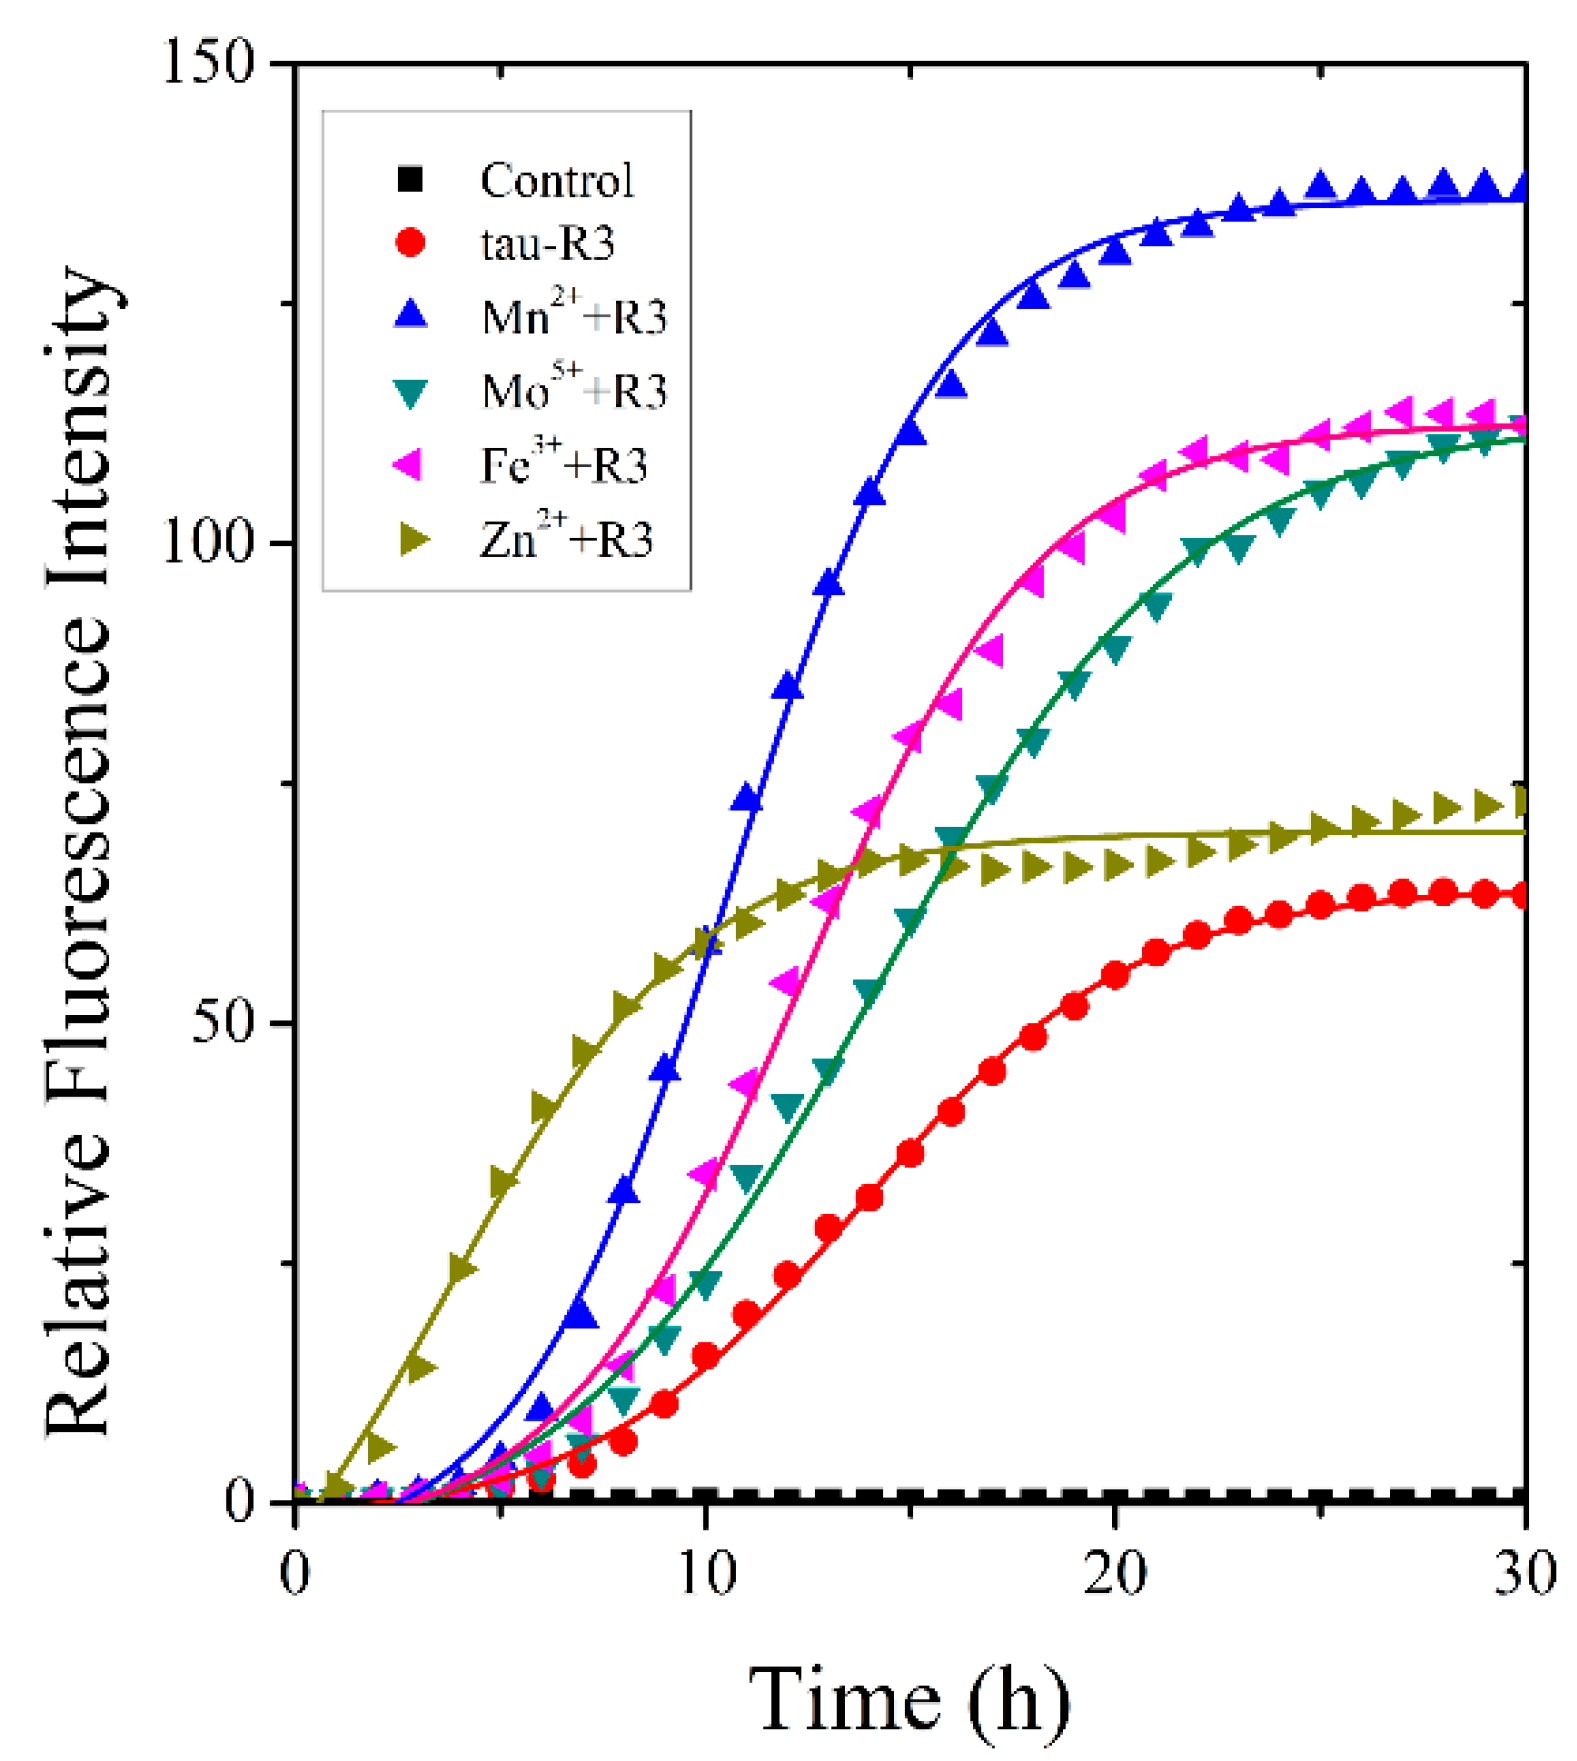
The fibrillization of tau-R3 incubated alone or with different cations (Mn2+, Mo5+, Fe3+, or Zn2+) was examined by a ThT fluorescence assay [31,32]. ThT specifically binds to the β-sheet structure rapidly, and its fluorescence intensity at 480 nm positively correlates with the content of fibers. Heparin was added to induce the fibrillization of tau-R3. As shown in Figure 3, the kinetic curves of ThT fluorescence intensity at 480 nm for tau-R3 fibrillization consisted of three phases: the lag phase, the exponential phase, and the stable phase, which fit well with the sigmoidal function Boltzmann equations. Mn2+, Mo5+, and Fe3+ all significantly promoted the fibrillization of tau-R3, which was reflected by shorter lag phases and much higher ThT fluorescence intensities. In the presence of Mn2+, after incubation at 37 °C for 30 h, the highest ThT fluorescence intensity was approximately 2.2-fold that of tau-R3 incubated alone. Interestingly, Zn2+ slightly increased the fibers content of tau-R3, but it markedly accelerated the fibrillization of tau-R3, with the t50 (the time to 50% fibrillization) reduced from 15 h (tau-R3 alone) to six h.
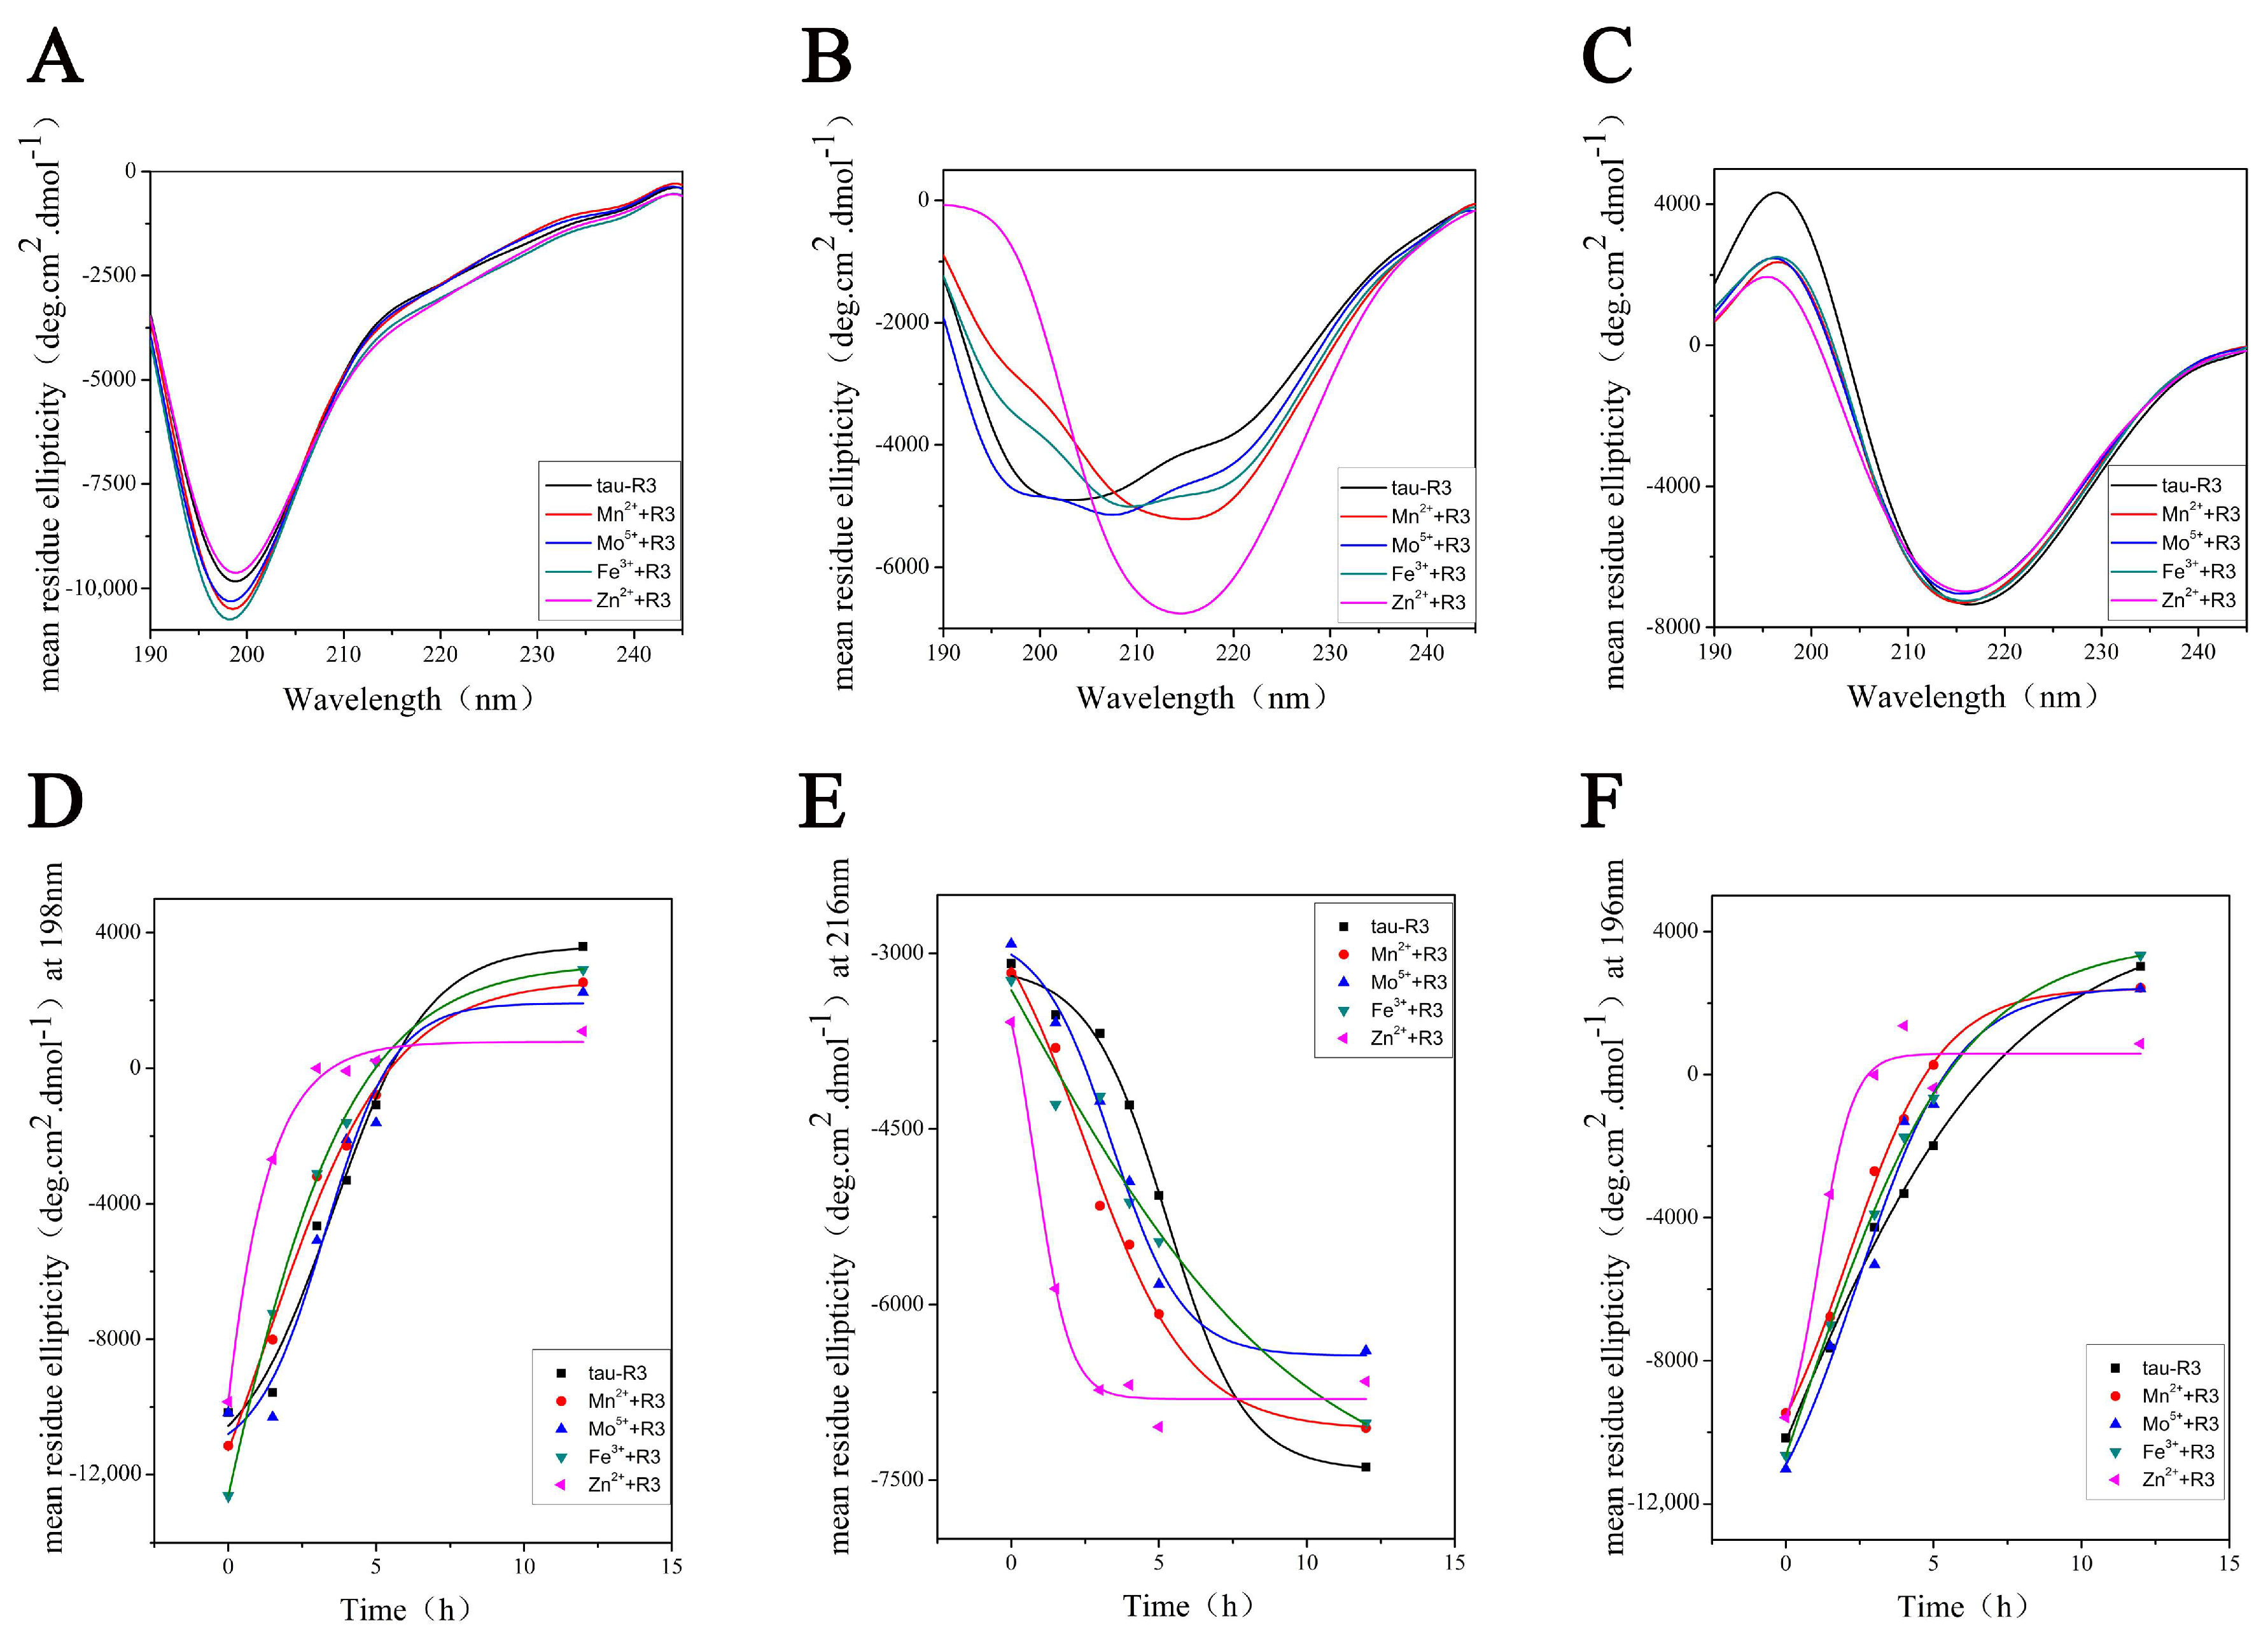
To better understand the effects of different metal ions on tau-R3 aggregation, we analyzed the secondary structures of tau-R3 via CD spectra. A far-UV spectroscopy signal is generated due to asymmetric structures around the chromophores in the peptide chain of the protein, such as α-helix, β-sheet, and irregular curl structures, so the CD signal in this region can provide protein secondary structure information. The CD spectra of tau-R3 incubated at 37 °C alone or with different metal ions from 0 to 24 h were recorded and shown in Figure 4. At zero h, tau-R3 mainly adopted a random coil conformation, which was characterized by a negative peak near 198 nm (Figure 4A). All of the metal ions that were examined promoted the conversion of tau-R3 from the random coil to the β-sheet. When incubated with Mn2+, Mo5+, or Fe3+ for 3 h, the CD spectra of tau-R3 showed a mixed structure of random coils and β-sheets. While in the presence of Zn2+, almost all of the tau-R3 turned to adopt the β-sheet confirmation after the 3-h incubation, which was characterized by a negative peak at 216 nm and a strong positive peak at 196 nm (Figure 4B). Tau-R3 completely converted from random coil to β-sheet in 24 h, whether it was incubated alone or co-incubated with metal ions (Figure 4C). Ellipticities at 198 nm, 216 nm, and 196 nm were plotted against the incubation time (Figure 4D,E), which showed a decrease in random coil content and an increase in the β-sheet content. Consistent with the ThT fluorescence assay, the CD spectra demonstrated that Zn2+ markedly accelerated the aggregation of tau-R3.
2.3. Zn2+ Changed the Morphology of Tau Aggregates
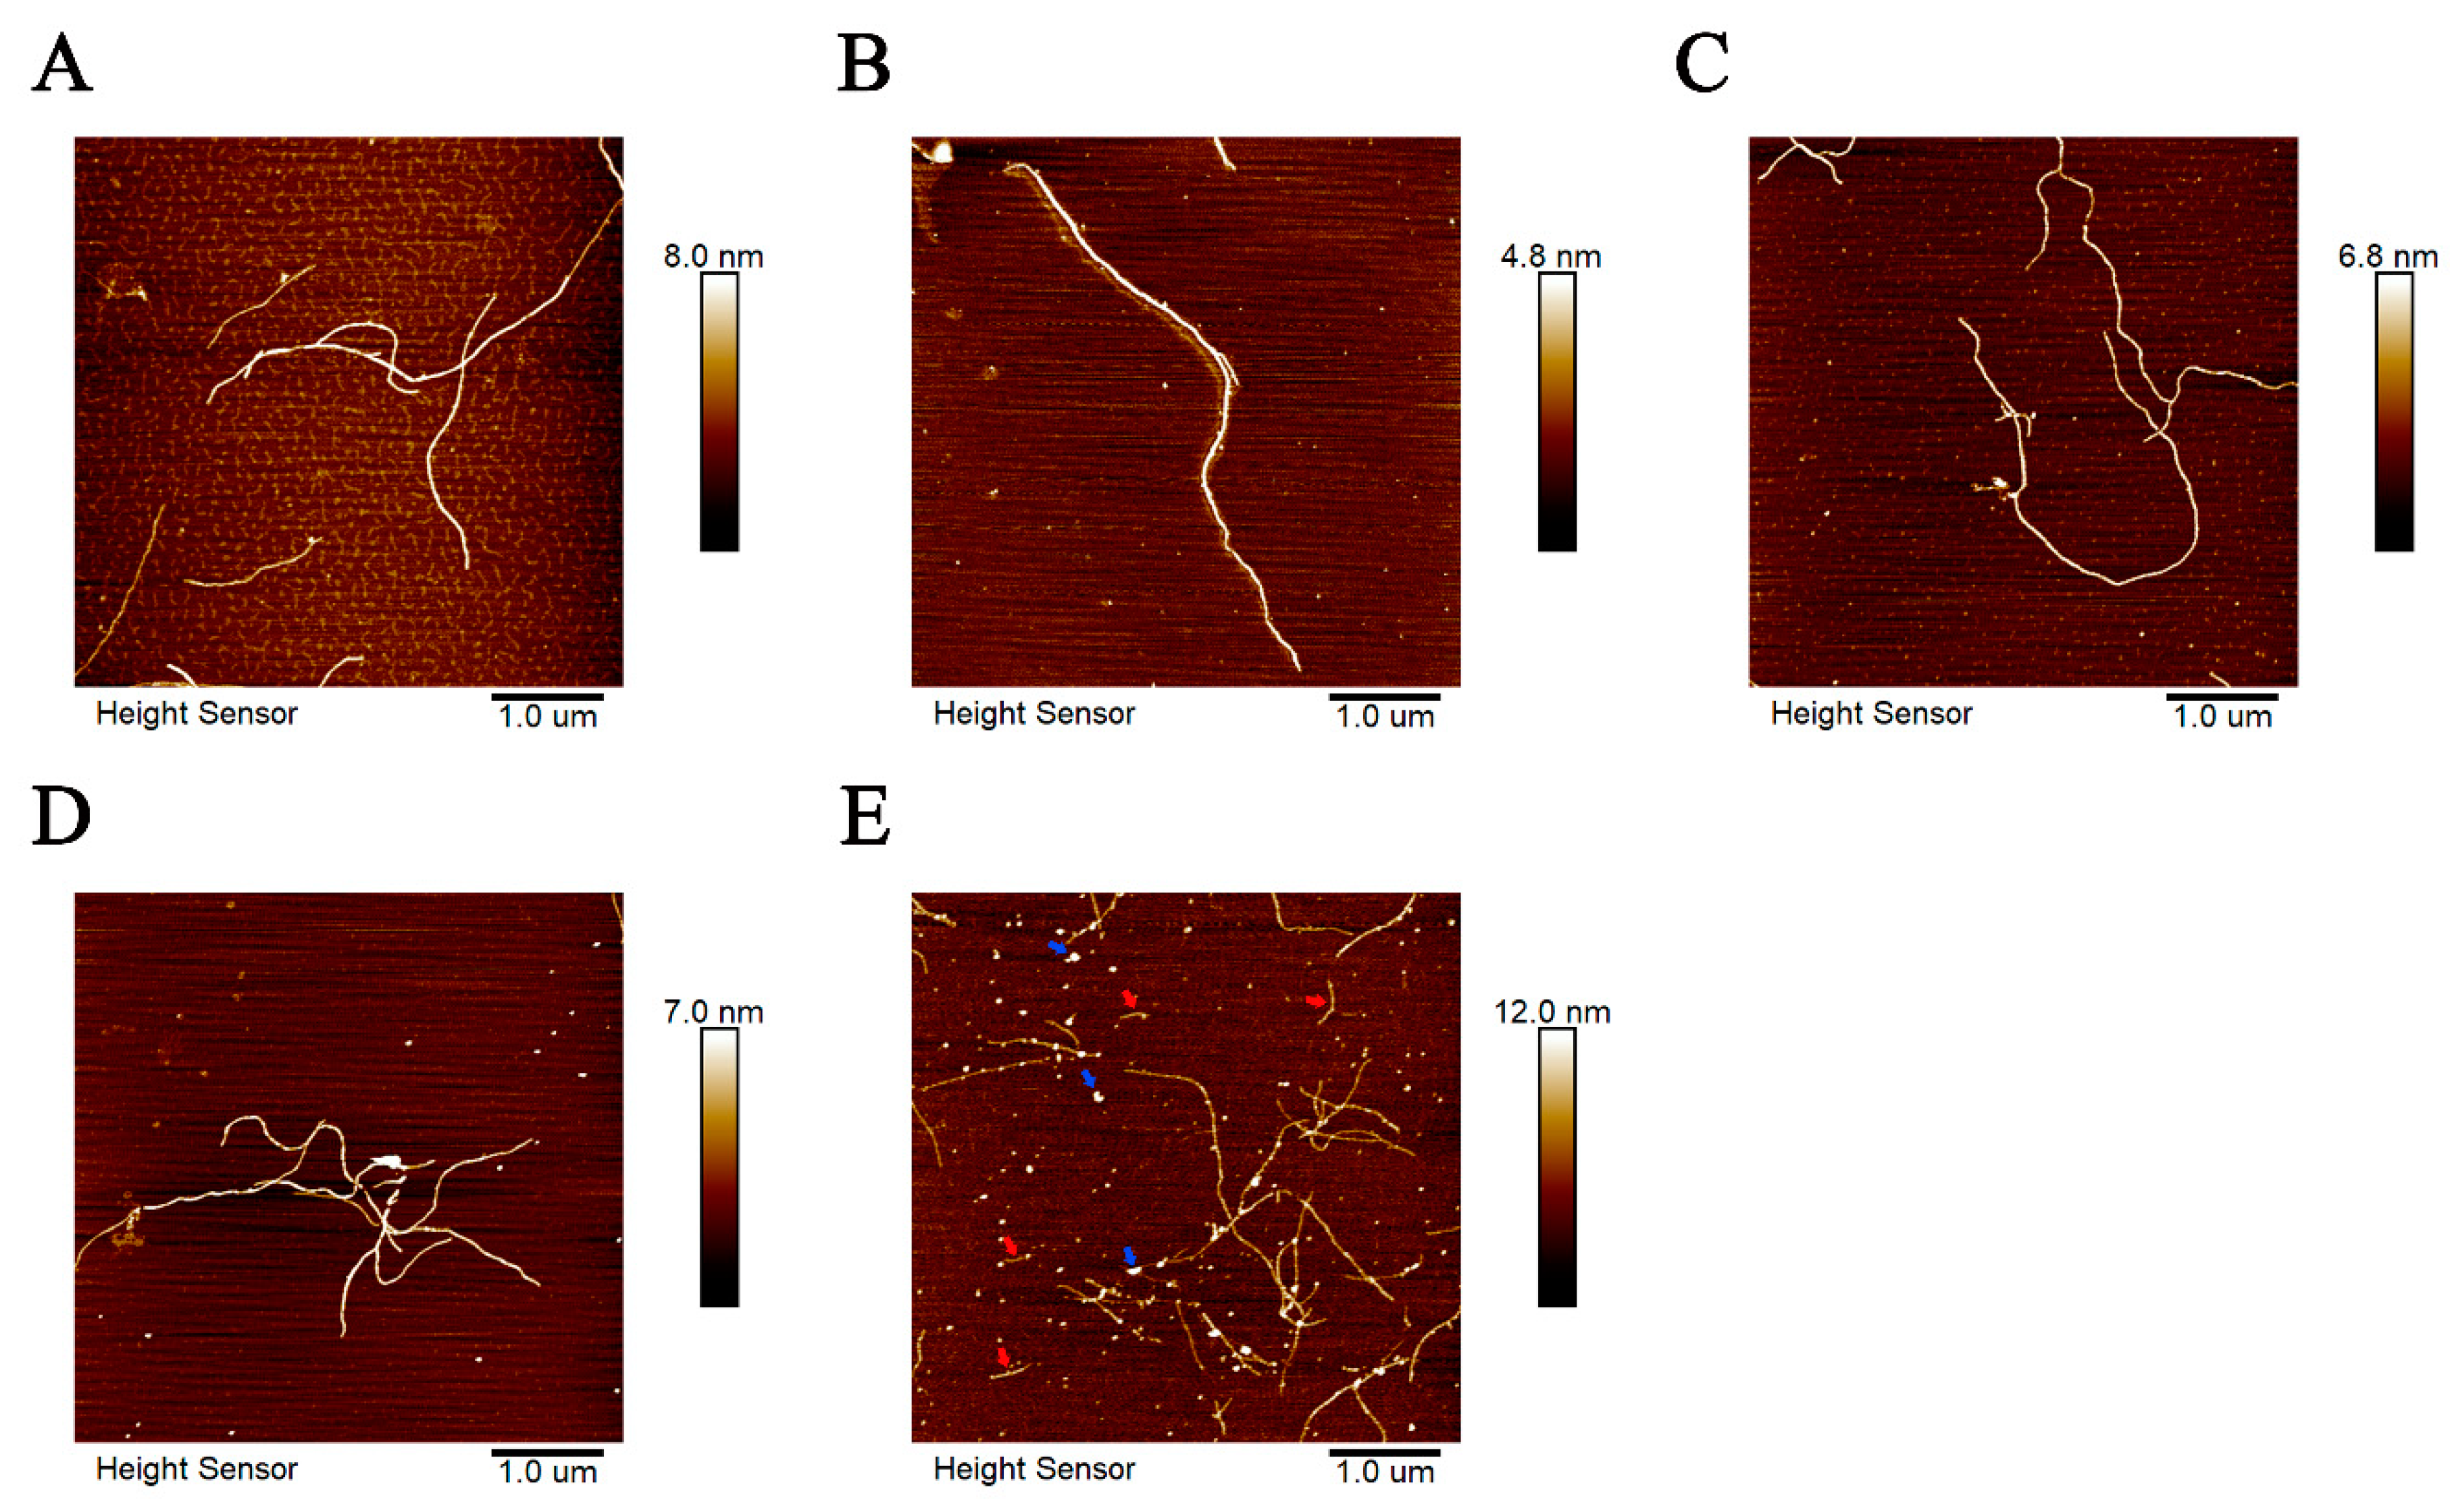
The morphologies of tau-R3 aggregates incubated with or without cations (Mn2+, Mo5+, Fe3+, and Zn2+) at 37 °C for 24 h were further investigated by atomic force microscope (AFM). As shown in Figure 5, when incubated alone, tau-R3 aggregates were mainly composed of long filaments (Figure 5A). Mn2+, Mo5+, and Fe3+ did not affect the morphologies of tau-R3 aggregates (Figure 5B–D), although they promoted the fibrillization of tau-R3, as revealed by ThT fluorescence and CD spectra. Interestingly, when co-incubated with Zn2+, tau-R3 aggregates formed much shorter filaments (indicated with red arrows) and many oligomers (indicated with blue arrows) (Figure 5E).
2.4. Zn2+ Aggravates Tau-R3-Mediated Toxicity and ROS Induction in Nerve Cells
Many studies have shown that tau oligomers are more neurotoxic than monomers and NFTs [33]. We measured the toxicities of tau-R3 aggregates prepared in the presence or absence of Zn2+ to the mouse Neuro-2A (N2A) neuroblastoma cells using the Cell-Counting Kit-8 Assay. As shown in Figure 6A, either tau-R3 aggregates (15 μM) or Zn2+ (7 μM) alone had limited toxicity to N2A cells, with viabilities of 90.6% and 87.4% of the control group, respectively. When the cells were treated with Zn2+-induced tau-R3 aggregates (15 μM of tau-R3 incubated with seven μM of Zn2+ for 24 h before adding to the cell culture), their viabilities were decreased to 53.1% of the control group. Therefore, Zn2+ not only promoted the aggregation of tau-R3, but also aggravated its toxicities to the neuronal cells. Studies have shown that tau oligomers are the most toxic species among the different aggregation forms of tau [34]. The formation of tau-R3 oligomers induced by Zn2+ may be one of the reasons that Zn2+-tau-R3 aggregates were more toxic.
To further understand the mechanism of the Zn2+-induced neurotoxicity of tau-R3, the total ROS levels in N2A cells treated with tau-R3 aggregates, Zn2+, or Zn2+-tau-R3 aggregates were detected with the fluorescent probe 2,7-Dichlorodi-hydrofluorescein diacetate (DCFH-DA) and quantified with flow cytometry. As shown in Figure 6B, treatment with tau-R3 aggregates or Zn2+ alone for 24 h promoted the ROS production in N2A cells by factors of 1.37-fold and 1.26-fold, respectively. Meanwhile, the Zn2+–R3 aggregates dramatically stimulated the generation of ROS, with a 1.52-fold increase relative to the control group (Figure 6B, lane 4). It has been demonstrated that metal ions including iron, copper, and zinc promote the aggregation of Aβ and tau, and induce ROS production and oxidative stress [20,35,36]. Excessive ROS led to lipid peroxidation, protein, DNA and RNA oxidation, and mitochondrial dysfunction, and oxidative stress is a prominent and early feature in the pathogenesis of neuronal damage in AD [37].
2.5. The Toxicity of Tau-R3 to Primary Neurons
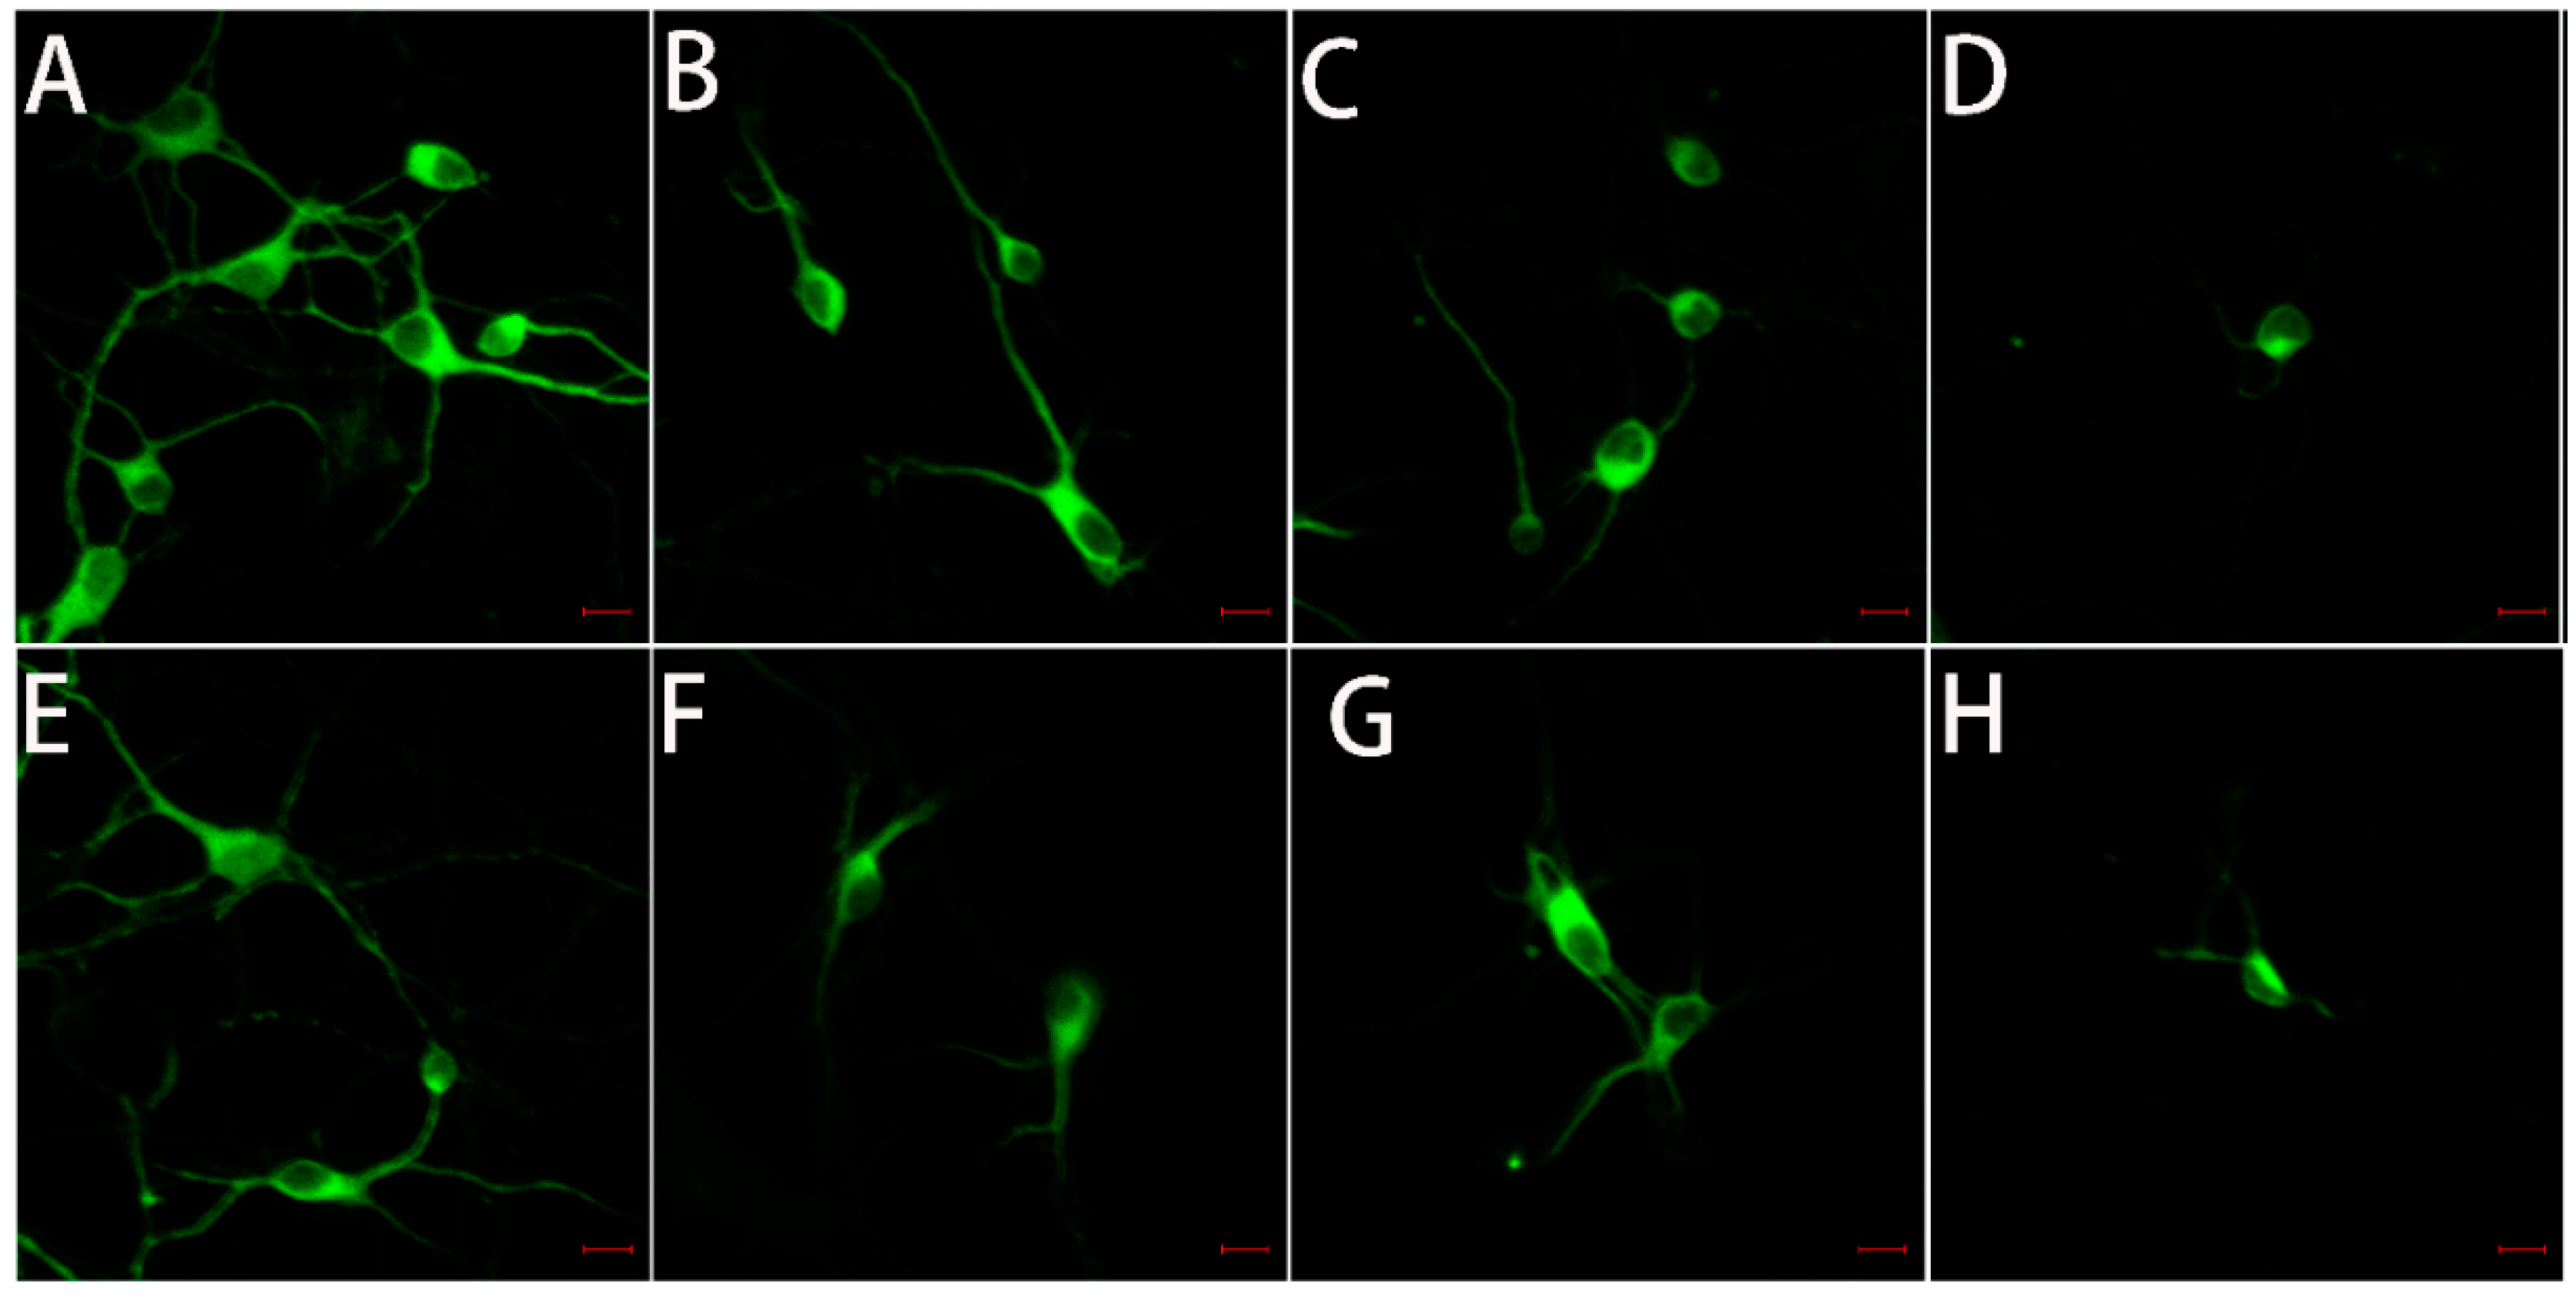
Microtubule-associated protein 2 (MAP-2) is a neuron-specific cytoskeletal protein that acts as a marker for nerve cells and can indicate the growth state of neurons. Thus, we performed immunofluorescence analyses by staining for MAP-2 in primary neuronal cultures (Figure 7) to directly view the growth status of hippocampal neurons (Figure 7A–D) and cortical neurons (Figure 7E–H) upon the treatment of Zn2+ and/or tau-R3 for 12 h. As shown in Figure 7A and Figure 8E, neurons maintained in normal media were rich in protrusions and branches, which make the neurons connect with each other to support normal synaptic functions. When cultured with tau-R3 aggregates (Figure 7B,F) or Zn2+ (Figure 7C,G), neuronal dendrites and axons were damaged. While incubated with Zn2+-tau-R3 (Figure 7D,H), the damage was exacerbated significantly. The dendrites and axons of neurons almost disappeared, resulting in the disappearance of synaptic structures of connected neurons.
2.6. Subcellular Distribution of Tau-R3
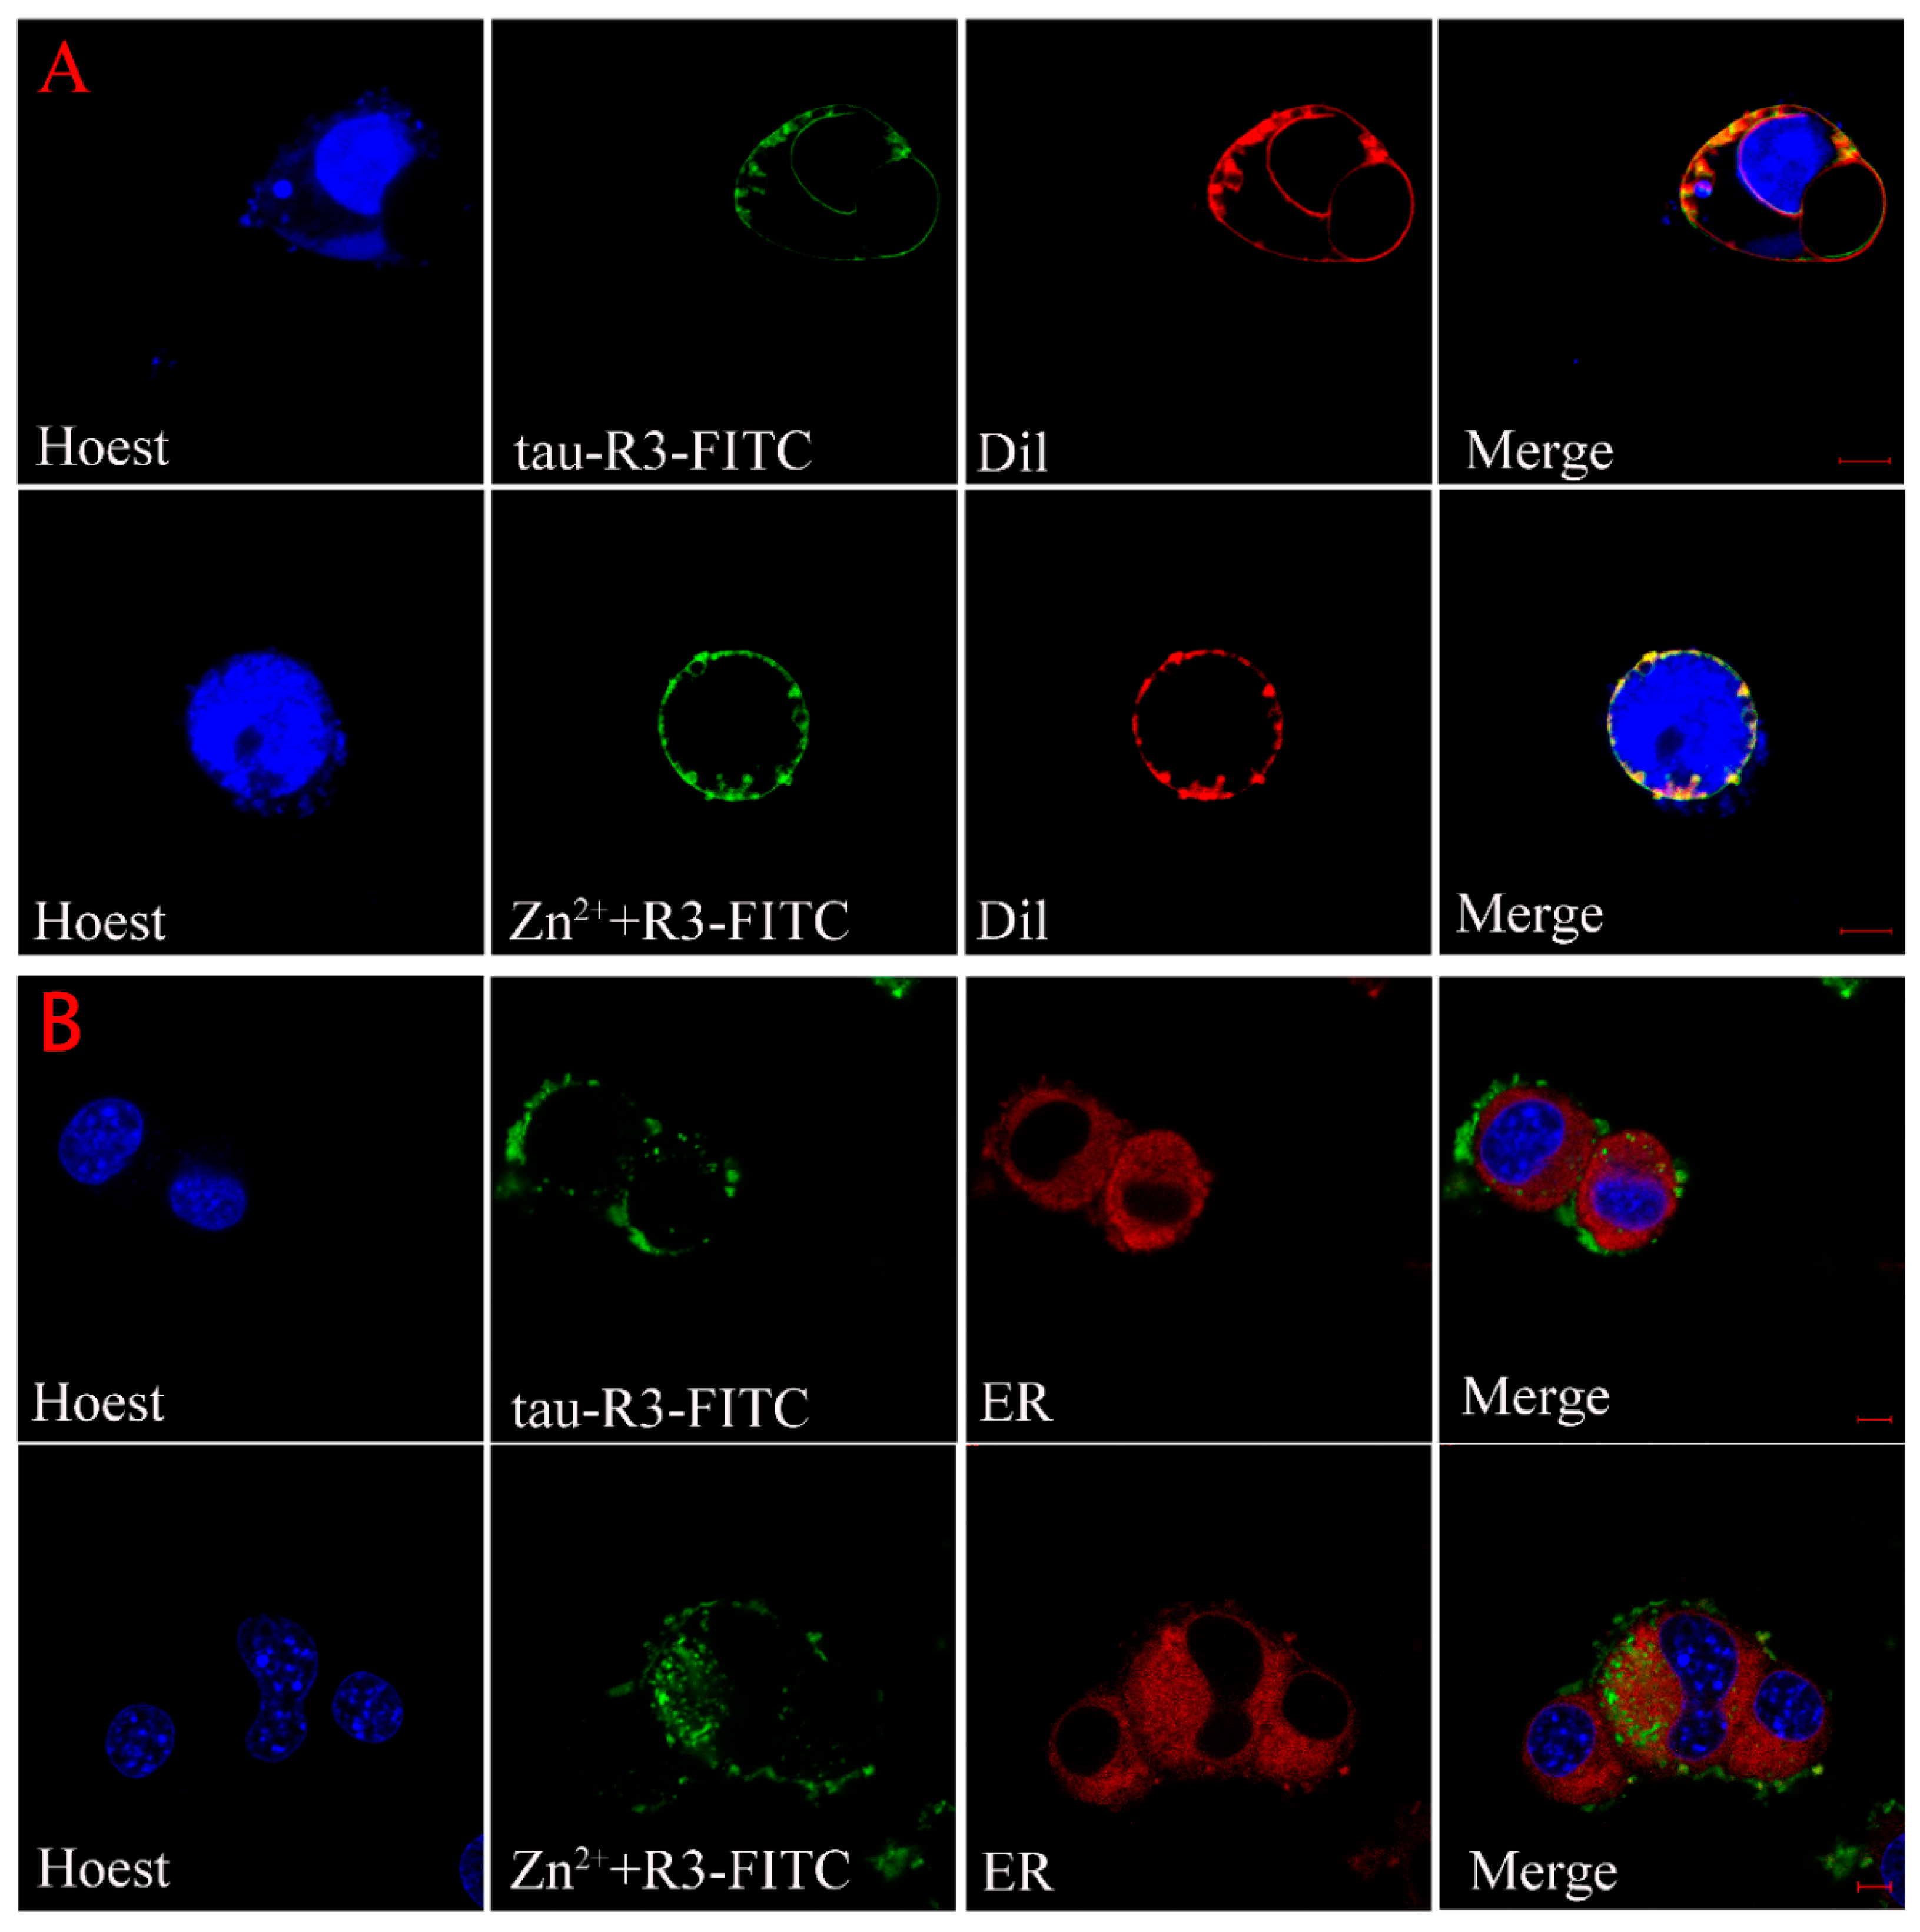
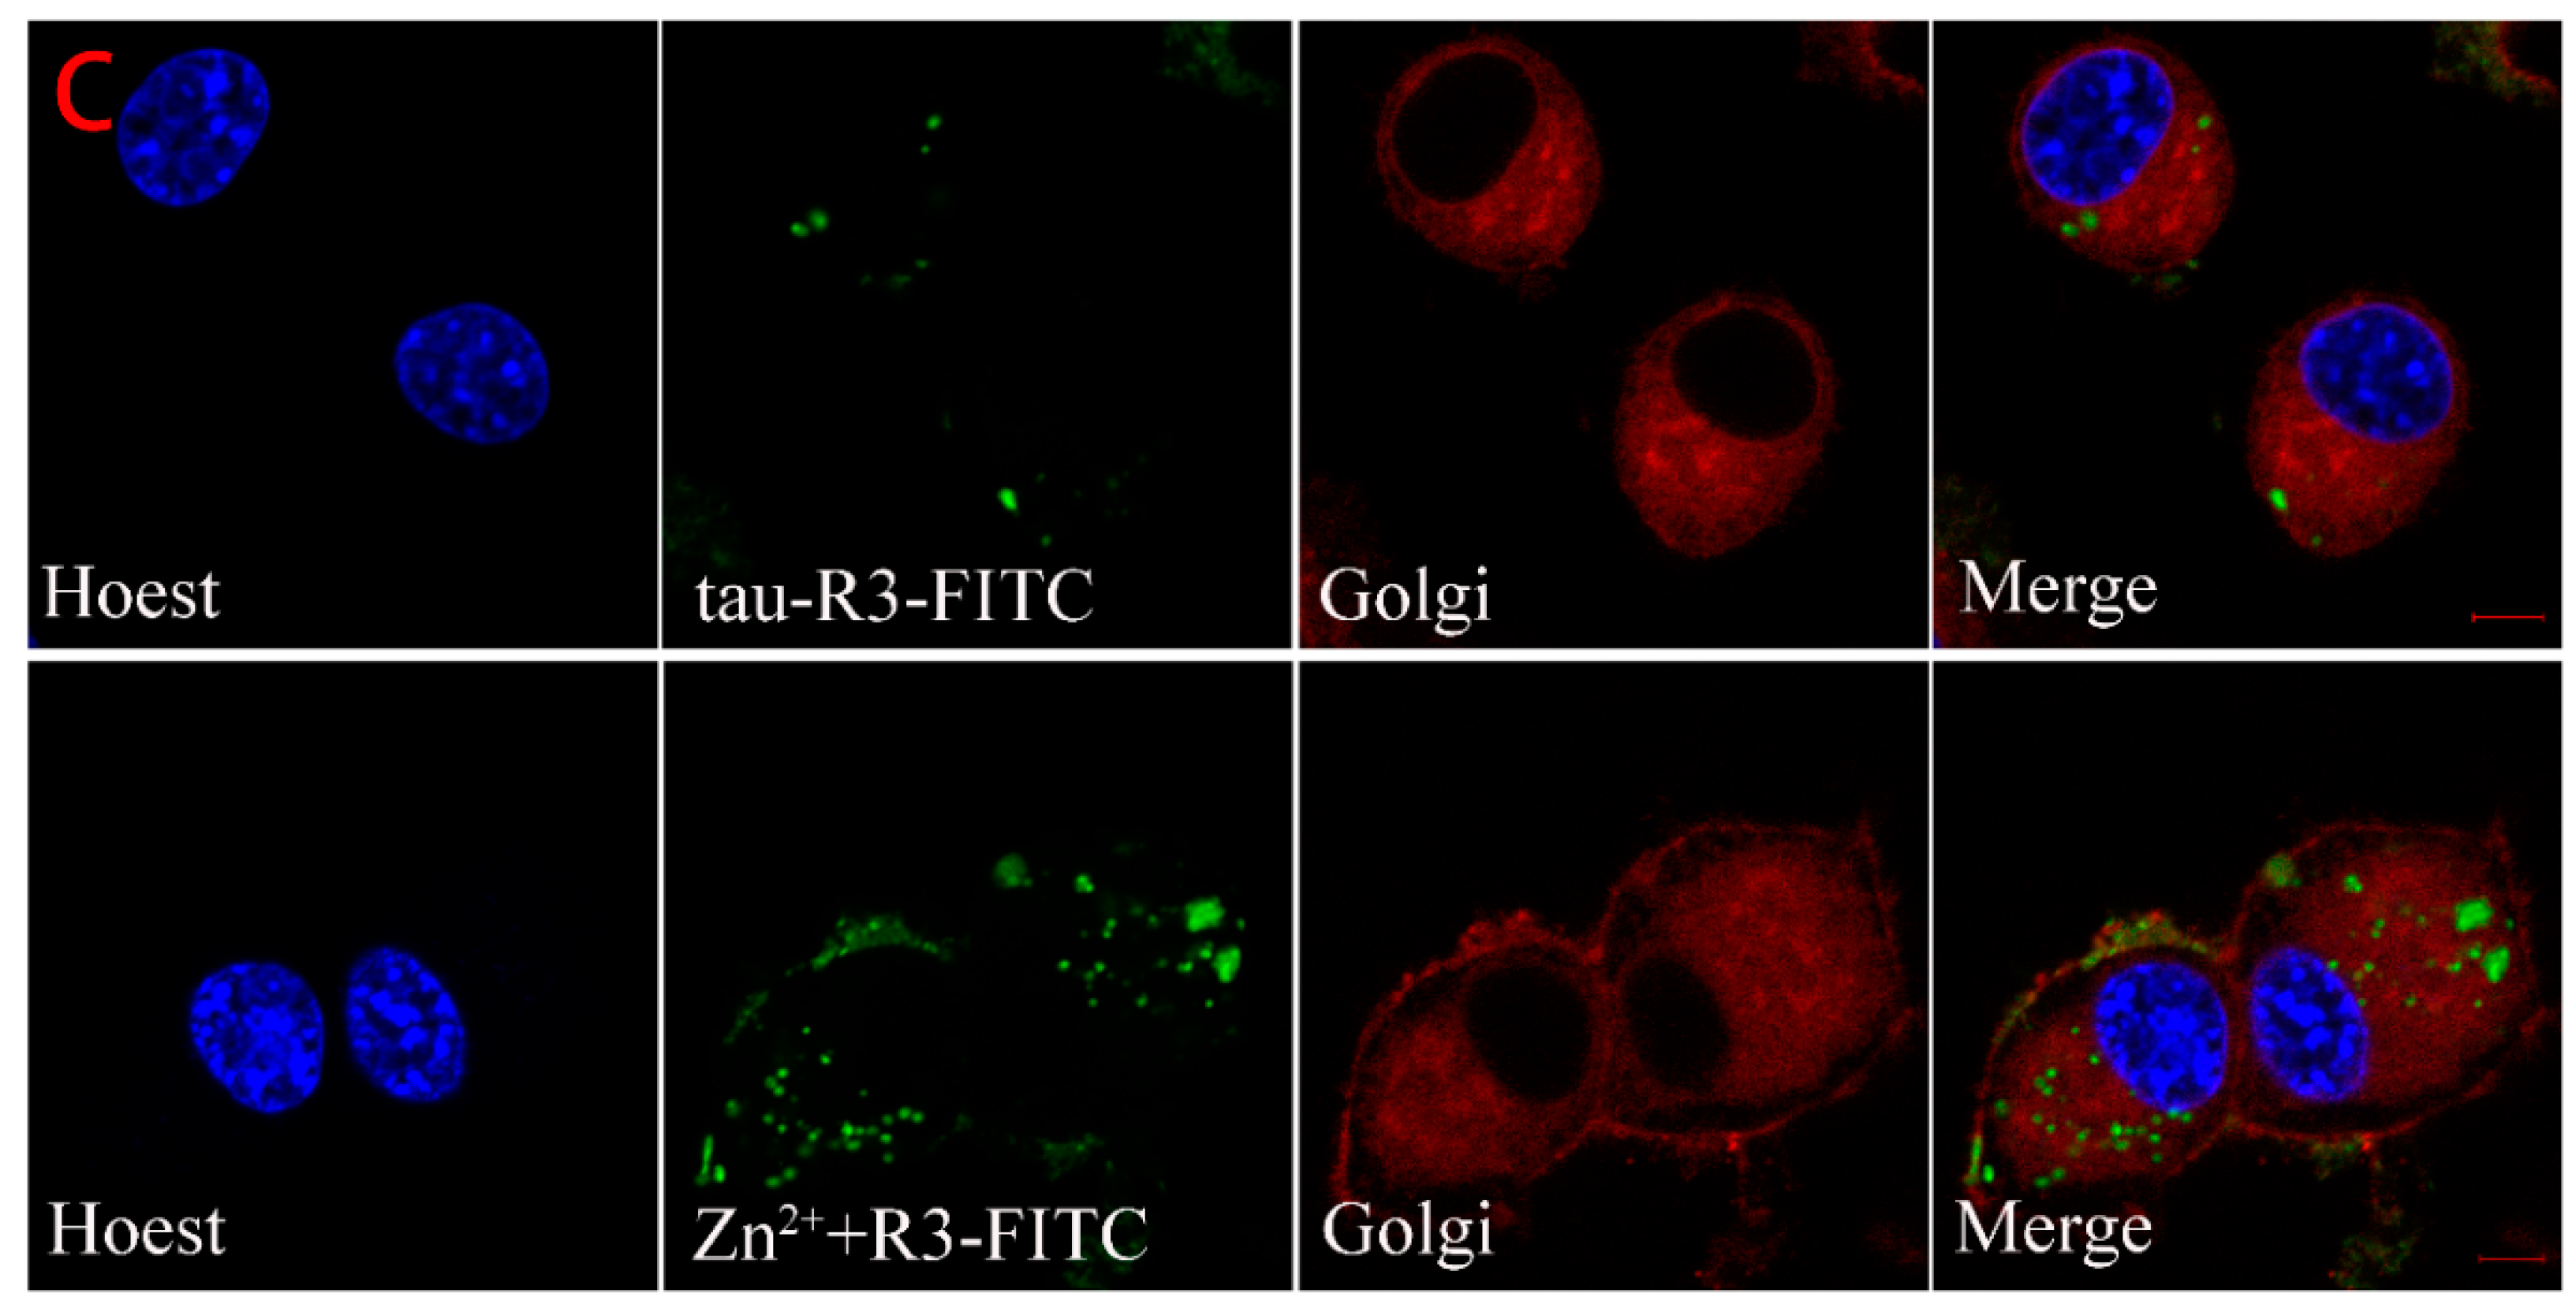
The above results indicate that the exogenous Zn2+-tau-R3 is more toxic to N2A cell lines and nerve cells. To explore the mechanism, we checked whether the different tau-R3 aggregates could enter the cells. Thus, we added the tau-R3 protein labled with fluoresceine isothiocyanate (tau-R3–FITC) aggregates prepared in the presence or absence of Zn2+ to the N2A cells, which were stained with organelle-specific fluorescent red dyes for plasma membrane, endoplasmic reticulum, or Golgi. Confocal analysis showed that both tau-R3 aggregates and Zn2+-tau-R3 oligomers entered the N2A cells, and were mainly distributed throughout the cytoplasm, including the plasma membrane (Figure 8). We also found that more Zn2+-tau-R3 entered the cells compared with tau-R3, which may be one of the reasons that Zn2+-tau-R3 was more toxic to neuronal cells.
3. Discussion
As one of the most abundant essential elements in the brain, Zn2+ is involved in normal brain development and nervous functions, especially in the modulation of synaptic transmission and plasticity [38,39,40]. In AD brains, Zn2+ concentrations were elevated in degenerated brain regions, and much higher levels of Zn2+ were detected in amyloid plaques and NFT [41]. Impaired Zn2+ homeostasis in the brain was linked with the development of AD pathology [42,43,44]. Previously, we and others have reported that Zn2+ at micromolar concentrations strongly inhibited the fibrillization of Aβ and promoted it to grow into amorphous aggregates [45]. Here, we first investigated the thermodynamic properties of tau-R3 binding with Zn2+ and other metal ions including Mn2+, Mo5+, and Fe3+ by ITC, and found that only the titration of Zn2+ into tau-R3 solution resulted in large exothermic peaks. This suggested the specific binding between tau-R3 and Zn2+. We found that tau-R3 bound Zn2+ probably via its Cys residue with moderate affinity (the dissociation constant was calculated to be approximately 14.7 μM), to form a 1:2 Zn2+-R3 complex. The physiological concentration of free Zn2+ in cells is between 1–10 nM, but in AD brains, Zn2+ is enriched, and its intracellular concentrations can be in the range of 10–300 μM. [46] Therefore, the binding constant obtained in this study is reasonable. Full-length tau has two Cys (C291 and C322) residues, which were located in the R2 and R3 fragments, respectively. Zn2+ bound to full-length tau by interacting with C291 and C322, with the stoichiometry value n = 1 and binding constant exceeding 106 M−1 [47,48]. When Cys291 was mutated to Ala, the binding number and dissociation constant were decreased to 0.44 μM and 9.71 μM, respectively [27], which were much comparable with the values obtained with tau-R3 in this study. Although there is no specific binding between tau-R3 and Mn2+, Mo5+, or Fe3+, these metal ions did promote the fibrillization of tau-R3, as indicated by much higher ThT fluorescence intensities than tau-R3 incubated alone or co-incubated with Zn2+ in Figure 3. ThT can specifically bind to the β-sheet structure rapidly, but not to monomeric or oligomeric intermediates. Therefore, the fluorescence intensity at 480 nm positively correlates with the fiber content. Interestingly, Zn2+ dramatically accelerated the aggregation of tau-R3, with the t50 (the time to 50% fibrillization) reduced from 15 h (tau-R3 alone) to six h. In addition, in the presence of Zn2+, tau-R3 formed much shorter filaments and many oligomers. Consistently, Zn2+ also accelerated the fibrillization of full-length tau and induced tau to form shorter fibrillar aggregates [47,48].
As a microtubule (MT)-associated protein, tau binds to and promotes the assembly of microtubules. However, in diseased conditions, tau is subjected to hyperphosphorylation and detaches from the MTs. The now free tau assembles into small aggregates known as tau oligomers in route of NFT formation. A large body of studies has shown that tau oligomers are the most toxic species among the different aggregation forms of tau [34]. It was demonstrated that brain injection of tau oligomers rather than tau monomers or fibrils led to the synaptic, mitochondrial, and cognitive abnormalities in the mice [49]. In our study, both tau-R3 and Zn2+-tau-R3 aggregates could enter cells, and more Zn2+-tau-R3 entered the cells compared with tau-R3. Consistent with this, Zn2+-tau-R3 aggregates showed much higher toxicities toward N2A cells, with lower cell viabilities and higher intracellular ROS levels. We also tested the toxicities of different tau-R3 aggregates to the hippocampal neuros. As shown in Figure 7, when incubated with tau-R3 aggregates, the neurons showed a very short axon and little dendrite branching. The situation of neurons cultured with Zn2+-tau-R3 aggregates was even worse. The neurons were degraded, almost no neurite was observed, and the communication between neurons was absolutely disrupted. We suggest that Zn2+ enhanced tau-R3 toxicities at least partially due to the formation of tau oligomers. More noteworthy, studies have discovered that tau oligomers induced endogenous tau to misfold and propagate from affected to unaffected brain regions in mice [33].
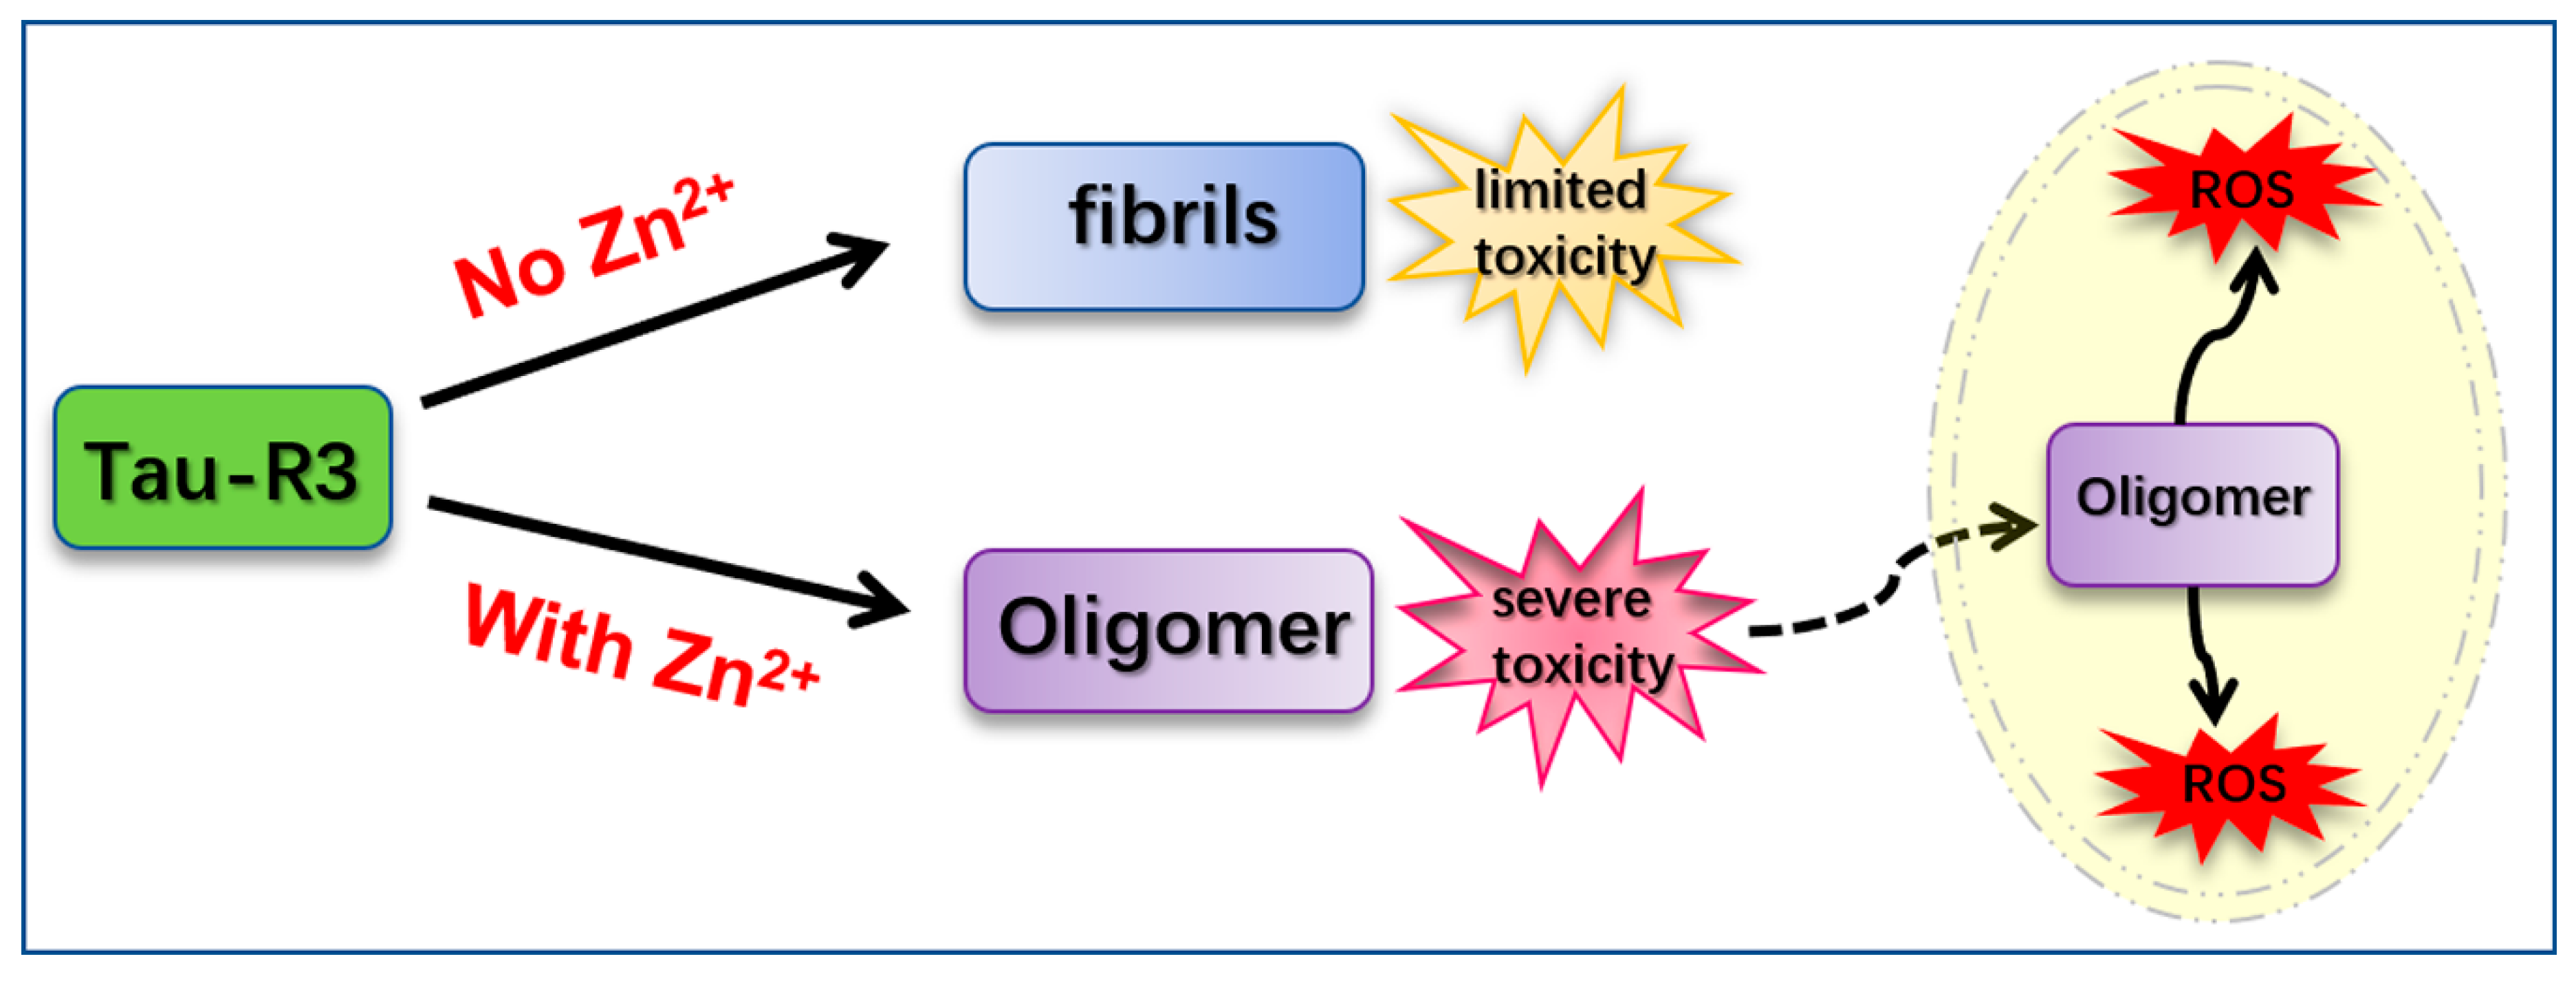
Our findings suggest that tau-R3 aggregates had limited toxicities to nerve cells. In the presence of Zn2+, the toxicities of tau-R3 were severely enhanced. Considering the concept that tau oligomers are the toxic entities responsible for neurodegeneration in tauopathies and that tau pathology propagation from affected to unaffected brain regions was dependent on tau oligomers but not monomers or fibrils, we propose that the augmented toxicity is at least partially attributed to tau oligomers formation induced by Zn2+. Based on our data, we propose a hypothetical model to demonstrate how Zn2+ aggravates tau-R3 aggregation and toxicity (Figure 9). Tau-R3 binds Zn2+ with moderate affinity and forms the 1:2 Zn2+-tau-R3 complex. Zn2+ remarkably accelerates the aggregation of tau-R3, and meanwhile promotes the formation of tau oligomers. Some of the Zn2+-tau aggregates, especially in the soluble oligomeric form, are then taken up by cells via endocytosis, micropinocytosis, or some unknown pathway. Once entering cells, tau oligomers, together with the extracellular large fibrils, promote ROS production [34]. Our study suggests an involvement of Zn2+ in the pathogenesis of AD.
4. Materials and Methods
4.1. Materials
Tau-R3 (306-336: VQIVYKPVDLSKVTSKCGSLGNIHHKPGGGQ) and tau-R3-FITC were synthesized at China Peptides Co., Ltd. (Shanghai, China). Thioflavin T (ThT) was purchased from Sigma. Heparin (average molecular mass of 12 kDa) was obtained from Aladdin. All of the metal cations used were chloride forms of analytical grade, which were all purchased from Macklin, and Tris-base was purchased from VOVON. Cell culture media was purchased from HyClone and Gibco. The Cell-Counting Kit-8 Assay, Oxygen Species Assay Kit, Hoechst 33342, Dil-Tracker Red, ER-Tracker Red, and Golgi-Tracker Red were all obtained from Beyotime Biotechnology (Beyotime, Nanjing, China). All of the other chemicals that were used were of analytical grade.
4.2. Isothermal Titration Calorimetry (ITC)
ITC experiments were carried out at 25.0 °C using the MicroCal iTC-200 microcalorimeter (GE Healthcare, New York, NY, USA), as described previously [50]. Briefly, tau-R3 (100 μM, in 50 mM of Tris-HCl buffer, pH 7.4) was loaded into the sample cell (200 μL), and metals ions (Zn2+, Fe3+, Al3+, or Cr2+, 2 mM) in Tris-HCl buffer (50 mM, pH 7.4) were added to the syringe (40 μL). The titration parameters were set as follows: stirring speed, 1000 rpm; titration volume per drop, two μL; duration of each drop, 4 s; titration interval time, 120 s; total number of titrations, 19 times. The resulting data were fitted to a one-site binding model using MicroCal ORIGIN software (ORIGIN 7.0, Northampton, MA, USA) supplied with the instrument. A nonlinear least-squares method was used to obtain the best-fit parameters, including the number of binding sites, n; the association constant, Ka; and the change of enthalpy, ΔH. All of the experiments were performed in triplicate under the same conditions.
4.3. UV-Vis Spectroscopy
UV/Vis spectra were monitored on a LAMBDA 25 UV-visible spectrophotometer (Perkin Elmer, Waltham, MA, USA) with a one-cm cuvette at room temperature. Briefly, one μM of tau-R3 peptide in Tris buffer (50 mM, pH 7.4) was titrated with 0.1 mM of ZnCl2. The absorption spectra were recorded over the wavelength range of 200–300 nm, and normalized with absorbance at 300 nm.
4.4. Monitoring Tau-R3 Fibrillization by Thioflavin T Fluorescence
The one-mM ThT stock solution was freshly prepared in 50 mM of Tris-HCl buffer (pH 7.4) and passed through a 0.45-μm pore size filter to remove insoluble particles prior to use. Tau-R3 (150 μM) was incubated with 20 μM of ThT and 16 μM of heparin in the presence or absence of 10 μM of metal ion solutions. Samples (200 μL) were transferred to 96-well plates and incubated at 37 °C for 31 h. The fluorescence of ThT was excited at 440 nm, and the emission was measured at 480 nm on a fluorescence spectrophotometer (Fluoroskan Ascent FL 4500, Thermo Scientific, Waltham, MA, USA), with the measurement interval of 10 min. Each measurement was run in triplicate or quadruplicate per experiment, and repeated at least three times.
4.5. Circular Dichroism Spectroscopy
The effects of metal ions on the secondary structure of tau-R3 were analyzed by CD spectra. Briefly, tau-R3 protein and metal ions were prepared in PB buffer at concentrations of 50 μM and 10 μM, respectively. Tau-R3 was incubated with or without 10 μM of different metal ions in the presence of heparin at 37 °C for zero to 24 h, before their CD spectrum were collected at 25 °C using a J-815 circular dichroism analyzer (JASCO, Tokyo, Japan). Before performing the experiments, the instrument optics and sample chamber were flushed with high-purity N2. The parameter settings were as follows: wavelength range, 190–250 nm; scanning speed, 50 nm/min; sensitivity, 50 mdeg; reaction time, 0.25 s; band width, 0.5 nm; number of scans, three. The spectra were corrected for the corresponding buffer and smoothed using a fast Fourier transform filter (FFT). The results that were obtained were plotted using the Origin 8. 0 software (ORIGIN 8.0, Northampton, MA, USA).
4.6. Atomic Force Microscope (AFM)
Tau-R3 (50 μmol/L) was incubated with heparin (16 μmol/L) in the presence or absence of metal ions (10 μmol/L) at 37 °C for 24 h before imaging. The mica sheet was secured on the metal substrate sheet with double-sided tape. Five to 10 layers of mica surface were freshly disassociated with transparent glue until the surface of the mica plate was flat and smooth. The 50-fold diluted sample (50 μL) was placed on the flat and smooth mica plate and allowed to stand for 5 min. Then, we drew one mL of ultrapure water and slowly washed the mica flakes. We repeated this twice, and the excess water was absorbed by filter paper. The tablets were sealed and then dried for 12 h, and finally observed by AFM scanning (Bruker Dimension Icon Scanning Probe Microscope, (Bruker, Santa Barbara, CA, USA)).
4.7. Cell Culture
Wild-type murine neuroblastoma Neuro-2A cells (N2A/WT) cells were purchased from the Shanghai Institute of Biological Sciences, Chinese Academy of Sciences (Shanghai, China). The cells were cultured in a mixed medium containing 5% fetal bovine serum, 1% penicillin G and streptomycin, 49% dulbecco’s modified eagle medium (DMEM), and 45% Opti-MEM. Tau-R3 (15 μM) was incubated with heparin (16 μM) in the presence or absence of metal ions (seven μM) at 37 °C for 24 h, before being applied to N2A cells for 24 h.
4.8. Cell Viability Measurement
N2A cells were cultured on a 96-well cell culture microplate at the density of 5 × 10³ cells/mL. After 24 h of incubation with tau-R3 in the presence or absence of Zn2+, the medium was removed, and 100 μL of fresh medium containing 10 μL of CCK-8 reagent was added. After incubation for 1 h, the absorbance at 450 nm was measured with a reference wavelength at 650 nm using a spectra MAX 190 microplate reader (Molecular Devices, Sunnyvale, CA, USA). Triplicates were performed throughout the procedures.
4.9. Measurement of ROS
N2A cells were cultured on six-well plates at the density of 1 × 10⁵ cell/mL. 2′,7′-Dichlorofluorescin diacetate (DCFH-DA) was diluted with serum-free DMEM to a final concentration of 10 μM. Then, the old medium was removed from the culture dish, and two mL of diluted DCFH-DA was added into each well. Cells were incubated at 37 °C for another 20 min, and then washed three times with serum-free DMEM to fully remove the extracellular DCFH-DA. Cells were harvested and washed three times with prechilled phosphate buffer saline (PBS) and resuspended in PBS. The fluorescence intensity was excited at 488 nm, and the emission was measured at 535 nm by flow cytometry (FACS Calibur, Becton Dickinson, NJ, USA). The results are expressed as fold change compared with the corresponding controls. Assays were run in triplicate.
4.10. Neuronal Culture
The hippocampus and cortex of the brain of newborn B6129SF2/J mice were digested with 0.4 mg/mL of papain at 37 °C for 30 min. The digested tissue was suspended, centrifuged, resuspended, counted, and then seeded in a six-well cell culture plate (7 × 100,000 cells/well) pre-coated with 0.1 mg/mL of polylysine. After 4 h, the old medium was changed with raise medium (neurobasal medium with 2% B27 supplement, 0.5 mL of Lglutamine and 50 U/mL of penicillin-streptomycin), and then one-half of the medium was replaced every three days. On day seven, the cultured neurons were treated with tau aggregates (7.5 μM tau-R3, 3.5 μM Zn2+, and 1.9 μM heparin) and incubated at 37 °C for 24 h before being added to the neurons) for 12 h.
4.11. Immunofluorescence Analysis of Map2 Protein
For immunocytochemistry, cells were fixed in the cell culture dishes with 4% paraformaldehyde in PBS, and then permeabilized with 0.2% Triton X-100 in PBS. Nonspecific binding was blocked with 10% goat serum in PBS for 1 h at room temperature. Primary anti-MAP-2 antibody (1:200, rabbit monoclonal, ProteinTech, Chicago, IL, USA) diluted in blocking solution was applied and incubated at 4 °C overnight followed by three washes with PBS. Secondary antibody conjugated to Dylight-488 (1:1000 dilution, Abcam, Cambridgeshire, England) was then added and incubated at room temperature for 1 h. Cells were washed with PBS three times, and then visualized using a confocal microscope (ZEISS, Jena, Germany).
4.12. Cellular Localization of Tau-R3 and Zn2+-Tau-R3 in N2A Cells
N2A cells were cultured on laser confocal dishes at the density of 1 × 10⁵ cell/mL at 37 °C for 24 h. Then, the old medium was removed from the culture dish, and two mL of 15 μM of tau-R3-FITC aggregates prepared in the presence or absence of seven μM of Zn2+ were added into each well. Cells were incubated at 37 °C for another 24 h, and then washed three times with serum-free DMEM. Hoechst 33342, Dil-Tracker Red, ER-Tracker Red, and Golgi-Tracker Red obtained from Beyotime Biotechnology were then used to stain the nuclei, plasma membrane, endoplasmic reticulum, and Golgi of the N2A cells. The experimental steps were all carried out according to the kit instructions. Then, the cells were visualized using a confocal microscope (ZEISS, Jena, Germany).
4.13. Statistical Analysis
The data in all of the panels were expressed as the mean ± S.E.M. p values were determined by two-tailed, unpaired t-tests with GraphPad Prism5.0 software (Lo Jolla, CA, USA).
5. Conclusions
In the present study, the effects of Zn2+ on tau-R3 aggregation and neurotoxicity were investigated through a series of chemical and biological experiments. The combination ratio of Zn2+ and tau-R3 is 1:2 with a binding constant of K = (6.82 ± 0.29) × 104 M−1 via isothermal titration calorimetry. Through thioflavin T fluorescence, circular dichroism spectroscopy, and TEM, we found that Zn2+ accelerated tau-R3 aggregation, decreased the content of irregular curl with the increasing of the β-sheet, and promoted tau-R3 to form parts of shorter, smaller oligomers. Compared with tau-R3, Zn2+-tau-R3 aggregates were more toxic to N2A cells and induced N2A cells to produce more ROS. The dendrites and axons of Zn2+-tau-R3-treated neurons become fewer and shorter, resulting in a large number of neuronal deaths. Our data demonstrate that Zn2+ can aggravate tau-R3 aggregation and neurotoxicity, providing clues to understanding the relationship between Zn2+ dyshomeostasis and the etiology of Alzheimer’s disease.
Supplementary Materials
Supplementary materials can be found at https://0-www-mdpi-com.brum.beds.ac.uk/1422-0067/20/3/487/s1.
Author Contributions
X.D. and J.N. conceived and designed the experiments; X.L. performed the experiments; X.D. and X.L. analyzed the data; J.N. and X.D. contributed reagents/materials/analysis tools; X.D. and X.L. wrote the paper.
Funding
This research was funded by the National Natural Science Foundation of China (No. 21771126, 21603147 and 21877081).
Conflicts of Interest
The authors declare no conflict of interest.
Abbreviations
| AD | Alzheimer’s disease |
| NFT | neurofibrillary tangles |
| tau-R3 | the third repeat unit of the microtubule-binding domain of tau |
| ROS | reactive oxygen species |
| PP2A | protein phosphatase 2A |
| Aβ | amyloid-β |
| p-tau | hyperphosphorylated tau |
| MAP | microtubule-associated protein |
| PHF | paired helix filaments |
| ITC | isothermal titration calorimetry |
| ThT | thioflavin T |
| CD | circular dichroism spectroscopy |
| FFT | Fourier transform filter |
| DCFH-DA | 2,7-Dichlorodi-hydrofluorescein diacetate |
| PB | Phosphate buffer |
| FITC | fluoresceine isothiocyanate |
| DMEM | dulbecco’s modified eagle medium |
| PBS | phosphate buffer saline |
References
- Cipriani, G.; Dolciotti, C.; Picchi, L.; Bonuccelli, U. Alzheimer and his disease: A brief history. Neurol. Sci. 2011, 32, 275–279. [Google Scholar] [CrossRef] [PubMed]
- Glenner, G.G. Reprint of “Alzheimer’s disease: Initial report of the purification and characterization of a novel cerebrovascular amyloid protein”. Biochem. Biophysic. Res. Commun. 2012, 425, 534–539. [Google Scholar] [CrossRef] [PubMed]
- Grundke-Iqbal, I.; Iqbal, K.; Tung, Y.C.; Quinlan, M.; Wisniewski, H.M.; Binder, L.I. Abnormal phosphorylation of the microtubule-associated protein tau (tau) in Alzheimer cytoskeletal pathology. Proc. Natl. Acad. Sci. USA 1986, 83, 4913–4917. [Google Scholar] [CrossRef] [PubMed]
- World Alzheimer Report 2018. Available online: https://www.sogou.com/link?url=hedJjaC291MORyDunQ5_N0zLsl91bt5WDjCKgfruEPPVigbO6Jra9wOvti-wiKWCreaVHN88tHY (accessed on 21 September 2018).
- Binder, L.I.; Frankfurter, A.; Rebhun, L.I. Differential localization of MAP-2 and tau in mammalian neurons in situ. Ann. N. Y. Acad. Sci. 1986, 466, 145–166. [Google Scholar] [CrossRef] [PubMed]
- Wee, M.; Chegini, F.; Power, J.H.T.; Majd, S. Tau Positive Neurons Show Marked Mitochondrial Loss and Nuclear Degradation in Alzheimer’s Disease. Curr. Alzheimer Res. 2018, 15, 928–937. [Google Scholar] [CrossRef]
- Liu, F.; Gong, C.X. Tau exon 10 alternative splicing and tauopathies. Mol. Neurodegener. 2008, 3, 8. [Google Scholar] [CrossRef] [Green Version]
- Lee, G.; Cowan, N.; Kirschner, M. The primary structure and heterogeneity of tau protein from mouse brain. Science 1988, 239, 285–288. [Google Scholar] [CrossRef]
- Wischik, C.M.; Novak, M.; Edwards, P.C.; Klug, A.; Tichelaar, W.; Crowther, R.A. Structural characterization of the core of the paired helical filament of Alzheimer disease. Proc. Natl. Acad. Sci. USA 1988, 85, 4884–4888. [Google Scholar] [CrossRef]
- Wille, H.; Drewes, G.; Biernat, J.; Mandelkow, E.M.; Mandelkow, E. Alzheimer-like paired helical filaments and antiparallel dimers formed from microtubule-associated protein tau in vitro. J. Cell Biol. 1992, 118, 573–584. [Google Scholar] [CrossRef] [Green Version]
- von Bergen, M.; Barghorn, S.; Li, L.; Marx, A.; Biernat, J.; Mandelkow, E.M.; Mandelkow, E. Mutations of tau protein in frontotemporal dementia promote aggregation of paired helical filaments by enhancing local beta-structure. J. Biolog. Chem. 2001, 276, 48165–48174. [Google Scholar] [CrossRef]
- Tomoo, K.; Yao, T.M.; Minoura, K.; Hiraoka, S.; Sumida, M.; Taniguchi, T.; Ishida, T. Possible role of each repeat structure of the microtubule-binding domain of the tau protein in in vitro aggregation. J. Biochem. 2005, 138, 413–423. [Google Scholar] [CrossRef] [PubMed]
- Bush, A.I. The metal theory of Alzheimer’s disease. J. Alzheimer’s Dis. 2013, 33 (Suppl. 1), S277–S281. [Google Scholar] [CrossRef] [PubMed]
- Barnham, K.J.; Bush, A.I. Metals in Alzheimer’s and Parkinson’s diseases. Curr. Opin. Chem. Biol. 2008, 12, 222–228. [Google Scholar] [CrossRef] [PubMed]
- Jellinger, K.A. The relevance of metals in the pathophysiology of neurodegeneration, pathological considerations. Int. Rev. Neurobiol. 2013, 110, 1–47. [Google Scholar] [PubMed]
- Lovell, M.A.; Robertson, J.D.; Teesdale, W.J.; Campbell, J.L.; Markesbery, W.R. Copper, iron and zinc in Alzheimer’s disease senile plaques. J. Neurolog. Sci. 1998, 158, 47–52. [Google Scholar] [CrossRef]
- Chen, T.; Zhang, Y.; Shang, Y.; Gu, X.; Zhu, Y.; Zhu, L. NBD-BPEA regulates Zn(2+)- or Cu(2+)-induced Abeta40 aggregation and cytotoxicity. Food Chem. Toxicol. 2018, 119, 260–267. [Google Scholar] [CrossRef] [PubMed]
- Boopathi, S.; Kolandaivel, P. Fe(2+) binding on amyloid beta-peptide promotes aggregation. Proteins 2016, 84, 1257–1274. [Google Scholar] [CrossRef] [PubMed]
- Ma, Q.F.; Li, Y.M.; Du, J.T.; Kanazawa, K.; Nemoto, T.; Nakanishi, H.; Zhao, Y.F. Binding of copper (II) ion to an Alzheimer’s tau peptide as revealed by MALDI-TOF MS, CD, and NMR. Biopolymers 2005, 79, 74–85. [Google Scholar] [CrossRef] [PubMed]
- Du, X.; Zheng, Y.; Wang, Z.; Chen, Y.; Zhou, R.; Song, G.; Ni, J.; Liu, Q. Inhibitory act of selenoprotein P on Cu(+)/Cu(2+)-induced tau aggregation and neurotoxicity. Inorg. Chem. 2014, 53, 11221–11230. [Google Scholar] [CrossRef]
- Prasad, A.S. Impact of the discovery of human zinc deficiency on health. J. Am. Coll. Nutr. 2009, 28, 257–265. [Google Scholar] [CrossRef]
- Chasapis, C.T.; Loutsidou, A.C.; Spiliopoulou, C.A.; Stefanidou, M.E. Zinc and human health: An update. Arch. Toxicol. 2012, 86, 521–534. [Google Scholar] [CrossRef] [PubMed]
- Tyszka-Czochara, M.; Grzywacz, A.; Gdula-Argasinska, J.; Librowski, T.; Wilinski, B.; Opoka, W. The role of zinc in the pathogenesis and treatment of central nervous system (CNS) diseases. Implications of zinc homeostasis for proper CNS function. Acta Pol. Pharm. 2014, 71, 369–377. [Google Scholar] [PubMed]
- Beyer, N.; Coulson, D.T.; Heggarty, S.; Ravid, R.; Hellemans, J.; Irvine, G.B.; Johnston, J.A. Zinc transporter mRNA levels in Alzheimer’s disease postmortem brain. J. Alzheimer’s Dis. 2012, 29, 863–873. [Google Scholar] [CrossRef] [PubMed]
- Wang, C.Y.; Wang, T.; Zheng, W.; Zhao, B.L.; Danscher, G.; Chen, Y.H.; Wang, Z.Y. Zinc overload enhances APP cleavage and Abeta deposition in the Alzheimer mouse brain. PLoS ONE 2010, 5, e15349. [Google Scholar] [CrossRef] [PubMed]
- Huang, J.; Yao, Y.; Lin, J.; Ye, Y.H.; Sun, W.Y.; Tang Dagger, W.X. The solution structure of rat Abeta-(1-28) and its interaction with zinc ion: Insights into the scarcity of amyloid deposition in aged rat brain. J. Biol. Inorg. Chem. 2004, 9, 627–635. [Google Scholar] [CrossRef] [PubMed]
- Mo, Z.Y.; Zhu, Y.Z.; Zhu, H.L.; Fan, J.B.; Chen, J.; Liang, Y. Low micromolar zinc accelerates the fibrillization of human tau via bridging of Cys-291 and Cys-322. J. Biol. Chem. 2009, 284, 34648–34657. [Google Scholar] [CrossRef]
- Sun, X.Y.; Wei, Y.P.; Xiong, Y.; Wang, X.C.; Xie, A.J.; Wang, X.L.; Yang, Y.; Wang, Q.; Lu, Y.M.; Liu, R.; et al. Synaptic released zinc promotes tau hyperphosphorylation by inhibition of protein phosphatase 2A (PP2A). J. Biolog. Chem. 2012, 287, 11174–11182. [Google Scholar] [CrossRef]
- Paglia, G.; Miedico, O.; Cristofano, A.; Vitale, M.; Angiolillo, A.; Chiaravalle, A.E.; Corso, G.; Di Costanzo, A. Distinctive Pattern of Serum Elements During the Progression of Alzheimer’s Disease. Sci. Rep. 2016, 6, 22769. [Google Scholar] [CrossRef] [Green Version]
- Krezel, A.; Maret, W. Dual nanomolar and picomolar Zn(II) binding properties of metallothionein. J. Am. Chem. Soc. 2007, 129, 10911–10921. [Google Scholar] [CrossRef]
- Naiki, H.; Higuchi, K.; Hosokawa, M.; Takeda, T. Fluorometric determination of amyloid fibrils in vitro using the fluorescent dye, thioflavin T1. Analyt. Biochem. 1989, 177, 244–249. [Google Scholar] [CrossRef]
- LeVine, H., 3rd. Quantification of beta-sheet amyloid fibril structures with thioflavin T. Methods Enzymol. 1999, 309, 274–284. [Google Scholar] [PubMed]
- Lasagna-Reeves, C.A.; Castillo-Carranza, D.L.; Sengupta, U.; Guerrero-Munoz, M.J.; Kiritoshi, T.; Neugebauer, V.; Jackson, G.R.; Kayed, R. Alzheimer brain-derived tau oligomers propagate pathology from endogenous tau. Sci. Rep. 2012, 2, 700. [Google Scholar] [CrossRef] [PubMed]
- Shafiei, S.S.; Guerrero-Munoz, M.J.; Castillo-Carranza, D.L. Tau Oligomers: Cytotoxicity, Propagation, and Mitochondrial Damage. Front Aging Neurosci. 2017, 9, 83. [Google Scholar] [CrossRef] [PubMed]
- Greenough, M.A.; Camakaris, J.; Bush, A.I. Metal dyshomeostasis and oxidative stress in Alzheimer’s disease. Neurochem. Int. 2013, 62, 540–555. [Google Scholar] [CrossRef]
- Tonnies, E.; Trushina, E. Oxidative Stress, Synaptic Dysfunction, and Alzheimer’s Disease. J. Alzheimer’s Dis. 2017, 57, 1105–1121. [Google Scholar] [CrossRef] [PubMed] [Green Version]
- Huang, X.; Moir, R.D.; Tanzi, R.E.; Bush, A.I.; Rogers, J.T. Redox-active metals, oxidative stress, and Alzheimer’s disease pathology. Ann. N. Y. Acad. Sci. 2004, 1012, 153–163. [Google Scholar] [CrossRef]
- Smart, T.G.; Hosie, A.M.; Miller, P.S. Zn2+ ions: Modulators of excitatory and inhibitory synaptic activity. Neuroscientist 2004, 10, 432–442. [Google Scholar] [CrossRef]
- Paoletti, P.; Vergnano, A.M.; Barbour, B.; Casado, M. Zinc at glutamatergic synapses. Neuroscience 2009, 158, 126–136. [Google Scholar] [CrossRef]
- Karakas, E.; Simorowski, N.; Furukawa, H. Structure of the zinc-bound amino-terminal domain of the NMDA receptor NR2B subunit. EMBO J. 2009, 28, 3910–3920. [Google Scholar] [CrossRef] [Green Version]
- Bitanihirwe, B.K.; Cunningham, M.G. Zinc: The brain’s dark horse. Synapse 2009, 63, 1029–1049. [Google Scholar] [CrossRef]
- Yuan, Y.; Niu, F.; Liu, Y.; Lu, N. Zinc and its effects on oxidative stress in Alzheimer’s disease. Neurol. Sci. 2014, 35, 923–928. [Google Scholar] [CrossRef] [PubMed]
- Bush, A.I.; Pettingell, W.H.; Multhaup, G.; d Paradis, M.; Vonsattel, J.P.; Gusella, J.F.; Beyreuther, K.; Masters, C.L.; Tanzi, R.E. Rapid induction of Alzheimer A beta amyloid formation by zinc. Science 1994, 265, 1464–1467. [Google Scholar] [CrossRef] [PubMed]
- Jiji, A.C.; Arshad, A.; Dhanya, S.R.; Shabana, P.S.; Mehjubin, C.K.; Vijayan, V. Zn(2+) Interrupts R4-R3 Association Leading to Accelerated Aggregation of Tau Protein. Chemistry 2017, 23, 16976–16979. [Google Scholar] [CrossRef] [PubMed]
- Du, X.; Li, H.; Wang, Z.; Qiu, S.; Liu, Q.; Ni, J. Selenoprotein P and selenoprotein M block Zn2+ -mediated Abeta42 aggregation and toxicity. Metallomics 2013, 5, 861–870. [Google Scholar] [CrossRef] [PubMed]
- Sensi, S.L.; Paoletti, P.; Bush, A.I.; Sekler, I. Zinc in the physiology and pathology of the CNS. Nat. Rev. Neurosci. 2009, 10, 780–791. [Google Scholar] [CrossRef] [PubMed]
- Hu, J.Y.; Zhang, D.L.; Liu, X.L.; Li, X.S.; Cheng, X.Q.; Chen, J.; Du, H.N.; Liang, Y. Pathological concentration of zinc dramatically accelerates abnormal aggregation of full-length human Tau and thereby significantly increases Tau toxicity in neuronal cells. Biochim. Biophys. Acta Mol. Basis Dis. 2017, 1863, 414–427. [Google Scholar] [CrossRef] [PubMed]
- Roman, A.Y.; Devred, F.; Byrne, D.; La Rocca, R.; Ninkina, N.N.; Peyrot, V.; Tsvetkov, P.O. Zinc Induces Temperature-Dependent Reversible Self-Assembly of Tau. J. Mol. Biol. 2018. [Google Scholar] [CrossRef]
- Lasagna-Reeves, C.A.; Castillo-Carranza, D.L.; Sengupta, U.; Clos, A.L.; Jackson, G.R.; Kayed, R. Tau oligomers impair memory and induce synaptic and mitochondrial dysfunction in wild-type mice. Mol. Neurodegener. 2011, 6, 39. [Google Scholar] [CrossRef] [Green Version]
- Du, X.; Wang, Z.; Zheng, Y.; Li, H.; Ni, J.; Liu, Q. Inhibitory effect of selenoprotein P on Cu(+)/Cu(2+)-induced Abeta42 aggregation and toxicity. Inorg. Chem. 2014, 53, 1672–1678. [Google Scholar] [CrossRef]
Figure 1.
The sequence and location of R2 and R3 in six tau isoforms.

Figure 2.
Properties of Zn2+ binding to the third repeat unit of the microtubule-binding domain of tau (tau-R3). (A) Calorimetric titration of Zn2+ to tau-R3. The top panel represents the raw data for sequential two-μL injections of Zn2+ into tau-R3. The bottom panel shows the plot of the heat evolved (kilocalories) per mole of Zn2+ added against the molar ratio of Zn2+ to tau-R3. The data (solid square) was best fitted to a model with a single set of identical sites, and the solid line represents the best fit. (B) Spectrophotometric titration of Zn2+ to tau-R3, Zn2+/tau-R3 ratio ranges from 0–0.5.

Figure 3.
Metal ions altered tau-R3 fibrillization kinetics. 150-μM tau-R3 was incubated with 10 μM of cation (Mn2+, Mo5+, Fe3+ or Zn2+) or no cation. The buffer used was 50 mM of Tris-HCl buffer (50 mM Tris-base + 100 mM of NaCl, pH 7.4) containing 16 μM of heparin, and 20 μM of ThT. Solid lines represent fits of the data to the Boltzmann equation. λex = 440 nm, λem = 485 nm.

Figure 4.
Metal cations altered the secondary structure of tau-R3. (A–C) Circular dichroism spectra of tau-R3 binding with different additives (Mn2+, Mo5+, Fe3+, and Zn2+) incubated at 37 °C for zero, three, and 24 h, respectively. (D–F) mean residue ellipticity (deg.cm2.dmol−1) of tau-R3 incubated with different additives (Mn2+, Mo5+, Fe3+, and Zn2+) at 198 nm, 261 nm, and 196 nm, respectively in Phosphate buffer (PB) buffer (1.44 g/L Na2HPO4, 0.24 g/L KH2PO4, pH = 7.4).

Figure 5.
Atomic force microscope (AFM) images of tau-R3 aggregations formed with or without cations ((A) tau-R3; (B) Mn2++R3; (C) Mo5++R3; (D) Fe3++R3; and (E) Zn2++R3). Tau-R3 (50 μM) was incubated with heparin (16 μM) in the presence or absence of metal ions (10 μM) at 37 °C for 24 h. Then, each sample was diluted 50 times. Shorter filaments were indicated with red arrows and oligomers with blue arrows. The scale bars represent one μm.

Figure 6.
(A) Cell viability of Neuro-2A (N2A) cells tested by Cell-Counting Kit-8 Assay upon treatment with: lane 1, the control experiment; lane 2, tau-R3 aggregates; lane 3, Zn2+; and lane 4, Zn2+-tau-R3 aggregates. (B) The reactive oxygen species (ROS) levels in N2A cells upon treatment with: lane 1, the control experiment; lane 2, tau-R3; lane 3, Zn2+; and lane 4, Zn2+ plus tau-R3. ROS in living N2A cells were monitored by a fluorescence assay kit consisting of 2′,7′-dichlorofluorescin diacetate and quantified with flow cytometry. The final concentrations of tau-R3 and Zn2+ are 15 μM and 7 μM. (* p < 0.05, ** p < 0.01, *** p < 0.001 vs. control group; ### p < 0.001 vs. tau-R3 treated group).

Figure 7.
Typical confocal images of primary neurons treated with tau-R3 aggregates, Zn2+, or Zn2+-tau-R3 aggregates at 37 °C for 12 h. The final concentrations of tau-R3 and Zn2+ were 7.5 μM and 3.5 μM. (A–D) Hippocampal neuron, (E–H) cortical neuron, (A,E) the control group, (B,F) tau-R3 treated neurons, (C,G) Zn2+ treated neurons, (D,H) Zn2+-tau-R3 treated neurons. The scale bars represent 10 μm.

Figure 8.
Cellular localization of tau-R3 and Zn2+-tau-R3 in N2A cells. The final concentrations of tau-R3 and Zn2+ are 7.5 μM and 3.5 μM. Nuclei stained with Hoechst, plasma membrane stained with Dil-Tracker Red (A), endoplasmic reticulum stained with ER-Tracker Red (B), and Golgi complex stained with Golgi-Tracker Red (C). The scale bars represent 5 μm.


Figure 9.
Hypothetical model. The solid arrows represent the process of generation, and the virtual arrow represents the process of entering the cell.
Figure 9.
Hypothetical model. The solid arrows represent the process of generation, and the virtual arrow represents the process of entering the cell.

© 2019 by the authors. Licensee MDPI, Basel, Switzerland. This article is an open access article distributed under the terms and conditions of the Creative Commons Attribution (CC BY) license (http://creativecommons.org/licenses/by/4.0/).
Share and Cite
MDPI and ACS Style
Li, X.; Du, X.; Ni, J. Zn2+ Aggravates Tau Aggregation and Neurotoxicity. Int. J. Mol. Sci. 2019, 20, 487. https://0-doi-org.brum.beds.ac.uk/10.3390/ijms20030487
AMA Style
Li X, Du X, Ni J. Zn2+ Aggravates Tau Aggregation and Neurotoxicity. International Journal of Molecular Sciences. 2019; 20(3):487. https://0-doi-org.brum.beds.ac.uk/10.3390/ijms20030487
Chicago/Turabian StyleLi, Xuexia, Xiubo Du, and Jiazuan Ni. 2019. "Zn2+ Aggravates Tau Aggregation and Neurotoxicity" International Journal of Molecular Sciences 20, no. 3: 487. https://0-doi-org.brum.beds.ac.uk/10.3390/ijms20030487
Note that from the first issue of 2016, this journal uses article numbers instead of page numbers. See further details here.