Article

Bisoprolol, Known to Be a Selective β1-Receptor Antagonist, Differentially but Directly Suppresses IK(M) and IK(erg) in Pituitary Cells and Hippocampal Neurons

1
Department of Anesthesia, An Nan Hospital, China Medical University, Tainan 70965, Taiwan
2
Department of Anesthesia, China Medical University, Taichung 40402, Taiwan
3
Graduate Institute of Medical Sciences, Chang Jung Christian University, Tainan 71101, Taiwan
4
Department of Emergency Medicine, An Nan Hospital, China Medical University, Tainan 70965, Taiwan
5
Institute of Basic Medical Sciences, National Cheng Kung University Medical College, Tainan 70101, Taiwan
6
Department of Physiology, National Cheng Kung University Medical College, Tainan 70101, Taiwan
*
Author to whom correspondence should be addressed.
Int. J. Mol. Sci. 2019, 20(3), 657; https://0-doi-org.brum.beds.ac.uk/10.3390/ijms20030657
Submission received: 7 January 2019 / Revised: 27 January 2019 / Accepted: 30 January 2019 / Published: 2 February 2019
(This article belongs to the Section Molecular Endocrinology and Metabolism)

Abstract

:
Bisoprolol (BIS) is a selective antagonist of β1 adrenergic receptors. We examined the effects of BIS on M-type K+ currents (IK(M)) or erg-mediated K+ currents (IK(erg)) in pituitary GH3, R1220 cells, and hippocampal mHippoE-14 cells. As GH3 cells were exposed to BIS, amplitude of IK(M) was suppressed with an IC50 value of 1.21 μM. The BIS-induced suppression of IK(M) amplitude was not affected by addition of isoproterenol or ractopamine, but attenuated by flupirtine or ivabradine. In cell-attached current, BIS decreased the open probability of M-type K+ (KM) channels, along with decreased mean opening time of the channel. BIS decreased IK(erg) amplitude with an IC50 value of 6.42 μM. Further addition of PD-118057 attenuated BIS-mediated inhibition of IK(erg). Under current-clamp conditions, BIS depolarization increased the firing of spontaneous action potentials in GH3 cells; addition of flupirtine, but not ractopamine, reversed BIS-induced firing rate. In R1220 cells, BIS suppressed IK(M); subsequent application of ML-213(Kv7.2 channel activator) reversed BIS-induced suppression of the current. In hippocampal mHippoE-14 neurons, BIS inhibited IK(M) to a greater extent compared to its depressant effect on IK(erg). This demonstrated that in pituitary cells and hippocampal neurons the presence of BIS is capable of directly and differentially suppressing IK(M) and IK(erg), despite its antagonism of β1-adrenergic receptors.

1. Introduction

Bisoprolol (zebeta®; BIS), a phenoxy-2-propanol derivative, is recognized as an oral synthetic selective blocker of β1-adrenoceptor with antioxidant activity which exerts a number of potentially beneficial pharmacological effects such as atrial fibrillation, heart failure and postural tachycardia syndrome [1,2,3,4]. Due to its lipophilic nature, it facilitates entry into brain tissue to produce regulatory actions on central neurons [5,6]. Previous reports have demonstrated that BIS could bind to β1-adrenergic receptors inherently existing in brain areas including the pituitary gland and hippocampus [7,8,9,10,11]. An earlier study has also reported the ability of BIS to elevate blood prolactin level [12].
Carvedilol or other blockers of β-adrenergic receptors were indeed previously shown to suppress the amplitude of delayed-rectifier K+ currents (IK(DR)) and of HERG-mediated K+ currents [13,14]. There is also evidence showing that BIS appears to modulate a variety of ion currents. For example, previous reports have shown that BIS was able to reverse the down-regulation in mRNA expression of Na+, hyperpolarization-activated cation (HCN) and small-conductance Ca2+-activated K+ (SK) channels in failing hearts [15,16]. Surprisingly, little information is available regarding the underlying mechanism of actions of BIS or other structurally similar compounds on ionic currents in endocrine cells, neuroendocrine cells, or neurons, despite their wide clinical usage [2].
The KCNQ2, KCNQ3, and KCNQ5 genes are known to encode the core subunits of KV7.2, KV7.3 and KV7.5 channels, respectively. The increased activity of these K+ channels can generate the M-type K+ current (IK(M)) which is characterized by the activation in response to low threshold voltage and, once activated, displays a slowly activating and deactivating property [17,18,19,20]. Targeting IK(M) is growingly recognized as an adjunctive regimen for the treatment of many neurological disorders associated with neuronal hyper-excitability, such as cognitive dysfunction, neuropathic pain and epilepsy [21,22,23,24].
The erg-mediated K+ current (IK(erg)) is encoded by three different subfamily of genes KCNH giving rise to the pore-forming α-subunit of erg (or KV11) channels. This type of current is characterized by slow activation and fast inactivation kinetics. Because of its rapid inactivation kinetics, it can result in an inward rectification. The magnitude of these currents in endocrine or neuroendocrine cells can contribute to the maintenance of the resting potential, thereby influencing the discharge frequency of action potentials and the stimulus-secretion coupling in these cells (APs) [25,26,27,28]. Earlier reports in our laboratory have shown the ability of ranolazine, risperidone or methadone to suppress IK(erg) in pituitary GH3 cells [25,27,29] However, to what extent the presence of BIS exerts any actions on these types of ionic currents (e.g., IK(M) and IK(erg)) remains elusive.
In this study, we wanted to determine the possible underlying mechanism of BIS actions on perturbation of different ionic currents (e.g., IK(M), IK(erg) and IK(DR)) in pituitary GH3 cells and hippocampal mHippoE-14 neurons. Findings from this present study highlight the evidence to show that BIS can directly and differentially inhibit IK(M) and IK(erg) in a concentration-dependent manner in pituitary cells and hippocampal neurons. Such suppression of ion currents appears to be direct and is highly unlikely to be linked to its antagonistic action on β1 adrenergic receptors.

2. Results

2.1. Expression of KCNC1 (KV3.1), KCNQ2 (KV7.2) and KCNQ3 (KV7.3) in Pituitary GH3 Cells

In pituitary GH3 cells, as the M-type K+ current (IK(M)) was to be carried by the product of KCNQ2/KCNQ3 (or KV7.2/KV7.3) genes, we examined the mRNA levels of these genes. Our RT-PCR analysis demonstrated the mRNA expression of KCNQ2/KCNQ3 in these cells (Figure 1).

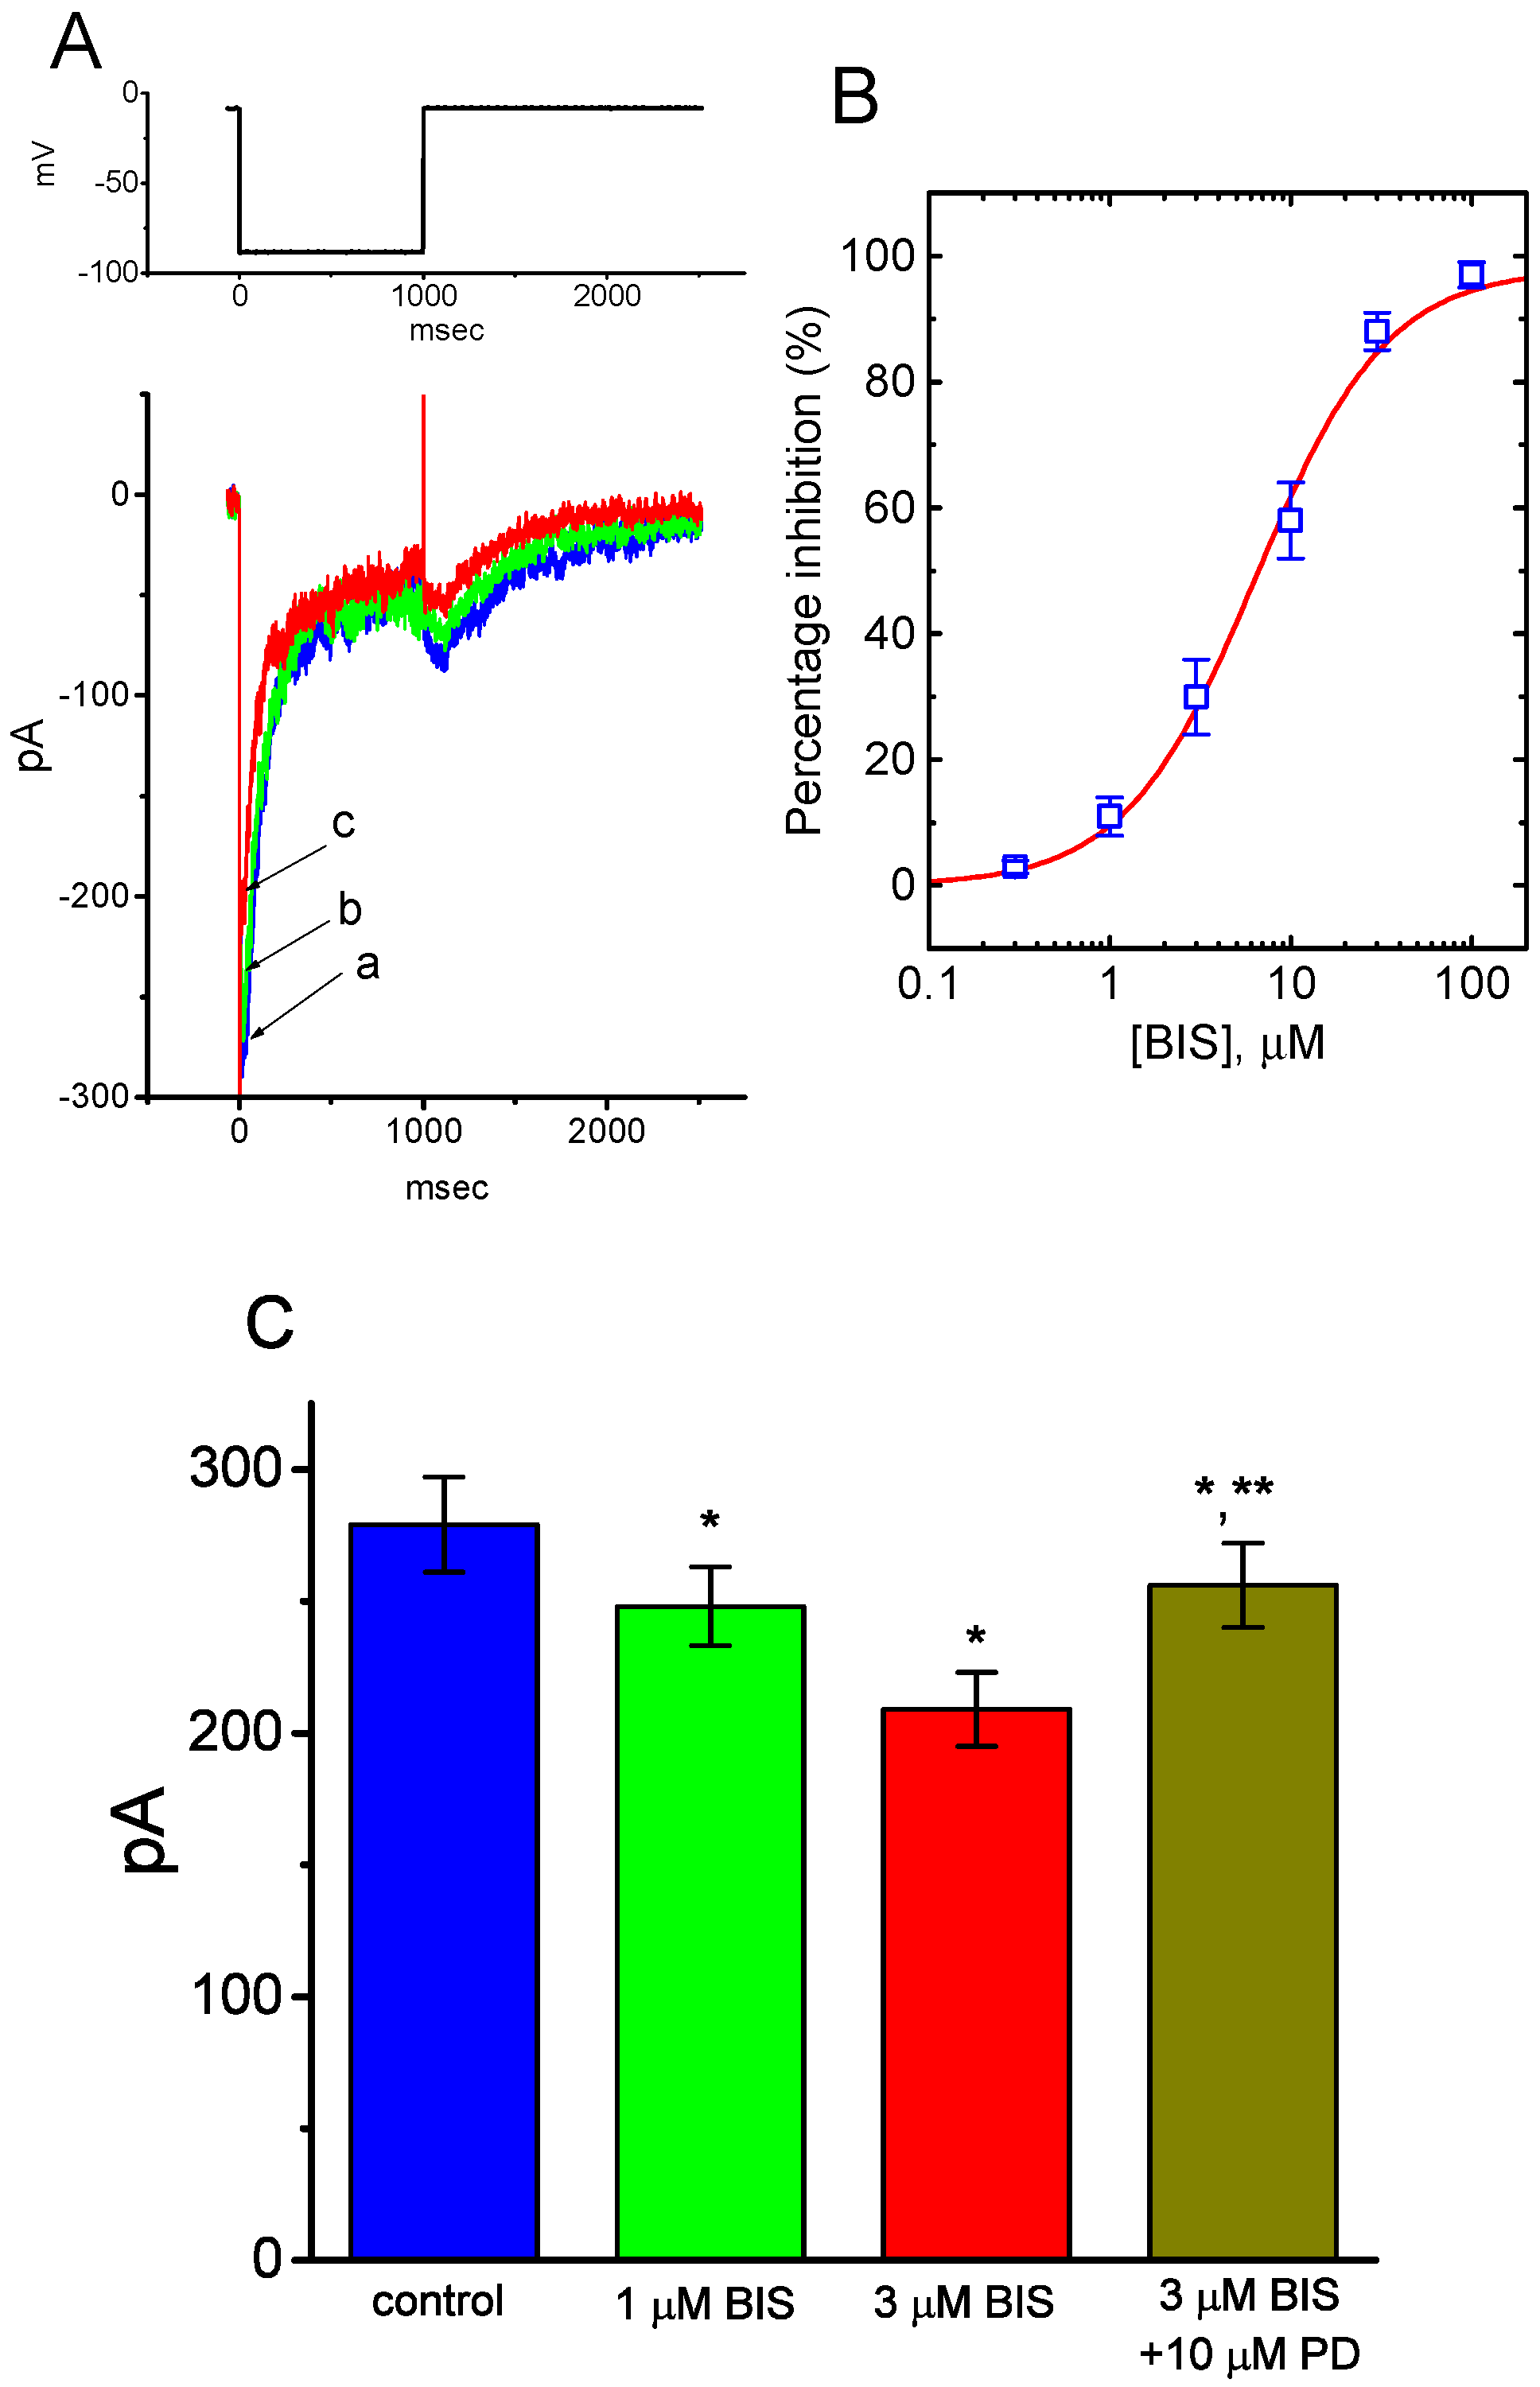
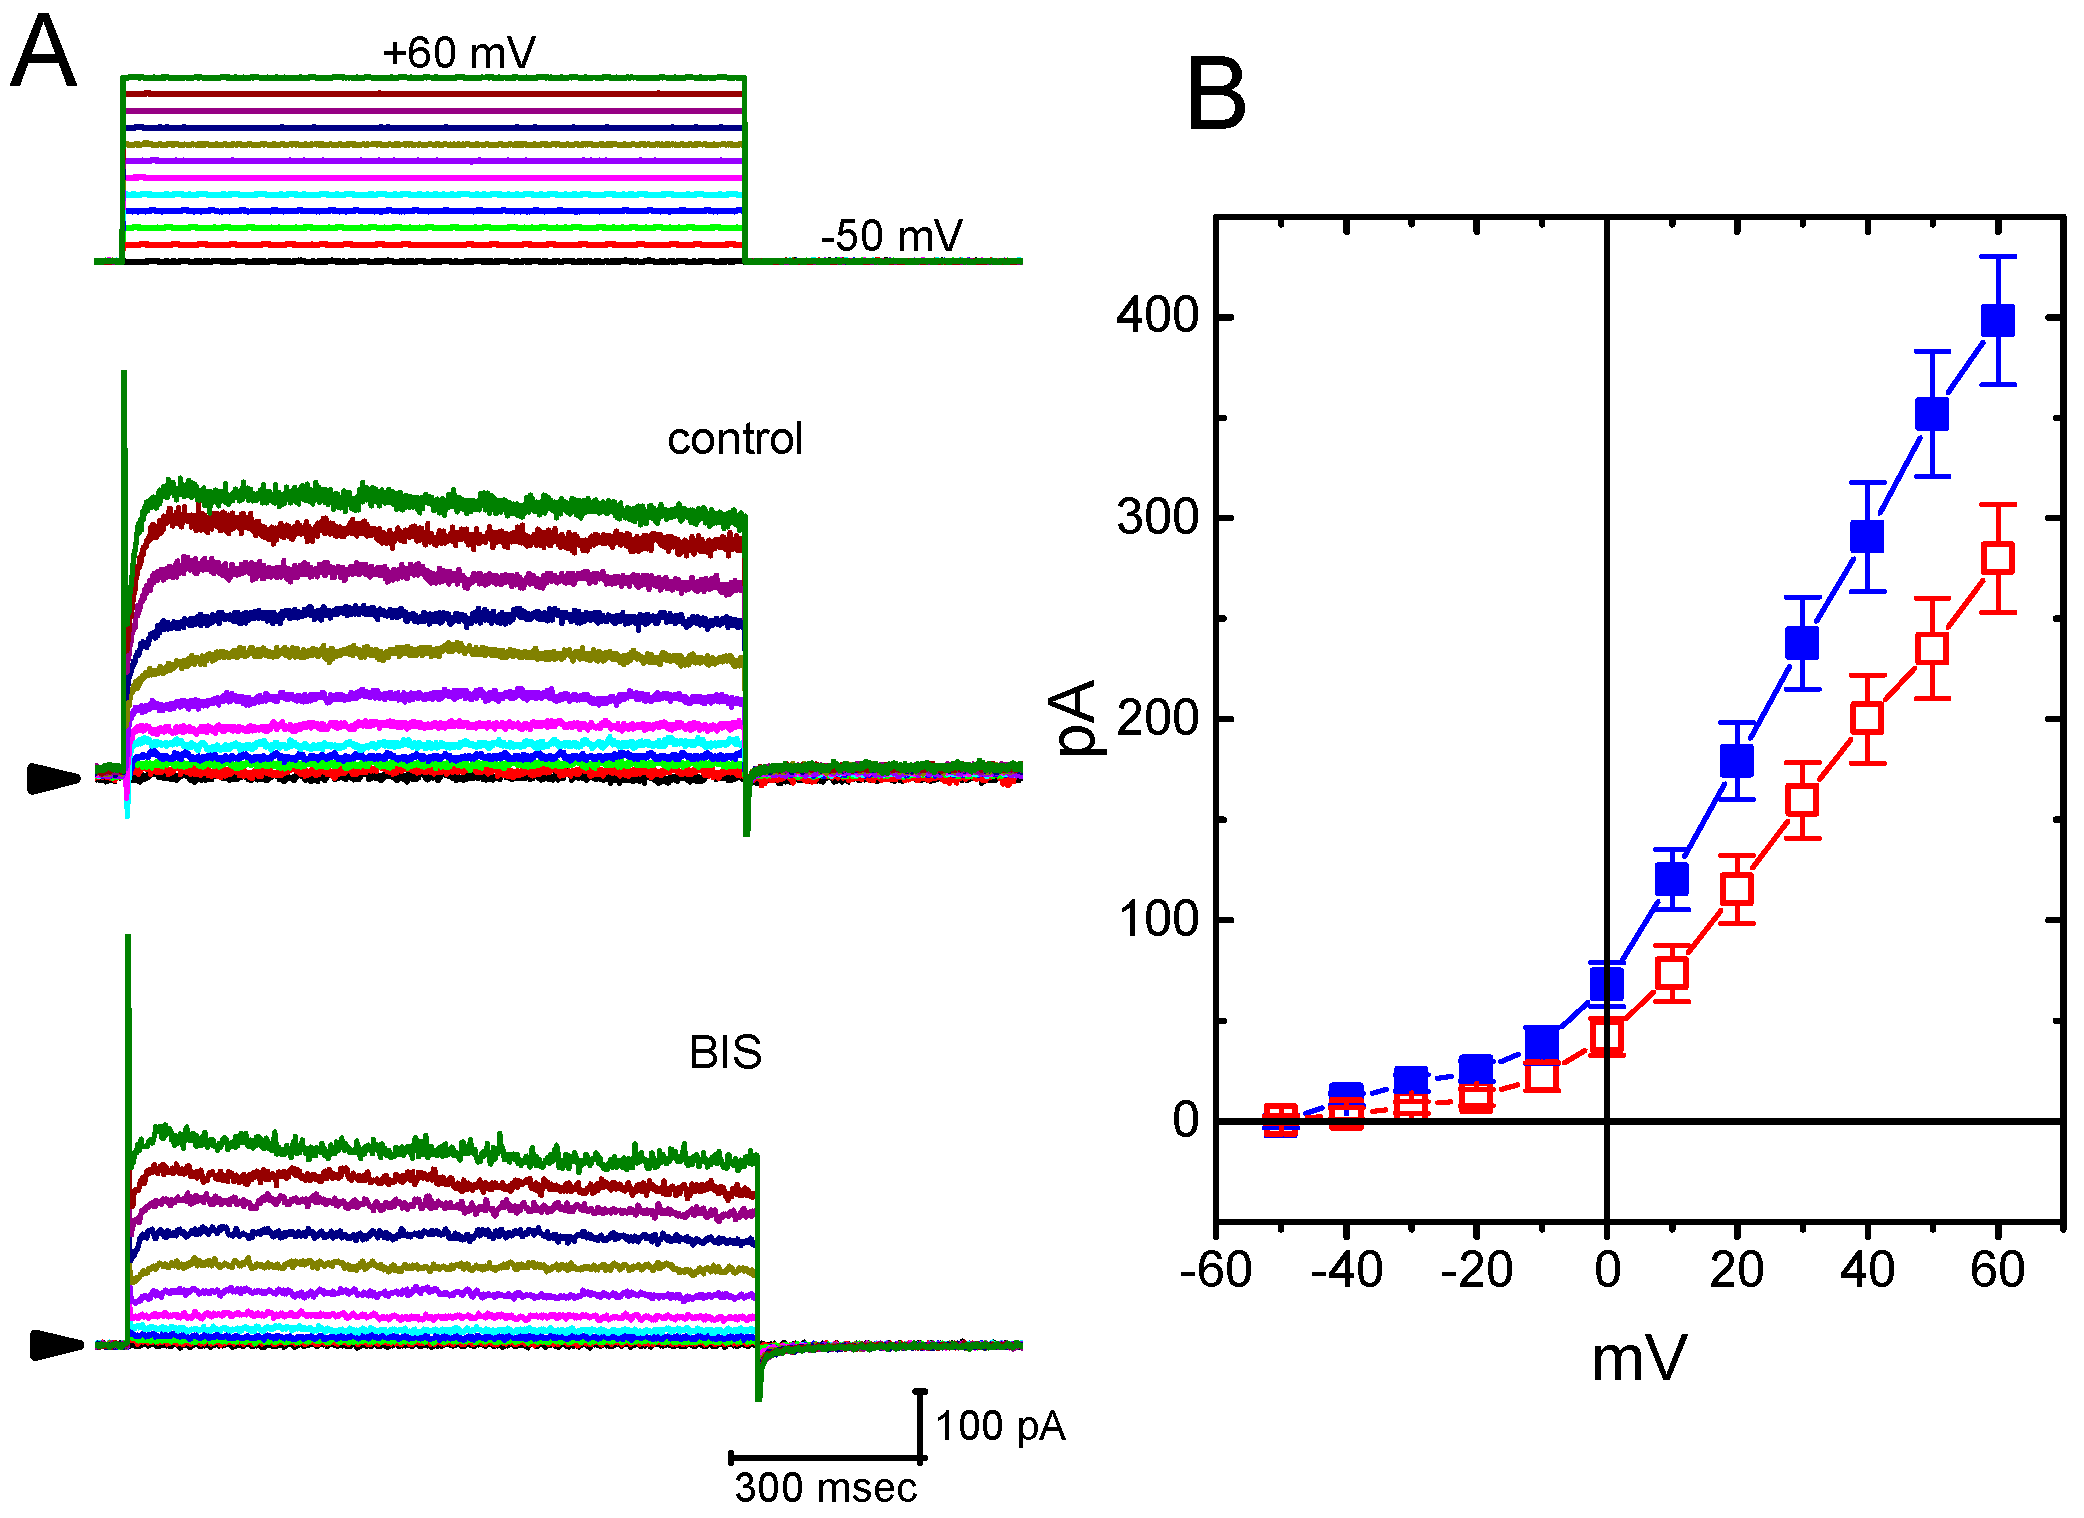
2.2. Effect of Bisoprolol (BIS) on IK(M) in Pituitary GH3 Cells

In the first set of whole-cell current recordings, we bathed the cells in high-K+, Ca2+-free Tyrode’s solution, the composition of which is described above, and the recording pipette was filled with K+-containing solution. Once the whole-cell model was established, the examined cell was maintained at −50 mV and the depolarizing step to −10 mV with a duration of 1 sec was delivered. As shown in Figure 2, upon long-lasting membrane depolarization to −10 mV, K+ inward current was readily evoked, which was responsive to low threshold voltage and displayed both the slowly activating and deactivating properties. This type of K+ currents in response to depolarizing step was sensitive to inhibition by linopirdine (10 μM) or pioglitazone (10 μM), and it was hence identified as an IK(M) [17,18,19,20]. Of particular interest is how as GH3 cells were exposed to BIS, the IK(M) amplitude in response to such depolarizing step was progressively diminished in a concentration-dependent manner (Figure 2A,B). For example, addition of 1-μM BIS significantly decreased current amplitude from 196 ± 14 to 97 ± 11 pA (n = 12, p < 0.05). After washout of the agent, current amplitude returned to 191 ± 14 pA (n = 11, p < 0.05). Concomitant with this, the value of activation time constant (τact) during the exposure to 1-μM BIS was noted to increase significantly from 102 ± 9 to 182 ± 11 msec (n = 12, p < 0.05) and that of deactivating time constant (τdeact) was decreased from 168 ± 11 to 66 ± 8 msec (n = 12, p < 0.05).
The relationship between the BIS concentration (0.01–30 μM) and the IK(M) amplitude was further constructed and is plotted in Figure 2B. Fitting the concentration-response curve with the modified Hill equation as described in Materials and Methods for details yielded a half-maximal concentration (i.e., IC50) of 1.21 μM and a slope coefficient of 1.2. BIS at a concentration of 30 μM nearly abolished current amplitude. Additionally, in the continued presence of 1-μM BIS, further addition of either 10 μM flupirtine or 10 μM ivabradine was noted to attenuate its suppression of IK(M) (Figure 2C). Flupirtine was reported to stimulate IK(M) [30], while ivabradine known to suppress hyperpolarization-activated cation current might increase IK(M) amplitude in these cells. Conversely, subsequent application of neither isoproterenol (1 μM) nor ractopamine (10 μM) had any perturbations on BIS-induced block of IK(M). Isoproterenol or ractopamine (a synthetic phenoethanolamine salt) was previously demonstrated to stimulate β-adrenergic receptors [31,32,33,34,35]. However, addition of neither isoproterenol (1 µM) nor ractopamine (10 µM) alone produced any effects on IK(M). The results led us to suggest that BIS has a significant depressant action on IK(M) functionally expressed in GH3 cells, which appears to be unlinked to binding to β-adrenergic receptors.

2.3. Inhibitory Effect of BIS on IK(M) Elicited by High Frequency Depolarizing Pulse

Some neurons, neuroendocrine cells, or endocrine cells can display firing behavior with high frequency [25,36,37]. For this reason, in another set of experiments, we sought to evaluate whether BIS affects the magnitude of IK(M) elicited by brief repetitive depolarizations. Under control conditions, a single 1-sec depolarizing step to −10 mV from a holding potential of −50 mV evoked IK(M) amplitude of 156 ± 16 pA (n = 13) with the τact value of 53 ± 7 msec (n = 13). However, the IK(M) amplitude for 1-sec repetitive pulses to −10 mV, each of which lasted 6 msec with 4-msec intervals at the level of −50 mV between each abrupt pulse was evidently reduced to 34 ± 5 pA (n = 13), together with a significant prolongation of τact value to 69 ± 8 msec (n = 13). A representative example of IK(M) traces in response to either single pulse or repetitive pulses is illustrated in Figure 3A. As shown in Figure 3B, addition of BIS was able to suppress the IK(M) amplitude elicited by high-frequency depolarizing pulse. For example, as cells were exposed to 3-μM BIS, current amplitude measured at the end of a train of short repetitive stimuli was further reduced by 56 ± 2 % to 19 ± 3 pA (n = 13, p < 0.05). Therefore, IK(M) activation was reduced by repetitive stimuli, and the inhibition by this agent of IK(M) amplitude still remained effective. However, the magnitude of its block appears to become smaller, as compared to those with a single long depolarizing pulse.

2.4. Effect of BIS on Deactivating IK(M) Elicited Upon Return to Membrane Hyperpolarization with Varying Duration

Previous studies have shown that the magnitude of IK(M) might influence the falling phase of bursting firing or spike after-depolarizations [18,38]. Thus, we wanted to determine how BIS exerted any perturbations on deactivating IK(M) in response to the down sloping ramp pulse from −10 to −50 mV with varying durations. As shown in Figure 4A and 4B, upon return to −50 mV, as the slope of ramp pulse was slowed, the peak amplitude of deactivating IK(M) became exponentially decreased with a time constant of 98 ± 8 msec (n = 11). However, as cells were exposed to 3-μM BIS, the peak amplitude of the current was significantly and exponentially decreased, with a time constant of 65 ± 7 msec (n = 11). For example, as the duration of downslope ramp was set at 40 msec (i.e., slope = −1 V/sec), the addition of 3-μM BIS decreased peak amplitude by 59 ± 2 % from 607 ± 50 to 245 ± 36 pA (n = 11, p < 0.05). The results thus indicated that, as the duration of down sloping ramp pulse increased, the amplitude of deactivating IK(M) would be exponentially decreased, and that the presence of BIS decreased current magnitude in a time-dependent fashion.

2.5. Inhibitory Effect of BIS on the Activity of Single M-type K+ (KM) Channels in GH3 Cells

The cell-attached configuration of the patch-clamp technique was used to investigate the effects of BIS on the activity of single KM channels expressed in these cells. In these experiments, we bathed cells in high-K+, Ca2+-free solution and the recording pipette was filled with low-K+ (5.4 mM) solution. As shown in Figure 5A, the activity of KM channels, which occurred in rapid open-closed transitions, was clearly detected, as the membrane was maintained at 0 mV relative to the bath. The addition of 1-μM BIS significantly decreased channel open probability from 0.129 ± 0.006 to 0.056 ± 0.003 (n = 12, p < 0.01). After washout of the drug, channel activity was returned to 0.114 ± 0.004 (n = 10, p < 0.01). Based on an amplitude histogram (Figure 5B), the single-channel amplitude did not differ between the absence and presence of 1-μM BIS. Moreover, in continued presence of 1 µM BIS, further addition of neither diazoxide (10 μM), 9-phenenthrol (10 μM), nor GMQ (10 μM) attenuated its suppression of channel activity. Diazoxide and 9-phenanthrol are the openers of ATP-sensitive K+ and intermediate-conductance Ca2+-activated K+ channels [39], respectively, while GMQ can activate large-conductance Ca2+-activated K+ channels [40]. These results strongly indicate that the channel activity suppressed by the presence of BIS ascribes primarily from KM channels.

2.6. Effect of BIS on Mean Open Time of KM Channels in GH3 Cells

After observing that during the exposure to BIS, the open-time duration of KM channels in GH3 tended to be shortened with no change in single-channel amplitude (Figure 5A), we further examined and analyzed the kinetic properties of KM channels obtained with or without addition of BIS. As depicted in Figure 6, the distribution of open durations was least-squares fitted by a mono-exponential function. During the exposure to 1-μM BIS, the mean open time of these channels was significantly reduced to 1.67 ± 0.05 msec from the control length of 2.32 ± 0.09 msec (n = 12, p < 0.05). Therefore, BIS-induced changes in KM-channel activity may have been a result of the decrease in the duration of the open state, rather than of any modification in single-channel conductance.

2.7. Lack of BIS Effect on Single-Channel Conductance of KM Channels

We next measured the amplitude and open probability of single KM channels at a series of voltages ranging between −40 and +30 mV. Throughout the voltage range examined, averaged I-V relationships of KM channels with or without BIS (1 μM) addition were analyzed and then compared (Figure 7A). In the control, fitting these single-channel amplitudes with a linear regression revealed KM channels of 19.8 ± 0.4 pS (n = 9). The value for these channels did not differ significantly from that (19.7 ± 0.4 pS, n = 9, p > 0.05) during exposure to 1-μM BIS. It is clear from the results that addition of this compound is unable to modify single-channel conductance, although it can significantly exert a depressant on the probability of KM channels that would be open.

2.8. Activation Curve of KM Channels Modified by the Presence of BIS

Figure 7B shows the activation curve of KM channels taken with or without addition of 1-μM BIS. In these experiments, channel open probabilities were measured at different voltages relative to the bath. The plot of channel open probability of KM channels as a function of Δvoltage was derived and then least-squares fitted with the Boltzmann function as described in Materials and Methods for details. In control (i.e., in the absence of BIS), Pmax = 0.99 ± 0.01, V1/2 = −19.2 ± 1.2 mV, q = 2.83 ± 0.05 e (n = 9), whereas in the presence of 1-μM BIS, Pmax = 0.45 ± 0.01, V1/2 = −12.1 ± 0.9 mV, q = 2.85 ± 0.05 e (n = 9). Therefore, it is clear from these results that the presence of BIS not only produced a decrease in the maximal open probability of these channels, but also significantly shifted the activation curve along the voltage axis to depolarized potential by approximately 7 mV. In contrast, minimal change on the gating charge of such activation curve was demonstrated in the presence of BIS. Consequently, as cells were exposed to 1-μM BIS, the difference in free energy (ΔG = -q × F × V1/2, where F = 23,063 cal × V−1 × e−1) required for activation of KM channels was significantly reduced from 1.25 ± 0.04 to 0.79 ± 0.04 Kcal (n = 9, p < 0.05).

2.9. Effect of BIS on Erg-Mediated K+ Current (IK(erg)) in GH3 Cells

Previous studies have reported the importance of IK(erg) functionally expressed in pituitary cells including GH3 cells [41,42]. Some of β-adrenoceptor blockers have been previously demonstrated to suppress HERG K+ or other types of voltage-gated K+ channels [13,14]. As such, we further studied the possible perturbation by BIS on this type of K+ currents (i.e., IK(erg)). Interestingly, as cells were exposed to different concentrations of BIS, the amplitude of IK(erg) elicited by membrane hyperpolarization progressively decreased in a concentration-dependent manner (Figure 8A,B). From nonlinear least-squares fit to the data points, the IC50 value needed to exert its inhibitory effect on the amplitude of deactivating IK(erg) was calculated to be 6.42 μM with a Hill coefficient of 1.2, and the agent at a concentration of 100 μM could nearly abolish current amplitude. Moreover, during continued presence of 3-μM BIS, subsequent addition of 10-μM PD-118057 significantly attenuated the decrease of IK(erg) produced by this agent. PD-118057 was previously reported to activate IK(erg) in heart cells [43]. Therefore, BIS could effectively suppress IK(erg) amplitude, despite its inhibitory effect on IK(erg) to a lesser extent as compared with that on IK(M) described above. Similar to previous observations [14] showing the ability of propranolol and its derivative to block HERG channels, BIS-induced inhibition of IK(erg) tends to be independent of its agonistic effect on β-adrenergic receptors.

2.10. The Inhibition of Delayed-Rectifier K+ Current (IK(DR)) in GH3 cells Caused by the Presence of BIS

An earlier report showed the ability of carvedilol to suppress IK(DR) in NG108-15 neuronal cells [13]. We also explored whether or not the presence of BIS produced any effects on another types of K+ currents (e.g., IK(DR)) in these cells. In these experiments, we bathed cells in Ca2+-free Tyrode’s solution, and, once whole-cell mode was firmly established, the examined cells were maintained at −50 mV and a series of depolarizing voltage steps ranging between −50 and +60 mV was then delivered. BIS at a concentration of 10 μM was not found to have significant effect on IK(DR) elicited throughout the entire voltage-clamp steps applied (Figure 9). However, upon cell exposure to BIS (30 μM), the IK(DR) amplitude was significantly decreased. For example, at the level of +50 mV, current amplitude decreased from 352 ± 31 to 235 ± 25 pA (n = 11, p < 0.05). Therefore, distinct from IK(M) or IK(erg), the IK(DR) is relatively resistant to suppression by BIS.

2.11. Effect of BIS on Spontaneous Action Potentials (APs) in GH3 Cells

In a separate set of experiments, we explored whether the presence of BIS perturbs any changes in membrane potential recorded from these cells. As shown in Figure 10A, as the current-clamp voltage recordings were established, spontaneous APs with a firing frequency of 0.85 ± 0.06 Hz (n = 8) were readily observed. As cells were exposed to BIS, membrane became depolarized and the firing frequency was concomitantly raised, as evidenced by a significant raise in the firing frequency to 1.62 ± 0.06 Hz (n = 8, p < 0.05) during the exposure to 3-μM BIS. In continued presence of 3-μM BIS, subsequent addition of 10 μM flupirtine significantly attenuated BIS-induced increase in the firing of spontaneous APs to 1.16 ± 0.06 Hz (n = 8, p < 0.05); however, that of 10 μM ractopamine did not have any effects on it (Figure 10B). It is therefore conceivable that the observed effect of BIS on the firing patterns of GH3 cells appears to be independent of binding to β-adrenergic receptors and could be partly explained by its suppression of IK(M).

2.12. Suppressive Effect of BIS on IK(M) in Pituitary R1220 Cells

We next wanted to test if IK(M) in another type of pituitary cells (e.g., pituitary R1220 cells) can be influenced by BIS. This type of rat pituitary cells, originally derived from ScienCell (Carlsbad, CA, USA), was previously reported to express β1-adrenergic receptors [8]. As depicted in Figure 11, as cells were exposed to different BIS concentrations, the amplitude of IK(M) in response to depolarizing step was progressively decreased, in combination with a slowing in activation time course of IK(M). Moreover, with the presence of 1-μM BIS, further addition of ML-213 (10 μM), an activator of IK(M) [44], was able to attenuate BIS-induced inhibition of IK(M), despite inability of further isoproterenol addition to exert any effect on such block. These results thus appear to be indistinguishable from those described above in GH3 cells.

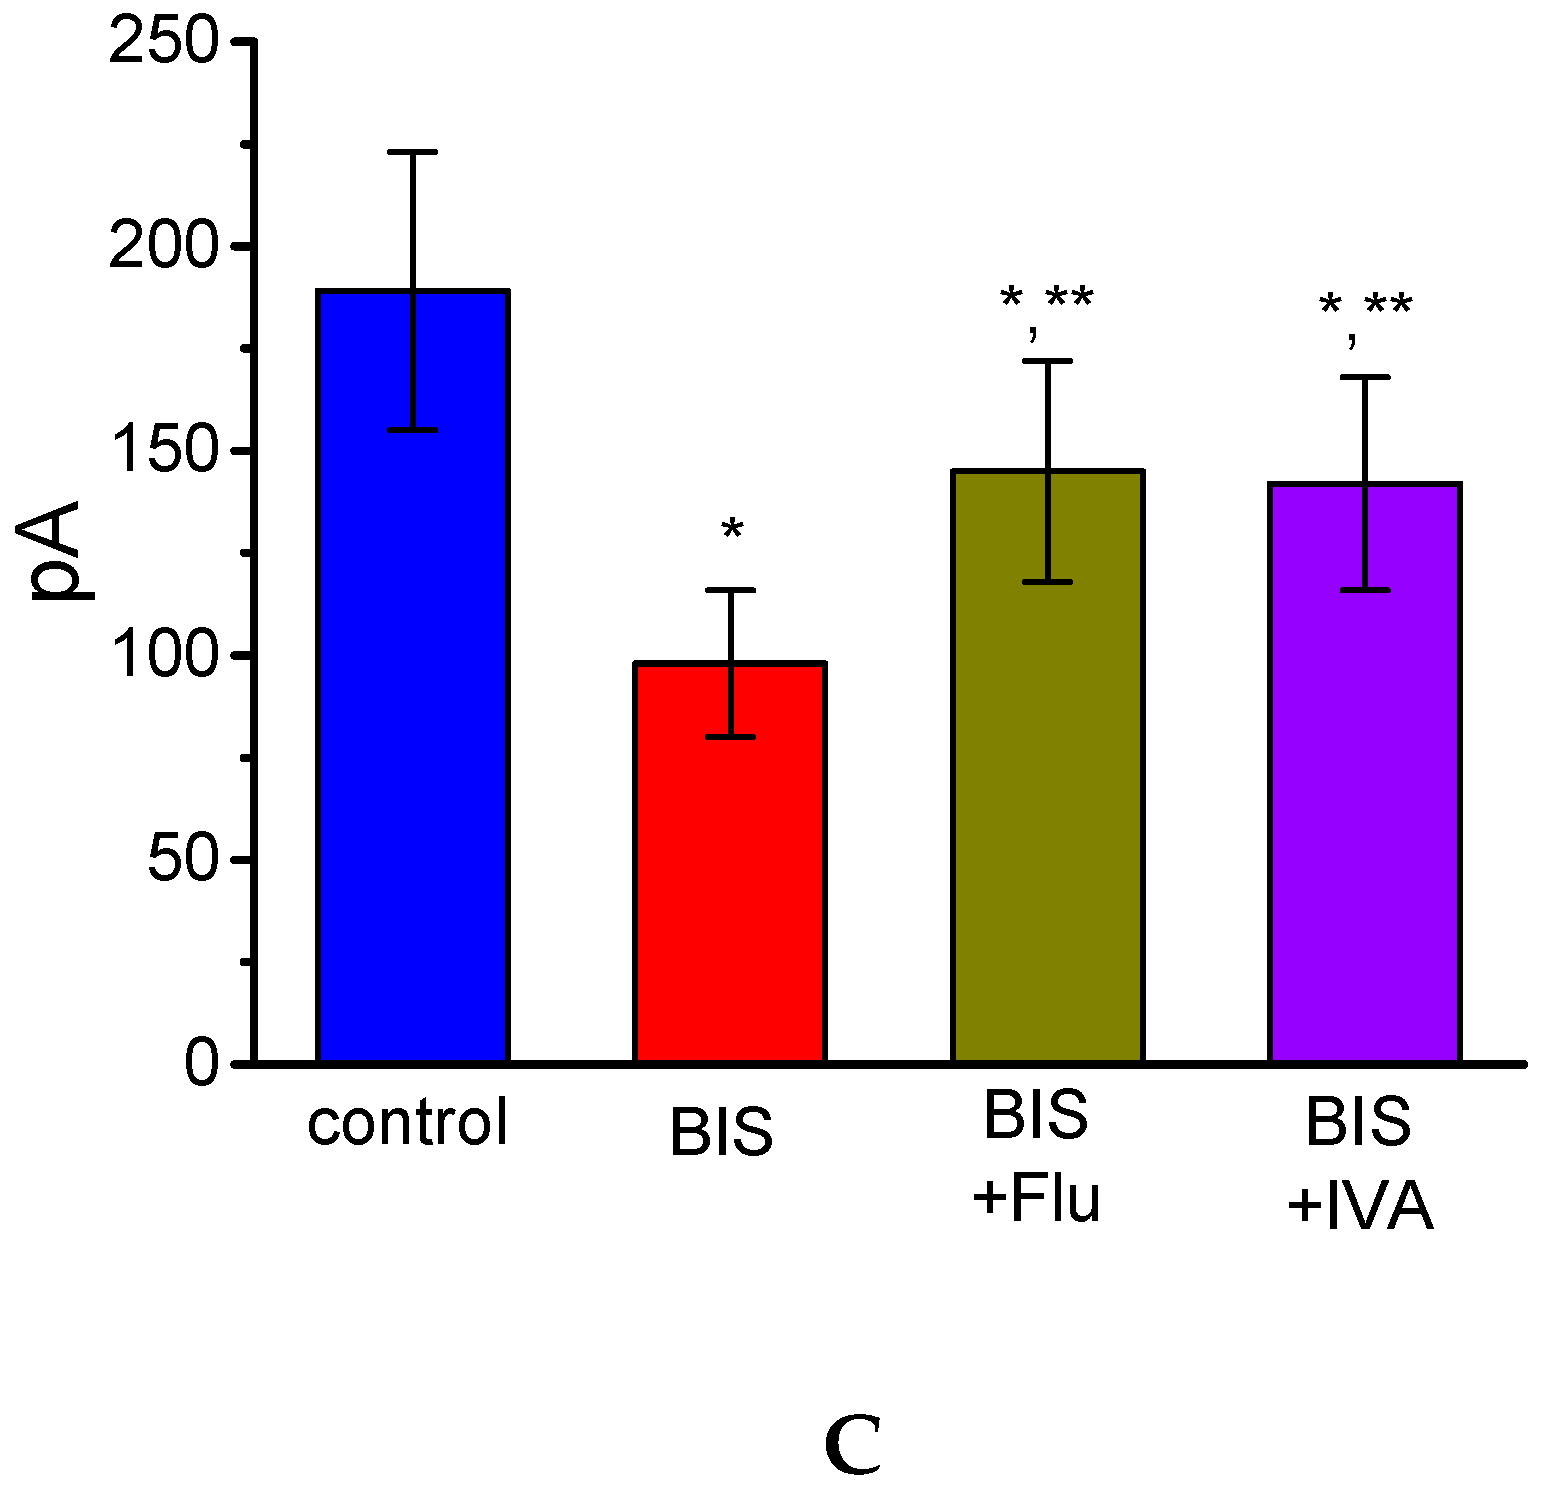
2.13. Effect of BIS on IK(M) Recorded from Hippocampal mHippoE-14 Cells

In a final set of experiments, we wanted to determine whether or not IK(M) inherently in central neurons (e.g., hippocampal mHippoE-14 cells) [21] is subject to suppression by this compound. The experimental profiles used were similar to those for pituitary cells. As depicted in Figure 12A,B, the IK(M) elicited by different depolarizing steps was suppressed by the presence of BIS. For example, at the level of −10 mV, the exposure to 3-μM BIS caused a significant reduction of IK(M) amplitude from 109 ± 9 pA to 27 ± 6 pA (n = 9, p < 0.05). After washout of BIS, current amplitude returned to 98 ± 9 pA (n = 9, p < 0.05). The averaged I-V relationships of IK(M) obtained with or without BIS addition are illustrated in Figure 12B. However, isoproterenol (1 µM) had little or no effects on IK(M) amplitude (108 ± 9 pA [control] versus 107 ± 10 pA [in the presence of 1 µM isoproterenol], n = 9, p > 0.05). Therefore, the magnitude of BIS-induced block of IK(M) taken from mHippoE-14 cells is indistinguishable from those described above in pituitary cells.

3. Discussion

BIS-induced suppression of IK(M) presented herein was found to be attenuated by a further application of flupirtine, but not by isoproterenol or ractopamine, the agonist of β-adrenergic receptor. The present results are of particular importance, as they suggest that the inhibition of both IK(M) and IK(erg) caused by BIS is direct and appears to be unnecessarily linked to its binding to β-adrenergic receptor, although binding to β1-adrenergic receptor was previously reported to influence pituitary function [7,8,11,12,45]. However, distinguishable from the inhibitory effect of carvedilol, a non-selective blocker of β-adrenergic receptors, on the amplitude and inactivation kinetics IK(DR) [13], BIS at a concentration greater than 10 µM slightly suppressed IK(DR) amplitude with no discernible change in the inactivation time course of the current.
A previous report has demonstrated the ability of BIS to reverse the down-regulation in mRNA expression of small-conductance Ca2+-activated K+ channels [15]. In our study, neither continued presence of BIS, further addition of neither diazoxide, GMQ, nor 9-phenanthrol produced attenuating effects on its suppression of IK(M). Diazoxide and 9-phenanthrol are known to stimulate ATP-sensitive and intermediate-conductance Ca2+-activated K+ channels, respectively, while 2-guanidine-4-methylquinazoline (GMQ) was reported to enhance the activity of large-conductance Ca2+-activated K+ channels [39,40]. In this scenario, the observed effect of BIS on whole-cell IK(M) inherently in pituitary GH3 cells virtually is not involved in the suppression of either ATP-sensitive or Ca2+-activated K+ channels. The inhibitory effect on IK(M) by BIS could be predominantly responsible for its decrease of macroscopic IK(M) amplitude carried through KM channels.
Block of IK(M) caused by BIS is not instantaneous, but develops with time after the channels are opened upon rapid membrane depolarization, producing an apparent slowing in current activation. Deactivating current of IK(M) in the presence of BIS showed a blunted peak and an increased decay that is consistent with the possibility that the closing (i.e., deactivating process) of channels was raised by unbinding of the BIS molecule. Moreover, as the falling phase upon return to hyperpolarizing potential (i.e., the down sloping ramp) was prolonged, the IK(M) amplitudes were decreased exponentially. The magnitude of BIS-induced block on such deactivating currents was notably increased. The blocking site of this agent thus appears to be located within the channel pore only when the channel is open. KCNQ2/3 mRNA expression was detected in GH3 and mHippoE-14 cells; however, the present finding showed a lack of effect of BIS on single-channel conductance of KM channels in GH3 cells, suggesting that the interaction of the channel with it seems to be secondary to alterations that are remote from the pore region of the channel.
Clinically relevant serum concentration of BIS was recently reported to range between 3.8 and 71.1 ng/mL (or 0.011 and 0.22 µM) [46]. These values are similar to the IC50 required for its suppression of IK(M) presented herein. In this study, the IC50 value required for BIS-induced block of IK(M) or IK(erg) inherently in GH3 cells was 1.21 and 6.42 µM, respectively. This agent tends to be selective for IK(M) over IK(erg) or IK(DR). There was also a depolarizing shift in the activation curve of KM channels during exposure to BIS, strongly suggesting that this compound could alter the voltage dependence of channel activation accompanied by a decrease of free energy for KM-channel activation. During high frequency firing, the amplitude of IK(M) was reduced and the sensitivity to BIS was attenuated. As the duration of the falling phase upon return from membrane potential of −10 to −50 mV increased, the magnitude of BIS-induced block of IK(M) became raised. Taken together, the sensitivity of neurons or pituitary cells to BIS could depend not only on the BIS concentration achieved, but also on the pre-existing level of the resting potential, the discharge pattern or frequency, or their combinations.
Our study showed that in pituitary cells, the presence of BIS does not appear to bind to β-adrenergic receptors exclusively, although the activity of these receptors might be constitutively active [47]. This compound was capable of suppressing IK(M) and IK(erg) directly and effectively. Under current-clamp recordings, BIS was effective at depolarizing the cell and raising the firing rate of spontaneous APs in GH3 cells. Subsequent addition of flupirtine, yet not ractopamine, could attenuate BIS-enhanced firing. Therefore, apart from its antagonistic effect on β-adrenergic receptors, the inhibition by BIS of these K+ currents may also conceivably contribute to its effect on the cellular function (e.g., stimulus-secretion coupling) in these cells. However, it also needs to be noted that the results presented here were derived from cell lines. Whether similar findings occurring in native cells still remains to be clarified.
Neither eugenolol nor eugenodilol was found to suppress IK(M) in GH3 cells, although these newly designed compounds possess blocking actions on β-adrenergic receptors [48,49]. BIS or its structurally similar compounds may thus be a valuable tool for probing the structure and function of KM or Kerg channels, because the pore region of the channel protein to which they bind is of particular relevance for an open-channel blockade. In addition to its antagonistic effect on β1-adrenergic receptors, the blockade of KM and Kerg channels by BIS, together with an increase in the firing of spontaneous APs, may be responsible for its effects on pituitary or neuronal excitability. To what extent BIS-induced suppression of these K+ currents is responsible for its additional effectiveness with favorable metabolic profiles [2,50] has yet to be further delineated. Caution needs to be made in attributing its use to the selective blocking of β1-adrenergic receptors.

4. Materials and Methods

4.1. Chemicals and Solutions

(±)-Bisoprolol hemifumarate (BIS, zebeta®, (E)-but-2-enedioic acid;1-(propan-2-ylamino)-3-[4-(2-propan-2-yloxyethoxymethyl)phenoxy]propan-2-ol, C13H31NO4·½C4H4O4), 2-guanidine-4-methylquinazoline (GMQ), ML-213, PD-118057, and 9-phenanthrol were obtained from Tocris (Bristol, UK), while carvedilol, diazoxide, ethidium bromide, flupirtine, isoproterenol, ivabradine, linopirdine, ractopamine and tolbutamide were from Sigma-Aldrich (St. Louis, MO, USA). Pioglitazone was obtained from Takeda Pharmaceutical (Osaka, Japan), and parecoxib was from Pfizer Inc. (New York, NY, USA). Eugenolol and eugenodilol were gifts from Dr. Jwu-Lai Yeh, Department of Pharmacology, Kaohsiung Medical University, Kaohsiung City, Taiwan. Unless stated otherwise, the cell culture media, L-glutamine, horse serum and fetal calf serum were obtained from Invitrogen (Carlsbad, CA, USA). All other chemicals were commercially available and of analytical reagent grade.
The composition of HEPES-buffered normal Tyrode’s solution was as follows (in mM): NaCl 136.5, KCl 5.4, CaCl2 1.8, MgCl2 0.53, glucose 5.5, and HEPES-NaOH buffer 5.5 (pH 7.4). To record membrane potential or IK(M), the recording pipettes were filled with the solution (in mM); K-aspartate 130, KCl 20, KH2PO4 1, MgCl2 1, EGTA 0.1, Na2ATP 3, Na2GTP 0.1, and HEPES-KOH buffer 5 (pH 7.2). To record whole-cell IK(M), high K+-bathing solution was composed of the following (in mM): KCl 145, MgCl2 0.53, and HEPES-KOH 5 (pH 7.4). To measure the activity of single KM channels, the pipette solution was composed of the following (in mM): NaCl 136.5, KCl 5.4, MgCl2 0.53, and HEPES-NaOH buffer 5 (pH 7.4). All solutions were prepared using deionized water from a Milli-Q water purification system (APS Water Services, Inc., Van Nuys, CA, USA). The pipette solution and culture medium were commonly filtered on the day of use with Acrodisc® syringe filter with 0.2 µm of Supor® membrane (Pall Corp., Port Washington, NY, USA).

4.2. Cell Preparations

GH3 pituitary tumor cells, obtained from the Bioresources Collection and Research Center ([BCRC-60015]; Hsinchu, Taiwan; originally derived from ATCC [CCL-82.1TM], were maintained in Ham’s F-12 medium supplemented with 15% horse serum (v/v), 2.5% fetal calf serum (v/v), and 2 mM L-glutamine in a humidified environment of 5% CO2/95% air. Rat pituitary cells (#R1220) were purchased from ScienCell Research Laboratories, Inc. (Carlsbad, CA, USA). These cells reported to express the receptors of gonadotropin releasing hormone (GnRH) were isolated from neonate day-8 CD® rats and cryopreserved in primary cultures with further purification and expansion (https://www.sciencellonline.com/products-services/primary-cells/animal/cell-types/pituitary cells/rat-pituitary-cells.html) [51,52]. Cells were routinely grown in Epithelial Cell Medium (Cat #4101; ScienCell).
Embryonic mouse hippocampal cell line (mHippoE-14, CLU198) was obtained from Cedarlane CELLutions Biosystems, Inc. (Burlington, ON, Canada) [39,53,54]. Cells were maintained in Dulbecco’s modified Eagle’s medium supplemented with 10% fetal bovine serum (v/v) and 2 mM L-glutamine. The culture medium was changed every two to three days, and cells underwent passaged when they reached confluence. The experiments were commonly performed 5 or 6 days after cells had been cultured (60–80% confluence).

4.3. RNA Isolation and Reverse Transcriptase-Polymerase Chain Reaction (RT-PCR)

To detect the expression of rat KCNQ2 and KCNQ3 mRNAs in different types of cells including GH3, R1220 cells, a semiquantitative RT-PCR assay was performed. Total RNA samples were extracted from mHippoE-14 cells with TRIzol reagent (Invitrogen) and reverse-transcribed into complementary DNA using Superscript II reverse-transcriptase (Invitrogen). The sequences of forward and reverse oligonucleotide primers used for KCNQ2 were 5′-CCCTGAAAGTCCAAGAGCAG-3′ and 5′-AGGCCCCATAGGTTTGAGTT-3′, respectively, while those for KCNQ3 were 5′-GTGGCTTCAGCATCTCACAA-3′ and 5′-CTTGTTGGAAGGGGTCCATA-3′, respectively. Amplication of KCNQ2 or KCNQ3 was made using PCR SuperMix from Invitrogen under the following conditions: 35 cycles composed of 30 sec denaturation at 95 °C. 30 sec primer annealing at 62 °C, 1 min extension at 72 °C, and followed by 72 °C for the final extension for 2 min. PCR products were analyzed on 1.5% (v/v) agarose gel containing ethidium bromide and then visualized under ultraviolet light. Optical densities of DNA bands were scanned and quantified by AlphaImager 2200 (ProteinSimple; Santa Clara, CA, USA).

4.4. Electrophysiological Measurements

Immediately prior to the experiment, cells were dissociated and an aliquot of cell suspension was transferred to a custom-made recording chamber mounted on the stage of a DM-IL inverted microscope (Leica, Wetzlar, Germany). There were immersed at room temperature (20–25 °C) in HEPES-buffered normal Tyrode’s solution, the composition of which is described above. The patch electrodes were fabricated from borosilicate glass capillaries (No. 34500; Kimble Products, Vineland, NJ, USA) on a Narishige PP-83 puller (Narishige, Tokyo, Japan) or a P-97 Flaming/Brown puller (Sutter, Novato, CA, USA), and electrode tips were fire-polished with MF-83 microforge (Narishige). Their resistances in standard pipette and bathing solutions ranged from 3 to 5 MΩ. Recordings of membrane potential or ion currents were measured in the whole-cell or cell-attached mode of the patch-clamp technique with an RK-400 patch-clamp amplifier (Bio-Logic, Claix, France) [42]. The liquid junction potentials were corrected shortly before seal formation was established.

4.5. Data Recordings

The data comprising both potential and current traces were stored online in an Acer SPIN−5 touchscreen laptop computer (SP513-52N-55WE; Taipei, Taiwan) at 10 kHz equipped with Digidata 1440A interface (Molecular Devices, Inc., Sunnyvale, CA, USA), which was used for the analog-to-digital/digital-to-analog conversion. During the recordings, the latter device was controlled by pCLAMP 10.7 software (Molecular Devices) run under Windows 10 (Redmond, WA, USA), and the signals were simultaneously monitored on LCD monitor through a USB type-C connection. Current signals were low-pass filtered at 2 kHz with a FL-4 four-pole Bessel filter (Dagan, Minneapolis, MN, USA) to minimize background noise. Through digital-to-analog conversion, various pCLAMP-generated voltage-clamp profiles with either rectangular or ramp waveforms were applied to determine the current-voltage (I-V) relationship of IK(M), IK(erg) or IK(DR). As high-frequency stimuli were necessarily applied to the cell, an Astro-med Grass S88X dual output pulse stimulator (Grass Technologies, West Warwick, RI, USA) was used. After the data were digitally collected, we later analyzed them using different analytical tools that include LabChart 7.0 program (AD Instruments; Gerin, Tainan, Taiwan), OriginPro 2016 (Microcal, Northampton, MA, USA), or custom-made macros built under Microsoft Excel® 2013 (Redmond).

4.6. Data Analyses

To determine percentage inhibition of BIS on IK(M) or IK(erg), we compared the current amplitudes during cell exposure to different BIS concentrations. To record IK(M), we bathed the cells in high-K+, Ca2+-free solution, and depolarizing step from −50 to −10 mV was applied, while, to measure IK(erg), the examined cell was hyperpolarized from −10 to −100 mV. The concentration-response data for inhibition of IK(M) or IK(erg) were least-squares fitted by a modified Hill function. That is,
Percentage   inhibiton   =   E m a x × [ B I S ] n H I C 50 n H + [ B I S ] n H ,
where [BIS] represents the BIS concentration; IC50 and nH are the concentration required for 50% inhibition and the Hill coefficient, respectively; and Emax is the maximal inhibition of IK(M) or IK(erg) induced by this drug.

4.7. Analyses of Single M-Type K+ (KM) Channels

Single KM-channel currents recorded from GH3 cells or mHippoE-14 neurons were analyzed using pCLAMP 10.7. We determined single-channel amplitudes taken with or without the BIS addition by fitting Gaussian distributions to the amplitude histograms of the closed and open states. The probabilities of KM channel that would be open were defined as N·PO, which is estimated using the following expression:
N · P O   =   A 1 + 2 A 2 + 3 A 3 + + n A n A 0 + A 1 + A 2 + + A n
where N is the number of active channels in the patch, A0 the area under the curve of an all points histogram corresponding to the closed state, and A1…An the histogram area that indicate the level of the distinct open state for 1 to n channels in the patch examined. The single-channel conductance of KM channels was calculated using a linear regression with averaged values of single-channel amplitudes measured at different levels of membrane potentials relative to the bath. Open lifetime distributions of KM channels taken with or without BIS addition were least-squares fitted with logarithmically scaled bin width.
To determine voltage-dependence of the inhibitory effect of BIS on the activity of KM channels, the patch with or without BIS addition was held at different membrane potentials. The activation curve of KM-channel openings taken with or without addition of BIS (3 μM) was fitted by the Boltzmann equation:
Relative   open   probability   =   P m a x 1 + e [ ( V V 1 / 2 ) qF RT ]   ,
where Pmax is the maximal probability of KM-channel openings in the control (i.e., in the absence of BIS) maintained at +30 mV relative to the bath, V1/2 the voltage at which half-maximal activation of KM channels occurs, q the apparent gating charge, F Faraday’s constant, R the universal gas constant, T absolution temperature, and F/RT = 0.04 mV−1.

4.8. Statistical Analyses

The linear or nonlinear (e.g., sigmoidal or exponential curves) least-squares fitting routines were appropriately estimated using either the Solver add-in bundled with Microsoft ExcelTM 2013 (Redmond) or OriginPro 2016 (OriginLab, Northampton, MA, USA). The values appearing in this study are provided as the mean values ± standard error of mean (SEM) with sample sizes (n) indicating the number of cells from which the experimental data were taken, and error bars are plotted as SEM. In this study, we intended to make assertions about the variability of means that could be collected from a random cohort derived from the population concerned. For this reason, the standard error could be more appropriate than the standard deviation. The paired or unpaired Student’s t-test, or one-way analysis of variance followed by post-hoc Fisher’s least-significance difference test for multiple-group comparisons, were implemented for the statistical evaluation of differences among means. We used non-parametric Kruskal-Wallis test, as the assumption of normality underlying ANOVA was violated. Statistical analyses were performed using IBM SPSS® version 20.0 (IBM Corp., Armonk, NY, USA). A difference with a p value < 0.05 was considered statistically significant, unless otherwise stated.

Author Contributions

Conceptualization, E.C.S. and S.-N.W.; validation, E.C.S., N.-P.F.; formal analysis, S.-N.W.; investigation, S.-N.W.; resources, S.Y.K.; data curation, N.-P.F.; writing—original draft preparation, E.C.S.; writing—review and editing, N.-P.F.; visualization, E.C.S.; supervision, S.-N.W.; project administration, S.Y.K.; funding acquisition, S.-N.W.

Funding

This study was supported in part by National Cheng Kung University (D106-35A13, D107-F2519 and NCKUH-10709001 to S.N. Wu), Tainan City, Taiwan, as well as in part by An Nan Hospital, China Medical University. (ANHRF107-13 to E.C.S.).

Acknowledgments

The authors would like to express our appreciation to Kaissen Lee for helpful assistance in this work, and Kenny So for helping with the English language editing. S.N.W. received a Talent Award for the Outstanding Researchers from Ministry of Education, Taiwan.

Conflicts of Interest

The authors declare no conflict of interest.

Abbreviations

APaction potential
BISbisoprolol
ergether-à-go-go-related gene
GMQ2-guanidine-4-methylquinazoline
I-Vcurrent versus voltage
IC50the concentration required for 50% inhibition
IK(DR)delayed-rectifier K+ current
IK(erg)erg-mediated K+ current
IK(M)M-type K+ current
Kergerg-mediated K+ channel
KM channelM-type K+ channel
SEMstandard error of mean
τactactivation time constant
τdeactdeactivation time constant.

References

  1. Vasomotor dysfunction in POTS patients. Rev. Port. Cardiol. 2000, 19, 1163–1170.
  2. Agabiti Rosei, E.; Rizzoni, D. Metabolic profile of nebivolol, a β-adrenoceptor antagonist with unique characteristics. Drugs 2007, 67, 1097–1107. [Google Scholar] [CrossRef] [PubMed]
  3. Nakamura, K.; Murakami, M.; Miura, D.; Yunoki, K.; Enko, K.; Tanaka, M.; Saito, Y.; Nishii, N.; Miyoshi, T.; Yoshida, M.; et al. Beta-Blockers and Oxidative Stress in Patients with Heart Failure. Pharmaceuticals 2011, 4, 1088–1100. [Google Scholar] [CrossRef] [PubMed]
  4. Zhang, C.; He, S.; Li, Y.; Li, F.; Liu, Z.; Liu, J.; Gong, J. Bisoprolol protects myocardium cells against ischemia/reperfusion injury by attenuating unfolded protein response in rats. Sci. Rep. 2017, 7, 11859. [Google Scholar] [CrossRef] [PubMed] [Green Version]
  5. Bulpitt, C.J.; Connor, M.; Schulte, M.; Fletcher, A.E. Bisoprolol and nifedipine retard in elderly hypertensive patients: Effect on quality of life. J. Hum. Hypertens. 2000, 14, 205–212. [Google Scholar] [CrossRef] [PubMed]
  6. Sigaroudi, A.; Kinzig, M.; Wahl, O.; Stelzer, C.; Schroeter, M.; Fuhr, U.; Holzgrabe, U.; Sorgel, F. Quantification of bisoprolol and metoprolol in simultaneous human serum and cerebrospinal fluid samples. Pharmacology 2018, 101, 29–34. [Google Scholar] [CrossRef] [PubMed]
  7. Soloviev, D.V.; Matarrese, M.; Moresco, R.M.; Todde, S.; Bonasera, T.A.; Sudati, F.; Simonelli, P.; Magni, F.; Colombo, D.; Carpinelli, A.; et al. Asymmetric synthesis and preliminary evaluation of (R)- and (S)-[11C]bisoprolol, a putative β1-selective adrenoceptor radioligand. Neurochem. Int. 2001, 38, 169–180. [Google Scholar] [CrossRef]
  8. Janssens, K.; Krylyshkina, O.; Hersmus, N.; Vankelecom, H.; Denef, C. β1-Adrenoceptor expression in rat anterior pituitary gonadotrophs and in mouse αT3-1 and LβT2 gonadotrophic cell lines. Endocrinology 2008, 149, 2313–2324. [Google Scholar] [CrossRef]
  9. Ul Haq, R.; Liotta, A.; Kovacs, R.; Rosler, A.; Jarosch, M.J.; Heinemann, U.; Behrens, C.J. Adrenergic modulation of sharp wave-ripple activity in rat hippocampal slices. Hippocampus 2012, 22, 516–533. [Google Scholar] [CrossRef]
  10. Ronzoni, G.; Del Arco, A.; Mora, F.; Segovia, G. Enhanced noradrenergic activity in the amygdala contributes to hyperarousal in an animal model of PTSD. Psychoneuroendocrinology 2016, 70, 1–9. [Google Scholar] [CrossRef] [Green Version]
  11. Sun, L.; Wang, S.; Lin, X.; Tan, H.; Fu, Z. Early Life Exposure to Ractopamine Causes Endocrine-Disrupting Effects in Japanese Medaka (Oryzias latipes). Bull. Environ. Contam. Toxicol. 2016, 96, 150–155. [Google Scholar] [CrossRef] [PubMed]
  12. Nurmamedova, G.S.; Gumbatov, N.B.; Mustafaev, I.I. Level of hormones of pituitary-gonadal axis, penile blood flow and sexual function in men with arterial hypertension during monotherapy with bisoprolol and nebivolol. Kardiologiia 2007, 47, 50–53. [Google Scholar] [PubMed]
  13. Liu, C.P.; Chiang, H.T.; Jan, C.R.; Wu, S.N. Mechanism of carvedilol-induced block of delayed rectifier K+ current in the NG108-15 neuronal cell line. Drug Dev. Res. 2003, 58, 196–208. [Google Scholar] [CrossRef]
  14. Dupuis, D.S.; Klaerke, D.A.; Olesen, S.P. Effect of β-adrenoceptor blockers on human ether-a-go-go-related gene (HERG) potassium channels. Basic Clin. Pharmacol. Toxicol. 2005, 96, 123–130. [Google Scholar] [CrossRef] [PubMed]
  15. Ni, Y.; Wang, T.; Zhuo, X.; Song, B.; Zhang, J.; Wei, F.; Bai, H.; Wang, X.; Yang, D.; Gao, L.; et al. Bisoprolol reversed small conductance calcium-activated potassium channel (SK) remodeling in a volume-overload rat model. Mol. Cell. Biochem. 2013, 384, 95–103. [Google Scholar] [CrossRef] [PubMed]
  16. Du, Y.; Zhang, J.; Xi, Y.; Wu, G.; Han, K.; Huang, X.; Ma, A.; Wang, T. β1-Adrenergic blocker bisoprolol reverses down-regulated ion channels in sinoatrial node of heart failure rats. J. Physiol. Biochem. 2016, 72, 293–302. [Google Scholar] [CrossRef] [PubMed]
  17. Selyanko, A.A.; Hadley, J.K.; Wood, I.C.; Abogadie, F.C.; Delmas, P.; Buckley, N.J.; London, B.; Brown, D.A. Two types of K+ channel subunit, Erg1 and KCNQ2/3, contribute to the M-like current in a mammalian neuronal cell. J. Neurosci. 1999, 19, 7742–7756. [Google Scholar] [CrossRef]
  18. Hsu, H.T.; Tseng, Y.T.; Lo, Y.C.; Wu, S.N. Ability of naringenin, a bioflavonoid, to activate M-type potassium current in motor neuron-like cells and to increase BKCa-channel activity in HEK293T cells transfected with alpha-hSlo subunit. BMC Neurosci. 2014, 15, 135. [Google Scholar] [CrossRef]
  19. Chen, T.S.; Lai, M.C.; Hung, T.Y.; Lin, K.M.; Huang, C.W.; Wu, S.N. Pioglitazone, a PPAR-γ Activator, Stimulates BKCa but Suppresses IKM in Hippocampal Neurons. Front. Pharmacol. 2018, 9, 977. [Google Scholar] [CrossRef]
  20. Liu, Y.Y.; Hsiao, H.T.; Wang, J.C.; Liu, Y.C.; Wu, S.N. Parecoxib, a selective blocker of cyclooxygenase-2, directly inhibits neuronal delayed-rectifier K+ current, M-type K+ current and Na+ current. Eur. J. Pharmacol. 2018, 844, 95–101. [Google Scholar] [CrossRef]
  21. Pena, F.; Alavez-Perez, N. Epileptiform activity induced by pharmacologic reduction of M-current in the developing hippocampus in vitro. Epilepsia 2006, 47, 47–54. [Google Scholar] [CrossRef] [PubMed]
  22. Migliore, M.; Migliore, R. Know your current Ih: Interaction with a shunting current explains the puzzling effects of its pharmacological or pathological modulations. PLoS ONE 2012, 7, e36867. [Google Scholar] [CrossRef] [PubMed]
  23. Kumar, M.; Reed, N.; Liu, R.; Aizenman, E.; Wipf, P.; Tzounopoulos, T. Synthesis and evaluation of potent KCNQ2/3-specific channel activators. Mol. Pharmacol. 2016, 89, 667–677. [Google Scholar] [CrossRef] [PubMed]
  24. Du, X.; Gao, H.; Jaffe, D.; Zhang, H.; Gamper, N. M-type K+ channels in peripheral nociceptive pathways. Br. J. Pharmacol. 2018, 175, 2158–2172. [Google Scholar] [PubMed]
  25. Wu, S.N.; Jan, C.R.; Li, H.F.; Chiang, H.T. Characterization of inhibition by risperidone of the inwardly rectifying K+ current in pituitary GH3 cells. Neuropsychopharmacology 2000, 23, 676–689. [Google Scholar] [CrossRef]
  26. Furlan, F.; Taccola, G.; Grandolfo, M.; Guasti, L.; Arcangeli, A.; Nistri, A.; Ballerini, L. ERG conductance expression modulates the excitability of ventral horn GABAergic interneurons that control rhythmic oscillations in the developing mouse spinal cord. J. Neurosci. 2007, 27, 919–928. [Google Scholar] [CrossRef] [PubMed]
  27. Chen, B.S.; Lo, Y.C.; Peng, H.; Hsu, T.I.; Wu, S.N. Effects of ranolazine, a novel anti-anginal drug, on ion currents and membrane potential in pituitary tumor GH3 cells and NG108-15 neuronal cells. J. Pharmacol. Sci. 2009, 110, 295–305. [Google Scholar] [CrossRef]
  28. Carretero, L.; Llavona, P.; López-Hernández, A.; Casado, P.; Cutillas, P.R.; de la Peña, P.; Barros, F.; Dominguez, P. ERK and RSK are necessary for TRH-induced inhibition of r-ERG potassium currents in rat pituitary GH3 cells. Cell Signal. 2015, 27, 1720–1730. [Google Scholar] [CrossRef]
  29. Huang, M.H.; Shen, A.Y.; Wang, T.S.; Wu, H.M.; Kang, Y.F.; Chen, C.T.; Hsu, T.I.; Chen, B.S.; Wu, S.N. Inhibitory action of methadone and its metabolites on erg-mediated K+ current in GH3 pituitary tumor cells. Toxicology 2011, 280, 1–9. [Google Scholar] [CrossRef]
  30. Wu, S.N.; Hsu, M.C.; Liao, Y.K.; Wu, F.T.; Jong, Y.J.; Lo, Y.C. Evidence for inhibitory effects of flupirtine, a centrally acting analgesic, on delayed rectifier K+ currents in motor neuron-like cells. Evid. Based Complement. Alternat. Med. 2012, 2012, 148403. [Google Scholar] [CrossRef]
  31. Colbert, W.E.; Williams, P.D.; Williams, G.D. β-Adrenoceptor profile of ractopamine HCl in isolated smooth and cardiac muscle tissues of rat and guinea-pig. J. Pharm. Pharmacol. 1991, 43, 844–847. [Google Scholar] [CrossRef] [PubMed]
  32. Tai, C.T.; Chen, S.A.; Chiang, C.E.; Lee, S.H.; Wen, Z.C.; Chang, M.S.; Wu, S.N. Influence of beta-adrenergic and vagal activity on the effect of exogenous adenosine on supraventricular tachycardia termination. Am. J. Cardiol. 1997, 79, 1628–1631. [Google Scholar] [CrossRef]
  33. Vandenberg, G.; Leatherland, J.; Moccia, R.D. The effects of the beta-agonist ractopamine on growth hormone and intermediary metabolite concentrations in rainbow trout, Oncorhynchus mykiss (Walbaum). Aquac. Res. 2008, 29, 9. [Google Scholar] [CrossRef]
  34. Mills, S.E.; Spurlock, M.E.; Smith, D.J. β-Adrenergic receptor subtypes that mediate ractopamine stimulation of lipolysis. J. Anim. Sci. 2003, 81, 662–668. [Google Scholar] [CrossRef] [PubMed]
  35. Stephany, R.W. Hormonal growth promoting agents in food producing animals. Handb. Exp. Pharmacol. 2010, 195, 355–367. [Google Scholar]
  36. Lee, S.H.; Lee, E.H.; Ryu, S.Y.; Rhim, H.; Baek, H.J.; Lim, W.; Ho, W.K. Role of K+ channels in frequency regulation of spontaneous action potentials in rat pituitary GH3 cells. Neuroendocrinology 2003, 78, 260–269. [Google Scholar] [CrossRef] [PubMed]
  37. Hasebe, M.; Oka, Y. High-frequency firing activity of GnRH1 neurons in female Medaka induces the release of GnRH1 peptide from their nerve terminals in the pituitary. Endocrinology 2017, 158, 2603–2617. [Google Scholar] [CrossRef] [PubMed]
  38. Caspi, A.; Benninger, F.; Yaari, Y. KV7/M channels mediate osmotic modulation of intrinsic neuronal excitability. J. Neurosci. 2009, 29, 11098–11111. [Google Scholar] [CrossRef] [PubMed]
  39. Chen, P.C.; Ruan, J.S.; Wu, S.N. Evidence of decreased activity in intermediate-conductance calcium-activated potassium channels during retinoic acid-induced differentiation in motor neuron-like NSC-34 cells. Cell. Physiol. Biochem. 2018, 48, 2374–2388. [Google Scholar] [CrossRef]
  40. So, E.C.; Wang, Y.; Yang, L.Q.; So, K.H.; Lo, Y.C.; Wu, S.N. Multiple regulatory actions of 2-guanidine-4-methylquinazoline (GMQ), an agonist of acid-sensing ion channel type 3, on ionic currents in pituitary GH3 cells and in olfactory sensory (Rolf B1.T) neurons. Biochem. Pharmacol. 2018, 151, 79–88. [Google Scholar] [CrossRef]
  41. Wu, S.N.; Yang, W.H.; Yeh, C.C.; Huang, H.C. The inhibition by di(2-ethylhexyl)-phthalate of erg-mediated K+ current in pituitary tumor (GH3) cells. Arch. Toxicol. 2012, 86, 713–723. [Google Scholar] [CrossRef] [PubMed]
  42. Wu, S.N.; Chern, J.H.; Shen, S.; Chen, H.H.; Hsu, Y.T.; Lee, C.C.; Chan, M.H.; Lai, M.C.; Shie, F.S. Stimulatory actions of a novel thiourea derivative on large-conductance, calcium-activated potassium channels. J. Cell. Physiol. 2017, 232, 3409–3421. [Google Scholar] [CrossRef] [PubMed]
  43. Zhou, J.; Augelli-Szafran, C.E.; Bradley, J.A.; Chen, X.; Koci, B.J.; Volberg, W.A.; Sun, Z.; Cordes, J.S. Novel potent human ether-a-go-go-related gene (hERG) potassium channel enhancers and their in vitro antiarrhythmic activity. Mol. Pharmacol. 2005, 68, 876–884. [Google Scholar] [PubMed]
  44. Yu, H.; Wu, M.; Townsend, S.D.; Zou, B.; Long, S.; Daniels, J.S.; McManus, O.B.; Li, M.; Lindsley, C.W.; Hopkins, C.R. Discovery, synthesis, and structure activity relationship of a series of N-aryl- bicyclo[2.2.1]heptane-2-carboxamides: Characterization of ML213 as a novel KCNQ2 and KCNQ4 potassium channel opener. ACS Chem. Neurosci. 2011, 2, 572–577. [Google Scholar] [CrossRef] [PubMed]
  45. Gatford, K.L.; De Blasio, M.J.; Roberts, C.T.; Nottle, M.B.; Kind, K.L.; van Wettere, W.H.; Smits, R.J.; Owens, J.A. Responses to maternal GH or ractopamine during early-mid pregnancy are similar in primiparous and multiparous pregnant pigs. J. Endocrinol. 2009, 203, 143–154. [Google Scholar] [CrossRef] [PubMed]
  46. Momčilović, S.; Milovanović, J.R.; Janković, S.M.; Jovanović, A.; Tasić-Otašević, S.; Stanojević, D.; Krstić, M.; Šalinger-Martinović, S.; Radojković, D.D.; Damjanović, M.; et al. Population pharmacokinetic analysis of bisoprolol in patients with acute coronary syndrome. J. Cardiovasc. Pharmacol. 2018. (Epub ahear of print). [Google Scholar]
  47. Janssens, K.; Boussemaere, M.; Wagner, S.; Kopka, K.; Denef, C. β1-Adrenoceptors in rat anterior pituitary may be constitutively active. inverse agonism of CGP 20712A on basal 3’,5’-cyclic adenosine 5’-monophosphate levels. Endocrinology 2008, 149, 2391–2402. [Google Scholar] [CrossRef]
  48. Huang, Y.C.; Wu, B.N.; Lin, Y.T.; Chen, S.J.; Chiu, C.C.; Cheng, C.J.; Chen, I.J. Eugenodilol: A third-generation beta-adrenoceptor blocker, derived from eugenol, with alpha-adrenoceptor blocking and beta2-adrenoceptor agonist-associated vasorelaxant activities. J. Cardiovasc. Pharmacol. 1999, 34, 10–20. [Google Scholar] [CrossRef]
  49. Wu, B.N.; Shen, K.P.; Lin, R.J.; Huang, Y.C.; Chiang, L.C.; Lo, Y.C.; Lin, C.Y.; Chen, I.J. Lipid solubility of vasodilatory vanilloid-type beta-blockers on the functional and binding activities of beta-adrenoceptor subtypes. Gen. Pharmacol. 2000, 34, 321–328. [Google Scholar] [CrossRef]
  50. Almeman, A.A.; Beshir, Y.A.; Aldosary, A.H. Comparison of the effects of metoprolol and bisoprolol on lipid and glucose profiles in cardiovascular patients. Curr. Drug Saf. 2018. (Epub ahead of print). [Google Scholar] [CrossRef]
  51. Fowkes, R.C.; Forrest-Owen, W.; McArdle, C.A. C-type natriuretic peptide (CNP) effects in anterior pituitary cell lines: Evidence for homologous desensitisation of CNP-stimulated cGMP accumulation in alpha T3-1 gonadotroph-derived cells. J. Endocrinol. 2000, 166, 195–203. [Google Scholar] [CrossRef] [PubMed]
  52. Zhou, B.R.; Zhou, H.F.; Liu, B.; Jiang, X.F.; Xu, J.Y.; Jiang, M. The effect of Bushen Zhuyun prescription on gonadotropic hormone secretion and key transcription factor expression in rat pituitary cells. Nanosci. Nanotechnol. Lett. 2017, 9, 1596–1603. [Google Scholar] [CrossRef]
  53. Gingerich, S.; Kim, G.L.; Chalmers, J.A.; Koletar, M.M.; Wang, X.; Wang, Y.; Belsham, D.D. Estrogen receptor alpha and G-protein coupled receptor 30 mediate the neuroprotective effects of 17beta-estradiol in novel murine hippocampal cell models. Neuroscience 2010, 170, 54–66. [Google Scholar] [CrossRef] [PubMed]
  54. Huang, C.W.; Chow, J.C.; Tsai, J.J.; Wu, S.N. Characterizing the effects of Eugenol on neuronal ionic currents and hyperexcitability. Psychopharmacology 2012, 221, 575–587. [Google Scholar] [CrossRef] [PubMed]
Figure 1. The expression levels of the β-actin, KCNC1 (KV3.1), KCNQ2 (KV7.2) and KCNQ3 (KV7.3) isolated from GH3 cells. Total RNA was isolated and RT-PCR analysis was made. Amplified RT-PCR products were obtained using for a marker lane of DNA molecular size (leftmost) and KCNQ2/3 subunit (198 bp). The labelling in the left side indicates the molecular weight.
Ijms 20 00657 g001
Figure 2. Effect of bisoprolol (BIS) in the amplitude of M-type K+ current (IK(M)) in GH3 cells. Cells were bathed in high-K+ solution and the pipette was filled with K+-containing solution, the composition of which is detailed in Materials and Methods. As the whole-cell mode was established, the depolarizing pulse from −50 to −10 mV (indicated in the Inset of [A)]) was delivered to the examined cells. (A) Original IK(M) traces in response to long-lasting membrane depolarization. a: control; b: 0.1-μM BIS; c: 0.3-μM BIS; and d: 1-μM BIS. (B) Concentration-response curve for BIS-induced inhibition of IK(M) in GH3 cells. The amplitude of IK(M) during cell exposure to different BIS concentrations (0.01–30 μM) was compared with the control value (mean ± SEM; n = 12 for each data point). The sigmoidal smooth line represents a best fit to a modified Hill function described in Materials and Methods. The values for IC50, maximally inhibited percentage of IK(M), and the Hill coefficient were 1.21μM, 100 %, and 1.2, respectively. (C) Summary bar graph showing the effects of BIS, BIS plus flupirtine, and BIS plus ivabradine on IK(M) amplitude (mean ± SEM; n = 9 for each bar). BIS: 1-μM BIS; Flu: 10 μM flupirtine; IVA: 10 μM ivabradine. * Significantly different from control (p < 0.05) and ** significantly different from BIS (1 μM) alone group (p < 0.05).
Ijms 20 00657 g002aIjms 20 00657 g002b
Figure 3. Accumulative activation of IK(M) during repetitive stimuli obtained in the absence and presence of BIS in GH3 cells. Cells were bathed in high-K+, Ca2+-free solution. (A) Representative current trace in response to single step or repetitive pulses (b). In the lower part of (a), current was evoked in response to single membrane depolarization from−50 to −10 mV with a duration of 1 sec (indicated in the upper part of (a)), whereas that in (b) was obtained during rapid repetitive depolarizations to −10 mV (indicated in the lower part of (b)). The individual depolarizing pulse used to elicit inward K+ current lasted 6 msec with a total duration of 1 sec. Arrowheads in (a) and (b) indicate the zero current level, while open arrow indicated in (b) depicts the level of IK(M) elicited. The activation time constants for control IK(M) traces in response to single step and repetitive depolarizing pulses were 53 and 69 msec, respectively. (B) Summary bar graph showing the effects of BIS (1 and 3 μM) on the amplitude of IK(M) during repetitive depolarizations (mean ± SEM; n = 13 for each bar). Current amplitude was measured at the end of single step or repetitive depolarizing pulses (i.e., 1 sec). *or** indicates significantly different from the controls taken with single depolarizing step (p < 0.05) or repetitive stimuli (p < 0.05), respectively.
Ijms 20 00657 g003
Figure 4. Effect of BIS on the deactivating IK(M) in response to depolarizing pulse with different durations (10-280 msec) of falling phase which was used to mimic different repolarizing slope of bursting pattern. (A) Superimposed current traces in response to the uppermost voltage protocol obtained in the absence (upper) and presence (lower) of 10-μM BIS. The uppermost part indicates the voltage profile applied. (B) Effect of BIS on deactivating IK(M) upon return to −50 mV with different durations (mean ± SEM; n = 11 for each data point). The peak amplitude of deactivating IK(M) was taken at different durations of falling phase. ■: control; □: in the presence of 3-μM BIS.
Ijms 20 00657 g004
Figure 5. Effect of BIS on single channel activity of M-type K+ (KM) channels in GH3 cells. In these current recordings, cells were bathed in high-K+, Ca2+-free solution and the recording pipette was filled with low-K+ (5.4 mM) solution, the composition of which is described in Materials and Methods. (A) Original single KM channels obtained in the absence (upper) and presence of 1-μM BIS (lower). The potential was maintained at 0 mV relative to the bath. The upward deflection indicates the opening event of the channel. (B) Amplitude histogram obtained in the control (left) and during the exposure to 1-μM BIS (right). The smooth line shown in each histogram indicates the Gaussian curve.
Ijms 20 00657 g005
Figure 6. Effect of BIS on mean open time of KM channels recorded from GH3 cells. In control, data were obtained from measurements of 480 channel openings, with a total recording time of 2 min, whereas in the presence of 1-μM BIS, data were from 371 channel openings, with a total recording time of 3 min. Note that the ordinate and abscissa indicate the square root of the event number (i.e., event ) and the logarithm of open time (msec) and, respectively. The smooth line shown in each lifetime distribution was least-squares fitted using a single-exponential function, and the vertical broken line illustrates the value of the time constant.
Ijms 20 00657 g006
Figure 7. Effect of BIS on I-V relationship and activation curve of KM channels in GH3 cells. (A) Averaged I-V relationships of single KM-channel currents in the absence (■) and presence (○) of 1-μM BIS (mean ± SEM; n = 9 for each data point). The broken line is pointed toward the value of the reversal potential with -70 mV. (B) Activation curves of KM channels in the absence (■) and presence (□) of 1-μM BIS (mean ± SEM; n = 9 for each data point). Channel activity measured under cell-attached current recordings was measured at different potentials relative to the bath. The smooth curves overlaid onto each data set were least-squares fitted with the Boltzmann equation (see Materials and Methods for details).
Ijms 20 00657 g007
Figure 8. Inhibitory effect of BIS on erg-mediated K+ currents (IK(erg)) in GH3 cells. In these experiments, we bathed the cells in high-K+, Ca2+-free solution and the pipette used was filled with K+-containing solution. (A) Original current traces in response to membrane hyperpolarization from −10 mV (indicated in the upper part). a: control; b: 1-μM BIS; c: 3-μM BIS. (B) Percentage inhibition of IK(erg) produced by different concentrations (0.3–100 μM) of BIS. Each cell was hyperpolarized from −10 to -80 mV, and current amplitudes at the end of hyperpolarizing step with or without BIS were measured and compared (mean ± SEM; n = 8 for each data point). Smooth line represents the best fit to a modified Hill function (see Materials and Methods for details). (C) Summary bar graph showing the effect of BIS and BIS plus PD-118057 on IK(erg) amplitude (mean ± SEM; n = 9 for each bar). IK(erg) elicited by hyperpolarization from −10 to −80 mV was measured at the beginning of each hyperpolarizing pulse. PD: PD-118057 (10 μM). * Significantly different from control (p < 0.05) and ** significantly different from 3-μM BIS alone group (p < 0.05).
Ijms 20 00657 g008
Figure 9. Effect of BIS on delayed-rectifier K+ current (IK(DR)) in GH3 cells. In these whole-cell current recordings, cells were bathed in Ca2+-free Tyrode’s solution. The examined cells were held at −50 mV and a series of voltage step ranging between −50 and +60 mV. (A) Superimposed current traces obtained in the absence (upper) and presence (lower) of 30-μM BIS. The uppermost part indicates the voltage protocol used and arrowhead is the zero current level. (B) Averaged I-V relationships of IK(DR) obtained in the absence (■) and presence (○) of 30-μM BIS (mean ± SEM; n = 11 for each data point). Current amplitude was measured at the end of each depolarizing step from a holding potential of −50 mV.
Ijms 20 00657 g009
Figure 10. Effects of BIS on spontaneous action potentials (APs) in GH3 cells. In these current-clamp voltage recordings, cells were bathed in normal Tyrode’s solution containing 1.8 mM CaCl2, and the recording pipette was filled with K+-containing solution. (A) Original potential trace obtained in the absence (upper) and presence (lower) of 3-μM BIS. (B) Summary bar graph showing the effects of BIS, BIS plus ractopamine, and BIS plus flupirtine on the firing frequency of spontaneous APs in GH3 cells (mean ± SEM; n = 8 for each bar). a: control; b: 1-μM BIS c: 3-μM BIS; d: 3-μM BIS plus 10 μM ractopamine; e: 3-μM BIS plus 10 μM flupirtine. * Significantly different from control (p < 0.05) and ** significantly different from the 3-μM BIS alone group (p < 0.05).
Ijms 20 00657 g010
Figure 11. Inhibitory effect of BIS on IK(M) recorded from rat pituitary R1220 cells. In this set of recordings, similar experimental conditions to that in GH3 cells described above were applied. (A) Original IK(M) elicited by membrane depolarization from −50 to −10 mV. a: control; b: 0.3-µM BIS and c: 1 µM BIS. (B) Summary bar graph showing effect of BIS and BIS plus flupirtine on IK(M) in these cells (mean ± SEM; n = 12 for each bar). a: control; b: 0.3-µM BIS; c: 1-µM BIS; d: 1-µM BIS plus 10-µM ML-213. * Significantly different from control (p < 0.05) and ** significantly different from 1-µM BIS alone group (p < 0.05).
Ijms 20 00657 g011
Figure 12. Effect of BIS on IK(M) in hippocampal mHippoE-14 cells. In these experiments, we bathed the cells in high-K+, Ca2+-free solution, and the examined cell was depolarized from −50 mV to various voltages ranging between −50 and −10 mV. (A) Original current traces obtained in the absence (upper) and presence (lower) of 3 µM BIS. The uppermost part indicates the voltage protocol applied and arrowhead is the zero current level. (B) Averaged I-V relationship of IK(M) (mean ± SEM; n = 9 for each data point). ■: control; □: 3 µM BIS. Current amplitude was measured at the end of each voltage step.
Ijms 20 00657 g012

