Article

Biosynthesis and Signal Transduction of ABA, JA, and BRs in Response to Drought Stress of Kentucky Bluegrass

1
College of Horticulture and Landscape Architecture, Northeast Agricultural University, Harbin 150030, China
2
College of Life Science, Agriculture and Forestry, Qiqihar University, Qiqihar 161006, China
*
Author to whom correspondence should be addressed.
Int. J. Mol. Sci. 2019, 20(6), 1289; https://0-doi-org.brum.beds.ac.uk/10.3390/ijms20061289
Submission received: 12 February 2019 / Revised: 8 March 2019 / Accepted: 10 March 2019 / Published: 14 March 2019
(This article belongs to the Section Molecular Plant Sciences)

Abstract

:
Kentucky bluegrass (KB, Poa pratensis) is one of the most widely used cool-season turfgrass species, but it is sensitive to drought stress. Molecular studies in KB are hindered by its large and complex genome structure. In this study, a comparative transcriptomic study was conducted between a short and long period of water deficiency. Three transcriptome libraries were constructed and then sequenced by using leaf RNA samples of plants at 0, 2, and 16 h after PEG6000 treatment. A total of 199,083 differentially expressed genes (DEGs) were found. The Kyoto Encyclopedia of Genes and Genomes (KEGG) annotation revealed that DEGs were enriched in “Plant hormone signal transduction” and “MAPK signaling pathway-Plant”. Some key up-regulated genes, including PYL, JAZ, and BSK, were involved in hormone signaling transduction of abscisic acid, jasmonic acid, and brassinosteroid and possibly these genes play important roles in coping with drought stress in KB. Furthermore, our results showed that the concentrations of ABA, JA and BR increased significantly with the extension of the drought period. The specific DEGs encoding functional proteins, kinase and transcription factors, could be valuable information for genetic manipulation to promote drought tolerance of KB in the future.

Graphical Abstract

1. Introduction

Lawns are part of the green ecosystem in the urban area which provides many kinds of environmental functions such as CO2 fixation and emission of O2. Kentucky bluegrass (“KB”) (Poa pratensis L.) is an excellent cool-season turfgrass and is extensively used in public parks, golf courses and residential lawns. This species possesses highly ornamental value, but it is extremely sensitive to water scarcity [1]. This important grass species has a large and complex genome that hinders its molecular and genetic studies. In particular, KB has hexaploid, octoploid and heptaploid varieties with a DNA per cell value of 6–9 pg for most varieties, which is about 3–4 times larger than that of maize (Zea mays) (data source from http://data.kew.org/cvalues/; July 2013). In addition, KB exhibits both sexual fertilization and apomixis with respect to seed formation [2]. As for its sexual fertilization, KB is self-incompatible and therefore has a highly heterozygous genome background. So far, the genome sequence of this species has not been released. With the development of the next-generation sequencing technology, de novo transcriptome analysis without a reference genome is considered an alternative way to identify putative genes that are related to many important physiological processes.
Global climate change has increased the occurrence of drought globally, due to which new challenges have been raised for turfgrass management. Drought has become a pivotal factor negatively affecting turfgrass growth and quality [3]. Drought stress significantly impacts water status by reducing the relative water content in plants [4,5]. Plants evolved different strategies to cope with short or long durations of drought stress. For example, stomatal closure is an effective response of plants to reduce water loss during drought stress [6]. Prolonged drought stress causes osmotic and oxidative stresses, resulting in an increase in reactive oxygen species (ROS) and impairment of plant cells [7]. In our previous studies, we found that drought stress notably influenced agronomical, anatomical and physiological attributes of KB, such as relative water content (RWC), leaf crosscutting structure, and photosynthesis [8,9]. Drought stress also causes the accumulation of phytohormones such as abscisic acid (ABA), jasmonic acid (JA), and salicylic acid in KB [10]. Furthermore, drought stress remarkably increased the antioxidant enzyme activities of KB [1]. However, potential genes underlying such physiological changes have not yet been studied mainly due to the lack of genomic and bioinformatics resources of this specific grass species.
Physiological responses as well as their underlying molecular responses to drought stress change during the time course. Drought stress affects both physiological parameters and gene expression. For example, one study documented that the photosynthesis parameters (stomatal conductance, transpiration rate, and net photosynthetic rate) of rice seedlings decreased rapidly at 3 h and thereafter exhibited an increasing trend at 48 h under PEG-simulated drought stress [11]. One PEG-inducible gene (OsASR5), which is involved in stomatal closure, exhibited the highest and lowest expression level at 3 and 16 h, respectively, after PEG treatment in rice [12]. Monodehydroascorbate reductase and glutathione reductase were up-regulated by drought stress and remained at those levels even after recovery in KB [13]. Peanut (Arachis hypogaea) plants exposed to PEG stress during the fruiting stage resulted in ABA accumulation initially at 1 h, and then it achieved its relatively higher level after 16 h of stress [6]. However, it is still not clear whether phytohormone biosynthesis and signaling transduction can change dynamically in KB upon drought stress. Therefore, the potential difference between short- and long-term drought response should be taken into account to further understand the response to drought of KB.
In order to cope with abiotic stresses, plants exhibit comprehensive mechanisms such as signal transduction, metabolic activation, and gene expression regulation [14,15,16]. Transcriptome profiling has been used widely to identify drought-responsive genes and characterize molecular mechanisms [17]. Functions of stress responsive genes such as heat stress transcription factor (HSF), dehydration-responsive element binding proteins (DREB), serine/threonine protein kinase (SnRK2), lipid transfer protein (LTP), and MYB have been further verified and well characterized [18,19,20,21,22,23]. These genes are promising candidates for promoting drought tolerance. As the most popular technique in transcriptome profiling, RNA-Seq has been broadly used in turfgrass research [24]. The results derived from RNA-Seq showed that oxidative protection, proline biosynthesis, and lipid hydrolysis played key roles in response to heat stress in bentgrass (Agrostis scabra) [25]. It has been revealed that transcription factors, ion and water transport genes of KB played key roles during salt tolerance [26]. However, there is no report on transcriptomic analysis of KB in different drought periods using RNA-Seq.
In the present study, we identified drought stress responsive genes using RNA sequencing. The objectives of this study were: (1) to provide a bioinformatics resource for KB with a focus on drought-inducible genes; (2) to understand dynamic changes of key metabolic pathways during short-term drought periods with an emphasis on plant hormone signal transduction over time.

2. Results

2.1. Sequence Analysis and Transcript Assembly

A total of 380 million clean reads were identified after trimming adapters and filtering out low-quality reads (Supplementary Table S1). The number of clean reads obtained by each group accounted for more than 94.64% of the original reads, which indicated that the libraries worked well. The sequence length obtained by splicing was used to measure the splicing quality. After Trinity splicing, the total length of the transcript was 643,096 nt, including 96,544 scaffolds larger than 1000 bp. The average transcript length was 677.96 nt, N50 length was 747 bp, and N90 length was 374 bp (Supplementary Table S2) after local assembly with the unmapped ends to fill in the small gaps within the Scaffolds. The de novo assembly yielded 199,083 unigenes with an average length of 718.83 bp.

2.2. Sequence Annotation

A total of 199,083 unigenes were annotated, and many of them were in the TrEMBL (110,075 and 55.29%) and the NR (109,922 and 55.21%) database. In addition, 3120 unigenes (1.57%) were annotated to nine databases, and 122,431 unigenes (61.5%) obtained functional annotations in at least one database (Supplementary Table S3). In order to analyze the conservation of sequences, the unigenes annotated in the NR database of KB were compared with those of other species (Supplementary Figure S1). The top match was Brachypodium distachyon (27,695 and 25.14%), followed by Aegilops tauschii (18,969 and 17.22%), Hordeum vulgare subsp. vulgare (18,783 and 17.05%), Triticum urartu (10,617 and 9.64%). As expected, more than 86.88% of the sequences were highly homologous with the sequences of Gramineous plants.
A total of 91,237 unigenes were annotated to the GO database, with three main ontologies: biological process, cellular component and molecular function. “Cellular process”, “Metabolic process” and “Single-organism process” were the most abundantly represented subcategories in the biological process, “cell”, “cell part” and “organelle” in cellular components categories (Figure 1). Within the molecular function, “Catalytic activity”, “Binding” and “Transporter activity” contained the largest number of genes (Figure 1). In total, 41,991 unigenes annotated by KOG were classified into 25 categories (Figure 2). The largest number of unigenes were classified as “Signal transduction mechanisms” (7130 and 15.19%), followed by “Posttranslational modification, protein turnover, chaperones” (5133 and 10.94%), and “General function prediction only” (5065 and 10.79%).
KEGG is used for metabolic analysis and metabolic network research in organisms. In the present study, 13,601 unigenes were classified into 214 KEGG pathways. The pathways including “Cellular processes”, “Environmental information processing”, “Genetic information processing”, and “Metabolism”. The “Metabolism” pathway contained the largest number of unigenes (6823 and 50.17%), followed by “Genetic information processing” (3869 and 28.45%), and “Cellular processes” (1567 and 11.52%) (Figure 3).

2.3. DEGs under Drought Stress

The reliability of the libraries was evaluated using repeated correlation and cluster analysis of samples (Supplementary Figures S2 and S3). There were 15,536 up-regulated and 14,770 down-regulated genes in the 2 vs 0 h regime (Figure S4B). In the 16 vs 2 h regime, 16,420 up-regulated and 14,498 down-regulated genes were found. In 16 vs 0 h, 5110 up-regulated and 4030 down-regulated genes were identified (Supplementary Table S4). A Venn diagram analysis indicated that 24 genes were up-regulated while 36 genes were down-regulated continuously during the entire drought period (Figure S4A, Supplementary Table S4).

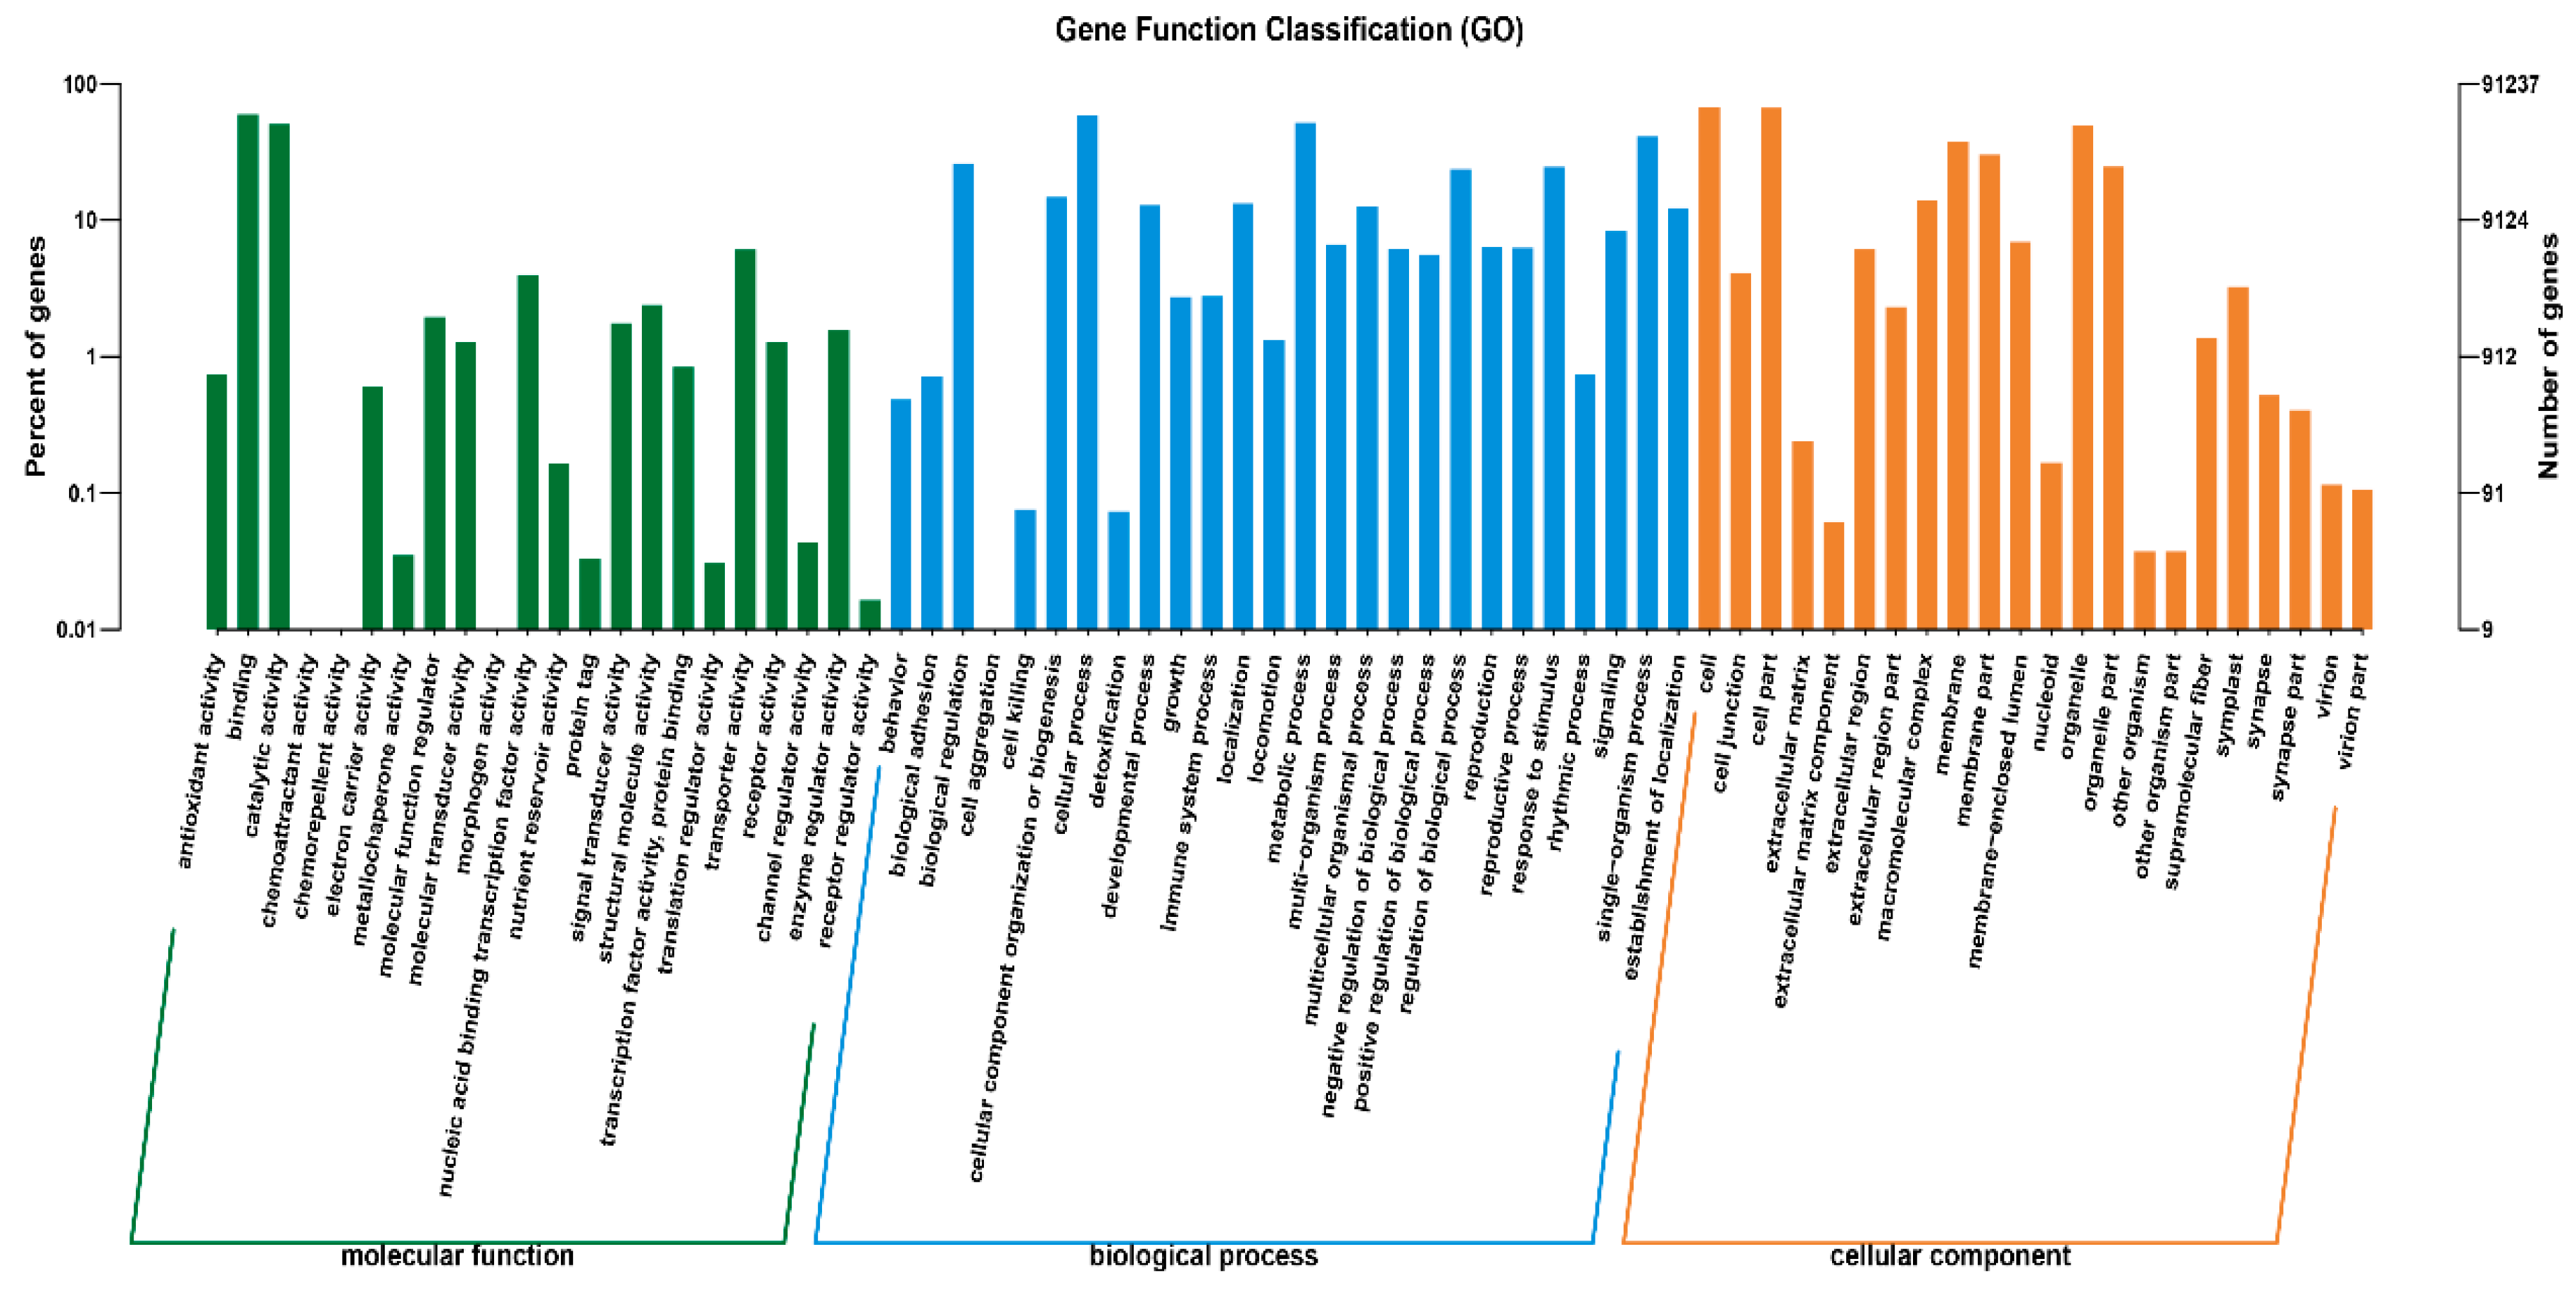
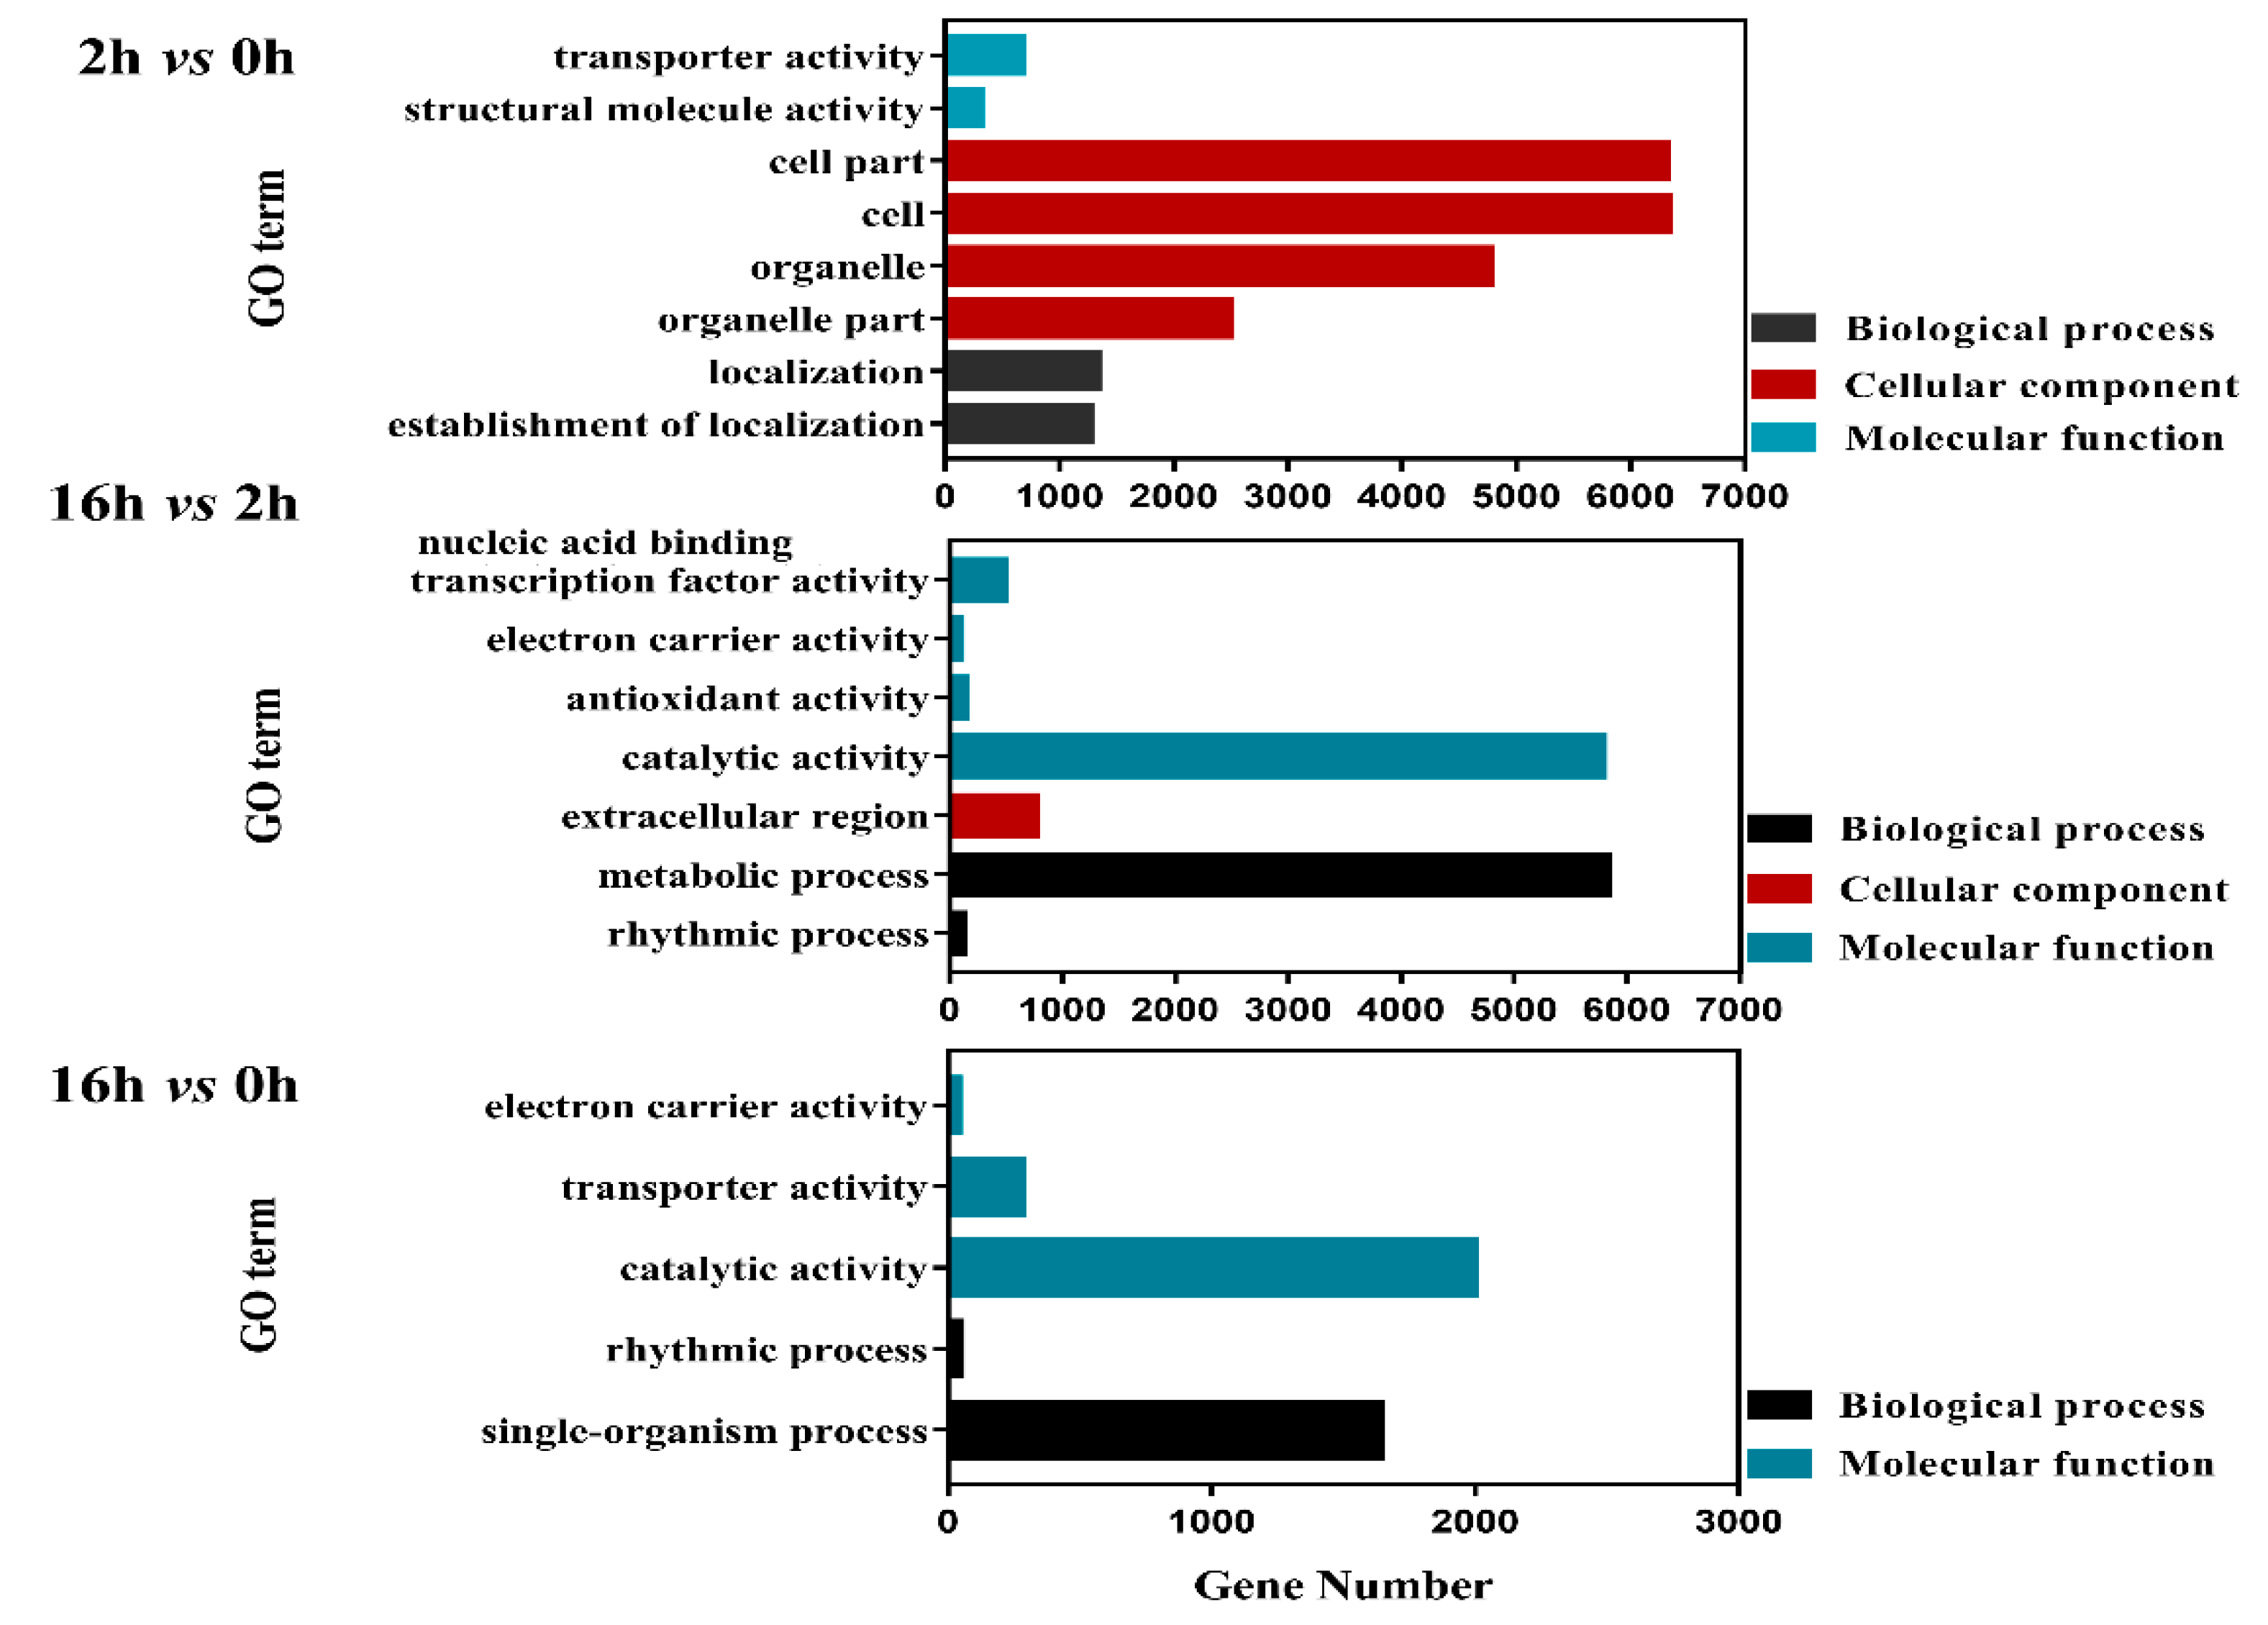
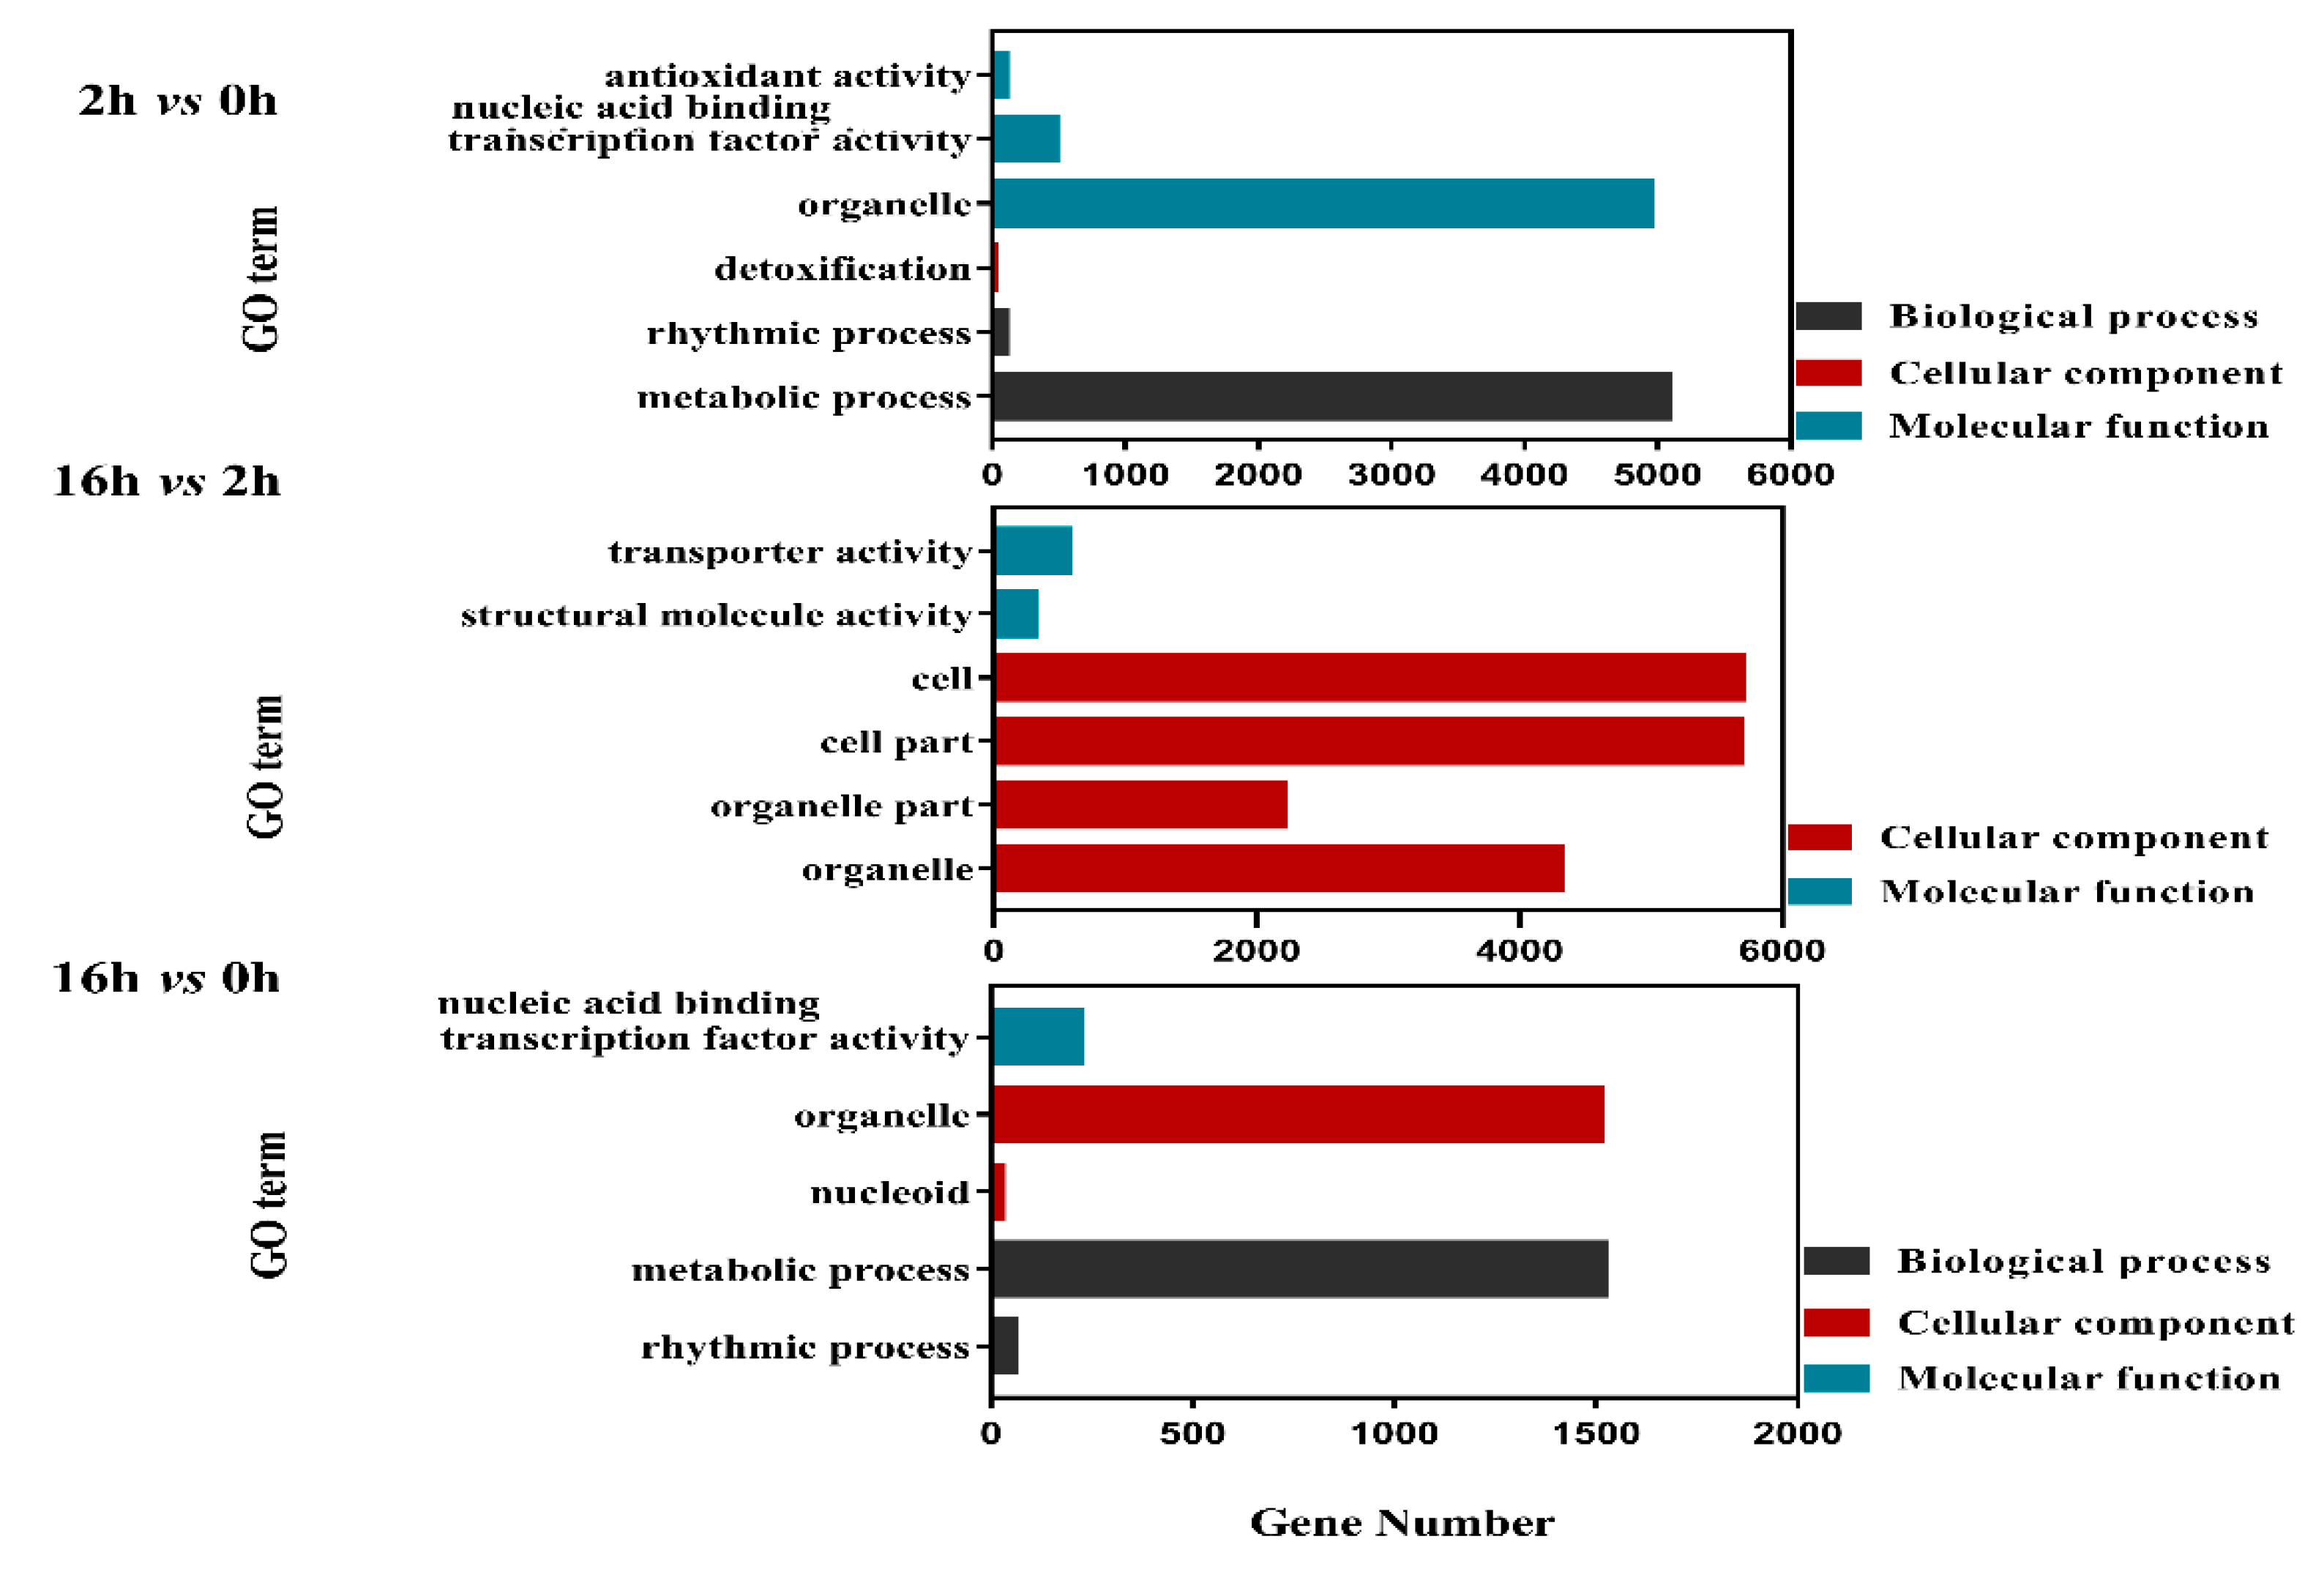
2.4. GO Analysis of DEGs

For DEGs with increased expressions in the 2 vs 0 h regime, the top enriched GO terms were “Establishment of localization” and “Localization” in the category of biological process, “Structural molecule activity” and “Transporter activity” in the molecular function group. In the 16 vs 2 h regime, “Metabolic process” was the most highly enriched in the biological process, while “Catalytic activity” was distinctly classified in molecular function, and “Extracellular region” was clearly abundant in the cellular component category. In 16 vs 0 h, “Single-organism process” and “Catalytic activity” were enriched in biological process and molecular function categories, respectively (Figure 4). For DEGs with decreased expressions in 2 vs 0 h regime, the top enriched GO terms were “Metabolic process” and “Organelle” in the group of biological process and molecular function, respectively. In 16 vs 2 h, “Structural molecule activity”, “Transporter activity”, “Cell”, “Cell part” were dramatically integrated into the molecular function and cellular component category. Analogously, the “Rhythmic process”, “Metabolic process”, “Nucleoid”, “Organelle” and “Nucleic acid binding transcription factor activity” were highly enriched in 16 vs 0 h (Figure 5).

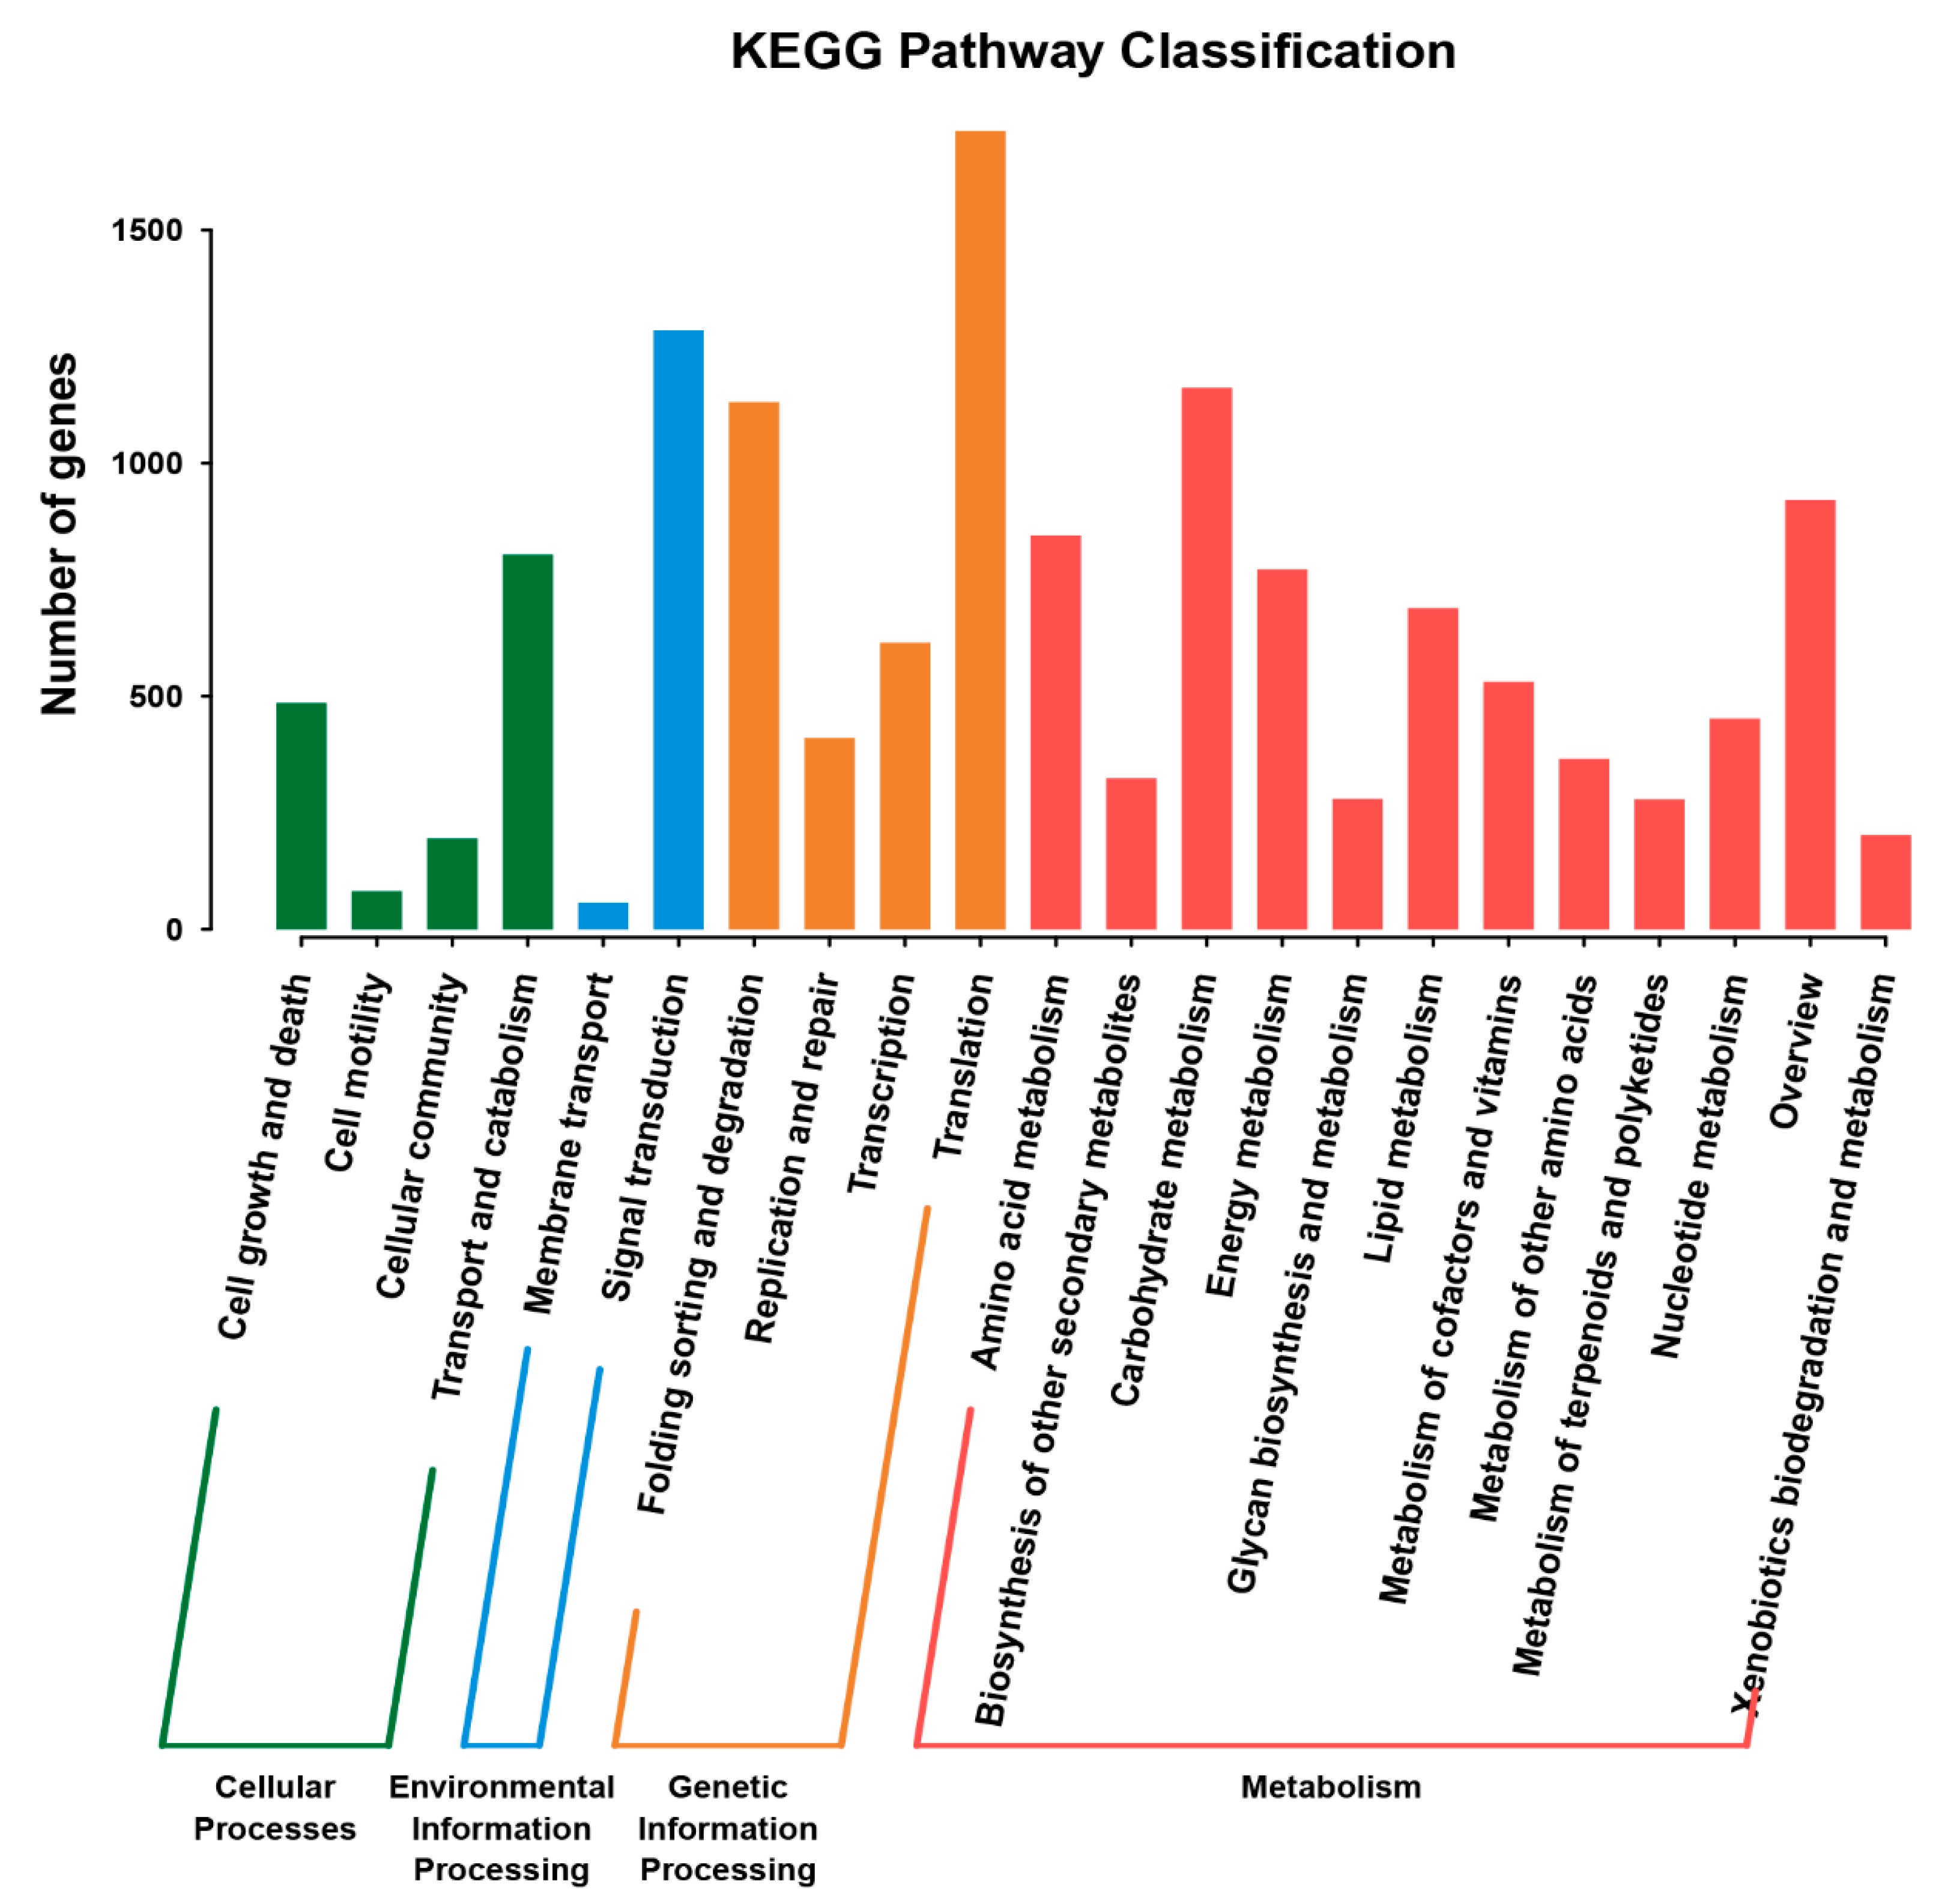
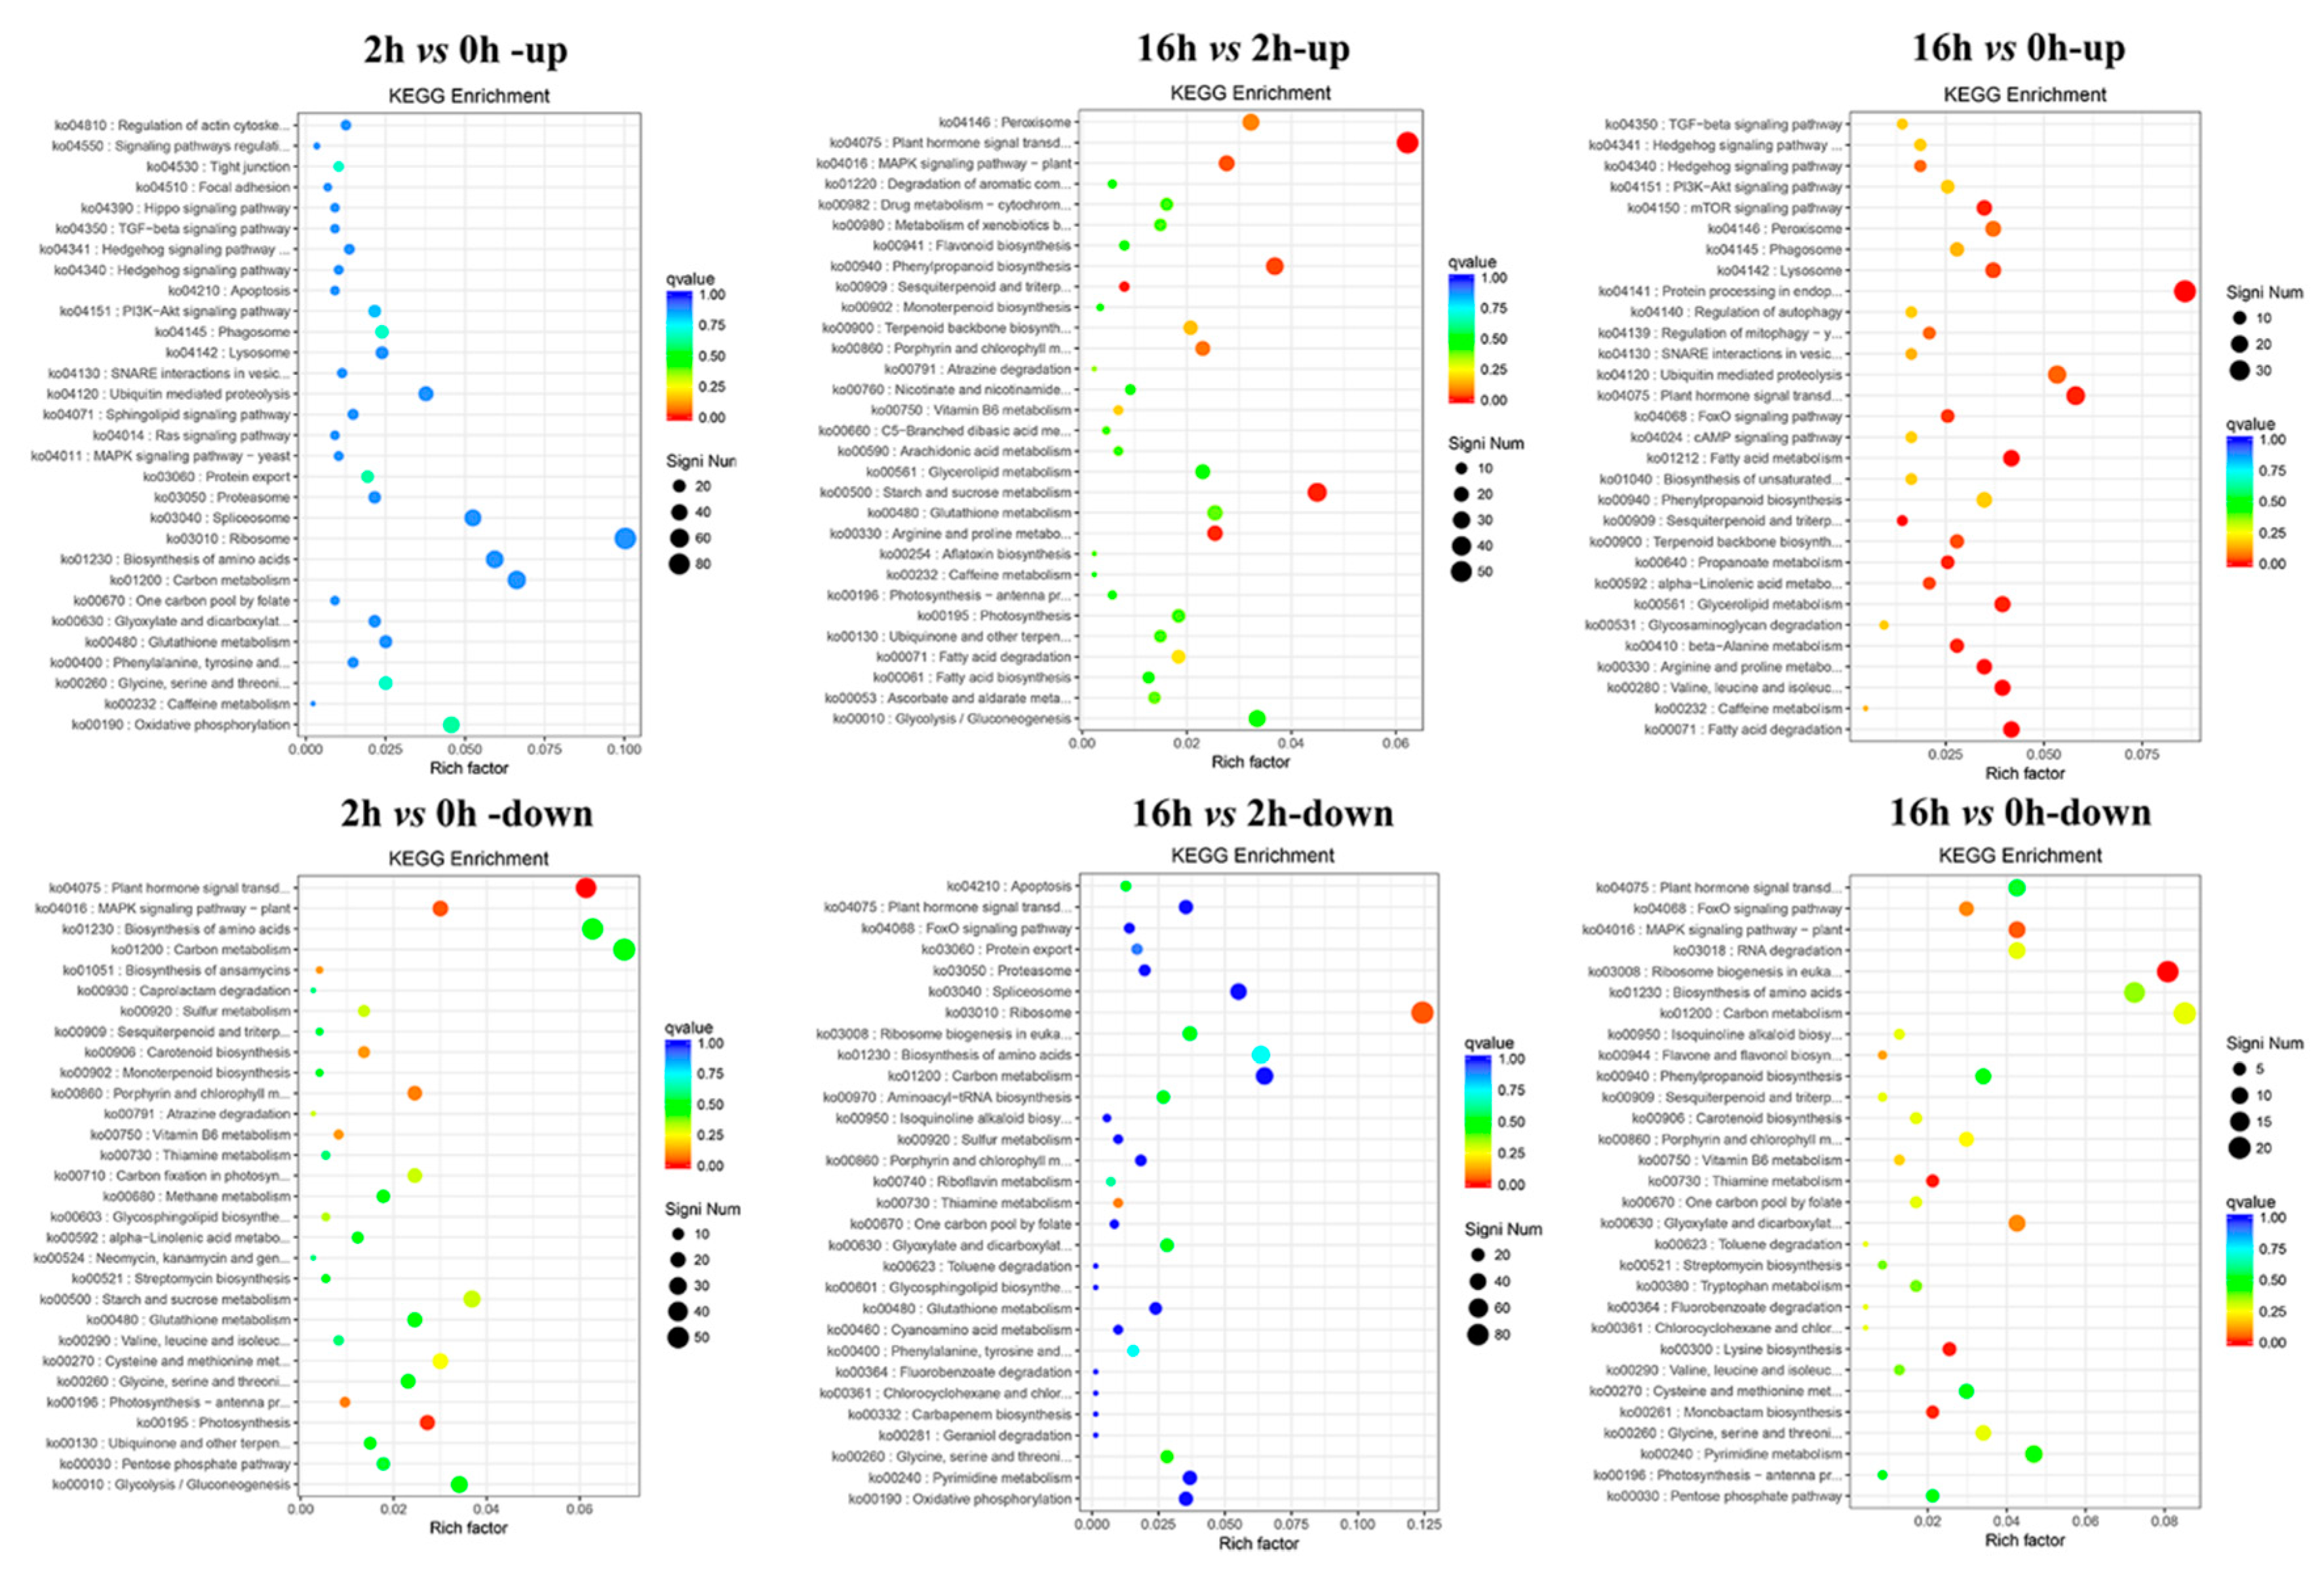
2.5. KEGG Pathway Analysis of DEGs

All the DEGs in 2 vs 0 h, 16 vs 2 h and 16 vs 0 h regimes were subjected to KEGG pathway enrichment analysis. The DEGs with increased expression were enriched in “Oxidative phosphorylation” (ko00190), and “Protein export” (ko03060) pathways in 2 vs 0 h; in “Plant hormone signal transduction” (ko04075), “Starch and sucrose metabolism” (ko00500), “Arginine and proline metabolism” (ko00330), and “Sesquiterpenoid and triterpenoid biosynthesis” (ko00909) pathways in 16 vs 2 h (Figure 6); in “Fatty acid degradation” (ko00071), “Valine, leucine and isoleucine degradation” (ko00280), “Sesquiterpenoid and triterpenoid biosynthesis” (ko00909), and “Protein processing in endoplasmic reticulum” (ko04141) in 16 vs 0 h (Figure 6). The enriched pathways of DEGs with decreased expression were “Plant hormone signal transduction” (ko04075) and “Photosynthesis” (ko00195) in 2 vs 0 h, “Ribosome” (ko03010) and “Thiamine metabolism” (ko00730) in 16 vs 2 h, “Ribosome biogenesis in eukaryotes” (ko03008), “Lysine biosynthesis” (ko00300), and “Thiamine metabolism” (ko00730) in 16 vs 0 h (Figure 6). For example, a total of 74 DEGs in 2 vs 0 h regime, 79 DEGs in 16 vs 2 h, and 25 DEGs in 16 vs 0 h involved in “Plant hormone signal transduction” (Figure 6).

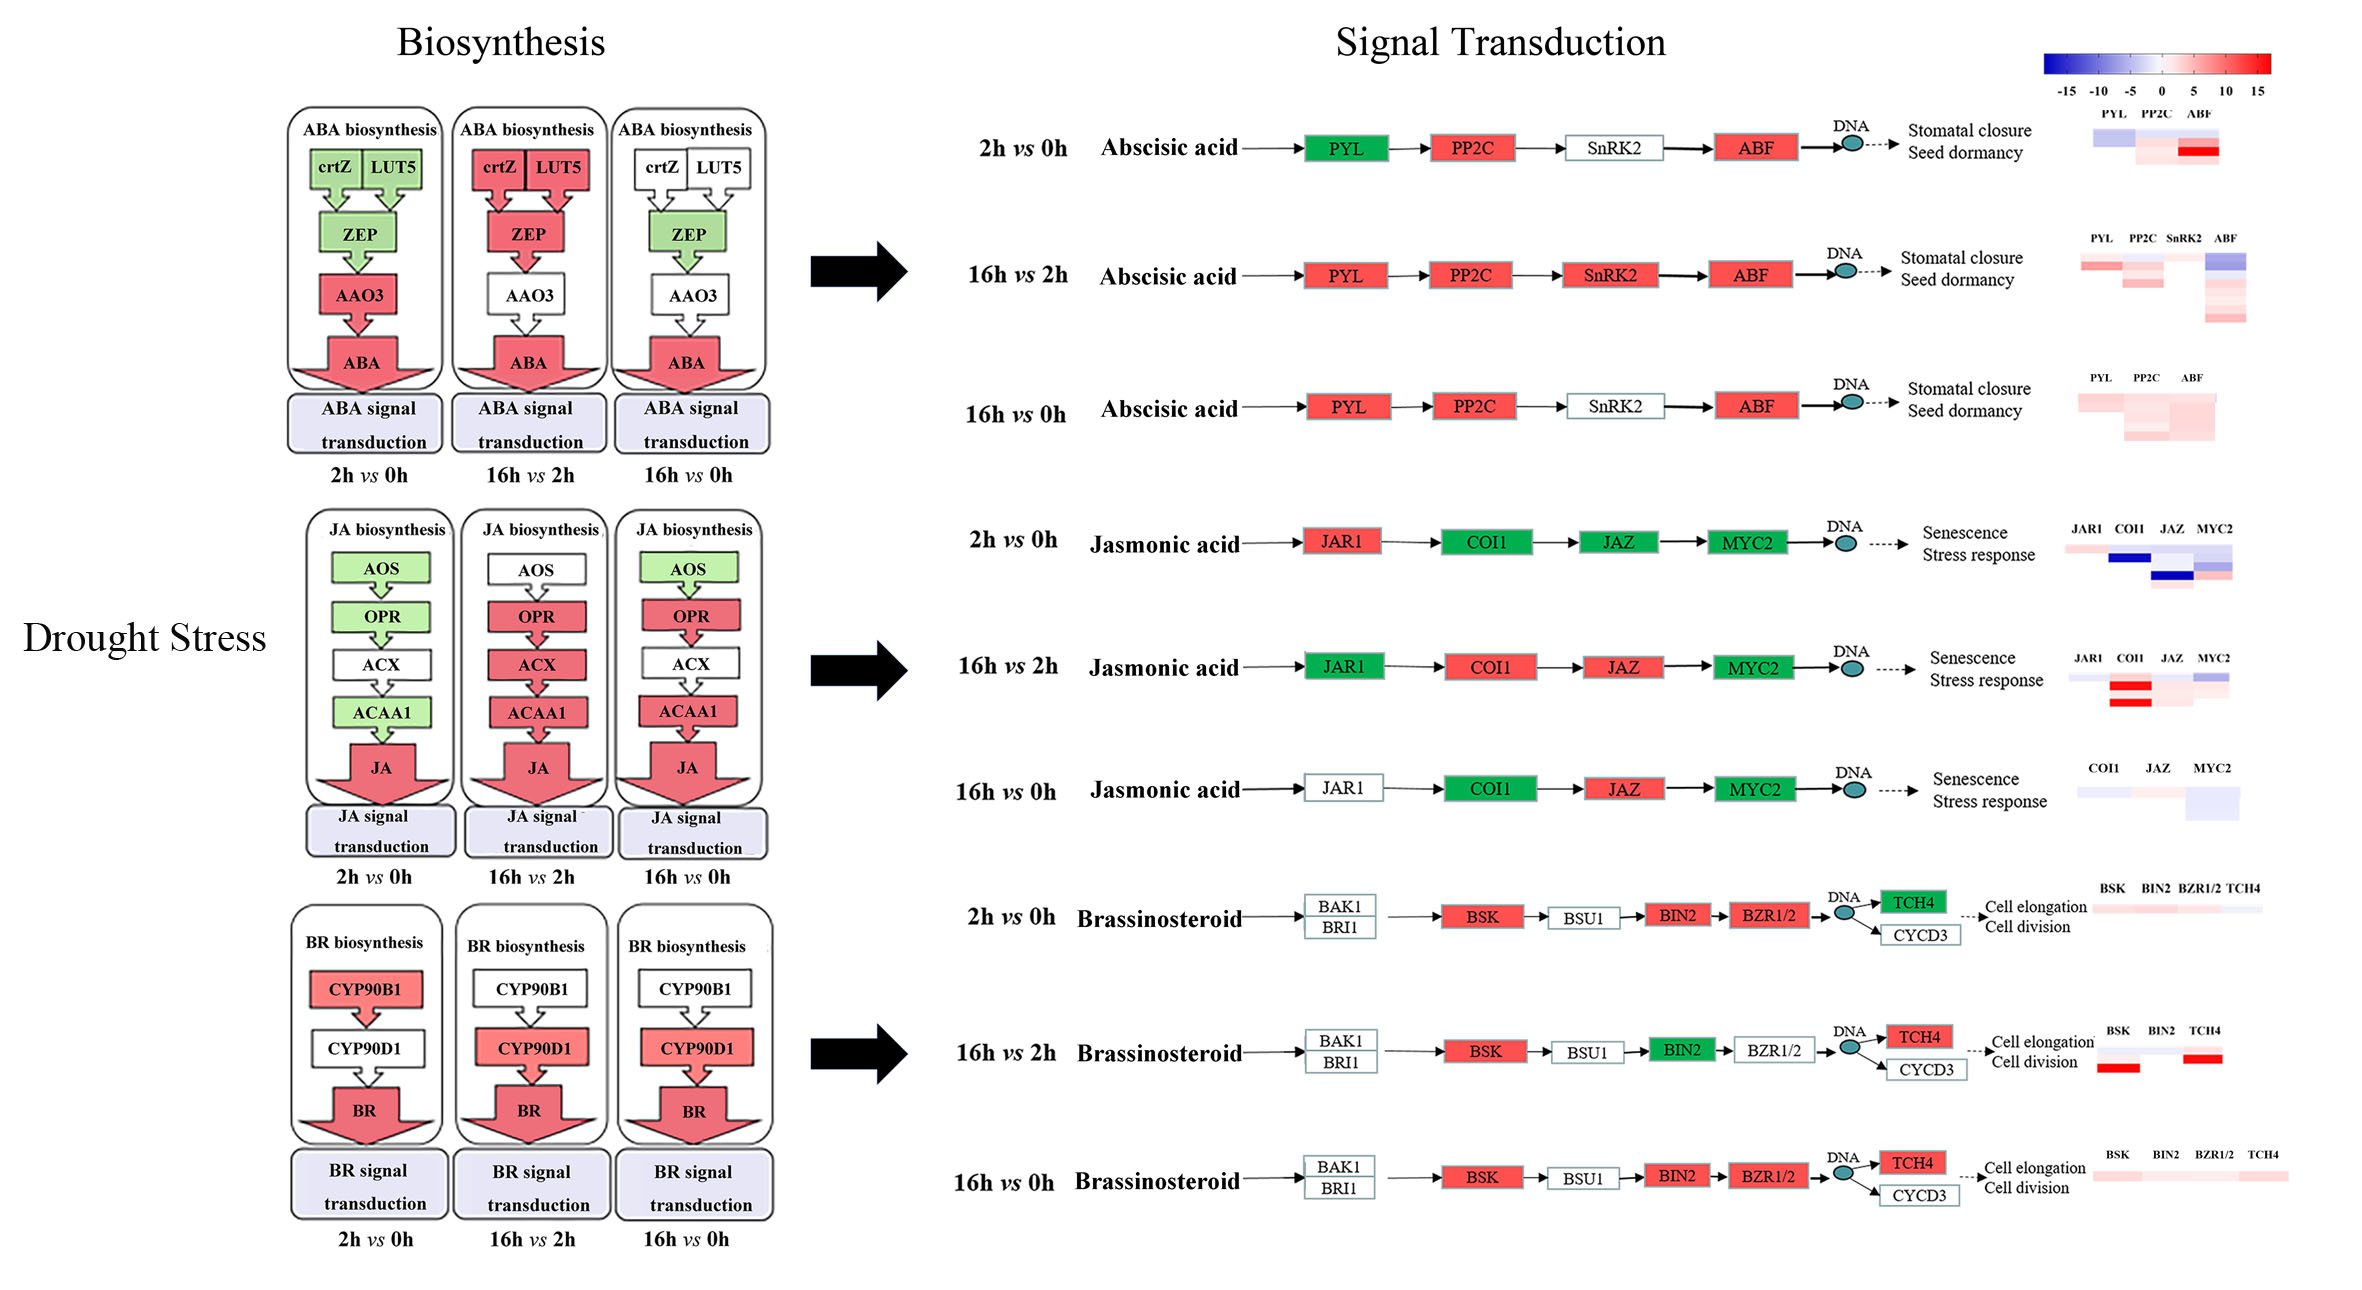
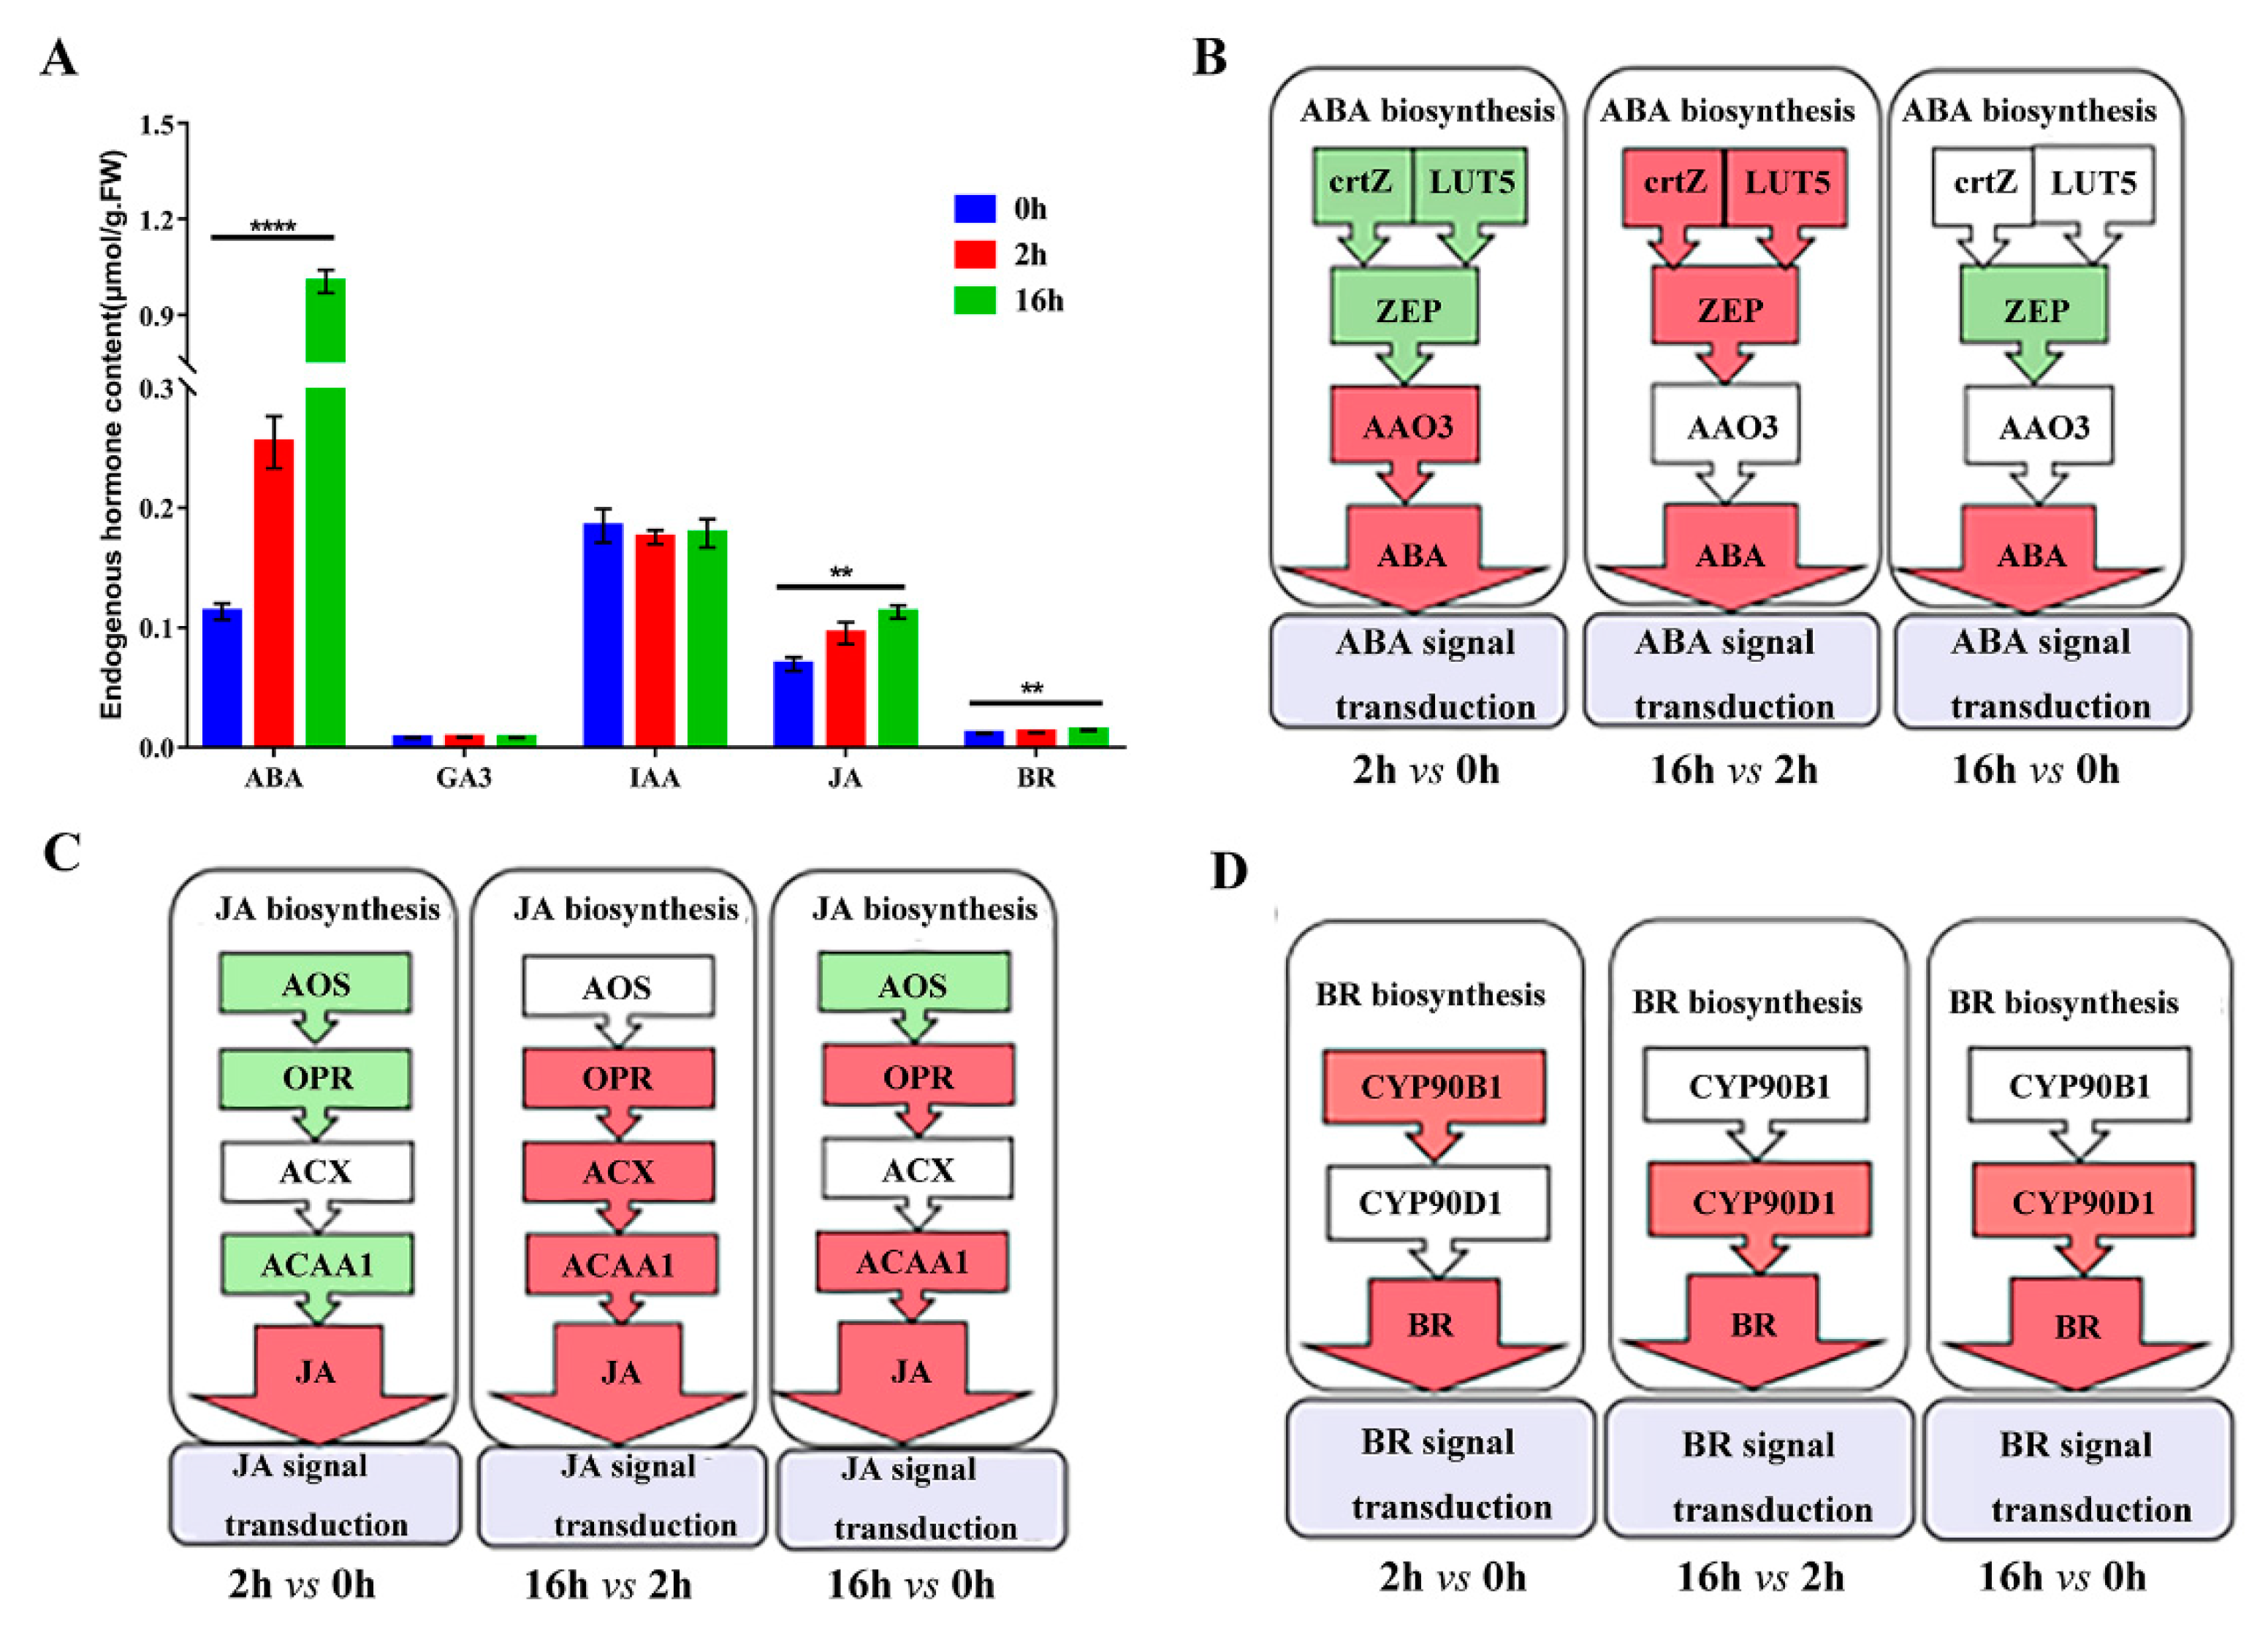
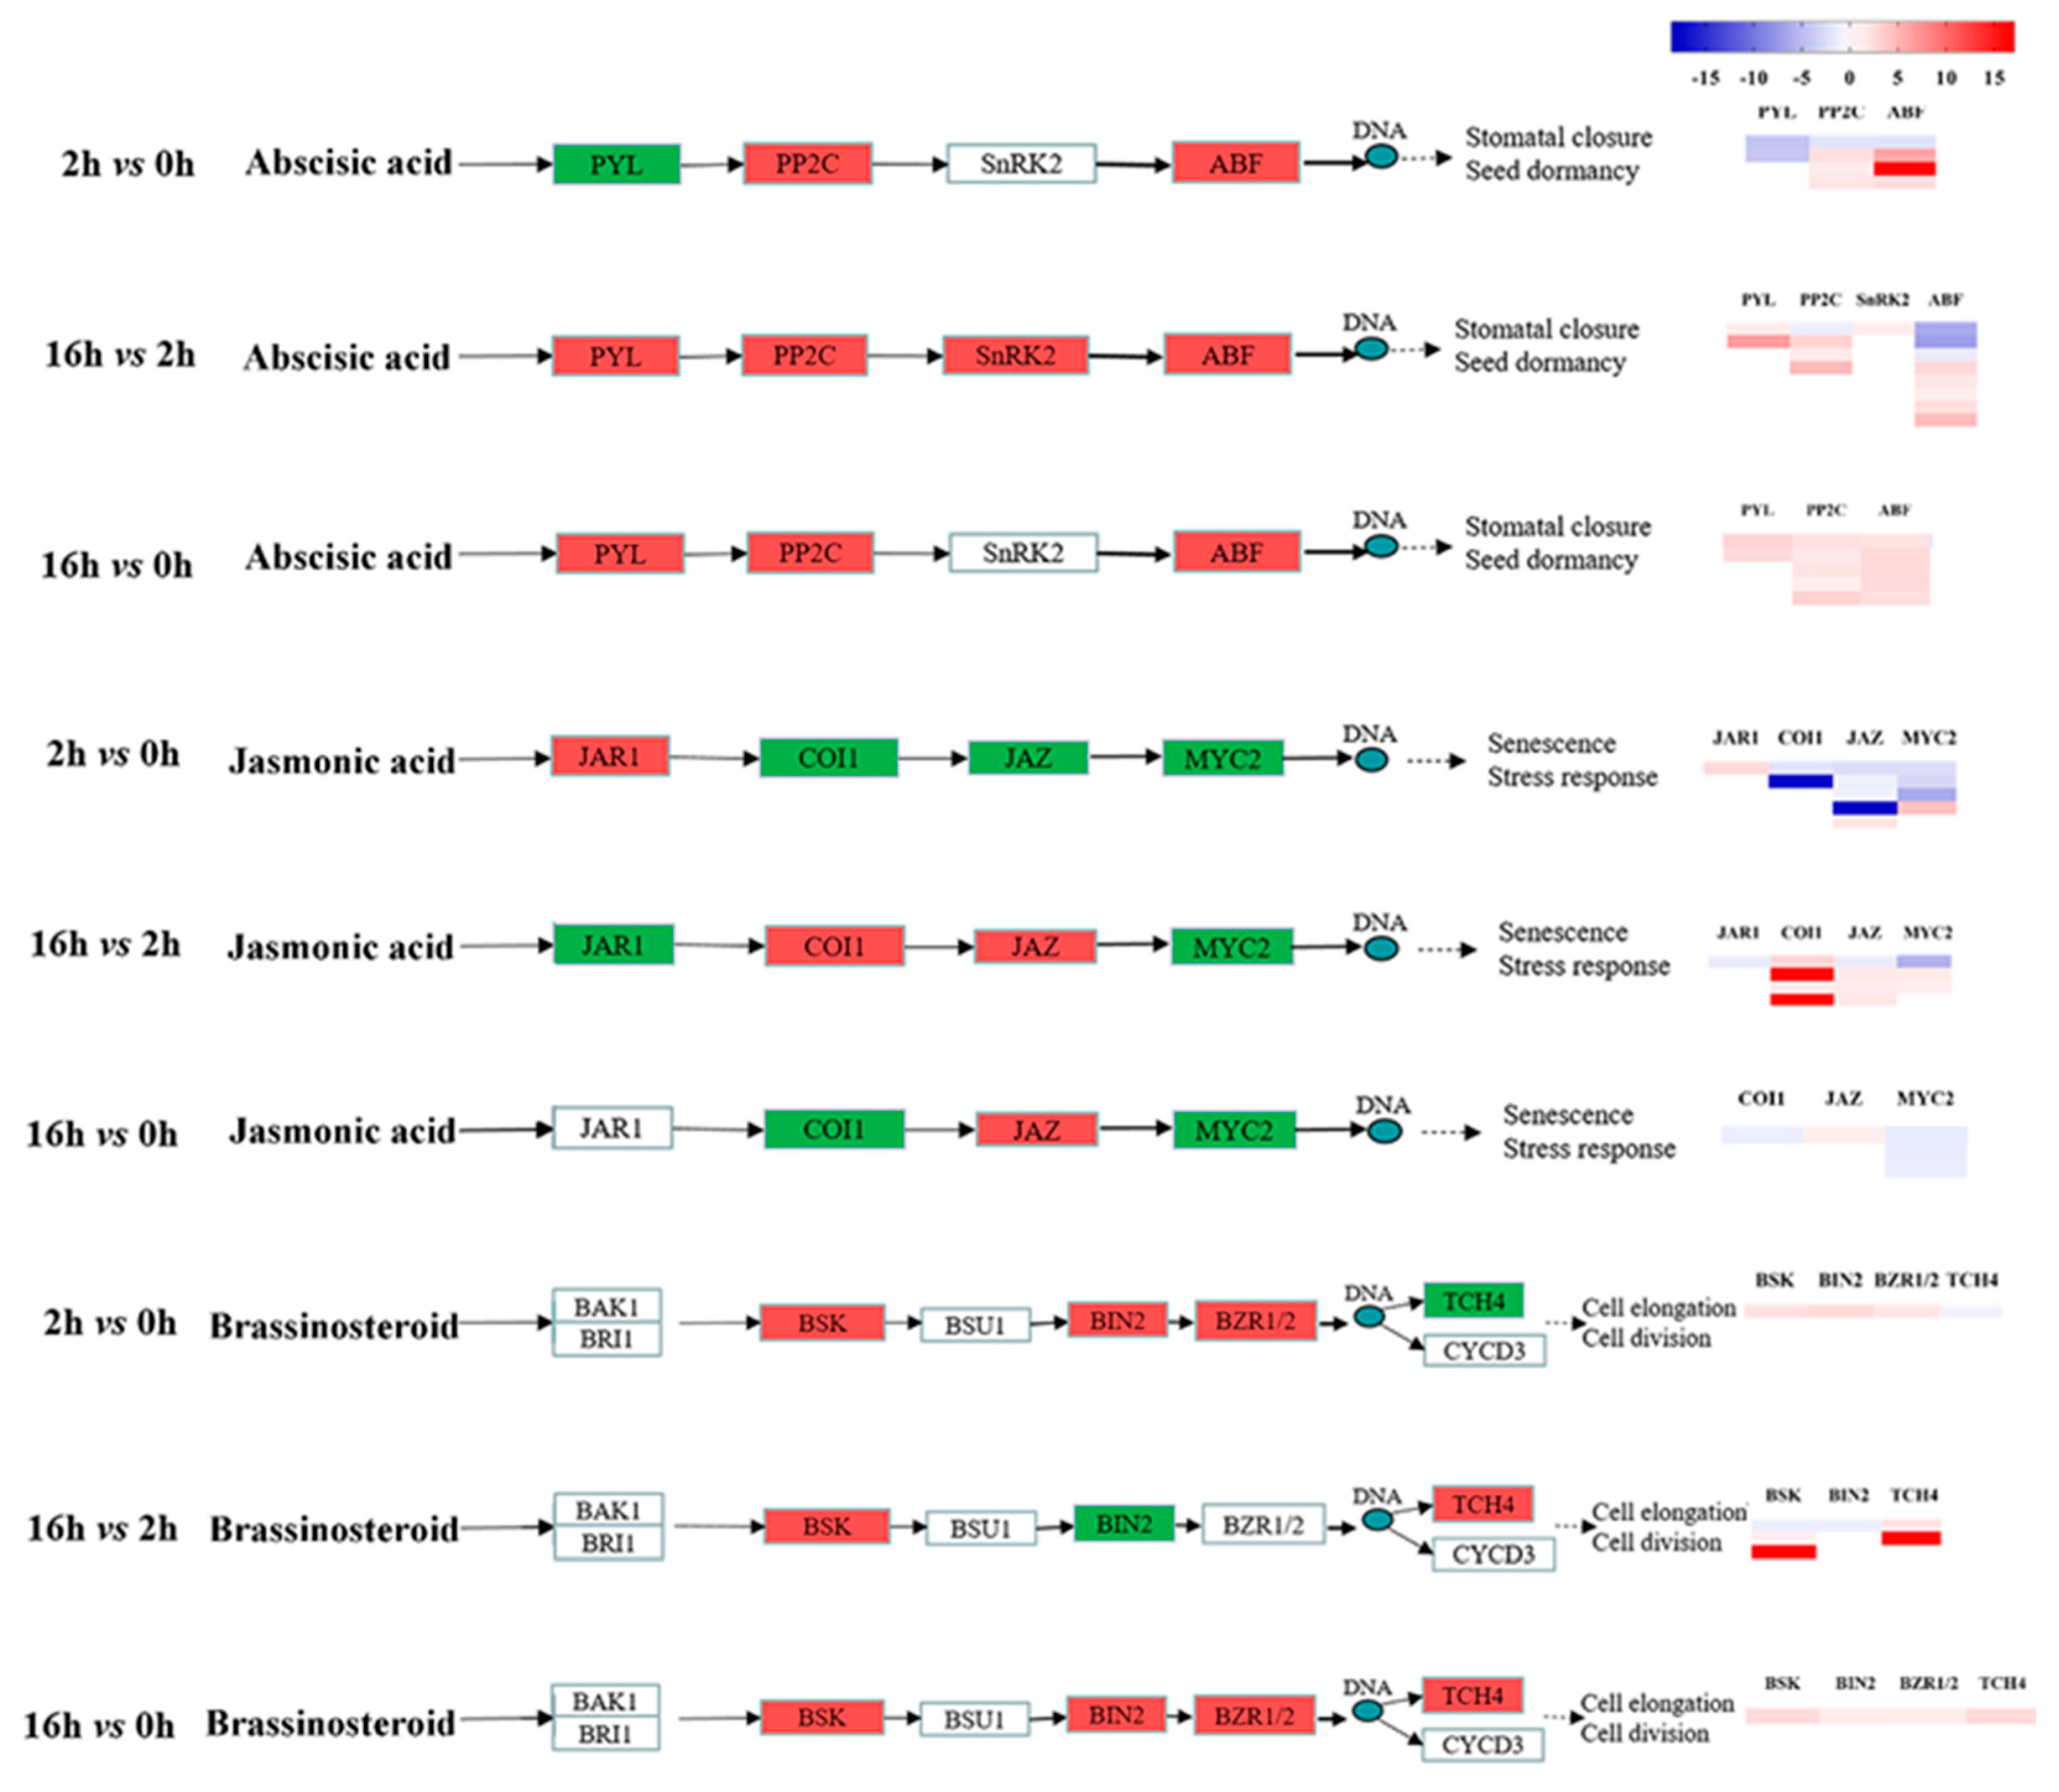
2.6. DEGs Related to Plant Hormone Biosynthesis and Signal Transduction

Our work demonstrated that the four DEGs encoding beta-carotene 3-hydroxylase (crtZ), beta-ring hydroxylase (LUT5), zeaxanthin epoxidase (ZEP) and abscisic-aldehyde oxidase (AAO3) were differentially expressed under drought stress in ABA biosynthesis (M00372) (Figure 7B). In 2 vs 0 h, DEGs encoding AAO3 were up-regulated, while those encoding crtZ, LUT5, and ZEP were down-regulated. In the 16 vs 2 h regime, DEGs encoding crtZ, LUT5, and ZEP were up-regulated. Genes encoding ABA receptor PYR/PYL family (PYL) were up-regulated in 16 vs 2 h and 16 vs 0 h regimes, and down-regulated in 2 vs 0 h regime (Figure 8). In 16 vs 2 h, SAPK8 of SnRK2 was up-regulated. Importantly, genes encoding protein phosphatase 2C (PP2C) and ABA-responsive element binding factor (ABF) were up-regulated during the whole drought stress period.
Jasmonic acid biosynthesis-related genes (M00113), encoding hydroperoxide dehydratase (AOS), 12-oxophytodienoic acid reductase (OPR), acyl-CoA oxidase (ACX), and acetyl-CoA acyltransferase 1 (ACAA1), were differentially expressed under drought stress (Figure 7C). In 16 vs 2 h, DEGs encoded OPR, ACX and ACAA1 were up-regulated. Two JA signal transduction-related genes encoding jasmonic acid-amino synthetase (JAR1) were significantly up-regulated after 2 h of drought stress, while the genes encoding coronatine-insensitive protein 1 (COI1) and jasmonate ZIM domain-containing protein (JAZ) were up-regulated. JAR1, COI1, and JAZ gene expressions were down-regulated in the 16 vs 2 h regime (Figure 8). MYC2 genes involved in the JA signaling pathway were also significantly down-regulated under drought treatment.
Two up-regulated DEGs were involved in brassinosteroid biosynthesis (Ko00905) (Figure 7D). The DEG encoded steroid 22-alpha-hydroxylase (CYP90B1, DWF4) was up-regulated in 2 vs 0 h, and those encoding 3-epi-6-deoxocathasterone 23-monooxygenase (CYP90C1, ROT3) were up-regulated in 16 vs 0 h and 16 vs 2 h regimes. BR signal transduction-related genes, encoding BR-signaling kinase (BSK), protein brassinosteroid insensitive 2 (BIN2), brassinosteroid resistant 1/2 (BZR1 and BZR2) and xyloglucosyl transferase TCH4 (TCH4), were significantly up-regulated in 16 vs 0 h regimes. BSK and TCH4 genes were obviously up-regulated in the 16 vs 2 h regime with a log2(fold change) of 17.26 and 16.72, respectively (Figure 8).

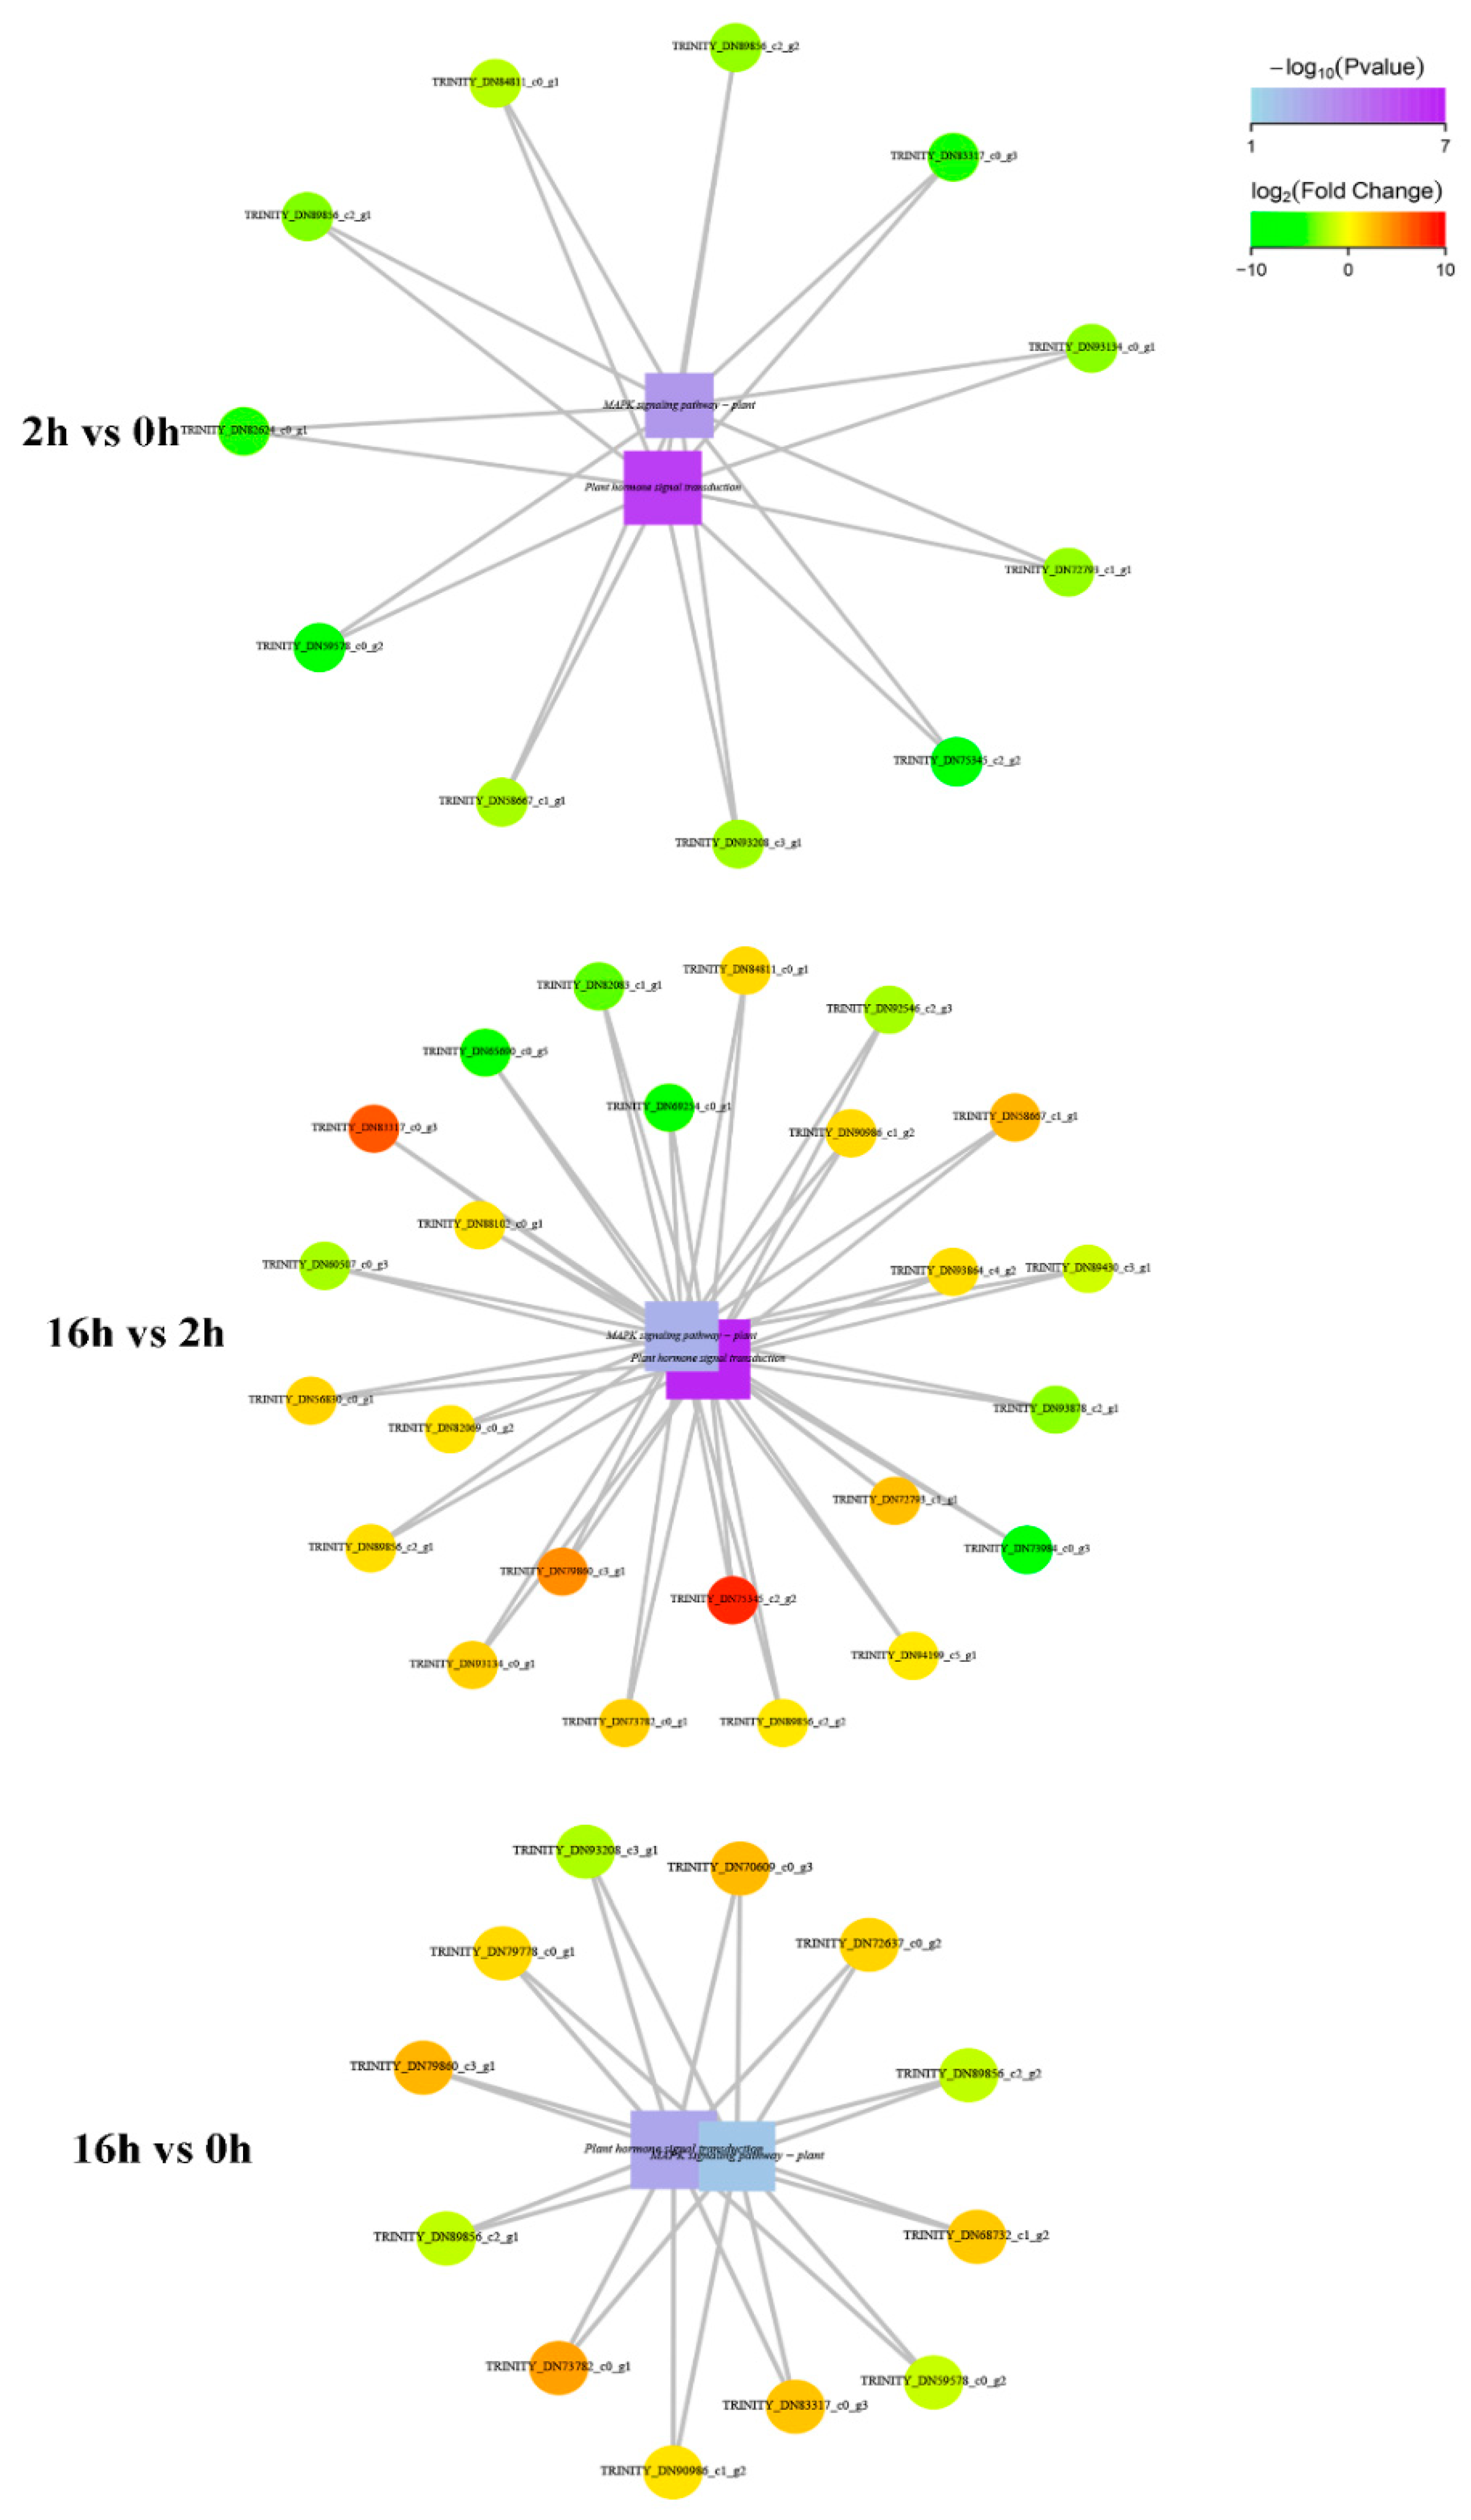
2.7. MAPK Signaling Transduction and Interaction with Hormonal Signaling Transduction

We found that the “Plant hormone signal transduction” and the “MAPK signaling pathway-plant” had significant interactions. Eleven down-regulated genes were involved in networks upon the preliminary stage, including EIN4 (TRINITY_DN75345_c2_g2) and MYC2 (TRINITY_DN59578_c0 _g2) (Figure 9). 24 DEGs were involved in networks interactions upon the persistent drought, including EIN4 (TRINITY_DN75345_c2_g2), PLY8 (TRINITY_DN83317_c0_g3), pathogenesis-related protein 1-5 (TRINITY_DN73984_c0_g3) and hypothetical protein F775 (TRINITY_DN69254 _c0_g1) (Figure 9). In addition, 12 DEGs were involved in 16 vs 0 h, including EIN4 (TRINITY_DN75345_c2_g2) and MYC2 (TRINITY_ DN59578_c0_g2) (Figure 9).

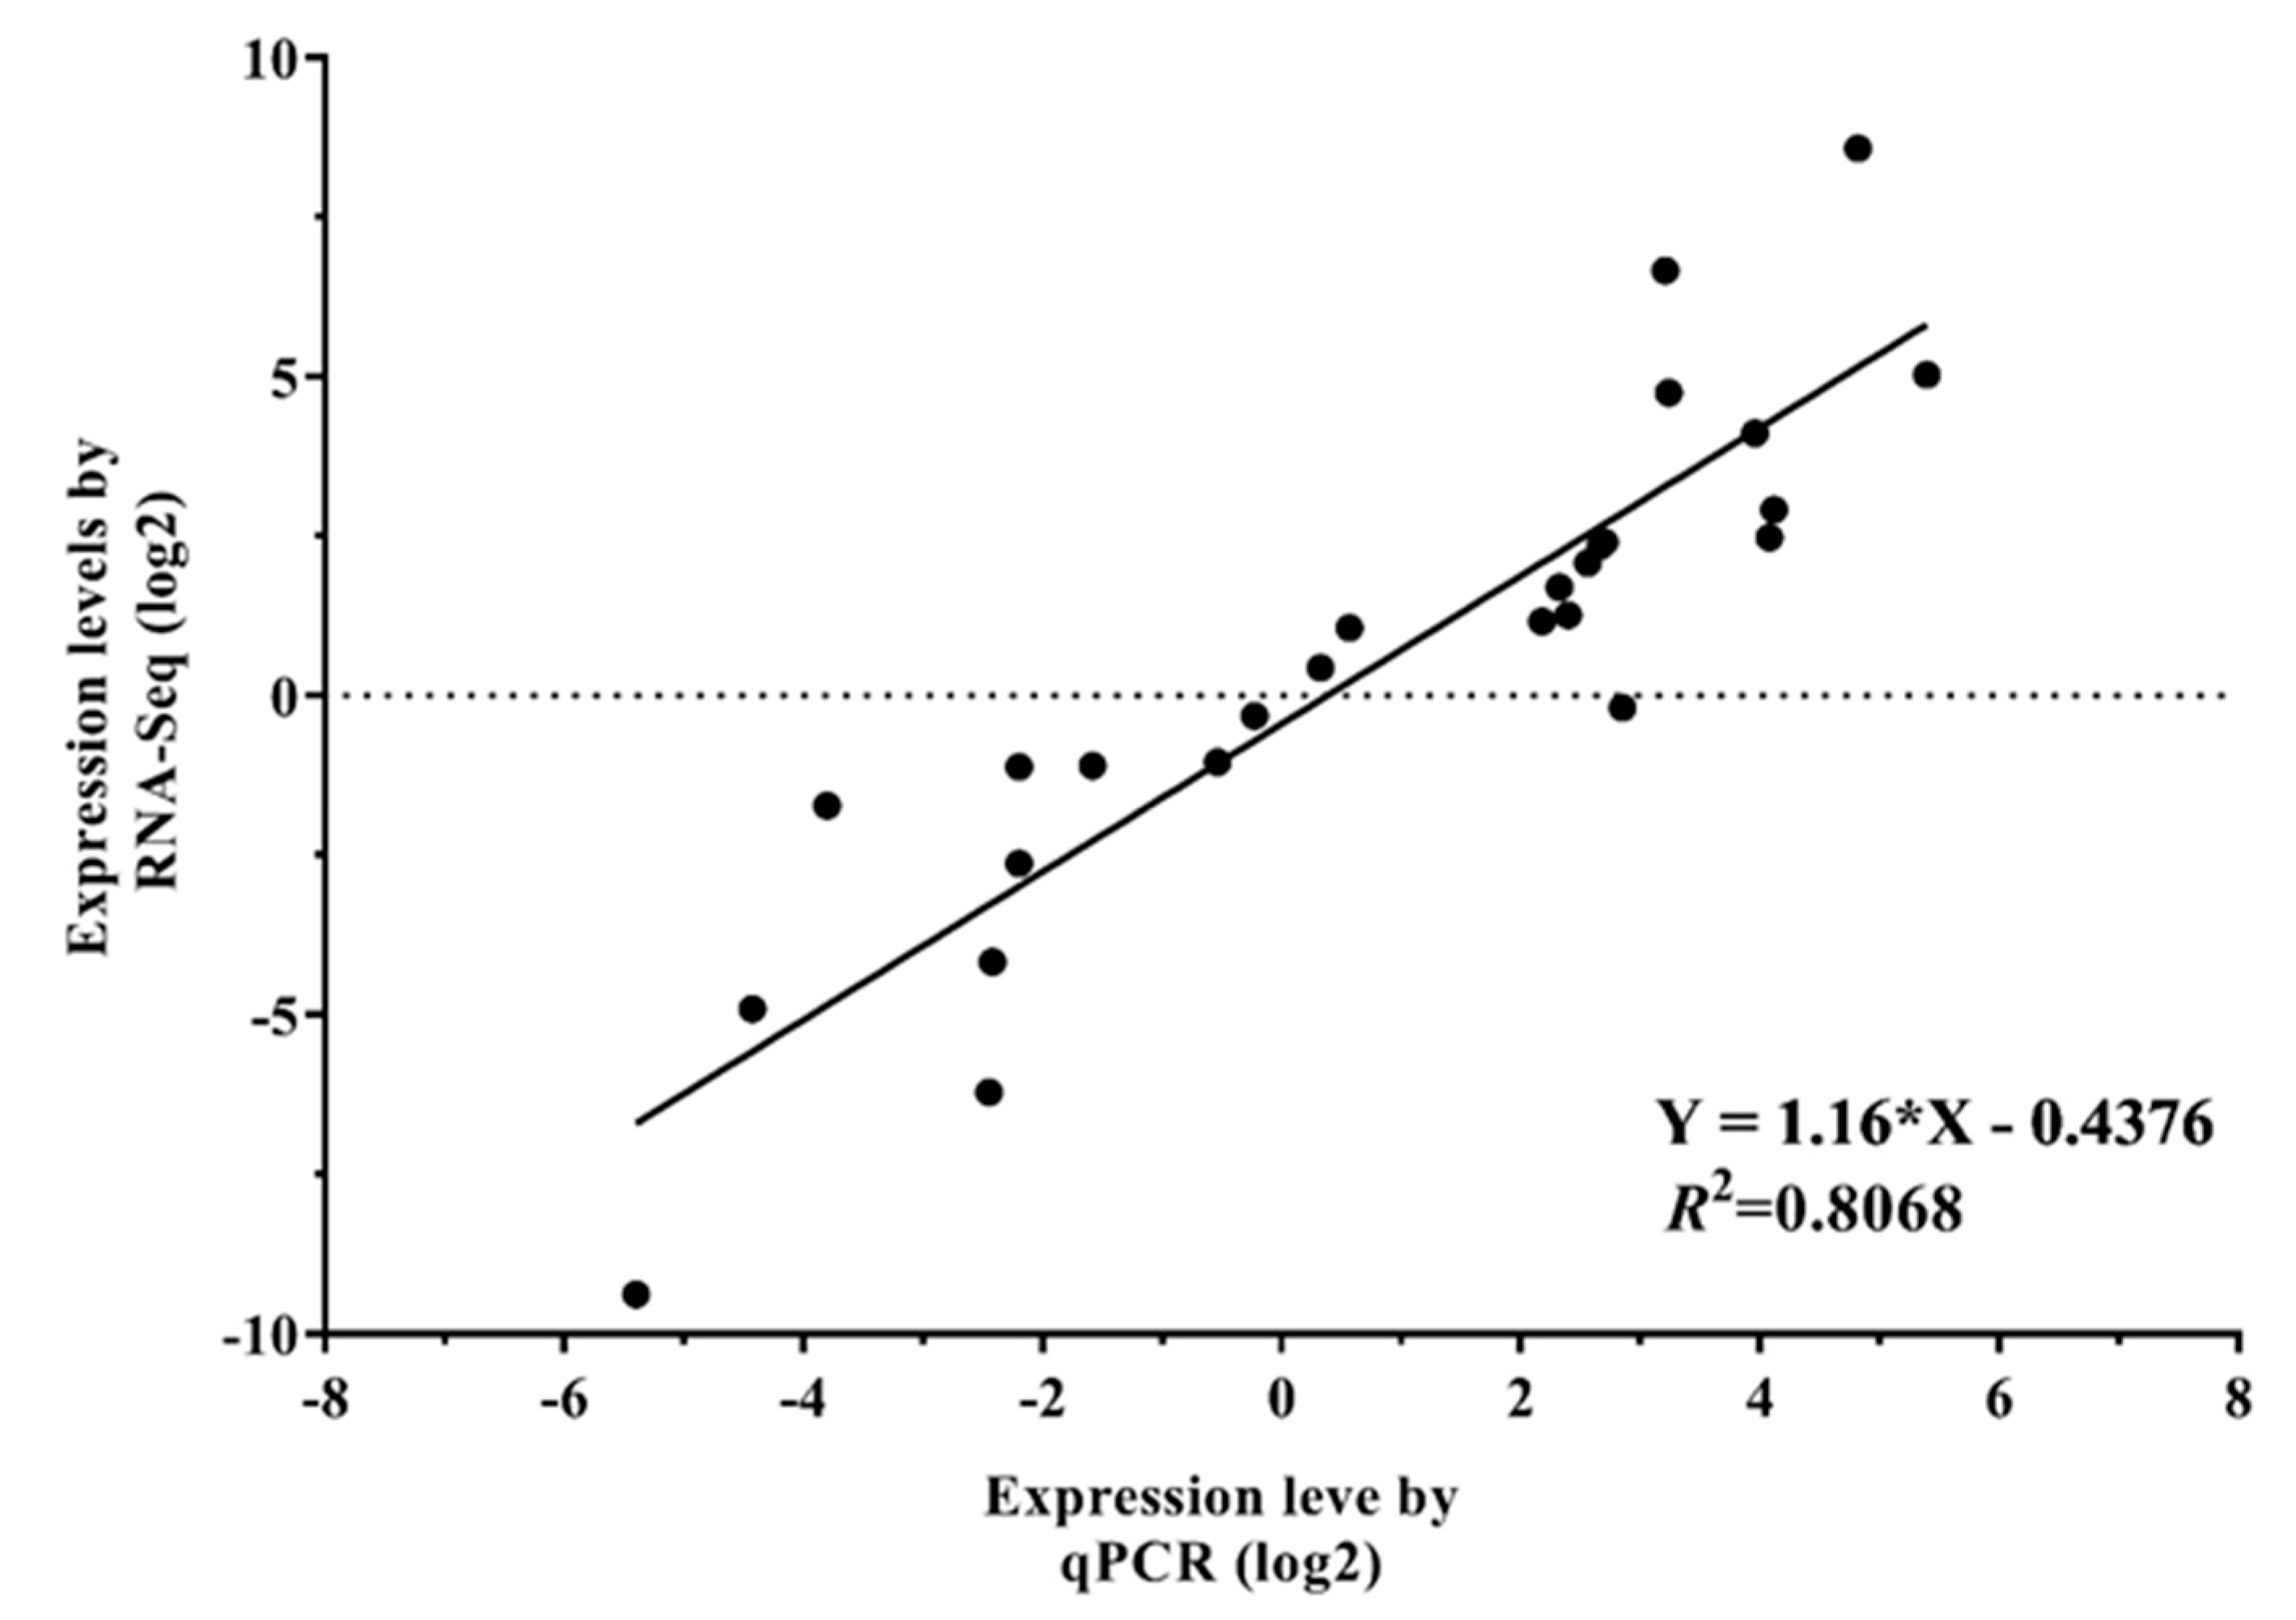
2.8. Validation of RNA-Seq Data by qRT-PCR

In order to confirm the results of RNA-Seq, 26 DEGs under drought stress were chosen for quantitative real-time PCR (Genes ID and primers were in Supplementary Table S5). As shown in Figure 10, the results from the qRT-PCR were highly correlated with the RNA-Seq results (y = 1.16 × X−0.4376; R2 = 0.8068; p Value < 0.0001), suggesting that accuracy and effectiveness of RNA-Seq results were valid for data analysis.

2.9. Effects of Drought Stress on Endogenous Hormones

The amount of ABA, JA and BR increased significantly with the extension of the drought period. The ABA content remarkably increased from 14.62 ng/g FW (0 h) to 67.35 ng/g FW (2 h), and finally reached 265.50 ng/g FW at 16 h. The content of JA increased by 37.26% at 2 h and 62.68% at 16 h (p < 0.01) after drought stress. Similar to the changing tendencies of ABA and JA, the content of BR also increased by 5.10% at 2 h and 22.16% at 16 h (p < 0.01) compared to the control group at 0 h (5.74 ng/g FW). GA3 and IAA contents did not significantly change under different drought periods (Figure 7A).

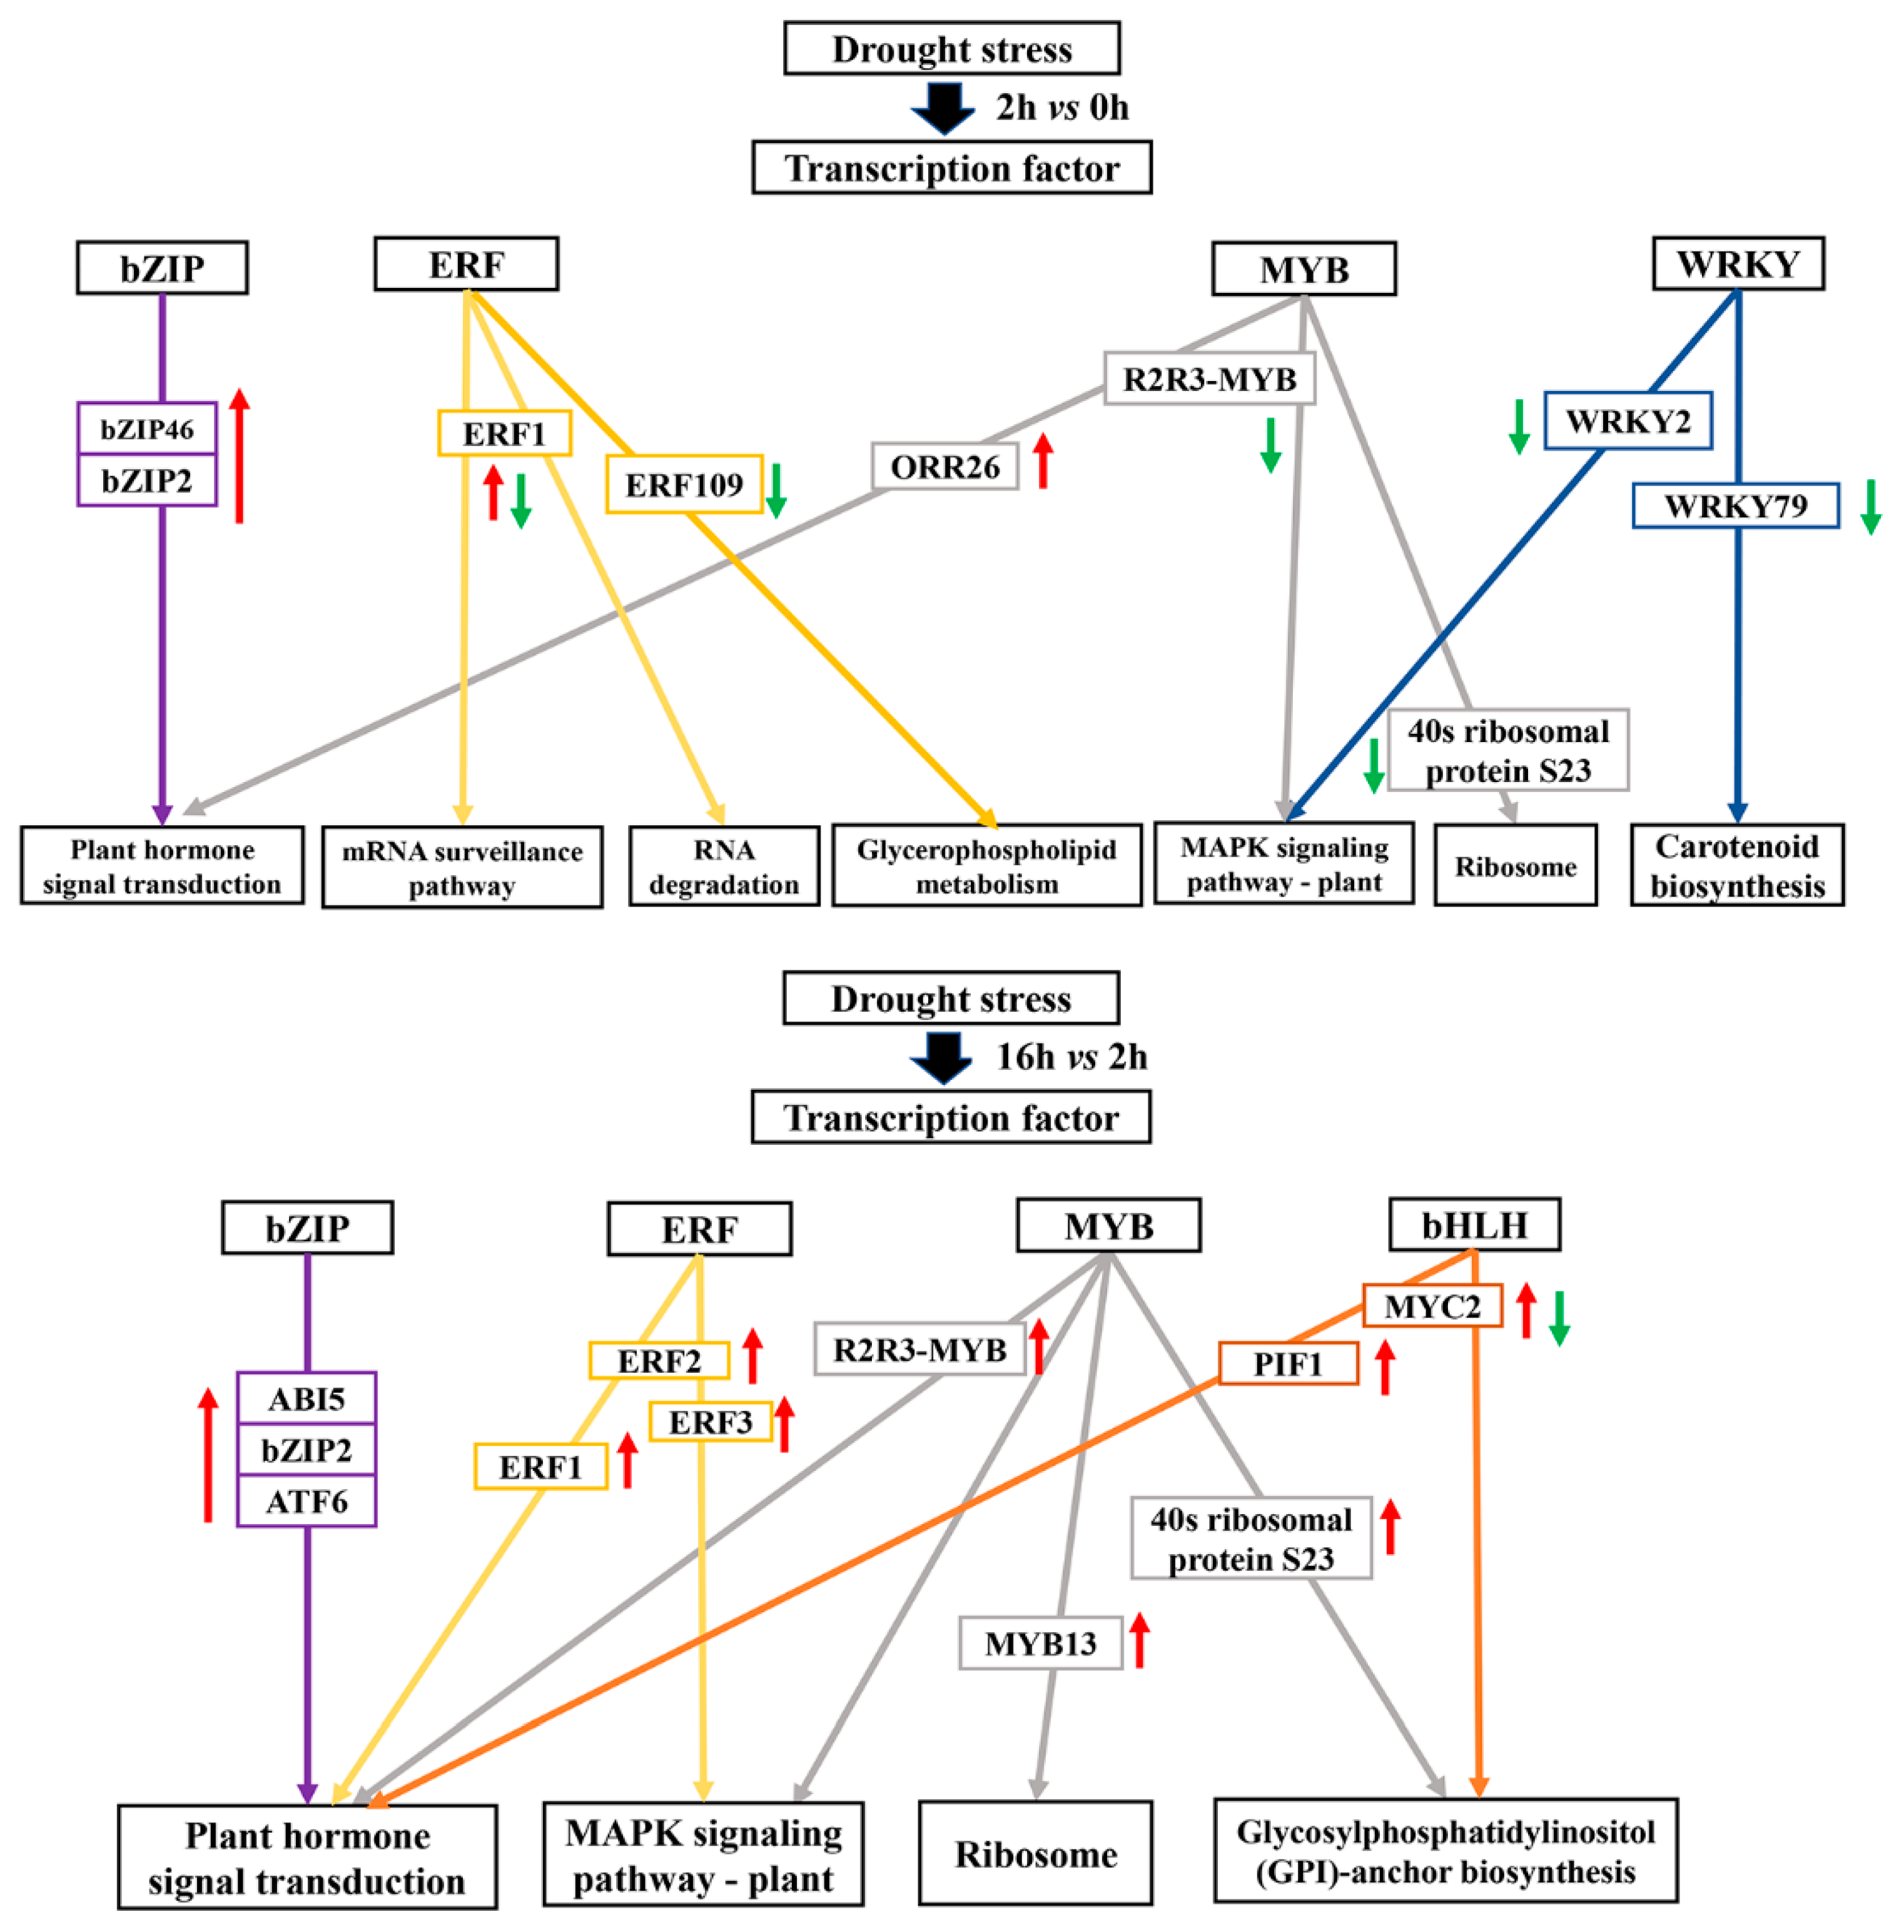
2.10. Transcription Factors Associated with Drought Tolerance

In our study, some DEGs were enriched in “transcription factor activity”. The expressions of transcription factors including bZIP, bHLH, WRKY, AP2/ERF, and MYB family genes significantly changed under drought stress (Figure 11). For instance, the drought-responsive genes of the bZIP family (bZIP46, bZIP2, and ABI5) were all up-regulated during the drought period. In addition, R2R3-MYB and ERF2 represented the key protein mediating crosstalk between “Plant hormone signal transduction” and “MAPK signaling pathway-plant” in response to drought. Furthermore, WRKY family genes were significantly induced in the early drought stage, and bHLH family genes were regulated during the extending drought period (Figure 11).

3. Discussion

To survive under abiotic stresses, plants often activate signaling cascades, resulting in the accumulation of endogenous hormones, and induction of defense responses [27]. Phytohormones play a key role in adaptation to the abiotic stresses by influencing growth and development. ABA is a well-documented stress-responsive hormone, while the other hormones such as JA and BRs have also been known as a key stress related hormones [28]. In the current study, contents of ABA, JA, and BRs increased during drought period, which is in accordance with previous studies [29,30].

3.1. Hormone Biosynthesis

Drought stress activated ABA biosynthesis and its accumulation which further aggravated plant drought tolerance, such as in tall fescue (Festuca arundinacea) [31]. Most of ABA biosynthetic pathway genes were up-regulated under water scarcity [32]. In the current study, most ABA biosynthetic pathway genes, except for AAO3, were down-regulated in the initial drought stage, whereas the ABA content was increased. This probably implied that the increase of ABA is due to the increased expression of AAO3. This result is consistent with the previous report on Arabidopsis (Arabidopsis thaliana) [33]. We recorded that PEG-induced drought stress decreased the expression of genes encoding crtZ, LUT5, and ZEP in the initial drought stage, but these genes increased in the extending drought period. The over-expression of ZEP genes confers increased drought tolerance [34]. Our results indicated that AAO3 may play roles in ABA accumulation in the initial drought stage, while crtZ, LUT5, and ZEP were important in the extending drought stage.
Endogenous JA increases drought tolerance of plants [35]. In our study, the expression of JA biosynthesis genes AOS, OPR, and ACAA1 decreased during the initial drought stage, while the expression of OPR, ACX, and ACAA1 increased during the extending drought stage (Figure 7). The drought-tolerant variety of chickpea (Cicer arietinum) responded better to drought stress with earlier activation of AOS and OPR [35]. Our result is inconsistent with this, probably due to the interspecific differences. ACAA1 belongs to multiple KEGG pathways, for instance, “Peroxisome” (ko04146). The decreased expression in the initial stage and increased expression in the extending stage of ACAA1 probably reflects the change of H2O2 with the time course. Increased expression of ACX can stimulate the scavenging of H2O2 [23]. In the present study, the extending drought stress probably generated H2O2 and up-regulated the expression of ACX.
BRs triggered antioxidant system and increased relative water content in Arabidopsis and Brachypodium distachyon [36,37]. Most BR biosynthetic genes belong to the CYP90 family, such as CYP90B1 (DWF4), CYP90C1(ROT3) and CYP90D1, catalyzing a rate-determining step in the BR biosynthetic pathways [38]. It has been reported that overexpression of CYP90B1 in rapeseed (Brassica napus) rapidly increased its drought tolerance [39]. We also found CYP90B1and CYP90D1 were up-regulated and may increase BR accumulation under drought stress.

3.2. Hormone Signaling Transduction

A change in ABA concentration leads to a signaling cascade which up-regulates genes encoding enzymes and proteins involved in drought response [40]. ABA-receptors PYL, PP2Cs, SnRK2, and ABF are pivotal players in the regulation of ABA signaling and abiotic stress responses [41]. Over-expression of PYL2, PYL8, PP2C, and ABF enhanced drought resistance of plants [42,43,44,45]. Different drought stress durations lead to diverse PYLs-activation to sense changes in endogenous ABA in plant [46]. In this study, PYL8 and PYL2 expression first decreased during the initial drought stage, and then increased in the prolonged drought stage, suggesting that these genes may have specific functions in different drought periods. Similar to our results, genes encoding PP2C4, PP2C6, and serine/threonine phosphatase 2C were highly up-regulated under drought stress in sorghum (Sorghum bicolor) and maize [47,48]. In this study, we found for the first time that the expression of PP2C51 notably increased in the extending drought stage and it may play an indispensable role in drought stress tolerance. SnRK2 has a vital role in mediating adaptation to drought stress [49]. SlSnRK2 was increased by dehydration in tomato (Solanum lycopersicum) leaf [50]. SnRK2.2, SnRK2.3, and SnRK2.6 were shown to phosphorylate ABF and positively control the ABF TFs under drought stress in Arabidopsis [51]. ABFs are the predominant transcription factors downstream of SnRK in ABA signalling in response to drought and NaCl stress [43]. In this study, SAPK8 of SnRK2 and ABF had higher expression in the 16 vs 2 h regime. This result is consistent with previous studies [40]. The number of ABFs in the extending drought stage was more than in the initial drought stage (Figure 8), suggesting that SnRK2 may perform crucial roles in the extending drought stage.
Expression of JAR1 of JA signaling genes decreased conspicuously under drought stress [52]. Here, we found that JAR1 expression was up-regulated in the early stage and decreased upon the persistent drought. In addition, the expression of COI1 involved in stomatal movements increased after drought treatment [53]. Over-expression of OsJAZ6 in rice resulted in advanced tolerance to mannitol stresses [54]. In this study, drought stages significantly affected the expression of COI1s and JAZs. They were inhibited in the initial stage but remarkably activated upon the prolonged drought. This result suggested that the prolonged drought tolerance may be related to the JA signaling pathway. MYC2 is a pivotal bHLH transcription factor regulating the expression of JA responsive genes and it could be repressed by the JAZ protein [55]. It has been reported that MYC2 transcription was prominently lower in response to dehydration stress [56]. Our results also showed that most of the DEGs encoding MYC2 family proteins had lower expression levels upon drought stress.
Members of the BSK family, such as BSK5, stimulated drought tolerance in Arabidopsis [57]. We identified that BSKs were progressively increased in drought periods, which indicated that they might be a positive regulator of drought tolerance. BIN2 is a negative regulator of BR biosynthesis and phosphorylates the transcription factor BZR1 [58]. In addition, it could be an interaction site with the ABA signaling pathway [59], which may play key roles in hormone crosstalk between ABA and BR. BIN2 was up-regulated in creeping bentgrass (Agrostis stolonifera) upon drought stress [60]. BZRs were induced under drought stress [61]. In this study, expression of BIN2 and BZR1 increased during the initial stage, and BIN2 probably acted as an active kinase of BZR1. The TCH4 gene of Arabidopsis was up-regulated in response to drought stress [62]. Our study had similar result that TCH4 was dramatically increased upon the prolonged drought. We proposed that BIN2 might play a role in activating BZR1 and BZR2 in the primary stage, while BSK and TCH4 might play crucial roles in response to prolonged drought stress.

3.3. MAPK Signaling Transduction and Interaction with Hormones

It has been demonstrated that MAPKs are involved in plant signal transduction in response to drought [63]. Our results showed that MAPKs participated in “MAPK signaling pathway-plant”, and were also involved in “Plant hormone signal transduction”, such as the ABA and ethylene signaling pathway. MAPKKK18 and MAPKK3 regulated drought stress by ABA signaling pathway in Arabidopsis, and MAPKKK18 played regulatory roles via downstream MAPKK3 [64]. Our findings indicated that MAPKKK18 and MPK2 were involved in ABA signaling in the initial drought stage, and MPK2 was activated in the extending drought period. It is possible that the increase in ABA concentration affected the MAPK signaling pathway regulation in drought stress. CTR1–AtMKK9–AtMPK3/6 mediated ethylene signaling in Arabidopsis [65]. In the present study, ETR–MKK9–MPK3-EIN3 mediated ethylene signaling in the initial drought stage, while ETR-CTR1-EIN3 mediated ethylene signaling in the extending drought period. ETR, CTR1 and EIN3 were activated in soybean under drought stress [66]; this result is similar to our findings. MKK3 and MPK6 were activated by JA in Arabidopsis [67]. The JA concentration did not increase during the drought period maybe because MKK3 and MPK6 were not activated in this research. The expressions of MKK5 and PR were also increased upon the prolonged drought period, probably due to the pathogen resistance (PR) activated by the gene MKK5 which was located upstream of the MAPK pathway. This interaction between MKK5 and PR was found previously in Arabidopsis [68]. Expression of some genes involved in the “MAPK signaling pathway-plant” was inhibited in the initial drought stage, such as MAPKKK17/18, MPK1/2, MKK9, MPK3, but was increased in the extending drought period, suggesting these MAPKs played key roles in a complete hormone signaling pathway in response to drought in KB.

3.4. Transcription Factors Associated with Drought Tolerance

It has been documented that members of bZIP, bHLH, WRKY, ERF and MYB transcription factor families confer drought tolerance [69,70]. In this study, the drought-responsive genes of bZIP46, bZIP2, and ABI5 were up-regulated during the drought period. This result is consistent with a previous study in rice [71]. The AP2/ERF superfamily is known to be involved in response to drought [72]. OsERF109 negatively affects ethylene biosynthesis and drought tolerance in rice [73]. Similar to these reports, we found that ERF109 was down-regulated in the initial drought stage. However, the expression levels of the ERF family were significantly different in different drought periods. “mRNA surveillance pathway”, “RNA degradation” and “Glycerophospholipid metabolism” of ERFs were mainly affected in the preliminary drought stage, and “Plant hormone signal transduction” and “MAPK signaling pathway-plant” of ERFs were highly expressed in the extending drought stage. The majority of MYB proteins belong to the R2R3-MYB, playing key roles in response to drought stress [74]. Interestingly, it has been confirmed that OsMYB59 plays a key role in the osmotic stress response [25], which is similar to our findings. It has been documented that one AtWRKY40 homologue and two AtWRKY33 homologues showed a rapid and transient induced expression pattern under drought stress [75]. Our results are consistent. The information of these transcription factors will be useful for studies on molecular adaptations to drought stress in Poaceae turfgrass in the future.

4. Materials and Methods

4.1. Plant Materials and Treatment

KB (Poa pratensis “Midnight Ⅱ”) was used in this study. Plants were grown in plastic pots with a mix of sand and peat (1/1, v/v) in the greenhouse, with a light period of 13/11 h (day/night), relative humidity of 65 ± 5%, average light intensity of 400 µmol m−2 s−1, and temperatures of 25/15 °C (day/night). When the seedlings were four months old, they were moved to a triangular flask for hydroponics and 1/2 strength Hoagland”s solution was used to cultivate KB seedlings. After 3 weeks, 10% PEG6000 dissolved in 1/2 strength Hoagland”s solution was used to simulate drought stress. Fresh and healthy leaf samples with three biological replicates for each treatment were taken at 0 h (15:00), 2 h (17:00) and 16 h (7:00 of the second day) after drought stress.

4.2. RNA Extraction, cDNA Library Construction and Sequencing

RNA of fresh leaf samples at 0 h, 2 h, and 16 h after PEG6000 treatment was extracted using NEBNext® Ultra™RNA Library Prep Kit for Illumina® (NEB, Ipswich, MA, USA), and tested for quality with Qubit™ RNA HS Assay Kit (Invitrogen™, Carlsbad, CA, USA). Transcriptome library for sequencing was constructed according to the NEBNext mRNA Library Prep Master Mix Set for Illumina and NEBNext Multiplex Oligos for Illumina. The libraries were sequenced via Illumina HiSeq™2500.

4.3. De novo Assembly

In order to ensure the quality of information analysis, the original data were filtered to obtain clean data. Trinity was used to assemble the clean data via de novo into transcripts [76]. The ID number of the transcript was named as TRINITY_DNa_cX_gY. For the redundant transcript obtained by Trinity assembly, the longest transcript was extracted for each unigene, which was used as the reference sequence for subsequent analysis.

4.4. Gene Function Annotation

Unigene annotation was conducted via NCBI Blast+ for CDD, KOG, COG, NR, NT, PFAM, Swissprot, and TrEMBL notes. Homology was based on BLASTx comparisons to the non-redundant database (E < 10−5). Gene Ontology (GO) functional annotation was based on the protein annotation results of Swissprot and TrEMBL. GO mapping, annotation, and enrichment tests were conducted using BLAST2GO Pro v3.0 following default parameters [77]. GO annotation was obtained from UniProt annotation information. KAAS and KEGG automatic annotation servers were used for KEGG annotation [78].

4.5. Quantification of Gene Expression Levels

The gene expression level was estimated by counting the sequencing sequences (reads) located in the regions of the genome or gene exons. The reads count was not only proportional to the actual expression level of genes but also positively correlated with gene length and sequencing depth. In order to compare the estimated gene expression levels of different genes, the concept of Transcripts Per Million (TPM) was introduced [79,80]. The gene expression levels among 0 h, 2 h and 16 h were compared, and differentially expressed genes (DEGs) were identified by DESeq (q Value < 0.05 and |log2(fold change)| > 1).

4.6. Gene Ontology and KEGG Pathway Enrichment Analysis

GO and KEGG were employed to identify and analyze significantly enriched functional category and metabolic pathways in DEGs. The DEGs were classified by GO (http:// www.geneontology.org/) and the GO terms of the three categories (Biological Process, Cellular Component, and Molecular Function) were assessed. The enriched pathways of DEGs were statistically significantly mapped and noted via the KEGG database (q Value < 0.05). R’s iGraph package was used to perform functional enrichment correlation analysis [81].

4.7. Validation of Transcripts by Quantitative Real-Time PCR (qRT-PCR)

Twenty-six DEGs possessing potential functional roles in regulating drought tolerance of KB were selected for validation using qRT-PCR. Total RNA was extracted from leaf using the RNAprep pure plant kit (Tiangen, Beijing, China). The qRT-PCR was performed with ABI7500 in 20 μL reactions, with 2 μL of cDNA, 2 μM of each primer, and 10 μL of TB Green Premix Ex Taq II (Takara, Japan). The thermal cycling conditions were as follows: 95 °C for 30 s, 40 cycles of 5 s at 95 °C, and 30 s at 60 °C. The relative gene expression of qRT-PCR was calculated using the 2ΔΔCt method [82]. Scattering maps were generated from the log2 (fold change) of RNA-seq and qRT-PCR results.

4.8. Measurement of Endogenous Hormones

The contents of endogenous hormones of the leaf samples of KB were determined using the Enzyme-Linked Immunosorbent Assay (ELISA) technique. The method of extraction and determination of phytohormones, including gibberellin (GA), indole-3-acetic acid (IAA), ABA, JA, and BR, were measured as described by Yang et al., Zhao et al., and Wang et al. [83,84,85]. Three biological replicates were used for measurement.

5. Conclusions

In this study, transcriptome-level changes in KB upon short- and long-term drought stress were analyzed and genes related to drought stress responses were identified. KEGG pathway enrichment analysis of DEGs indicated that drought stress changed numerous aspects of metabolism, signaling, and transportation, such as “Plant hormone signal transduction”, “MAPK signaling pathway-Plant” “Starch and sucrose metabolism”, and “Arginine and proline metabolism”. Furthermore, the transcriptomic comparison together with hormone analysis revealed that drought stress led to hormone accumulation and then resulted in plant hormone signal transduction alterations. Expressions of genes related to hormone biosynthesis and hormone signal transduction were changed. Importantly, we suggest that SAPK8, BSK, and ABF were positive regulators, and MYC2 was a negative regulator in drought periods. PYL, TCH4, COI1, and JAZ play an important role in drought duration. Transcription factors including bZIP, bHLH, WRKY, ERF and MYB family genes were also significantly enriched upon drought stress. The specific DEGs encoding functional proteins, kinase and transcription factors could be valuable information for genetic manipulation to promote drought tolerance of KB in the future.

Supplementary Materials

Supplementary materials can be found at https://0-www-mdpi-com.brum.beds.ac.uk/1422-0067/20/6/1289/s1. Table S1. Summary statistics of the Kentucky Bluegrass transcriptome assemblies. Table S2. Statistics of unigene and transcript length. Table S3. Unigenes annotated in different databases. Table S4. Differentially expressed genes (DEGs) in Kentucky Bluegrass under drought stress. Table S5. The primers used for qRT-PCR. Figure S1. Species distribution of all the unigene sequences. Figure S2. The repeatability of the libraries was evaluated. Figure S3. Cluster analysis of samples. Figure S4. Comparative analysis of differentially expressed genes (DEGs) in the drought period.

Data Availability Statement

The raw data of the RNA-Seq have been submitted to NCBI Sequence Read Archive (SRA) under BioProject accession PRJNA517968.

Author Contributions

Y.C., L.Z., and Y.C. conceived and designed the experiments; Y.C., Y.J., H.S., and Z.S. performed the RNA-Seq and data analysis; Y.J., F.X., and H.S. performed qRT-PCR measurement and analysis; Y.C., L.Z., and Y.C. wrote the paper.

Funding

This study was financially supported by the National Natural Science Foundation of China (No. 31501785, 31701958, and 31772354), Natural Science Foundation of Heilongjiang Province (No. QC2017026), University Nursing Program for Young Scholars with Creative Talents in Heilongjiang Province (UNPYSCT-2017023 and UNPYSCT-2018102) and “Academic backbone” Project of Northeast Agricultural University (18XG07).

Conflicts of Interest

The authors declare no conflict of interest.

References

  1. Xu, L.; Han, L.; Huang, B. Antioxidant enzyme activities and gene expression patterns in leaves of Kentucky bluegrass in response to drought and post-drought recovery. J. Am. Soc. Hortic. Sci. 2011, 136, 247–255. [Google Scholar] [CrossRef]
  2. Matzk, F.; Prodanovic, S.; Bäumlein, H.; Schubert, I. The inheritance of apomixis in Poa pratensis confirms a five locus model with differences in gene expressivity and penetrance. Plant Cell 2005, 17, 13–24. [Google Scholar] [CrossRef]
  3. Shanker, A.K.; Maheswari, M.; Yadav, S.K.; Desai, S.; Bhanu, D.; Attal, N.B.; Venkateswarlu, B. Drought stress responses in crops. Funct. Integr. Genom. 2014, 14, 11–22. [Google Scholar] [CrossRef] [PubMed]
  4. Jiang, Y.; Liu, H.; Cline, V. Correlations of leaf relative water content, canopy temperature, and spectral reflectance in perennial ryegrass under water deficit conditions. Hortscience 2009, 44, 459–462. [Google Scholar] [CrossRef]
  5. Zhou, Y.; Lambrides, C.J.; Kearns, R.; Ye, C.; Fukai, S. Water use, water use efficiency and drought resistance among warm-season turfgrasses in shallow soil profiles. Funct. Plant Biol. 2012, 39, 116–125. [Google Scholar] [CrossRef]
  6. Hu, L.; Wang, Z.; Huang, B. Effects of cytokinin and potassium on stomatal and photosynthetic recovery of Kentucky bluegrass from drought stress. Crop Sci. 2013, 53, 221–231. [Google Scholar] [CrossRef]
  7. Bazargani, M.M.; Sarhadi, E.; Bushehri, A.A.S.; Matros, A.; Mock, H.P.; Naghavi, M.R.; Hajihoseini, V.; Mardia, M.; Hajirezaei, M.R.; Moradid, F.; et al. A proteomics view on the role of drought-induced senescence and oxidative stress defense in enhanced stem reserves remobilization in wheat. J. Proteom. 2011, 74, 1959–1973. [Google Scholar] [CrossRef] [PubMed]
  8. Shah, S.; Chen, Y.J.; Shah, F.; Saddam, H.; Li, N.; Li, X.; Safa, A.A.F.E.A. Silicate application increases the photosynthesis and its associated metabolic activities in Kentucky bluegrass under drought stress and post-drought recovery. Environ. Sci. Pollut. Res. 2016, 23, 17647–17655. [Google Scholar]
  9. Shah, S.; Fahad, S.; Chen, Y.; Ihsan, M.Z.; Hammad, H.M.; Nasim, W.; Amanullah, J.; Muhammad, A.; Hesham, A. Effects of nitrogen supply on water stress and recovery mechanisms in Kentucky bluegrass plants. Front. Plant Sci. 2017, 8, 983. [Google Scholar]
  10. Krishnan, S.; Merewitz, E.B. Drought stress and trinexapac-ethyl modify phytohormone content within Kentucky bluegrass leaves. J. Plant Growth Regul. 2015, 34, 1–12. [Google Scholar] [CrossRef]
  11. Teng, K.; Li, J.; Liu, L.; Han, Y.; Du, Y.; Zhang, J. Exogenous ABA induces drought tolerance in upland rice: The role of chloroplast and ABA biosynthesis-related gene expression on photosystem II during PEG stress. Acta Physiol. Plant. 2014, 36, 2219–2227. [Google Scholar] [CrossRef]
  12. Li, J.; Li, Y.; Yin, Z.; Jiang, J.; Zhang, M.; Guo, X.; Ye, Z.; Zhao, Y.; Xiong, H.; Zhang, Z.; et al. OsASR5 enhances drought tolerance through a stomatal closure pathway associated with ABA and H2O2 signaling in rice. Plant Biotechnol. J. 2017, 15, 183–196. [Google Scholar] [CrossRef]
  13. Bian, S.; Jiang, Y. Reactive oxygen species, antioxidant enzyme activities and gene expression patterns in leaves and roots of Kentucky bluegrass in response to drought stress and recovery. Sci. Hortic. 2009, 120, 264–270. [Google Scholar] [CrossRef]
  14. Qin, D.D.; Wu, H.Y.; Peng, H.R.; Yao, Y.Y.; Ni, Z.F.; Li, Z.X.; Zhou, C.L.; Sun, Q.X. Heat stress-responsive transcriptome analysis in heat susceptible and tolerant wheat (Triticum aestivum L.) by using Wheat Genome Array. BMC Genom. 2008, 9, 432. [Google Scholar] [CrossRef]
  15. Lenka, S.K.; Katiyar, A.; Chinnusamy, V.; Bansal, K.C. Comparative analysis of drought-responsive transcriptome in indica rice genotypes with contrasting drought tolerance. Plant Biotechnol. J. 2015, 9, 315–327. [Google Scholar] [CrossRef] [PubMed]
  16. Min, H.; Chen, C.; Wei, S.; Shang, X.; Sun, M.; Xia, R. Identification of drought-tolerant mechanisms in Maize seedlings based on transcriptome analysis of recombination inbred lines. Front. Plant Sci. 2016, 7, 1080. [Google Scholar] [CrossRef]
  17. Surget-Groba, Y.; Montoya-Burgos, J. Optimization of de novo transcriptome assembly from next-generation sequencing data. Genome Res. 2010, 20, 1432–1440. [Google Scholar] [CrossRef] [Green Version]
  18. Qin, F.; Kakimoto, M.; Sakuma, Y.; Maruyama, K.; Osakabe, Y.; Tran, L.S. Regulation and functional analysis of ZmDREB2A in response to drought and heat stresses in Zea mays L. Plant J. 2010, 50, 54–69. [Google Scholar] [CrossRef]
  19. Bechtold, U.; Albihlal, W.S.; Lawson, T.; Fryer, M.J.; Sparrow, P.A.C.; Richard, F. Arabidopsis Heat shock transcription factor 1b overexpression enhances water productivity, resistance to drought, and infection. J. Exp. Bot. 2013, 64, 3467–3481. [Google Scholar] [CrossRef] [PubMed]
  20. Baldoni, E.; Genga, A.; Cominelli, E. Plant MYB transcription factors: Their role in drought response mechanisms. Int. J. Mol. Sci. 2015, 16, 15811–15851. [Google Scholar] [CrossRef]
  21. Liu, W.C.; Han, T.T.; Yuan, H.M.; Yu, Z.D.; Zhang, L.Y.; Zhang, B.L.; Zhai, S.; Zheng, S.Q.; Lu, Y.T. CATALASE2 functions for seedling post-germinative growth by scavenging H2O2 and stimulating ACX2/3 activity in Arabidopsis. Plant Cell Environ. 2017, 40, 2720–2728. [Google Scholar] [CrossRef]
  22. Zhao, W.; Cheng, Y.H.; Zhang, C.; Shen, X.J.; You, Q.B.; Guo, W. Genome-wide identification and characterization of the GmSnRK2 family in soybean. Int. J. Mol. Sci. 2017, 18, 1834. [Google Scholar] [CrossRef] [PubMed]
  23. Xu, Y.; Zheng, X.; Song, Y.; Zhu, L.; Yu, Z.; Gan, L. NtLTP4, a lipid transfer protein that enhances salt and drought stresses tolerance in Nicotiana tabacum. Sci. Rep. 2018, 8, 8873. [Google Scholar] [CrossRef]
  24. Hu, L.X.; Li, H.Y.; Chen, L.; Lou, Y.H.; Amombo, E.; Fu, J.M. RNA-seq for gene identification and transcript profiling in relation to root growth of bermudagrass (Cynodon dactylon) under salinity stress. BMC Genom. 2015, 16, 575. [Google Scholar] [CrossRef]
  25. Xu, Y.; Huang, B.R. Transcriptomic analysis reveals unique molecular factors for lipid hydrolysis, secondary cell-walls and oxidative protection associated with thermotolerance in perennial grass. BMC Genom. 2018, 19, 70. [Google Scholar] [CrossRef] [PubMed]
  26. Bushman, B.S.; Amundsen, K.L.; Warnke, S.E.; Robins, J.G.; Johnson, P.G. Transcriptome profiling of Kentucky bluegrass (Poa pratensis L.) accessions in response to salt stress. BMC Genom. 2016, 17, 48. [Google Scholar] [CrossRef] [PubMed]
  27. Wang, X.; Kuang, T.; He, Y. Conservation between higher plants and the moss Physcomitrella patens in response to the phytohormone abscisic acid: A proteomics analysis. BMC Plant Biol. 2010, 10, 192. [Google Scholar] [CrossRef] [PubMed]
  28. Peleg, Z.; Blumwald, E. Hormone balance and abiotic stress tolerance in crop plants. Curr. Opin. Plant Biol. 2011, 14, 290–295. [Google Scholar] [CrossRef]
  29. Haider, M.S.; Zhang, C.; Kurjogi, M.M.; Pervaiz, T.; Zheng, T.; Zhang, C.B.; Lide, C.; Shangguan, L.; Fang, F. Insights into grapevine defense response against drought as revealed by biochemical, physiological and RNA-Seq analysis. Sci. Rep. 2017, 7, 17. [Google Scholar] [CrossRef] [PubMed]
  30. Tůmová, L.; Tarkowská, D.; Řehořová, K.; Marková, H.; Kočová, M.; Rothová, O. Drought-tolerant and drought-sensitive genotypes of maize (Zea mays L.) differ in contents of endogenous brassinosteroids and their drought-induced changes. Front. Plant Sci. 2018, 13, e0197870. [Google Scholar] [CrossRef]
  31. Man, D.; Bao, Y.X.; Han, L.B.; Zhang, X. Drought tolerance associated with proline and hormone metabolism in two tall fescue cultivars. Hortscience 2011, 46, 1027–1032. [Google Scholar] [CrossRef]
  32. Kilian, J.; Whitehead, D.; Horak, J.; Wanke, D.; Weinl, S.; Batistic, O.; D”Angelo, C.; Bornberg-Bauer, E.; Kudla, J.; Harter, K. The AtGenExpress global stress expression data set: Protocols, evaluation and model data analysis of UV-B light, drought and cold stress responses. Plant J. 2007, 50, 347–363. [Google Scholar] [CrossRef] [PubMed]
  33. Jin, Z.; Xue, S.; Luo, Y.; Tian, B.; Fang, H.; Li, H. Hydrogen sulfide interacting with abscisic acid in stomatal regulation responses to drought stress in Arabidopsis. Plant Physiol. Biochem. 2013, 62, 41–46. [Google Scholar] [CrossRef] [PubMed]
  34. Park, H.Y.; Seok, H.Y.; Park, B.K.; Kim, S.H.; Goh, C.H.; Lee, B.H. Overexpression of Arabidopsis ZEP enhances tolerance to osmotic stress. Biochem. Biophys. Res. Commun. 2008, 375, 80–85. [Google Scholar] [CrossRef] [PubMed]
  35. De, S.D.; Bonsegna, S.; Horres, R.; Pastor, V.; Taurino, M.; Poltronieri, P. Transcriptomic analysis of oxylipin biosynthesis genes and chemical profiling reveal an early induction of jasmonates in chickpea roots under drought stress. Plant Physiol. Biochem. 2012, 61, 115–122. [Google Scholar] [Green Version]
  36. Fariduddin, Q.; Khanam, S.; Hasan, S.A.; Ali, B.; Hayat, S.; Ahmad, A. Effect of 28-homobrassinolide on the drought stress-induced changes in photosynthesis and antioxidant system of Brassica juncea L. Acta Physiol. Plant. 2009, 31, 889–897. [Google Scholar] [CrossRef]
  37. Yuan, G.F.; Jia, C.G.; Li, Z.; Sun, B.; Zhang, L.P.; Liu, N. Effect of brassinosteroids on drought resistance and abscisic acid concentration in tomato under water stress. Sci. Hortic. 2010, 126, 103–108. [Google Scholar] [CrossRef]
  38. Ohnishi, T.; Szatmari, A.M.; Watanabe, B.; Fujita, S.; Bancos, S.; Koncz, C.; Lafos, M.; Shibata, K.; Yokota, T.; Sakata, K.; et al. C-23 hydroxylation by Arabidopsis CYP90C1 and CYP90D1 reveals a novel shortcut in brassinosteroid biosynthesis. Plant Cell 2006, 18, 3275–3288. [Google Scholar] [CrossRef]
  39. Sahni, S.; Prasad, B.D.; Liu, Q.; Grbic, V.; Sharpe, A.; Singh, S.P.; Krishna, P. Overexpression of the brassinosteroid biosynthetic gene DWF4 in Brassica napus simultaneously increases seed yield and stress tolerance. Sci. Rep. 2016, 6, 28298. [Google Scholar] [CrossRef]
  40. Coello, P.; Hey, S.J.; Halford, N.G. The sucrose non-fermenting-1-related (SnRK) family of protein kinases: Potential for manipulation to improve stress tolerance and increase yield. J. Exp. Bot. 2011, 62, 883–893. [Google Scholar] [CrossRef]
  41. Nishimura, N.; Sarkeshik, A.; Nito, K.; Park, S.Y.; Wang, A.; Carvalho, P.C. PYR/PYL/RCAR family members are major in-vivo ABI1 protein phosphatase 2C-interacting proteins in Arabidopsis. Plant J. Cell Mol. Biol. 2010, 61, 290–299. [Google Scholar] [CrossRef]
  42. Han, Y.L.; Jang, G.; Um, T.; Kim, J.K.; Lee, J.S.; Yang, D.C. The soluble ABA receptor PYL8 regulates drought resistance by controlling ABA signaling in Arabidopsis. Plant Biotechnol. Rep. 2015, 9, 319–330. [Google Scholar]
  43. Yoshida, T.; Fujita, Y.; Maruyama, K.; Mogami, J.; Todaka, D.; Shinozaki, K. Four Arabidopsis AREB/ABF transcription factors function predominantly in gene expression downstream of SnRK2 kinases in abscisic acid signaling in response to osmotic stress. Plant Cell Environ. 2015, 38, 35–49. [Google Scholar] [CrossRef]
  44. Cao, M.J.; Zhang, Y.L.; Liu, X.; Huang, H.; Zhou, X.E.; Wang, W.L.; Zeng, A.; Zhao, C.Z.; Si, T.; Du, J.M. Combining chemical and genetic approaches to increase drought resistance in plants. Nat. Commun. 2017, 8, 12. [Google Scholar] [CrossRef]
  45. Shen, X.; Guo, X.; Zhao, D.; Zhang, Q.; Jiang, Y.; Wang, Y. Cloning and expression profiling of the PacSnRK2 and PacPP2C gene families during fruit development, ABA treatment, and dehydration stress in sweet cherry. Plant Physiol. Biochem. 2017, 119, 275–285. [Google Scholar] [CrossRef]
  46. Fan, W.; Zhao, M.; Li, S.; Bai, X. Contrasting transcriptional responses of PYR1/PYL/RCAR ABA receptors to ABA or dehydration stress between maize seedling leaves and roots. BMC Plant Biol. 2016, 16, 99. [Google Scholar] [CrossRef]
  47. Dalal, M.; Inupakutika, M. Transcriptional regulation of ABA core signaling component genes in sorghum (Sorghum bicolor L. Moench). Mol. Breed. 2014, 34, 1517–1525. [Google Scholar] [CrossRef]
  48. Bhatnagar, N.; Min, M.K.; Choi, E.H.; Kim, N.; Moon, S.J.; Yoon, I. The protein phosphatase 2C clade A protein OsPP2C51 positively regulates seed germination by directly inactivating OsbZIP10. Plant Mol. Biol. 2017, 93, 389–401. [Google Scholar] [CrossRef]
  49. Yoshida, R.; Hobo, T.; Ichimura, K.; Mizoguchi, T.; Takahashi, F.; Aronso, J.; Ecker, J.R.; Shinozaki, K. ABA-activated SnRK2 protein kinase is required for dehydration stress signaling in Arabidopsis. Plant Cell Physiol. 2002, 43, 1473–1483. [Google Scholar] [CrossRef]
  50. Sun, L.; Wang, Y.P.; Chen, P.; Ren, J.; Ji, K.; Li, Q. Transcriptional regulation of SlPYL, SlPP2C, and SlSnRK2 gene families encoding ABA signal core components during tomato fruit development and drought stress. J. Exp. Bot. 2011, 62, 5659–5669. [Google Scholar] [CrossRef] [Green Version]
  51. Fujita, Y.; Yoshida, T.; Yamaguchi-Shinozaki, K. Pivotal role of the AREB/ABF-SnRK2 pathway in ABRE-mediated transcription in response to osmotic stress in plants. Physiol. Plant. 2013, 147, 15–27. [Google Scholar] [CrossRef]
  52. Liu, H.; Zhang, Y.H.; Yin, H.; Wang, W.X.; Zhao, X.M.; Du, Y.G. Alginate oligosaccharides enhanced Triticum aestivum L. tolerance to drought stress. Plant Physiol. Biochem. 2013, 62, 33–40. [Google Scholar] [CrossRef]
  53. Maksup, S.; Roytrakul, S.; Supaibulwatana, K. Physiological and comparative proteomic analyses of Thai jasmine rice and two check cultivars in response to drought stress. J. Plant Interact. 2014, 9, 43–55. [Google Scholar] [CrossRef]
  54. Lima, J.M.; Nath, M.; Dokku, P.; Raman, K.V.; Kulkarni, K.P.; Vishwakarma, C.; Sahoo, S.P.; Mohapatra, U.B.; AmithaMithra, S.V.; Chinnusamy, V.; Robin, S.; et al. Physiological, anatomical and transcriptional alterations in a rice mutant leading to enhanced water stress tolerance. AoB Plants 2015, 7. [Google Scholar] [CrossRef]
  55. Chini, A.; Fonseca, S.; Fernandez, G.; Adie, B.; Chico, J.M.; Lorenzo, O.; Garcia-Casado, G.; Lopez-Vidriero, I.; Lozano, F.; Ponce, M. The JAZ family of repressors is the missing link in jasmonate signalling. Nature 2007, 448, 666–671. [Google Scholar] [CrossRef]
  56. Liu, N.; Staswick, P.E.; Avramova, Z. Memory responses of jasmonic acid-associated Arabidopsis genes to a repeated dehydration stress. Plant Cell Environ. 2016, 39, 2515–2529. [Google Scholar] [CrossRef]
  57. Li, Z.Y.; Xu, Z.S.; He, G.Y.; Yang, G.X.; Chen, M.; Li, L.C.; Ma, Y.Z. A mutation in Arabidopsis BSK5 encoding a brassinosteroid-signaling kinase protein affects responses to salinity and abscisic acid. Biochem. Biophys. Res. Commun. 2012, 426, 522–527. [Google Scholar] [CrossRef]
  58. Fariduddin, Q.; Yusuf, M.; Ahmad, I.; Ahmad, A. Brassinosteroids and their role in response of plants to abiotic stresses. Biol. Plant. 2014, 58, 9–17. [Google Scholar] [CrossRef]
  59. Zhang, S.; Cai, Z.; Wang, X. The primary signaling outputs of brassinosteroids are regulated by abscisic acid signaling. Proc. Natl. Acad. Sci. USA 2009, 106, 4543–4548. [Google Scholar] [CrossRef] [Green Version]
  60. Xu, Y.; Burgess, P.; Huang, B. Transcriptional regulation of hormone-synthesis and signaling pathways by overexpressing cytokinin-synthesis contributes to improved drought tolerance in creeping bentgrass. Physiol. Plant. 2017, 161, 235–256. [Google Scholar] [CrossRef]
  61. Saha, G.; Park, J.I.; Jung, H.J.; Ahmed, N.U.; Kayum, M.A.; Kang, J.G. Molecular characterization of BZR transcription factor family and abiotic stress-induced expression profiling in Brassica rapa. Plant Physiol. Biochem. 2015, 92, 92–104. [Google Scholar] [CrossRef]
  62. Iliev, E.A.; Xu, W.; Polisensky, D.H.; Oh, M.H.; Torisky, R.S.; Clouse, S.D.; Braam, J. Transcriptional and posttranscriptional regulation of Arabidopsis TCH4 expression by diverse stimuli. roles of cis regions and brassinosteroids. Plant Physiol. 2002, 130, 770–783. [Google Scholar] [CrossRef]
  63. Ning, J.; Li, X.; Hicks, L.M.; Xiong, L. A Raf-like MAPKKK gene DSM1 mediates drought resistance through reactive oxygen species scavenging in rice. Plant Physiol. 2010, 152, 876–890. [Google Scholar] [CrossRef]
  64. Li, Y.; Cai, H.; Liu, P.; Wang, C.; Gao, H.; Wu, C. Arabidopsis MAPKKK18 positively regulates drought stress resistance via downstream MAPKK3. Biochem. Biophys. Res. Commun. 2017, 484, 292–297. [Google Scholar] [CrossRef]
  65. Yoo, S.D.; Cho, Y.H.; Tena, G.; Xiong, Y.; Sheen, J. Dual control of nuclear EIN3 by bifurcate MAPK cascades in C2H4 signalling. Nature 2008, 451, 789–795. [Google Scholar] [CrossRef] [Green Version]
  66. Arraes, F.B.M.; Beneventi, M.A.; Lisei de Sa, M.E.; Paixao, J.F.; Albuquerque, E.V.S.; Marin, S.R.R.M. Implications of ethylene biosynthesis and signaling in soybean drought stress tolerance. BMC Plant Biol. 2015, 15, 213. [Google Scholar] [CrossRef]
  67. Takahashi, F.; Yoshida, R.; Ichimura, K.; Mizoguchi, T.; Seo, S.; Yonezawa, M.; Maruyama, K.; Yamaguchi-Shinozaki, K.; Shinozaki, K. Mitogen-activated protein kinase cascade MKK3-MPK6 is an important part of the jasmonate signal transduction pathway in Arabidopsis. Plant Cell 2007, 19, 805–818. [Google Scholar] [CrossRef]
  68. Zhang, L.; Li, Y.; Lu, W.; Meng, F.; Wu, C.A.; Guo, X. Cotton Ghmkk5 affects disease resistance, induces HR-like cell death, and reduces the tolerance to salt and drought stress in transgenic Nicotiana benthamiana. J. Exp. Bot. 2012, 63, 3935–3951. [Google Scholar] [CrossRef]
  69. Yao, P.F.; Li, C.L.; Zhao, X.R.; Li, M.F.; Zhao, H.X.; Guo, J.Y.; Cai, Y.; Chen, H.; Wu, Q. Overexpression of a tartary buckwheat gene, FtbHLH3, enhances drought/oxidative stress tolerance in transgenic Arabidopsis. Front. Plant Sci. 2017, 8, 625. [Google Scholar] [CrossRef]
  70. Zhang, L.L.; Cheng, J.; Sun, X.M.; Zhao, T.T.; Li, M.J.; Wang, Q.F.; Li, S.H.; Xin, H.P. Overexpression of VaWRKY14 increases drought tolerance in Arabidopsis by modulating the expression of stress-related genes. Plant Cell Rep. 2018, 37, 1159–1172. [Google Scholar] [CrossRef]
  71. Tang, N.; Ma, S.; Zong, W.; Yang, N.; Lv, Y.; Yan, C.; Guo, Z.; Li, J.; Li, X.; Xiang, Y.; et al. MODD mediates deactivation and degradation of OsbZIP46 to negatively regulate ABA signaling and drought resistance in rice. Plant Cell 2016, 28, 2161–2177. [Google Scholar] [CrossRef]
  72. Chen, N.; Yang, Q.L.; Su, M.W.; Pan, L.J.; Chi, X.Y.; Chen, M.N.; He, Y.N.; Yang, Z.; Wang, T.; Wang, M.; et al. Cloning of six ERF family transcription factor genes from peanut and analysis of their expression during abiotic stress. Plant Mol. Biol. Rep. 2012, 30, 1415–1425. [Google Scholar] [CrossRef]
  73. Yu, Y.W.; Yang, D.X.; Zhou, S.R.; Gu, J.T.; Wang, F.R.; Dong, J.G.; Huang, R.F. The ethylene response factor OsERF109 negatively affects ethylene biosynthesis and drought tolerance in rice. Protoplasma 2016, 254, 401–408. [Google Scholar] [CrossRef]
  74. Butt, H.I.; Yang, Z.; Gong, Q.; Chen, E.; Wang, X.; Zhao, G.; Ge, X.Y.; Zhang, X.Y.; Li, F.G. GaMYB85, an R2R3 MYB gene, in transgenic Arabidopsis plays an important role in drought tolerance. BMC Plant Biol. 2017, 17, 142. [Google Scholar] [CrossRef]
  75. Gao, F.; Wang, J.; Wei, S.; Li, Z.; Wang, N.; Li, H.; Feng, J.; Li, H.; Zhou, Y.; Zhang, F. Transcriptomic analysis of drought stress responses in ammopiptanthus mongolicus leaves using the RNA-Seq technique. PLoS ONE 2015, 10, e0124382. [Google Scholar]
  76. Haas, B.J.; Papanicolaou, A.; Yassour, M.; Grabherr, M.; Blood, P.D.; Bowden, J. De novo transcript sequence reconstruction from RNA-seq using the Trinity platform for reference generation and analysis. Nat. Protoc. 2013, 8, 1494–1512. [Google Scholar] [CrossRef]
  77. Götz, S.; García-Gómez, J.; Terol, J.; Williams, T.; Nagaraj, S.; Nueda, M.; Robles, M.; Talón, M.; Dopazo, J.; Conesa, A. High-throughput functional annotation and data mining with the Blast2GO suite. Nucleic Acids Res. 2008, 36, 3420–3435. [Google Scholar] [CrossRef] [Green Version]
  78. Kanehisa, M.; Goto, S.; Kawashima, S.; Okuno, Y.; Hattori, M. The KEGG resource for deciphering the genome. Nucleic Acids Res. 2004, 32, 277–280. [Google Scholar] [CrossRef] [Green Version]
  79. Patro, R.; Duggal, G.; Love, M.I.; Irizarry, R.A.; Kingsford, C. Salmon provides fast and bias-aware quantification of transcript expression. Nat. Methods 2017, 14, 417–419. [Google Scholar] [CrossRef]
  80. Wagner, G.P.; Kin, K.; Lynch, V.J. Measurement of mRNA abundance using RNA-seq data: RPKM measure is inconsistent among samples. Theor. Biosci. 2012, 131, 281–285. [Google Scholar] [CrossRef]
  81. Ritchie, M.E.; Phipson, B.; Wu, D.; Hu, Y.; Law, C.W.; Shi, W.; Smyth, G.K. Limma powers differential expression analyses for RNA-sequencing and microarray studies. Nucleic Acids Res. 2015, 43, e47. [Google Scholar] [CrossRef]
  82. Livak, K.J.; Schmittgen, T.D. Analysis of relative gene expression data using real-time quantitative PCR and the 2ΔΔCT method. Methods 2001, 25, 402–408. [Google Scholar] [CrossRef]
  83. Yang, J.; Zhang, J.; Wang, Z.; Zhu, Q.; Wang, W. Hormonal changes in the grains of rice subjected to water stress during grain filling. Plant Physiol. 2001, 127, 315–323. [Google Scholar] [CrossRef]
  84. Zhao, J.; Li, G.; Wang, B.M.; Liu, W.; Nan, T.G.; Zhai, Z.X. Development of a monoclonal antibody-based enzyme-linked immunosorbent assay for the analysis of glycyrrhizic acid. Anal. Bioanal. Chem. 2006, 386, 1735–1740. [Google Scholar] [CrossRef]
  85. Xu, Y.G.; Liu, R.R.; Sui, N.; Shi, W.W.; Wang, L.; Tian, C.Y. Changes in endogenous hormones and seed coat phenolics during seed storage of two Suaeda salsa populations. Aust. J. Bot. 2016, 64, 325–332. [Google Scholar] [CrossRef]
Figure 1. Bar plots of Gene Ontology (GO) classifications of the assembled sequences from the Kentucky Bluegrass transcriptome.
Ijms 20 01289 g001
Figure 2. Histogram presentation of clusters of orthologous groups from the Kentucky Bluegrass transcriptome.
Ijms 20 01289 g002
Figure 3. Plots showing categories of genes classified based on the Kyoto Encyclopedia of Genes and Genomes (KEGG) analysis.
Ijms 20 01289 g003
Figure 4. Bar plots of GO enrichment of DEGs with increased expressions (q value < 0.05).
Ijms 20 01289 g004
Figure 5. Bar plots of GO enrichment of DEGs with decreased expressions (q Value < 0.05).
Ijms 20 01289 g005
Figure 6. Kyoto Encyclopedia of Genes and Genomes (KEGG) enrichment of up- and down-regulated DEGs during the drought period.
Ijms 20 01289 g006
Figure 7. Plots showing the effects of drought stress on plant hormone synthesis in Kentucky Bluegrass. (A) Leaf hormone contents at 0, 2, and 16 h after drought stress, (B) DEGs predicted to be involved in “Abscisic acid biosynthesis”, (C) DEGs predicted to be involved in “Jasmonic acid biosynthesis”, (D) DEGs predicted to be involved in “Brassinosteroid biosynthesis”. In panel B, C, and D, red color represents up-regulated genes, green color represents down-regulated genes, white color represents unchanged genes.
Ijms 20 01289 g007
Figure 8. Heat maps of the expression of “Plant hormone signal transduction pathway” genes during the drought period. Red represents up-regulated genes, green represents a down-regulated gene, white represents no significant change. Red and blue represent up- and down-regulated transcripts, from the three comparisons: 2 vs 0 h, 16 vs 2 h, 16 vs 0 h (|log2(fold change)| > 2, p < 0.05).
Ijms 20 01289 g008
Figure 9. Each network diagram is composed of statistically significant functional and DEGs enrichments between “Plant hormone signal transduction” and the “MAPK signaling pathway-plant” in response to drought stress. The square represents functional information, circle indicates genes, and line represents the correlation between genes and functions. The color of the circle represents the degree of difference in gene expression, i.e., log2(Fold change) value, with green color representing down-regulation and red color showing up-regulation, respectively. The color of the square shows the functional enrichment, i.e., P value, where a higher enrichment may indicate a lower P value and a darker color.
Ijms 20 01289 g009
Figure 10. qRT-PCR validations of differentially expressed genes in a leaf of Kentucky bluegrass under drought stress. Correlations of expression level analyzed by log2 qPCR (x-axis) with data obtained using RNA-Seq platform (y-axis).
Ijms 20 01289 g010
Figure 11. Proposed working model for drought stress transcription factor signaling network in Kentucky bluegrass. The red arrow represents the up-regulated gene, the green arrow represents the down-regulated gene. The purple frame represents the bZIP family transcription factor, the yellow frame represents the ERF family transcription factor, the gray frame represents the MYB family transcription factor, the blue frame represents the WRKY family transcription factor, and the orange frame represents the bHLH family transcription factor.
Ijms 20 01289 g011

