An In Vitro Study on Mitochondrial Compensatory Response Induced by Gliadin Peptides in Caco-2 Cells


Abstract
:1. Introduction
2. Results
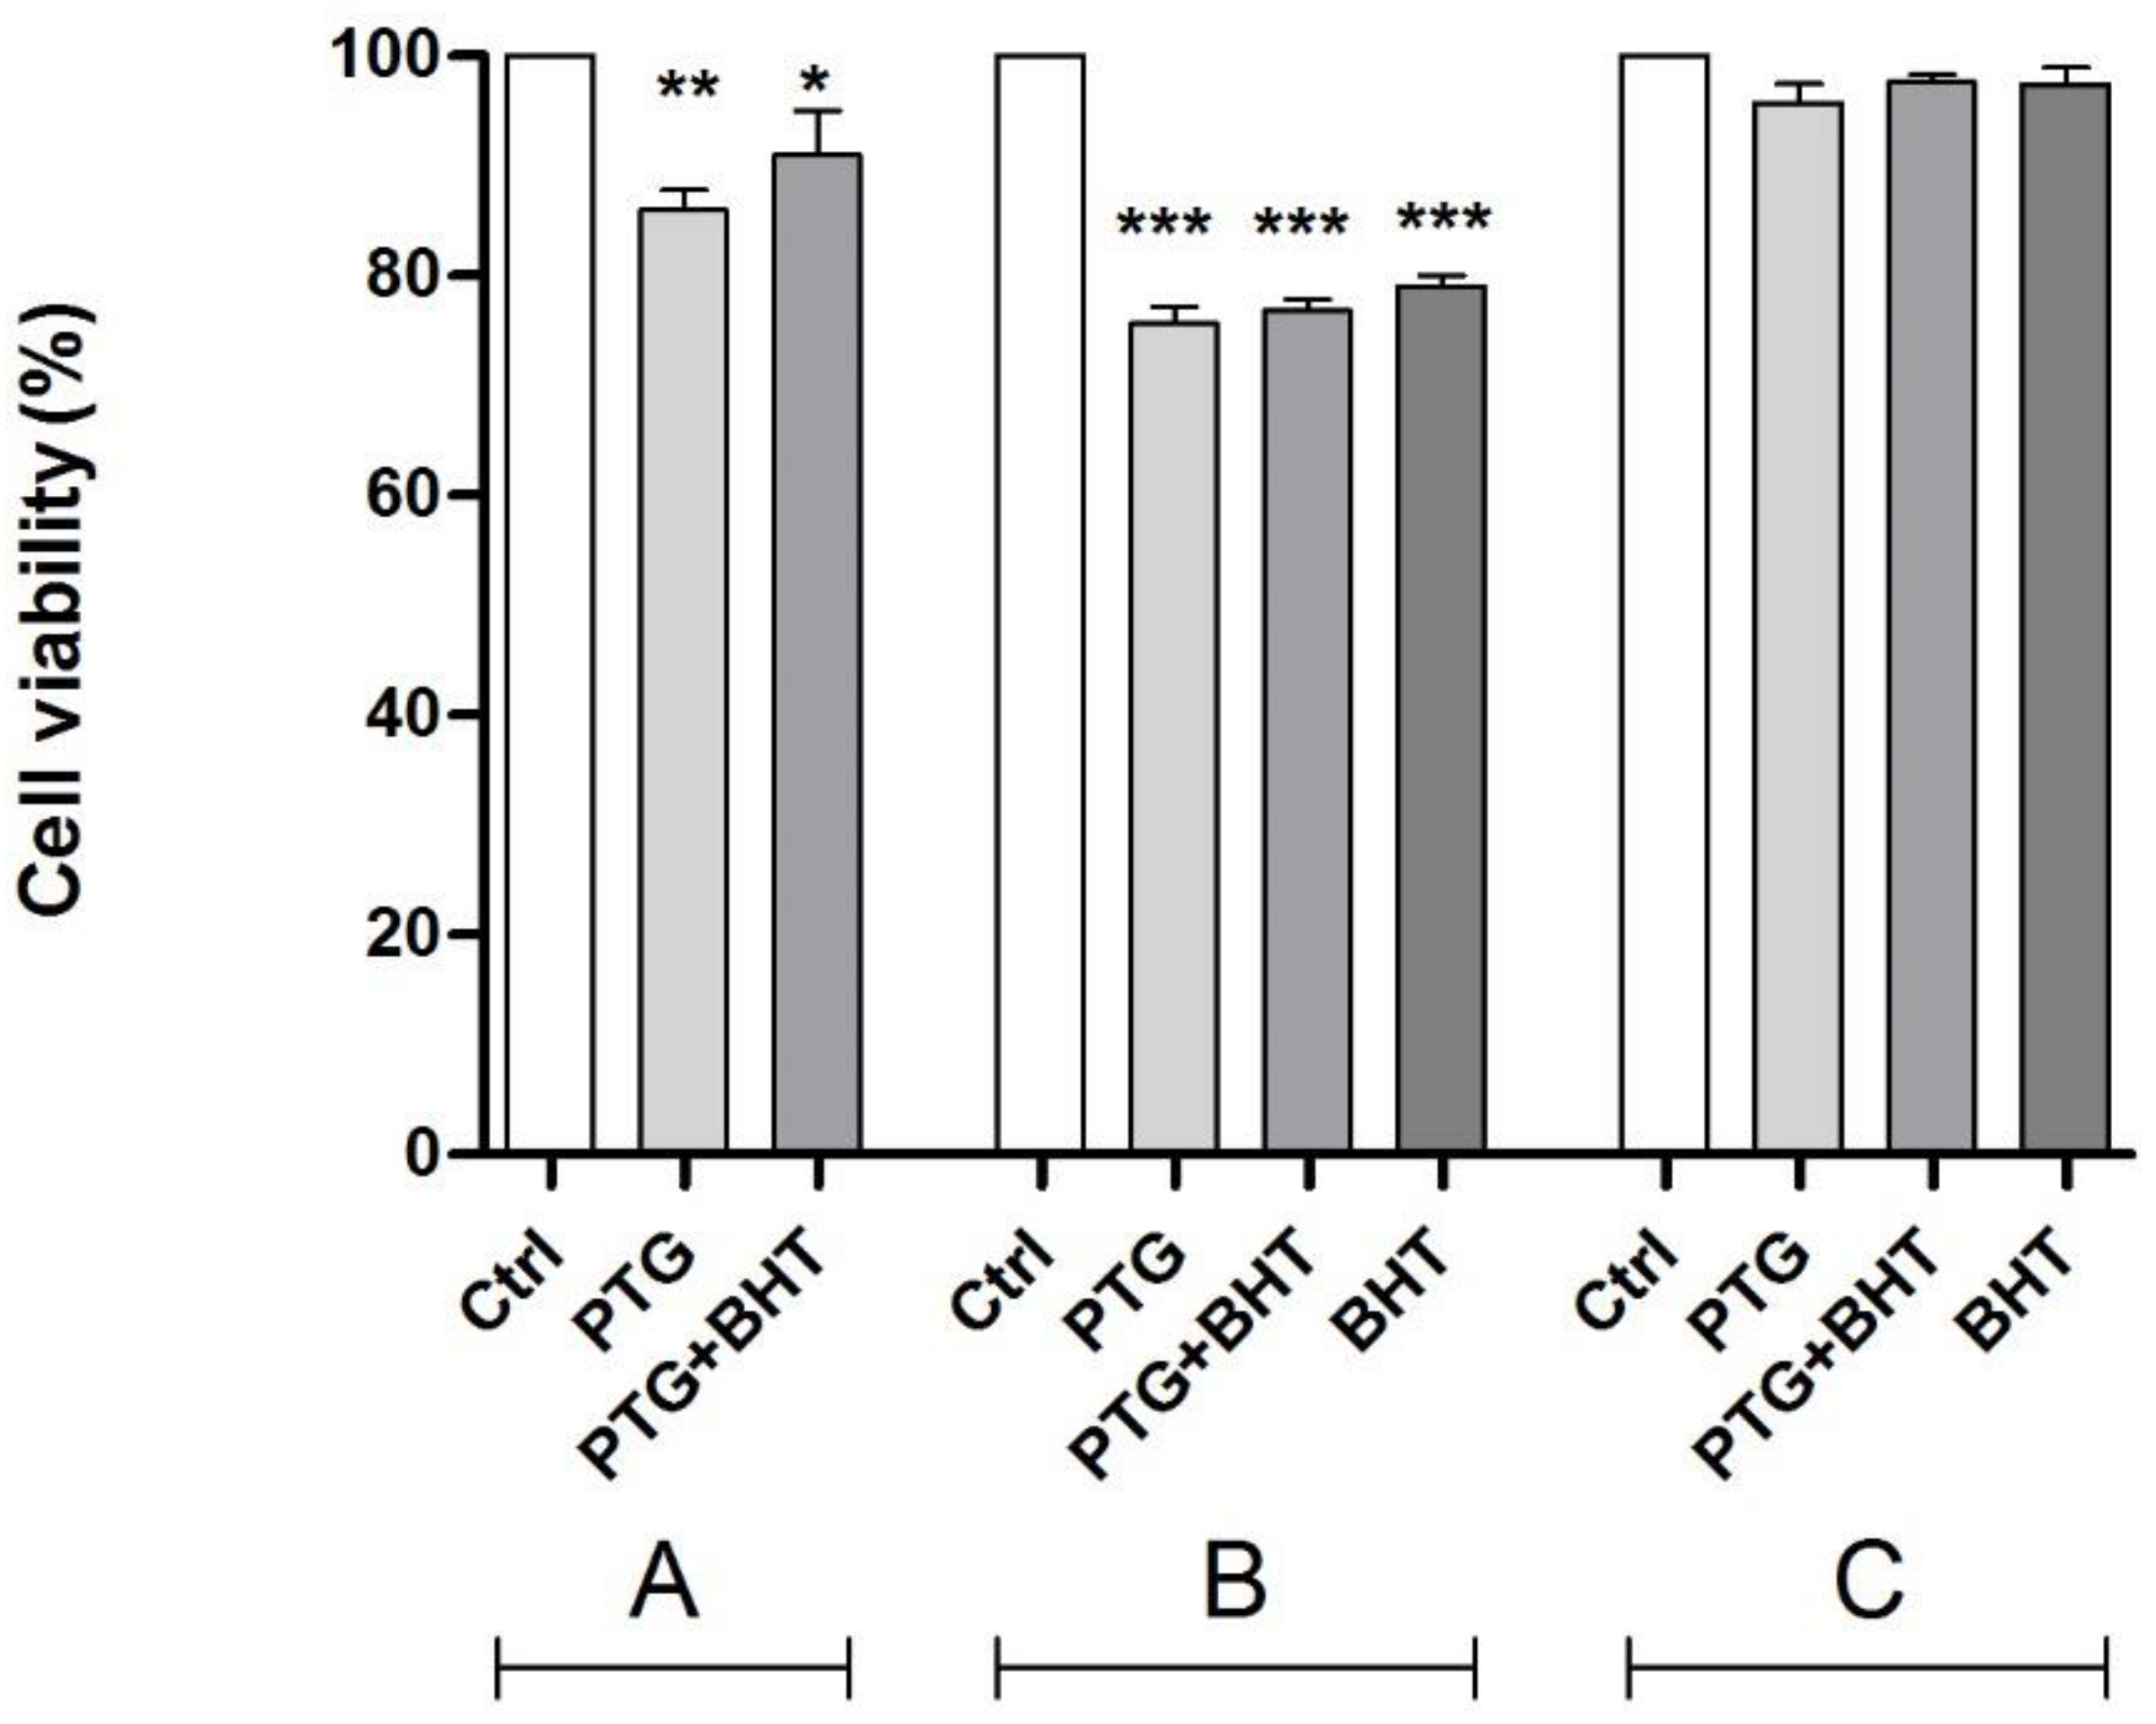
2.1. MTT Test
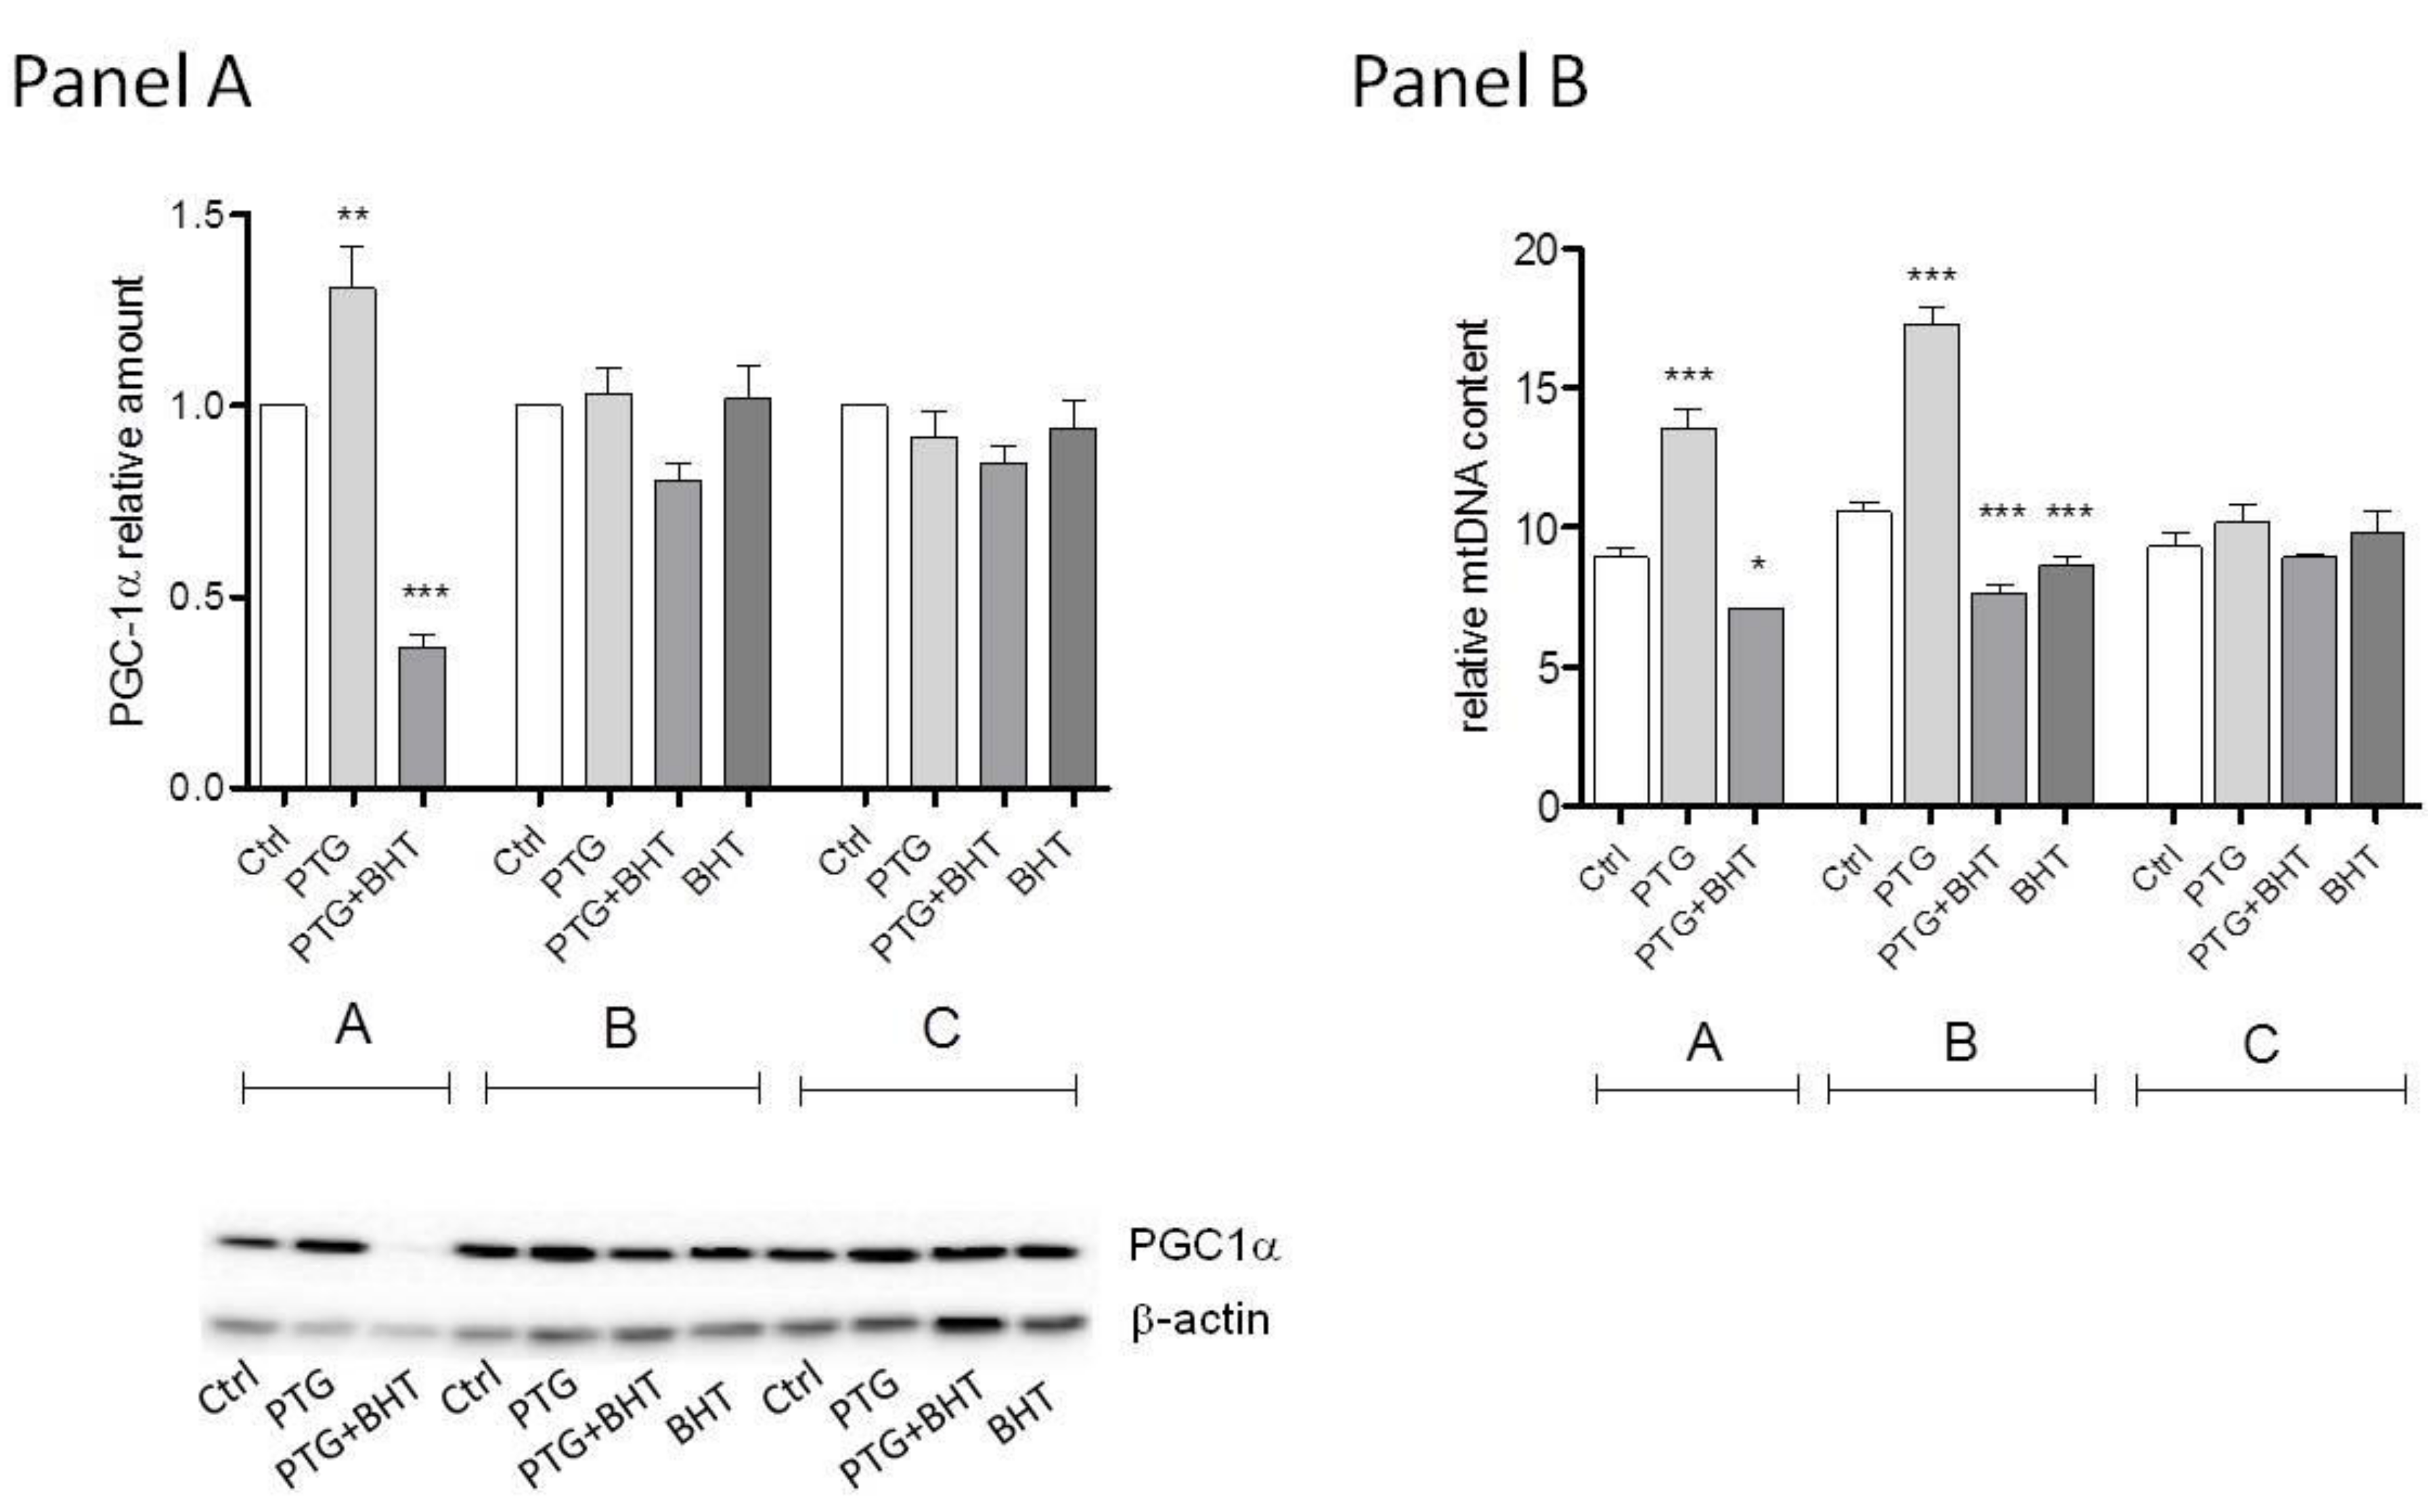
2.2. Mitochondrial Biogenesis
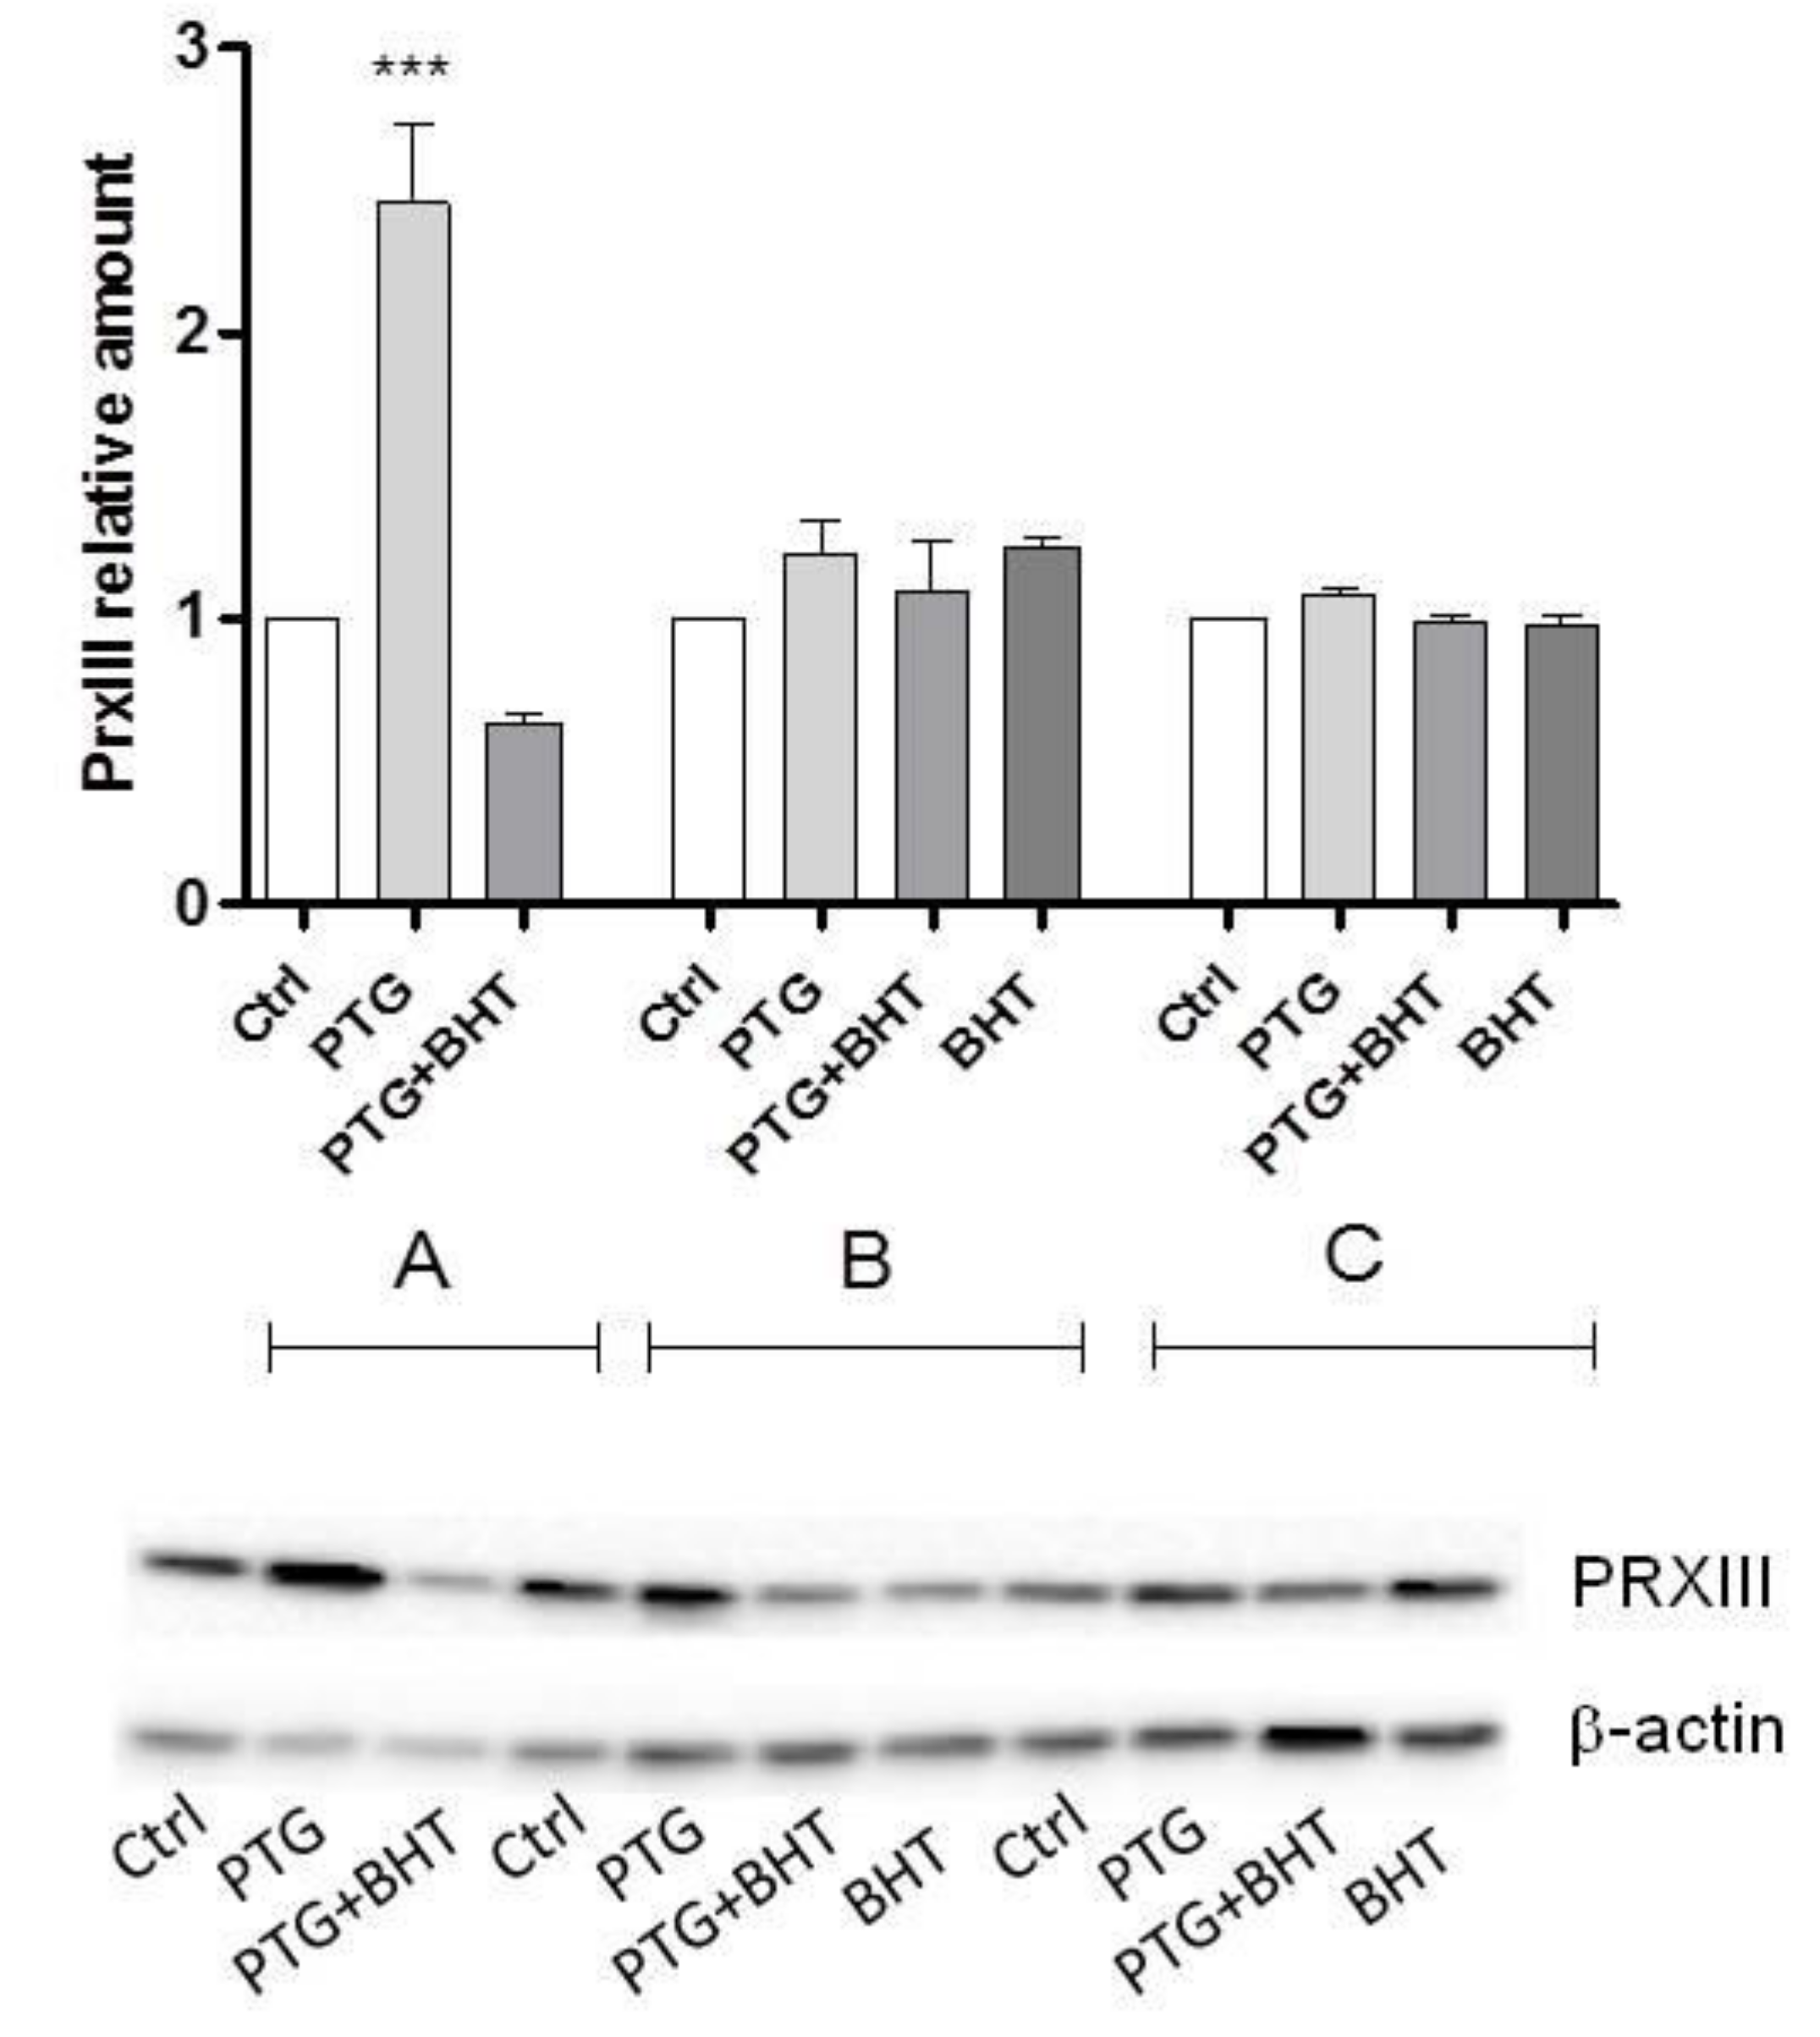
2.3. Mitochondrial Antioxidant Response
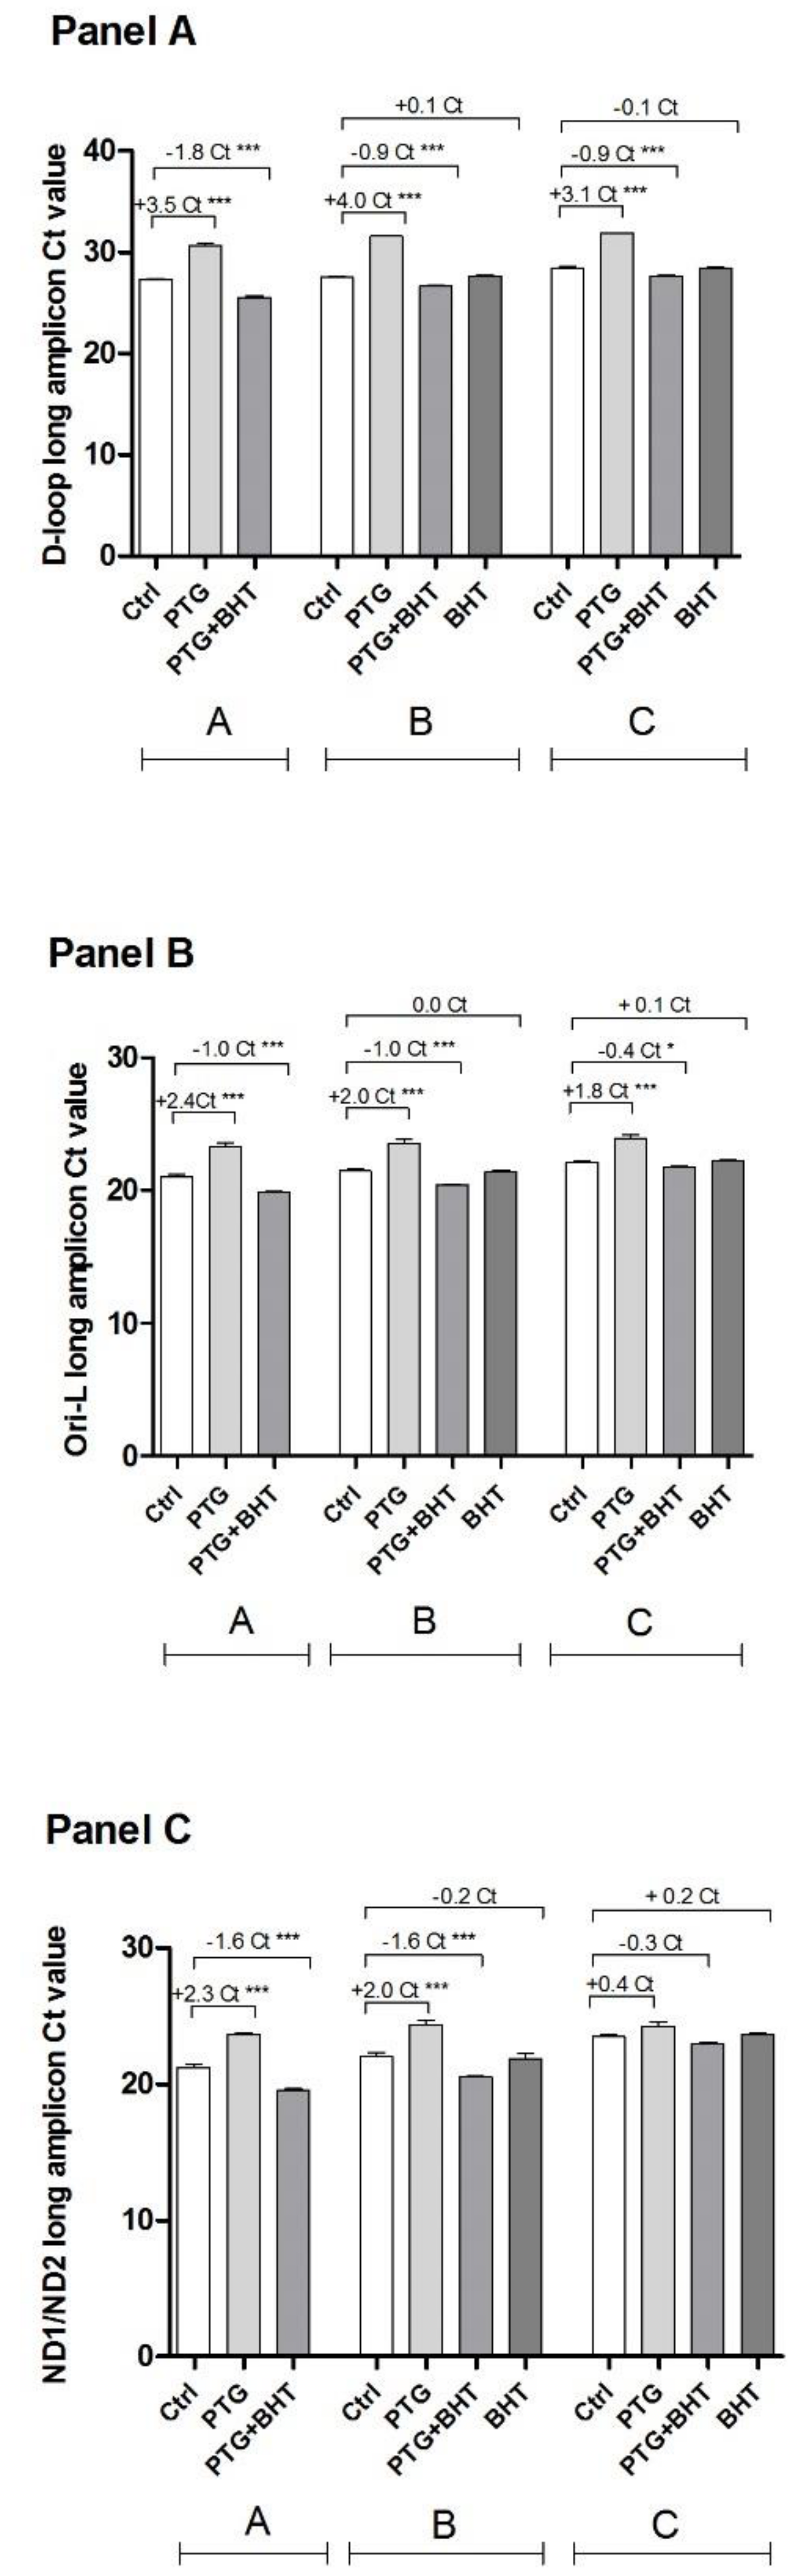
2.4. MtDNA Damage
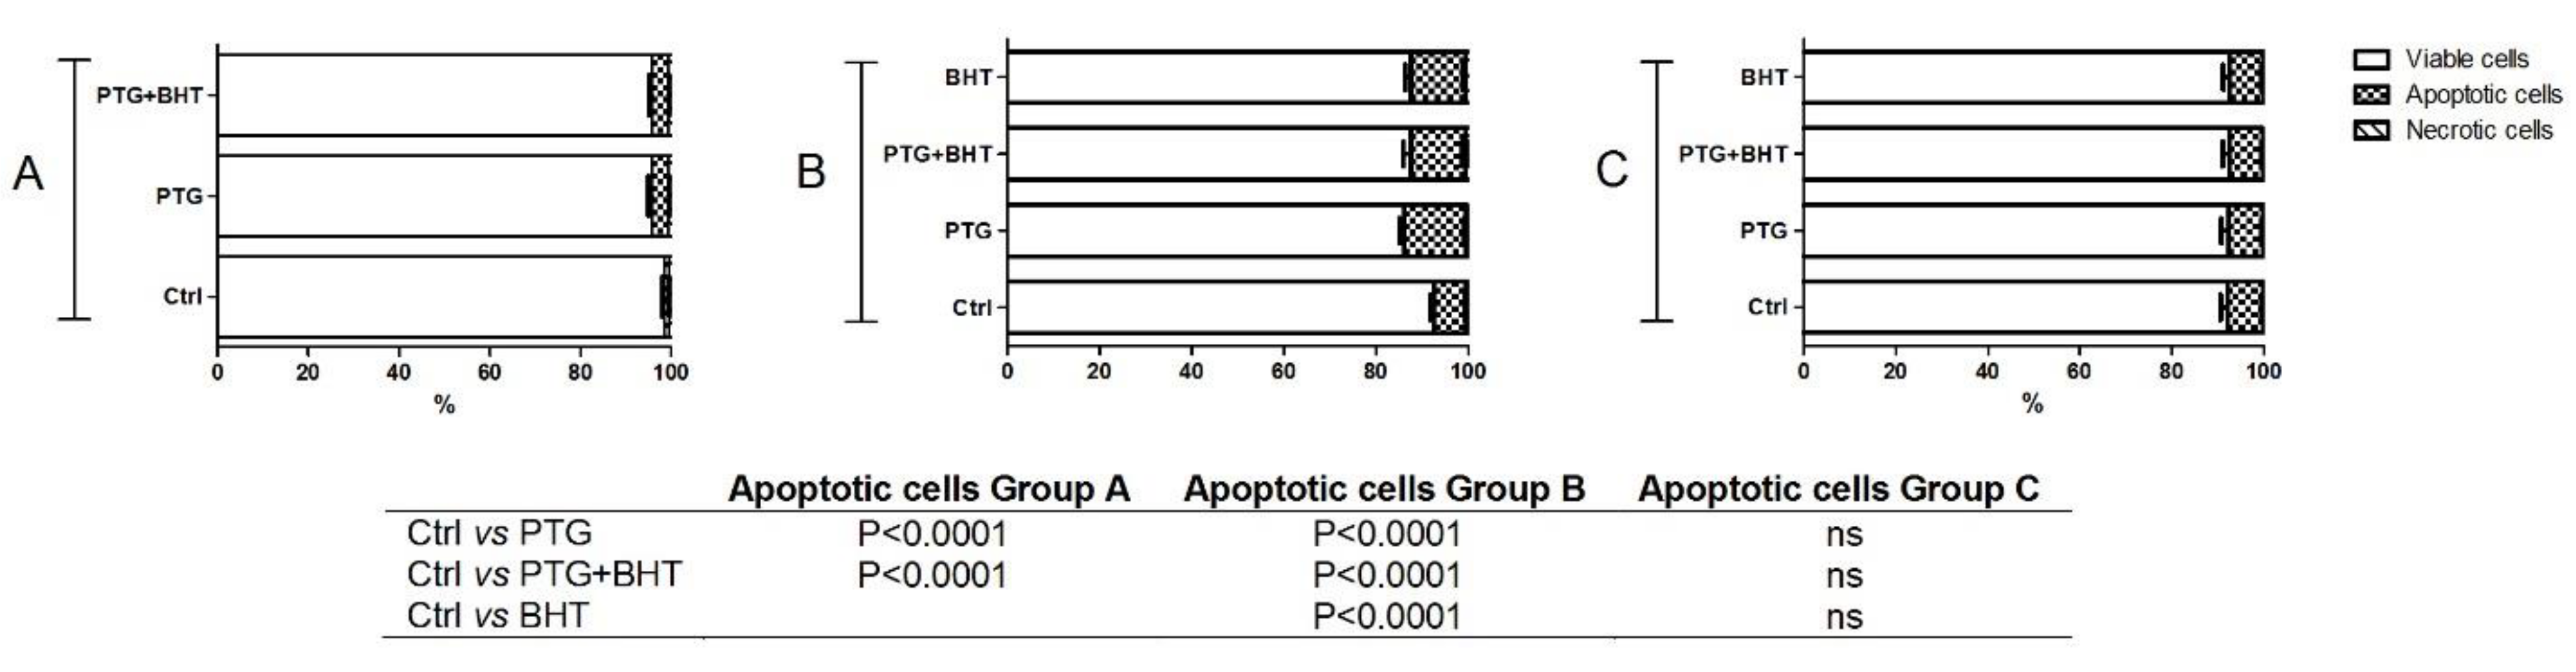
2.5. Apoptosis
3. Discussion
4. Materials and Methods
4.1. Cell Culture Conditions
4.2. Gliadin Digest
4.3. Cell Treatment
4.4. MTT Test
4.5. Western Blots
4.6. mtDNA Content
4.7. mtDNA Damage Analysis
4.8. Apoptosis
4.9. Statistical Analysis
5. Conclusions
Author Contributions
Funding
Acknowledgments
Conflicts of Interest
References
- Balakireva, A.V.; Zamyatnin, A.A. Properties of Gluten Intolerance: Gluten Structure, Evolution, Pathogenicity and Detoxification Capabilities. Nutrients 2016, 8, 644. [Google Scholar] [CrossRef]
- Sollid, L.M. Coeliac disease: Dissecting a complex inflammatory disorder. Nat. Rev. Immunol. 2002, 2, 647–655. [Google Scholar] [CrossRef] [PubMed]
- Orlando, A.; Linsalata, M.; Notarnicola, M.; Tutino, V.; Russo, F. Lactobacillus GG restoration of the gliadin induced epithelial barrier disruption: The role of cellular polyamines. BMC Microbiol. 2014, 14, 19. [Google Scholar] [CrossRef] [PubMed]
- Gianfrani, C.; Auricchio, S.; Troncone, R. Adaptive and innate immune responses in celiac disease. Immunol. Lett. 2005, 99, 141–145. [Google Scholar] [CrossRef]
- Ferretti, G.; Bacchetti, T.; Masciangelo, S.; Saturni, L. Celiac disease, inflammation and oxidative damage: A nutrigenetic approach. Nutrients 2012, 4, 243–257. [Google Scholar] [CrossRef]
- Stewart, W.W.; Kerr, M.A. The measurement of respiratory burst induced in polymorphonuclear neutrophils by IgA and IgG anti-gliadin antibodies isolated from coeliac serum. Immunology 1991, 73, 491–497. [Google Scholar] [PubMed]
- Kim, Y.J.; Kim, E.H.; Hahm, K.B. Oxidative stress in inflammation-based gastrointestinal tract diseases: Challenges and opportunities. J. Gastroenterol. Hepatol. 2012, 27, 1004–1010. [Google Scholar] [CrossRef] [PubMed]
- Bhattacharyya, A.; Chattopadhyay, R.; Mitra, S.; Crowe, S.E. Oxidative stress: An essential factor in the pathogenesis of gastrointestinal mucosal diseases. Physiol. Rev. 2014, 94, 329–354. [Google Scholar] [CrossRef] [PubMed]
- Szaflarska-Poplawska, A.; Siomek, A.; Czerwionka-Szaflarska, M.; Gackowski, D.; Rozalski, R.; Guz, J.; Szpila, A.; Zarakowska, E.; Olinski, R. Oxidatively damaged DNA/oxidative stress in children with celiac disease. Cancer Epidemiol. Prev. Biomark. 2010, 19, 1960–1965. [Google Scholar] [CrossRef] [PubMed]
- Rivabene, R.; Mancini, E.; de Vincenzi, M. In vitro cytotoxic effect of wheat gliadin-derived peptides on the Caco-2 intestinal cell line is associated with intracellular oxidative imbalance: Implications for coeliac disease. Biochim. Biophys. Acta 1999, 1453, 152–160. [Google Scholar] [CrossRef]
- Di Meo, S.; Reed, T.T.; Venditti, P.; Victor, V.M. Role of ROS and RNS Sources in Physiological and Pathological Conditions. Oxid. Med. Cell. Longev. 2016, 2016, 1245049. [Google Scholar] [CrossRef]
- Picca, A.; Riezzo, G.; Lezza, A.M.S.; Clemente, C.; Pesce, V.; Orlando, A.; Chimienti, G.; Russo, F. Mitochondria and redox balance in coeliac disease: A case-control study. Eur. J. Clin. Investig. 2018, 48, e12877. [Google Scholar] [CrossRef] [PubMed]
- Yeganeh, P.R.; Leahy, J.; Spahis, S.; Patey, N.; Desjardins, Y.; Roy, D.; Delvin, E.; Garofalo, C.; Leduc-Gaudet, J.P.; St.-Pierre, D.; et al. Apple peel polyphenols reduce mitochondrial dysfunction in mice with DSS-induced ulcerative colitis. J. Nutr. Biochem. 2018, 57, 56–66. [Google Scholar] [CrossRef]
- Matondo, A.; Kim, S.S. Targeted-mitochondria antioxidants therapeutic implications in inflammatory bowel disease. J. Drug Target. 2018, 26, 1–8. [Google Scholar] [CrossRef] [PubMed]
- Mohanty, A.; Tiwari-Pandey, R.; Pandey, N.R. Mitochondria: The indispensable players in innate immunity and guardians of the inflammatory response. J. Cell Commun. Signal. 2019. [Google Scholar] [CrossRef] [PubMed]
- Schroder, K.; Tschopp, J. The inflammasomes. Cell 2010, 140, 821–832. [Google Scholar] [CrossRef] [PubMed]
- Palova-Jelinkova, L.; Danova, K.; Drasarova, H.; Dvorak, M.; Funda, D.P.; Fundova, P.; Kotrbova-Kozak, A.; Cerna, M.; Kamanova, J.; Martin, S.F.; et al. Pepsin digest of wheat gliadin fraction increases production of IL-1beta via TLR4/MyD88/TRIF/MAPK/NF-kappaB signaling pathway and an NLRP3 inflammasome activation. PLoS ONE 2013, 8, e62426. [Google Scholar] [CrossRef] [PubMed]
- Vachon, P.H.; Beaulieu, J.F. Transient mosaic patterns of morphological and functional differentiation in the Caco-2 cell line. Gastroenterology 1992, 103, 414–423. [Google Scholar] [CrossRef]
- Lanigan, R.S.; Yamarik, T.A. Final report on the safety assessment of BHT (1). Int. J. Toxicol. 2002, 21 (Suppl. 2), 19–94. [Google Scholar] [PubMed]
- Patlevic, P.; Vaskova, J.; Svorc, P., Jr.; Vasko, L.; Svorc, P. Reactive oxygen species and antioxidant defense in human gastrointestinal diseases. Integr. Med. Res. 2016, 5, 250–258. [Google Scholar] [CrossRef] [PubMed]
- Russo, F.; Chimienti, G.; Clemente, C.; D’Attoma, B.; Linsalata, M.; Orlando, A.; de Carne, M.; Cariola, F.; Semeraro, F.P.; Pepe, G.; et al. Adipokine profile in celiac patients: Differences in comparison with patients suffering from diarrhea-predominant IBS and healthy subjects. Scand. J. Gastroenterol. 2013, 48, 1377–1385. [Google Scholar] [CrossRef]
- Monguzzi, E.; Marabini, L.; Elli, L.; Vaira, V.; Ferrero, S.; Ferretti, F.; Branchi, F.; Gaudioso, G.; Scricciolo, A.; Lombardo, V.; et al. Gliadin effect on the oxidative balance and DNA damage: An in-vitro, ex-vivo study. Dig. Liver Dis. 2019, 51, 47–54. [Google Scholar] [CrossRef] [PubMed]
- Dolfini, E.; Elli, L.; Roncoroni, L.; Costa, B.; Colleoni, M.P.; Lorusso, V.; Ramponi, S.; Braidotti, P.; Ferrero, S.; Falini, M.L.; et al. Damaging effects of gliadin on three-dimensional cell culture model. World J. Gastroenterol. 2005, 11, 5973–5977. [Google Scholar] [CrossRef]
- Lindfors, K.; Blomqvist, T.; Juuti-Uusitalo, K.; Stenman, S.; Venalainen, J.; Maki, M.; Kaukinen, K. Live probiotic Bifidobacterium lactis bacteria inhibit the toxic effects induced by wheat gliadin in epithelial cell culture. Clin. Exp. Immunol. 2008, 152, 552–558. [Google Scholar] [CrossRef]
- Sander, G.R.; Cummins, A.G.; Henshall, T.; Powell, B.C. Rapid disruption of intestinal barrier function by gliadin involves altered expression of apical junctional proteins. FEBS Lett. 2005, 579, 4851–4855. [Google Scholar] [CrossRef] [PubMed]
- Sarangarajan, R.; Meera, S.; Rukkumani, R.; Sankar, P.; Anuradha, G. Antioxidants: Friend or foe? Asian Pac. J. Trop. Med. 2017, 10, 1111–1116. [Google Scholar] [CrossRef]
- Giovannini, C.; Maiuri, L.; de Vincenzi, M. Cytotoxic effect of prolamin-derived peptides on in vitro cultures of cell line Caco-2: Implications for coeliac disease. Toxicol. In Vitro 1995, 9, 51–55. [Google Scholar] [CrossRef]
- Scarpulla, R.C. Transcriptional paradigms in mammalian mitochondrial biogenesis and function. Physiol. Rev. 2008, 88, 611–638. [Google Scholar] [CrossRef]
- Haddad, J.J. Antioxidant and prooxidant mechanisms in the regulation of redox(y)-sensitive transcription factors. Cell. Signal. 2002, 14, 879–897. [Google Scholar] [CrossRef]
- St-Pierre, J.; Drori, S.; Uldry, M.; Silvaggi, J.M.; Rhee, J.; Jager, S.; Handschin, C.; Zheng, K.; Lin, J.; Yang, W.; et al. Suppression of reactive oxygen species and neurodegeneration by the PGC-1 transcriptional coactivators. Cell 2006, 127, 397–408. [Google Scholar] [CrossRef]
- Valko, M.; Leibfritz, D.; Moncol, J.; Cronin, M.T.; Mazur, M.; Telser, J. Free radicals and antioxidants in normal physiological functions and human disease. Int. J. Biochem. Cell Biol. 2007, 39, 44–84. [Google Scholar] [CrossRef]
- Lee, H.C.; Lu, C.Y.; Fahn, H.J.; Wei, Y.H. Aging- and smoking-associated alteration in the relative content of mitochondrial DNA in human lung. FEBS Lett. 1998, 441, 292–296. [Google Scholar] [CrossRef]
- Lee, C.F.; Liu, C.Y.; Hsieh, R.H.; Wei, Y.H. Oxidative stress-induced depolymerization of microtubules and alteration of mitochondrial mass in human cells. Ann. N. Y. Acad. Sci. 2005, 1042, 246–254. [Google Scholar] [CrossRef]
- Noack, H.; Bednarek, T.; Heidler, J.; Ladig, R.; Holtz, J.; Szibor, M. TFAM-dependent and independent dynamics of mtDNA levels in C2C12 myoblasts caused by redox stress. BBA-Gen. Subj. 2006, 1760, 141–150. [Google Scholar] [CrossRef] [PubMed]
- Ristow, M.; Zarse, K. How increased oxidative stress promotes longevity and metabolic health: The concept of mitochondrial hormesis (mitohormesis). Exp. Gerontol. 2010, 45, 410–418. [Google Scholar] [CrossRef]
- Malik, A.N.; Czajka, A. Is mitochondrial DNA content a potential biomarker of mitochondrial dysfunction? Mitochondrion 2013, 13, 481–492. [Google Scholar] [CrossRef] [PubMed]
- Sanyal, T.; Bhattacharjee, P.; Bhattacharjee, S. Hypomethylation of mitochondrial D-loop and ND6 with increased mitochondrial DNA copy number in the arsenic-exposed population. Toxicology 2018, 408, 54–61. [Google Scholar] [CrossRef]
- Pesce, V.; Cormio, A.; Fracasso, F.; Vecchiet, J.; Felzani, G.; Lezza, A.M.; Cantatore, P.; Gadaleta, M.N. Age-related mitochondrial genotypic and phenotypic alterations in human skeletal muscle. Free Radic. Biol. Med. 2001, 30, 1223–1233. [Google Scholar] [CrossRef]
- Malik, A.N.; Parsade, C.K.; Ajaz, S.; Crosby-Nwaobi, R.; Gnudi, L.; Czajka, A.; Sivaprasad, S. Altered circulating mitochondrial DNA and increased inflammation in patients with diabetic retinopathy. Diabetes Res. Clin. Pract. 2015, 110, 257–265. [Google Scholar] [CrossRef] [PubMed]
- Starkov, A.A. The role of mitochondria in reactive oxygen species metabolism and signaling. Ann. N. Y. Acad. Sci. 2008, 1147, 37–52. [Google Scholar] [CrossRef] [PubMed]
- Olmos, Y.; Sanchez-Gomez, F.J.; Wild, B.; Garcia-Quintans, N.; Cabezudo, S.; Lamas, S.; Monsalve, M. SirT1 regulation of antioxidant genes is dependent on the formation of a FoxO3a/PGC-1alpha complex. Antioxid. Redox Signal. 2013, 19, 1507–1521. [Google Scholar] [CrossRef]
- Picca, A.; Lezza, A.M.S.; Leeuwenburgh, C.; Pesce, V.; Calvani, R.; Bossola, M.; Manes-Gravina, E.; Landi, F.; Bernabei, R.; Marzetti, E. Circulating Mitochondrial DNA at the Crossroads of Mitochondrial Dysfunction and Inflammation During Aging and Muscle Wasting Disorders. Rejuvenation Res. 2018, 21, 350–359. [Google Scholar] [CrossRef]
- Santos, R.X.; Correia, S.C.; Zhu, X.; Smith, M.A.; Moreira, P.I.; Castellani, R.J.; Nunomura, A.; Perry, G. Mitochondrial DNA oxidative damage and repair in aging and Alzheimer’s disease. Antioxid. Redox Signal. 2013, 18, 2444–2457. [Google Scholar] [CrossRef]
- Chimienti, G.; Picca, A.; Sirago, G.; Fracasso, F.; Calvani, R.; Bernabei, R.; Russo, F.; Carter, C.S.; Leeuwenburgh, C.; Pesce, V.; et al. Increased TFAM binding to mtDNA damage hot spots is associated with mtDNA loss in aged rat heart. Free Radic. Biol. Med. 2018, 124, 447–453. [Google Scholar] [CrossRef]
- Pastukh, V.M.; Gorodnya, O.M.; Gillespie, M.N.; Ruchko, M.V. Regulation of mitochondrial genome replication by hypoxia: The role of DNA oxidation in D-loop region. Free Radic. Biol. Med. 2016, 96, 78–88. [Google Scholar] [CrossRef] [PubMed]
- Hanna, R.; Crowther, J.M.; Bulsara, P.A.; Wang, X.; Moore, D.J.; Birch-Machin, M.A. Optimised detection of mitochondrial DNA strand breaks. Mitochondrion 2018, in press. [Google Scholar] [CrossRef]
- Santos, J.H.; Meyer, J.N.; Mandavilli, B.S.; Van Houten, B. Quantitative PCR-based measurement of nuclear and mitochondrial DNA damage and repair in mammalian cells. Methods Mol. Biol. 2006, 314, 183–199. [Google Scholar] [PubMed]
- Sikorsky, J.A.; Primerano, D.A.; Fenger, T.W.; Denvir, J. DNA damage reduces Taq DNA polymerase fidelity and PCR amplification efficiency. Biochem. Biophys. Res. Commun. 2007, 355, 431–437. [Google Scholar] [CrossRef]
- Yoshida, Y.; Izumi, H.; Ise, T.; Uramoto, H.; Torigoe, T.; Ishiguchi, H.; Murakami, T.; Tanabe, M.; Nakayama, Y.; Itoh, H.; et al. Human mitochondrial transcription factor A binds preferentially to oxidatively damaged DNA. Biochem. Biophys. Res. Commun. 2002, 295, 945–951. [Google Scholar] [CrossRef]
- Bestwick, M.L.; Shadel, G.S. Accessorizing the human mitochondrial transcription machinery. Trends Biochem. Sci. 2013, 38, 283–291. [Google Scholar] [CrossRef] [PubMed]
- Drago, S.; El Asmar, R.; di Pierro, M.; Grazia Clemente, M.; Tripathi, A.; Sapone, A.; Thakar, M.; Iacono, G.; Carroccio, A.; D’Agate, C.; et al. Gliadin, zonulin and gut permeability: Effects on celiac and non-celiac intestinal mucosa and intestinal cell lines. Scand. J. Gastroenterol. 2006, 41, 408–419. [Google Scholar] [CrossRef]
- Rai, Y.; Pathak, R.; Kumari, N.; Sah, D.K.; Pandey, S.; Kalra, N.; Soni, R.; Dwarakanath, B.S.; Bhatt, A.N. Mitochondrial biogenesis and metabolic hyperactivation limits the application of MTT assay in the estimation of radiation induced growth inhibition. Sci. Rep. 2018, 8, 1531. [Google Scholar] [CrossRef] [PubMed]
- Picca, A.; Pesce, V.; Fracasso, F.; Joseph, A.M.; Leeuwenburgh, C.; Lezza, A.M. Aging and calorie restriction oppositely affect mitochondrial biogenesis through TFAM binding at both origins of mitochondrial DNA replication in rat liver. PLoS ONE 2013, 8, e74644. [Google Scholar] [CrossRef] [PubMed]
- Rothfuss, O.; Gasser, T.; Patenge, N. Analysis of differential DNA damage in the mitochondrial genome employing a semi-long run real-time PCR approach. Nucleic Acids Res. 2010, 38, e24. [Google Scholar] [CrossRef] [PubMed]
- Spinelli, J.B.; Haigis, M.C. The multifaceted contributions of mitochondria to cellular metabolism. Nat. Cell Biol. 2018, 20, 745–754. [Google Scholar] [CrossRef] [PubMed]


| Primer Set | Forward Primer | Reverse Primer | (nps) | (nps) |
|---|---|---|---|---|
| mtDNA | 5′ ACGCCATAAAACTCTTCACCAAAG 3′ | 5′ GGGTTCATAGTAGAAGAGCGATGG 3′ | 3,458–3,481 | 3,568–3,545 |
| β-actin | 5′ TTGGCAATGAGCGGTTCC 3′ | 5′ AGCACTGTGTTGGCGTAC 3′ | 124-141 | 271-254 |
| ND1/2 long | 5′ CCCTTCGCCCTATTCTTCAT 3′ | 5′ GCGTAGCTGGGTTTGGTTTA 3′ | 3,961-3,980 | 4,997-4978 |
| ND1/2 short | 5′ CCCTTCGCCCTATTCTTCAT 3′ | 5′ GGAAGATTGTAGTGGTGAGGGT 3′ | 3,961-3,980 | 4,033-4012 |
| Ori-L long | 5′ CAGCTAAGCACCCTAATCAACTGG 3′ | 5′ TGGGAGATTATTCCGAAGCCTG 3′ | 5,696-5,719 | 6,670-6,649 |
| Ori-L short | 5′ CAGCTAAGCACCCTAATCAACTGG 3′ | 5′ CTTCAAACCTGCCGGGGCT 3′ | 5,696-5,719 | 5,780-5,762 |
| D-loop long | 5′ CTGTTCTTTCATGGGGAAGC 3′ | 5′ AAAGTGCATACCGCCAAAAG 3′ | 16,021-16,040 | 424-405 |
| D-loop short | 5′ CCCTAACACCAGCCTAACCA 3′ | 5′ AAAGTGCATACCGCCAAAAG 3′ | 370-389 | 424-405 |
© 2019 by the authors. Licensee MDPI, Basel, Switzerland. This article is an open access article distributed under the terms and conditions of the Creative Commons Attribution (CC BY) license (http://creativecommons.org/licenses/by/4.0/).
Share and Cite
Orlando, A.; Chimienti, G.; Pesce, V.; Fracasso, F.; Lezza, A.M.S.; Russo, F. An In Vitro Study on Mitochondrial Compensatory Response Induced by Gliadin Peptides in Caco-2 Cells. Int. J. Mol. Sci. 2019, 20, 1862. https://0-doi-org.brum.beds.ac.uk/10.3390/ijms20081862
Orlando A, Chimienti G, Pesce V, Fracasso F, Lezza AMS, Russo F. An In Vitro Study on Mitochondrial Compensatory Response Induced by Gliadin Peptides in Caco-2 Cells. International Journal of Molecular Sciences. 2019; 20(8):1862. https://0-doi-org.brum.beds.ac.uk/10.3390/ijms20081862
Chicago/Turabian StyleOrlando, Antonella, Guglielmina Chimienti, Vito Pesce, Flavio Fracasso, Angela Maria Serena Lezza, and Francesco Russo. 2019. "An In Vitro Study on Mitochondrial Compensatory Response Induced by Gliadin Peptides in Caco-2 Cells" International Journal of Molecular Sciences 20, no. 8: 1862. https://0-doi-org.brum.beds.ac.uk/10.3390/ijms20081862