Rapid Morphological and Cytoskeletal Response to Microgravity in Human Primary Macrophages


Abstract
:1. Introduction
2. Results
3. Discussion
4. Materials and Methods
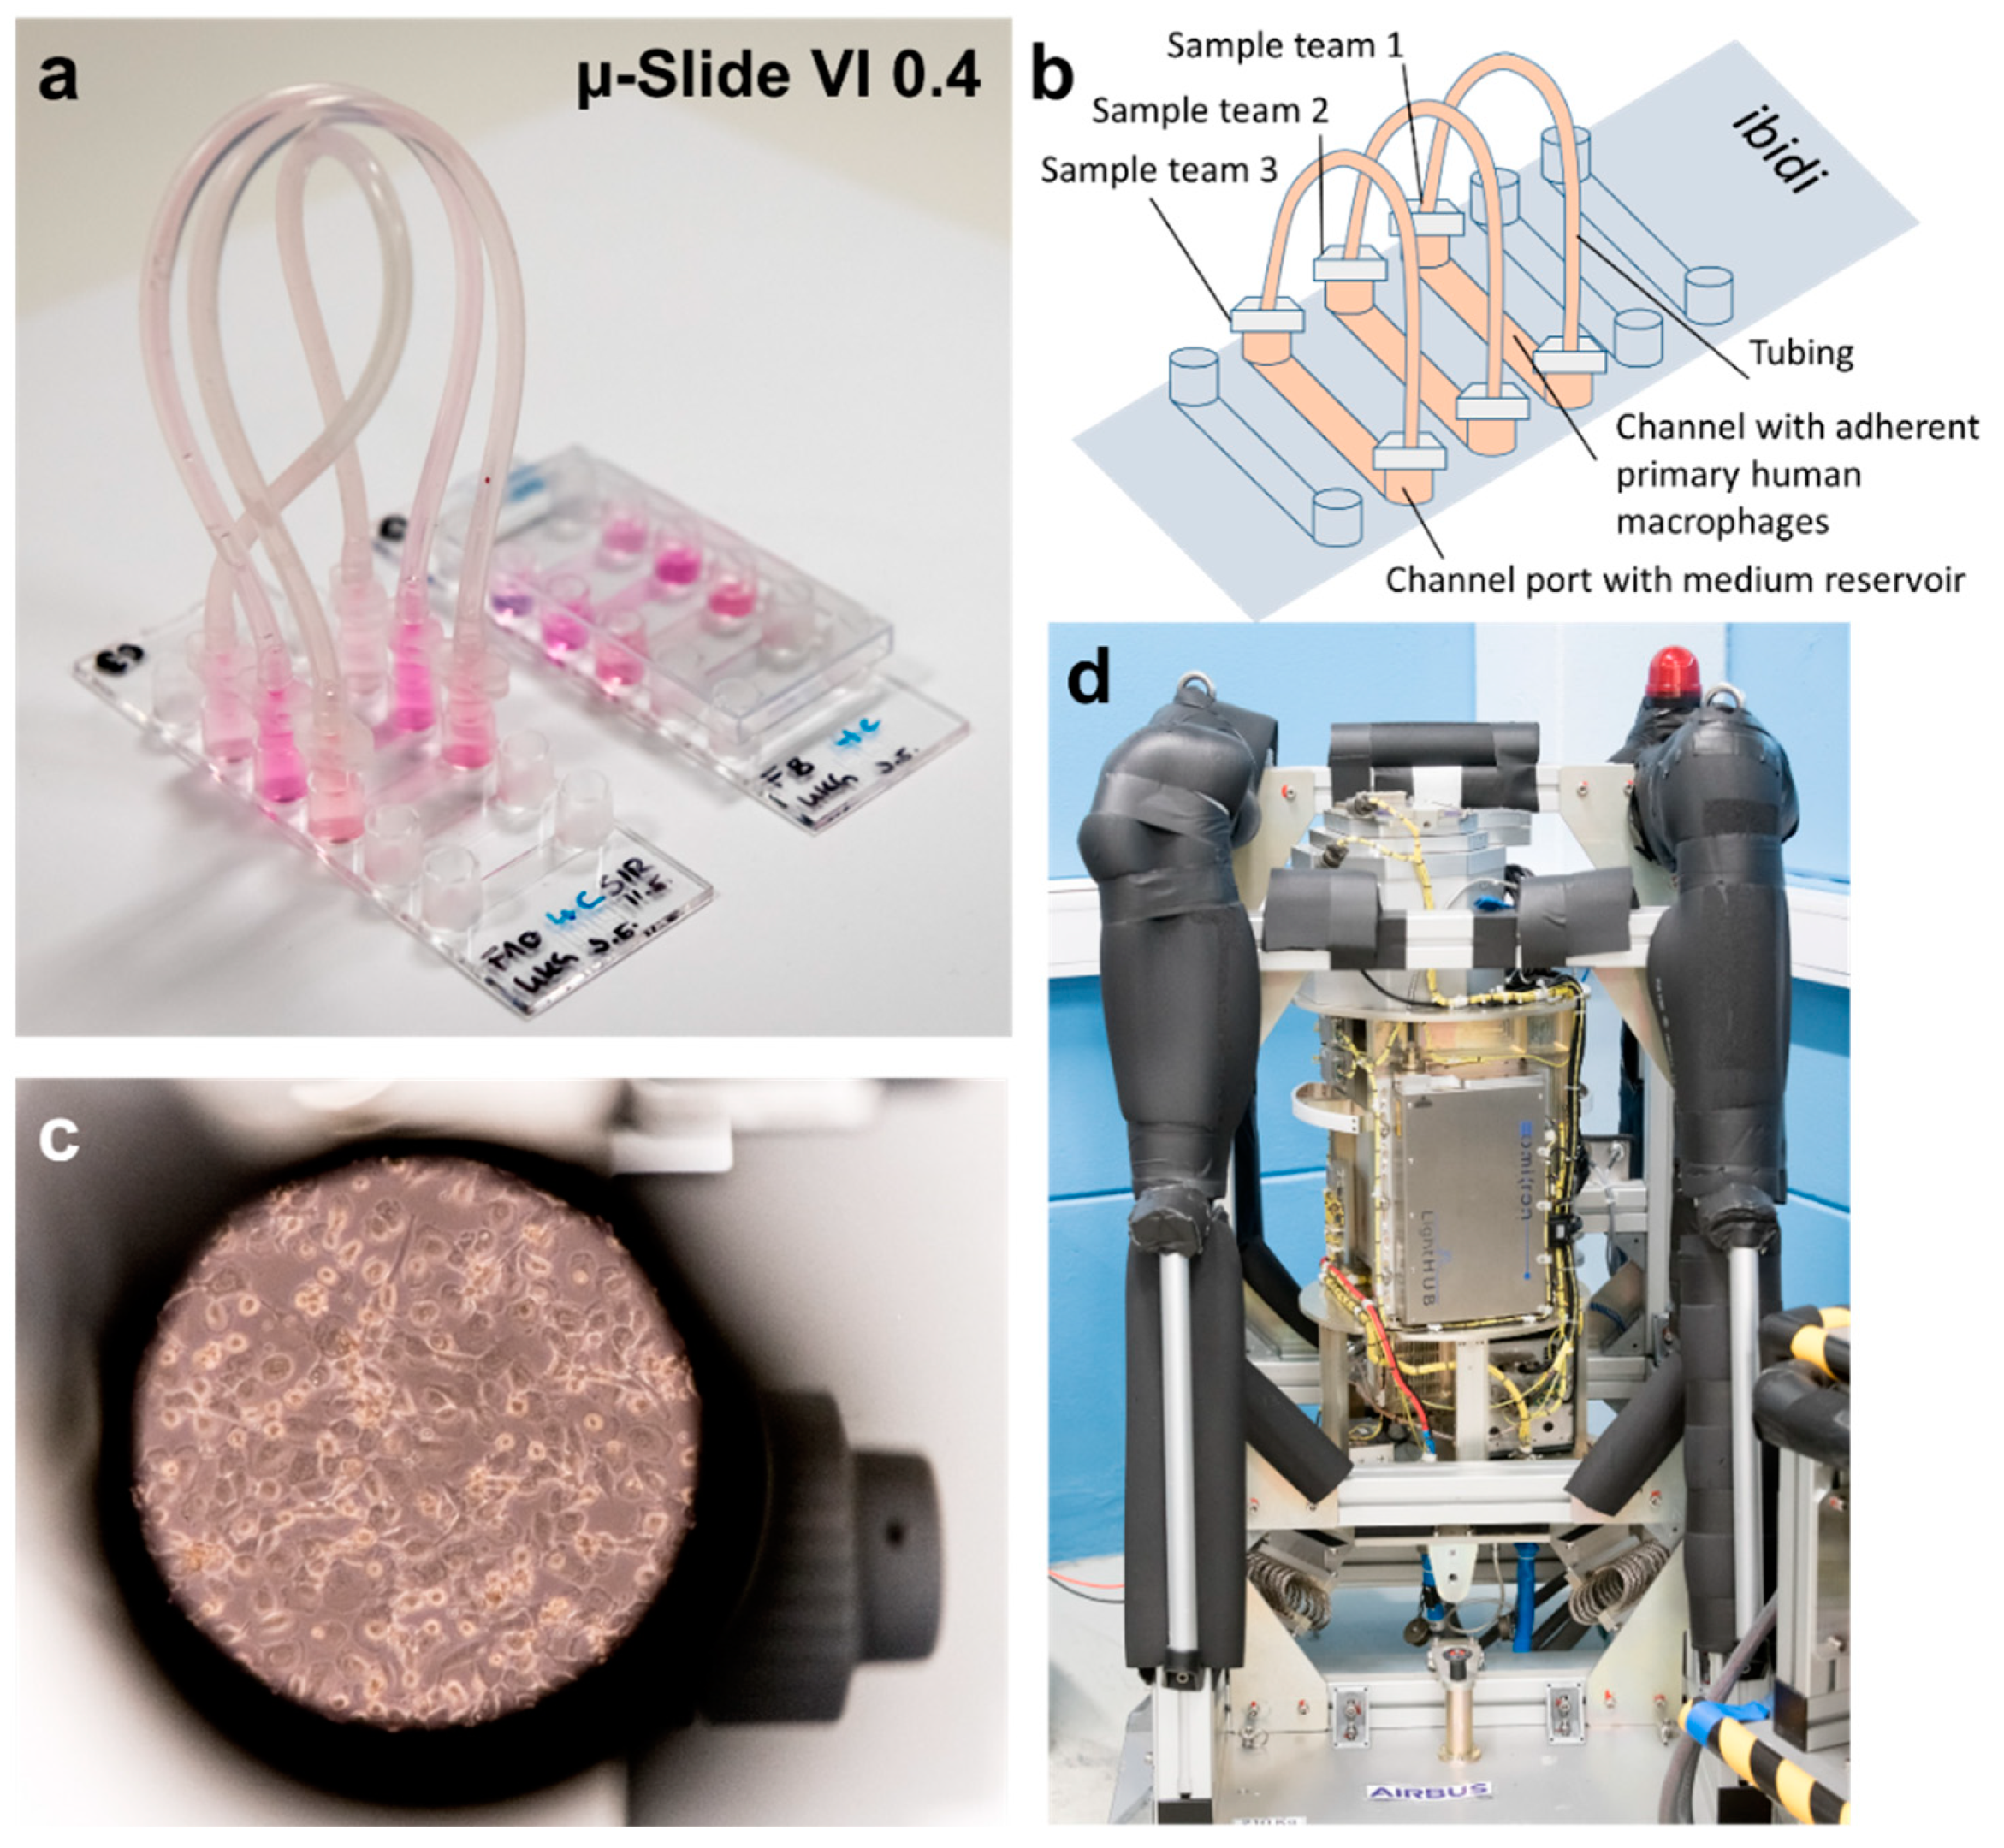
4.1. FLUMIAS Confocal Laser Spinning Disk Fluorescence Microscope
4.2. Isolation of Monocytes
4.3. Differentiation of Primary Human Macrophages
4.4. Experiment Preparation Protocol and Mission Scenario
4.5. TEXUS-54 Suborbital Ballistic Rocket Mission Profile
4.6. Post-Flight Measurements
4.7. Quantitative Analysis of Microscopic Images
4.8. Bleaching Correction
4.9. Statistical Analysis
Supplementary Materials
Author Contributions
Funding
Acknowledgments
Conflicts of Interest
Abbreviations
| Airbus DS | Airbus Defense and Space |
| FLUMIAS | Fluorescence-Microscopic Analyses System for Life-Cell-Imaging in Space |
| TEXUS | German: Technologische Experimente unter Schwerelosigkeit |
| DLR | German Aerospace Center |
| ESRANGE | European Space and Sounding Rocket Range |
| MFI | Mean Fluorescence Intensity |
| MIP | Maximum Intensity Projection |
| MORABA | DLR Mobile Rocket Base |
| ROI | Region of Interest |
| SEM | Standard Error of the Mean |
| SSC | Swedish Space Cooperation |
References
- Elliott, M.R.; Ravichandran, K.S. Clearance of apoptotic cells: Implications in health and disease. J. Cell Biol. 2010, 189, 1059–1070. [Google Scholar] [CrossRef]
- Ravichandran, K.S. Beginnings of a good apoptotic meal: The find-me and eat-me signaling pathways. Immunity 2011, 35, 445–455. [Google Scholar] [CrossRef]
- Limouse, M.; Manie, S.; Konstantinova, I.; Ferrua, B.; Schaffar, L. Inhibition of phorbol ester-induced cell activation in microgravity. Exp. Cell Res. 1991, 197, 82–86. [Google Scholar] [CrossRef]
- Schmitt, D.A.; Hatton, J.P.; Emond, C.; Chaput, D.; Paris, H.; Levade, T.; Cazenave, J.P.; Schaffar, L. The distribution of protein kinase C in human leukocytes is altered in microgravity. FASEB J. 1996, 10, 1627–1634. [Google Scholar] [CrossRef]
- Hughes-Fulford, M.; Chang, T.; Li, C.-F. Effect of Gravity on Monocyte Differentiation. In Proceedings of the 10th ESA Life Sciences Symposium/29th Annual ISGP Meeting/24th Annual ASGSB Meeting/ELGRA Symposium “Life in Space for Life on Earth, Angers, France, 22–27 June 2008. [Google Scholar]
- Brungs, S.; Kolanus, W.; Hemmersbach, R. Syk phosphorylation—A gravisensitive step in macrophage signalling. Cell Commun. Signal. 2015, 13, 9. [Google Scholar] [CrossRef]
- Sambandam, Y.; Baird, K.L.; Stroebel, M.; Kowal, E.; Balasubramanian, S.; Reddy, S.V. Microgravity Induction of TRAIL Expression in Preosteoclast Cells Enhances Osteoclast Differentiation. Sci. Rep. 2016, 6, 25143. [Google Scholar] [CrossRef] [Green Version]
- Meloni, M.A.; Galleri, G.; Pippia, P.; Cogoli-Greuter, M. Cytoskeleton changes and impaired motility of monocytes at modelled low gravity. Protoplasma 2006, 229, 243–249. [Google Scholar] [CrossRef]
- Rijken, P.J.; de Groot, R.P.; Kruijer, W.; de Laat, S.W.; Verkleij, A.J.; Boonstra, J. Identification of specific gravity sensitive signal transduction pathways in human A431 carcinoma cells. Adv. Space Res. 1992, 12, 145–152. [Google Scholar] [CrossRef]
- Sciola, L.; Cogoli-Greuter, M.; Cogoli, A.; Spano, A.; Pippia, P. Influence of microgravity on mitogen binding and cytoskeleton in Jurkat cells. Adv. Space Res. 1999, 24, 801–805. [Google Scholar] [CrossRef]
- Corydon, T.J.; Kopp, S.; Wehland, M.; Braun, M.; Schütte, A.; Mayer, T.; Hülsing, T.; Oltmann, H.; Schmitz, B.; Hemmersbach, R. Alterations of the cytoskeleton in human cells in space proved by life-cell imaging. Sci. Rep. 2016, 6, 20043. [Google Scholar] [CrossRef] [Green Version]
- Lewis, M.L.; Reynolds, J.L.; Cubano, L.A.; Hatton, J.P.; Lawless, B.D.; Piepmeier, E.H. Spaceflight alters microtubules and increases apoptosis in human lymphocytes (Jurkat). FASEB J. 1998, 12, 1007–1018. [Google Scholar] [CrossRef] [Green Version]
- Vassy, J.; Portet, S.; Beil, M.; Millot, G.; Fauvel-Lafeve, F.; Karniguian, A.; Gasset, G.; Irinopoulou, T.; Calvo, F.; Rigaut, J.P.; et al. The effect of weightlessness on cytoskeleton architecture and proliferation of human breast cancer cell line MCF-7. FASEB J. 2001, 15, 1104–1106. [Google Scholar] [CrossRef]
- Yang, F.L.Y.; Ding, B.; Nie, J.; Wang, H.; Zhang, X. Reduced function and disassembled microtubules of cultured cardiomyocytes in spaceflight. Chin. Sci. Bull. 2008, 53, 1185–1192. [Google Scholar] [CrossRef]
- Lekka, M.; Laidler, P.; Gil, D.; Lekki, J.; Stachura, Z.; Hrynkiewicz, A.Z. Elasticity of normal and cancerous human bladder cells studied by scanning force microscopy. Eur. Biophys. J. 1999, 28, 312–316. [Google Scholar] [CrossRef]
- Guck, J.; Schinkinger, S.; Lincoln, B.; Wottawah, F.; Ebert, S.; Romeyke, M.; Lenz, D.; Erickson, H.M.; Ananthakrishnan, R.; Mitchell, D.; et al. Optical deformability as an inherent cell marker for testing malignant transformation and metastatic competence. Biophys. J. 2005, 88, 3689–3698. [Google Scholar] [CrossRef]
- Faria, E.C.; Ma, N.; Gazi, E.; Gardner, P.; Brown, M.; Clarke, N.W.; Snook, R.D. Measurement of elastic properties of prostate cancer cells using AFM. Analyst 2008, 133, 1498–1500. [Google Scholar] [CrossRef]
- Xu, W.; Mezencev, R.; Kim, B.; Wang, L.; McDonald, J.; Sulchek, T. Cell stiffness is a biomarker of the metastatic potential of ovarian cancer cells. PLoS ONE 2012, 7, e46609. [Google Scholar] [CrossRef]
- Lekka, M.; Pogoda, K.; Gostek, J.; Klymenko, O.; Prauzner-Bechcicki, S.; Wiltowska-Zuber, J.; Jaczewska, J.; Lekki, J.; Stachura, Z. Cancer cell recognition—Mechanical phenotype. Micron 2012, 43, 1259–1266. [Google Scholar] [CrossRef]
- Prabhune, M.; Belge, G.; Dotzauer, A.; Bullerdiek, J.; Radmacher, M. Comparison of mechanical properties of normal and malignant thyroid cells. Micron 2012, 43, 1267–1272. [Google Scholar] [CrossRef]
- Yamaguchi, H.; Condeelis, J. Regulation of the actin cytoskeleton in cancer cell migration and invasion. Biochim. Biophys. Acta 2007, 1773, 642–652. [Google Scholar] [CrossRef] [Green Version]
- Pachenari, M.; Seyedpour, S.M.; Janmaleki, M.; Babazadeh Shayan, S.; Taranejoo, S.; Hosseinkhani, H. Mechanical properties of cancer cytoskeleton depend on actin filaments to microtubules content: Investigating different grades of colon cancer cell lines. J. Biomech. 2014, 47, 373–379. [Google Scholar] [CrossRef]
- Tauber, S.; Lauber, B.A.; Paulsen, K.; Layer, L.E.; Lehmann, M.; Hauschild, S.; Shepherd, N.R.; Polzer, J.; Segerer, J.; Thiel, C.S.; et al. Cytoskeletal stability and metabolic alterations in primary human macrophages in long-term microgravity. PLoS ONE 2017, 12, e0175599. [Google Scholar] [CrossRef]
- Adrian, A.; Schoppmann, K.; Sromicki, J.; Brungs, S.; von der Wiesche, M.; Hock, B.; Kolanus, W.; Hemmersbach, R.; Ullrich, O. The oxidative burst reaction in mammalian cells depends on gravity. Cell Commun. Signal. 2013, 11, 98. [Google Scholar] [CrossRef]
- Thiel, C.S.; de Zelicourt, D.; Tauber, S.; Adrian, A.; Franz, M.; Simmet, D.M.; Schoppmann, K.; Hauschild, S.; Krammer, S.; Christen, M.; et al. Rapid adaptation to microgravity in mammalian macrophage cells. Sci. Rep. 2017, 7, 43. [Google Scholar] [CrossRef] [Green Version]
- Thiel, C.S.; Tauber, S.; Christoffel, S.; Huge, A.; Lauber, B.A.; Polzer, J.; Paulsen, K.; Lier, H.; Engelmann, F.; Schmitz, B.; et al. Rapid coupling between gravitational forces and the transcriptome in human myelomonocytic U937 cells. Sci. Rep. 2018, 8, 13267. [Google Scholar] [CrossRef]
- Armstrong, J.W.; Gerren, R.A.; Chapes, S.K. The effect of space and parabolic flight on macrophage hematopoiesis and function. Exp. Cell Res. 1995, 216, 160–168. [Google Scholar] [CrossRef]
- Ingber, D. How cells (might) sense microgravity. FASEB J. 1999, 13, S3–S15. [Google Scholar] [CrossRef]
- Vorselen, D.; Roos, W.H.; Mackintosh, F.C.; Wuite, G.J.; van Loon, J.J. The role of the cytoskeleton in sensing changes in gravity by nonspecialized cells. FASEB J. 2013. [Google Scholar] [CrossRef]
- Comet, B. Limiting Factors for Human Health and Performance: Microgravity and Reduced Gravity. Study on the Survivability and Adaptation of Humans to Long-Duration Interplanetary and Planetary Environments. Technical Note 2: Critical Assessments of the Limiting Factors for Human Health and Performance and Recommendation of Countermeasures. HUMEX-TN-002. 2001. Available online: https://www.dlr.de/me/PortalData/25/Resources/dokumente/publikationen/humex-summary.pdf (accessed on 15 May 2019).
- Frippiat, J.P.; Crucian, B.E.; de Quervain, D.J.; Grimm, D.; Montano, N.; Praun, S.; Roozendaal, B.; Schelling, G.; Thiel, M.; Ullrich, O.; et al. Towards human exploration of space: The THESEUS review series on immunology research priorities. NPJ Micrograv. 2016, 2, 16040. [Google Scholar] [CrossRef] [Green Version]
- Choukèr, A.U.O. The Immune System in Space: Are We Prepared? Springer International Publishing: Berlin, Germany, 2016. [Google Scholar]
- Thiel, C.S.; Lauber, B.A.; Polzer, J.; Ullrich, O. Time course of cellular and molecular regulation in the immune system in altered gravity: Progressive damage or adaptation? Rev. Hum. Space Explor. 2017, 5, 22–32. [Google Scholar] [CrossRef]
- Strohman, R.C. The coming Kuhnian revolution in biology. Nat. Biotechnol. 1997, 15, 194–200. [Google Scholar] [CrossRef] [Green Version]
- Coffey, D.S. Self-organization, complexity and chaos: The new biology for medicine. Nat. Med. 1998, 4, 882–885. [Google Scholar] [CrossRef]
- Sahl, S.J.; Hell, S.W.; Jakobs, S. Fluorescence nanoscopy in cell biology. Nat. Rev. Mol. Cell Biol. 2017, 18, 685–701. [Google Scholar] [CrossRef]
- Schermelleh, L.; Ferrand, A.; Huser, T.; Eggeling, C.; Sauer, M.; Biehlmaier, O.; Drummen, G.P.C. Super-resolution microscopy demystified. Nat. Cell Biol. 2019, 21, 72–84. [Google Scholar] [CrossRef]
- Balagopalan, L.; Sherman, E.; Barr, V.A.; Samelson, L.E. Imaging techniques for assaying lymphocyte activation in action. Nat. Rev. Immunol. 2011, 11, 21–33. [Google Scholar] [CrossRef]
- Anken, R.; Forster, A.; Baur, U.; Feucht, I.; Hilbig, R. Otolith asymmetry and kinetotic behaviour of fish at high-quality microgravity: A drop-tower experiment. Adv. Space Res. 2006, 38, 1032–1036. [Google Scholar] [CrossRef]
- Knie, M.; Schoppmann, K.; Eck, H.; Ribeiro, B.W.; Laforsch, C. The “Daphnia” Lynx Mark I Suborbital Flight Experiment: Hardware Qualification at the Drop Tower Bremen. Micrograv. Sci. Technol. 2016, 28, 345–349. [Google Scholar] [CrossRef]
- Lang, K.; Strell, C.; Niggemann, B.; Zänker, K.S.; Hilliger, A.; Engelmann, F.; Ullrich, O. Real-Time Video-Microscopy of Migrating Immune Cells in Altered Gravity During Parabolic Flights. Micrograv. Sci. Technol. 2010, 22, 63–69. [Google Scholar] [CrossRef]
- Blum, J.; Wurm, G.; Kempf, S.; Poppe, T.; Klahr, H.; Kozasa, T.; Rott, M.; Henning, T.; Dorschner, J.; Schrapler, R.; et al. Growth and form of planetary seedlings: Results from a microgravity aggregation experiment. Phys. Rev. Lett. 2000, 85, 2426–2429. [Google Scholar] [CrossRef]
- Strauch, S.M.; Richter, P.; Schuster, M.; Hader, D.P. The beating pattern of the flagellum of Euglena gracilis under altered gravity during parabolic flights. J. Plant Physiol. 2010, 167, 41–46. [Google Scholar] [CrossRef]
- Ferl, R.J.; Paul, A.L. The effect of spaceflight on the gravity-sensing auxin gradient of roots: GFP reporter gene microscopy on orbit. NPJ Micrograv. 2016, 2, 15023. [Google Scholar] [CrossRef] [Green Version]
- Flores, L.R.; Keeling, M.C.; Zhang, X.; Sliogeryte, K.; Gavara, N. Lifeact-GFP alters F-actin organization, cellular morphology and biophysical behaviour. Sci. Rep. 2019, 9, 3241. [Google Scholar] [CrossRef]
- Lukinavicius, G.; Reymond, L.; D’Este, E.; Masharina, A.; Gottfert, F.; Ta, H.; Guther, A.; Fournier, M.; Rizzo, S.; Waldmann, H.; et al. Fluorogenic probes for live-cell imaging of the cytoskeleton. Nat. Methods 2014, 11, 731–733. [Google Scholar] [CrossRef]
- Rodionova, N.V.; Oganov, V.S.; Zolotova, N.V. Ultrastructural changes in osteocytes in microgravity conditions. Adv. Space Res. 2002, 30, 765–770. [Google Scholar] [CrossRef]
- Guignandon, A.; Vico, L.; Alexandre, C.; Lafage-Proust, M.H. Shape changes of osteoblastic cells under gravitational variations during parabolic flight--relationship with PGE2 synthesis. Cell Struct. Funct. 1995, 20, 369–375. [Google Scholar] [CrossRef]
- Guignandon, A.; Usson, Y.; Laroche, N.; Lafage-Proust, M.H.; Sabido, O.; Alexandre, C.; Vico, L. Effects of intermittent or continuous gravitational stresses on cell-matrix adhesion: Quantitative analysis of focal contacts in osteoblastic ROS 17/2.8 cells. Exp. Cell Res. 1997, 236, 66–75. [Google Scholar] [CrossRef]
- Guignandon, A.; Akhouayri, O.; Usson, Y.; Rattner, A.; Laroche, N.; Lafage-Proust, M.-H.; Alexandre, C.; Vico, L. Focal contact clustering in osteoblastic cells under mechanical stresses: Microgravity and cyclic deformation. Cell Commun. Adhesion 2003, 10, 69–83. [Google Scholar] [CrossRef]
- Hughes-Fulford, M.; Lewis, M.L. Effects of microgravity on osteoblast growth activation. Exp. Cell Res. 1996, 224, 103–109. [Google Scholar] [CrossRef]
- Meloni, M.A.; Galleri, G.; Pani, G.; Saba, A.; Pippia, P.; Cogoli-Greuter, M. Space flight affects motility and cytoskeletal structures in human monocyte cell line J-111. Cytoskeleton 2011, 68, 125–137. [Google Scholar] [CrossRef]
- Grimm, D.; Wise, P.; Lebert, M.; Richter, P.; Baatout, S. How and why does the proteome respond to microgravity? Expert Rev. Proteom. 2011, 8, 13–27. [Google Scholar] [CrossRef]
- Ulbrich, C.; Pietsch, J.; Grosse, J.; Wehland, M.; Schulz, H.; Saar, K.; Hübner, N.; Hauslage, J.; Hemmersbach, R.; Braun, M. Differential gene regulation under altered gravity conditions in follicular thyroid cancer cells: Relationship between the extracellular matrix and the cytoskeleton. Cell. Physiol. Biochem. 2011, 28, 185–198. [Google Scholar] [CrossRef] [PubMed]
- Schatten, H.; Lewis, M.L.; Chakrabarti, A. Spaceflight and clinorotation cause cytoskeleton and mitochondria changes and increases in apoptosis in cultured cells. Acta Astronaut. 2001, 49, 399–418. [Google Scholar] [CrossRef]
- Vassy, J.; Portet, S.; Beil, M.; Millot, G.; Fauvel-Lafeve, F.; Gasset, G.; Schoevaert, D. Weightlessness acts on human breast cancer cell line MCF-7. Adv. Space Res. 2003, 32, 1595–1603. [Google Scholar] [CrossRef]
- Guignandon, A.; Akhouayri, O.; Laroche, N.; Lafage-Proust, M.-H.; Alexandre, C.; Vico, L. Focal contacts organization in osteoblastic cells under microgravity and cyclic deformation conditions. Adv. Space Res. 2003, 32, 1561–1567. [Google Scholar] [CrossRef]
- Nabavi, N.; Khandani, A.; Camirand, A.; Harrison, R.E. Effects of microgravity on osteoclast bone resorption and osteoblast cytoskeletal organization and adhesion. Bone 2011, 49, 965–974. [Google Scholar] [CrossRef]
- Aleshcheva, G.; Wehland, M.; Sahana, J.; Bauer, J.; Corydon, T.J.; Hemmersbach, R.; Frett, T.; Egli, M.; Infanger, M.; Grosse, J. Moderate alterations of the cytoskeleton in human chondrocytes after short-term microgravity produced by parabolic flight maneuvers could be prevented by up-regulation of BMP-2 and SOX-9. FASEB J. 2015, 29, 2303–2314. [Google Scholar] [CrossRef] [Green Version]
- Ulanova, A.; Gritsyna, Y.; Vikhlyantsev, I.; Salmov, N.; Bobylev, A.; Abdusalamova, Z.; Rogachevsky, V.; Shenkman, B.; Podlubnaya, Z. Isoform composition and gene expression of thick and thin filament proteins in striated muscles of mice after 30-day space flight. BioMed Res. Int. 2015, 2015, 104735. [Google Scholar] [CrossRef]
- Papaseit, C.; Pochon, N.; Tabony, J. Microtubule self-organization is gravity-dependent. Proc. Natl. Acad. Sci. USA 2000, 97, 8364–8368. [Google Scholar] [CrossRef] [Green Version]
- Masiello, M.G.; Cucina, A.; Proietti, S.; Palombo, A.; Coluccia, P.; D’Anselmi, F.; Dinicola, S.; Pasqualato, A.; Morini, V.; Bizzarri, M. Phenotypic switch induced by simulated microgravity on MDA-MB-231 breast cancer cells. BioMed Res. Int. 2014, 2014, 652434. [Google Scholar] [CrossRef]
- Kopp, S.; Slumstrup, L.; Corydon, T.J.; Sahana, J.; Aleshcheva, G.; Islam, T.; Magnusson, N.E.; Wehland, M.; Bauer, J.; Infanger, M.; et al. Identifications of novel mechanisms in breast cancer cells involving duct-like multicellular spheroid formation after exposure to the Random Positioning Machine. Sci. Rep. 2016, 6, 26887. [Google Scholar] [CrossRef] [Green Version]
- Grimm, D.; Wehland, M.; Pietsch, J.; Aleshcheva, G.; Wise, P.; van Loon, J.; Ulbrich, C.; Magnusson, N.E.; Infanger, M.; Bauer, J. Growing tissues in real and simulated microgravity: New methods for tissue engineering. Tissue Eng. Part B Rev. 2014, 20, 555–566. [Google Scholar] [CrossRef]
- Masiello, M.G.; Verna, R.; Cucina, A.; Bizzarri, M. Physical constraints in cell fate specification. A case in point: Microgravity and phenotypes differentiation. Prog. Biophys. Mol. Biol. 2018, 134, 55–67. [Google Scholar] [CrossRef]
- Guignandon, A.; Genty, C.; Vico, L.; Lafage-Proust, M.H.; Palle, S.; Alexandre, C. Demonstration of feasibility of automated osteoblastic line culture in space flight. Bone 1997, 20, 109–116. [Google Scholar] [CrossRef]
- Cogoli-Greuter, M.; Sciola, L.; Pippia, P.; Bechler, B.; Sechi, G.; Lorenzi, G.; Cogoli, A. Mitogen Binding, cytoskeleton patterns and motility of T lymphocytes in microgravity. In Life Sciences Experiments Performed on Sounding Rockets (1985-1994): TEXUS 11-32, MASER 3-6 MAXUS 1; ESA Publ.: Noordwijk, The Netherlands, 1997; p. 59. [Google Scholar]
- Zhang, Y.; Lu, T.; Wong, M.; Wang, X.; Stodieck, L.; Karouia, F.; Story, M.; Wu, H. Transient gene and microRNA expression profile changes of confluent human fibroblast cells in spaceflight. FASEB J. 2016, 30, 2211–2224. [Google Scholar] [CrossRef] [Green Version]
- Milroy, L.G.; Rizzo, S.; Calderon, A.; Ellinger, B.; Erdmann, S.; Mondry, J.; Verveer, P.; Bastiaens, P.; Waldmann, H.; Dehmelt, L.; et al. Selective chemical imaging of static actin in live cells. J. Am. Chem. Soc. 2012, 134, 8480–8486. [Google Scholar] [CrossRef]
- Lewis, M.L. The Cytosksleton in Spaceflown Cells: An Overview. Gravitat. Space Res. 2004, 17, 1–12. [Google Scholar]
- Hu, S.; Chen, J.; Butler, J.P.; Wang, N. Prestress mediates force propagation into the nucleus. Biochem. Biophys. Res. Commun. 2005, 329, 423–428. [Google Scholar] [CrossRef]
- Maniotis, A.J.; Chen, C.S.; Ingber, D.E. Demonstration of mechanical connections between integrins, cytoskeletal filaments, and nucleoplasm that stabilize nuclear structure. Proc. Natl. Acad. Sci. USA 1997, 94, 849–854. [Google Scholar] [CrossRef] [Green Version]
- Wang, N.; Tytell, J.D.; Ingber, D.E. Mechanotransduction at a distance: Mechanically coupling the extracellular matrix with the nucleus. Nat. Rev. Mol. Cell Biol. 2009, 10, 75–82. [Google Scholar] [CrossRef]
- Thorpe, S.D.; Lee, D.A. Dynamic regulation of nuclear architecture and mechanics-a rheostatic role for the nucleus in tailoring cellular mechanosensitivity. Nucleus 2017, 8, 287–300. [Google Scholar] [CrossRef]
- Wang, Y.; Nagarajan, M.; Uhler, C.; Shivashankar, G.V. Orientation and repositioning of chromosomes correlate with cell geometry-dependent gene expression. Mol. Biol. Cell 2017, 28, 1997–2009. [Google Scholar] [CrossRef]
- Versaevel, M.; Grevesse, T.; Gabriele, S. Spatial coordination between cell and nuclear shape within micropatterned endothelial cells. Nat. Commun. 2012, 3, 671. [Google Scholar] [CrossRef] [Green Version]
- Ramdas, N.M.; Shivashankar, G.V. Cytoskeletal control of nuclear morphology and chromatin organization. J. Mol. Biol. 2015, 427, 695–706. [Google Scholar] [CrossRef]
- Clément, G. Fundamentals of Space Medicine, 2nd ed.; Springer: Berlin, Germany, 2011. [Google Scholar]
- Uva, B.M.; Masini, M.A.; Sturla, M.; Prato, P.; Passalacqua, M.; Giuliani, M.; Tagliafierro, G.; Strollo, F. Clinorotation-induced weightlessness influences the cytoskeleton of glial cells in culture. Brain Res. 2002, 934, 132–139. [Google Scholar] [CrossRef]
- Brakenhoff, G.J.; Wurpel, G.W.; Jalink, K.; Oomen, L.; Brocks, L.; Zwier, J.M. Characterization of sectioning fluorescence microscopy with thin uniform fluorescent layers: Sectioned Imaging Property or SIPcharts. J. Microsc. 2005, 219, 122–132. [Google Scholar] [CrossRef] [Green Version]


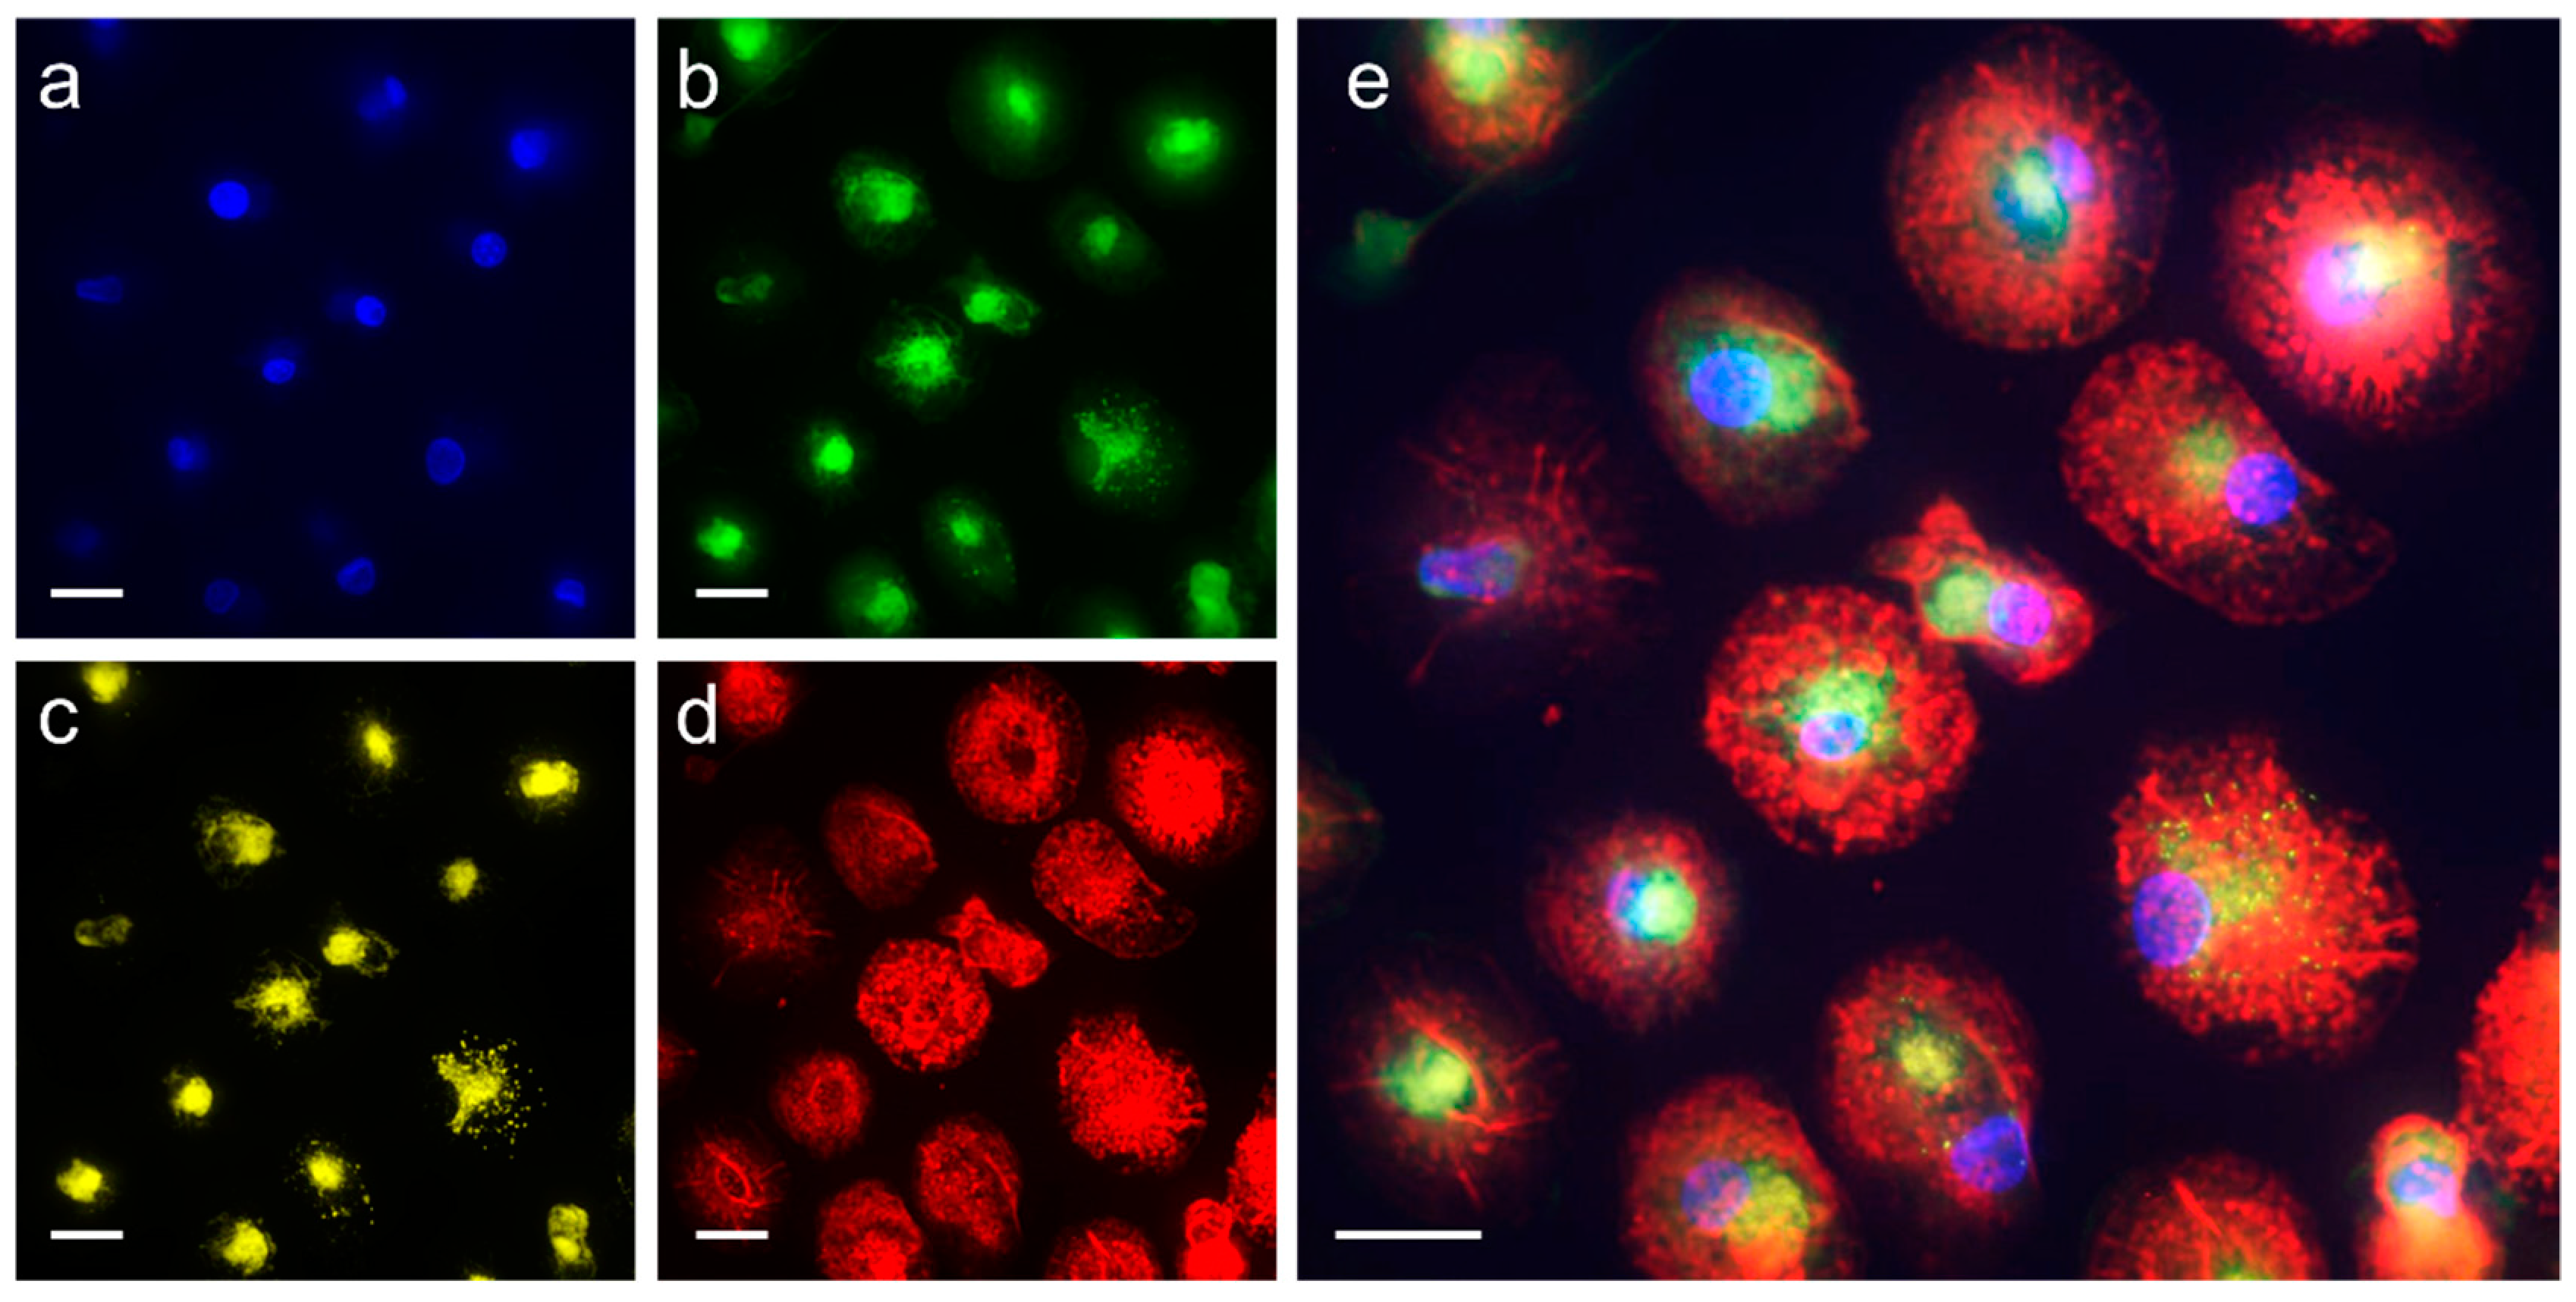
| Staining Dye | Cellular Organelle | Final Concentration | Staining Time before Lift-Off |
|---|---|---|---|
| SiR-actin | F-actin | 100 nM | 24 h |
| Calcein | Cytoplasm | 1 µM | 5.5 h |
| Nuclear Violet | Nuclei | 5 µM | 5.5 h |
| LysoBrite | Lysosomes | 0.5× | 5.5 h |
| Parameter | Value | Comment |
|---|---|---|
| Excitation wavelength [nm] | 405/488/561/642 | Cell organelle/structure visualized: nucleus/cytoplasm/lysosomes/F-actin |
| Exposure time [ms] | 15/15/50/50 | - |
| Laser intensity [%] | 100/100/20/100 | - |
| X/Y-step size [µm] | 10 | - |
| Z-step size [µm] | 1 | - |
| 1. Z-stack: Z-stack height [µm] | 90 | Reference run overview stack/in-flight overview stack |
| 1. Z-stack: Image-to-image distance [µm] | 1 | - |
| Image-# 1. Z-stack | 91 | - |
| Z-stack height [µm] | 25.28 | - |
| Image-to-image distance height [µm] | 0.32 | - |
| Image number per Z-stack | 80 | - |
| Number of Z-Stacks per acquisition | 1 | In total four acquisitions (t1–t4) with four wavelengths in-flight |
| Image-# per loop | 320 | four wavelengths each 80 images |
| Image-# per run | 1280 | four loops (t1–t4), each loop with four wavelengths each with 80 images |
| Acquisition time [s] | 21.58 | - |
| Working mode (nominal) | Z-Stack | - |
| Flight Phase | Image Stack Acquisition (Used Wavelength) | Time with Respect to Lift-Off | Comment |
|---|---|---|---|
| Pre-flight | Reference run overview stack (642 nm) | T-10 min | Pre-flight 1 g ground control |
| Pre-flight | Reference run (Ref_F) (405, 488, 561, 642 nm) | T-9 min | Pre-flight 1 g ground control |
| Lift off | - | T0 | - |
| Onset of microgravity | - | T+66 s | - |
| In-flight | Flight overview stack (642 nm) | T+70–85 s | 4–19 s microgravity |
| In-flight | Flight measurement t1 (t1_F) (405, 488, 561, 642 nm) | T+117–142 s | 51–76 s microgravity |
| In-flight | Flight measurement t2 (t2_F) (405, 488, 561, 642 nm) | T+192–217s | 126–151 s microgravity |
| In-flight | Flight measurement t3 (t3_F) (405, 488, 561, 642 nm) | T+267–292s | 201–226 s microgravity |
| In-flight | Flight measurement t4 (t4_F) (405, 488, 561, 642 nm) | T+342–367 s | 276–301 s microgravity |
| Post-flight | 3 Post-flight (PF) runs with five measurements each: Ref_PF, t1_PF, t2_PF t3_PF, t4_PF (405, 488, 561, 642 nm) | T+5 h–5 h 45 min | Post-flight 1 g ground control |
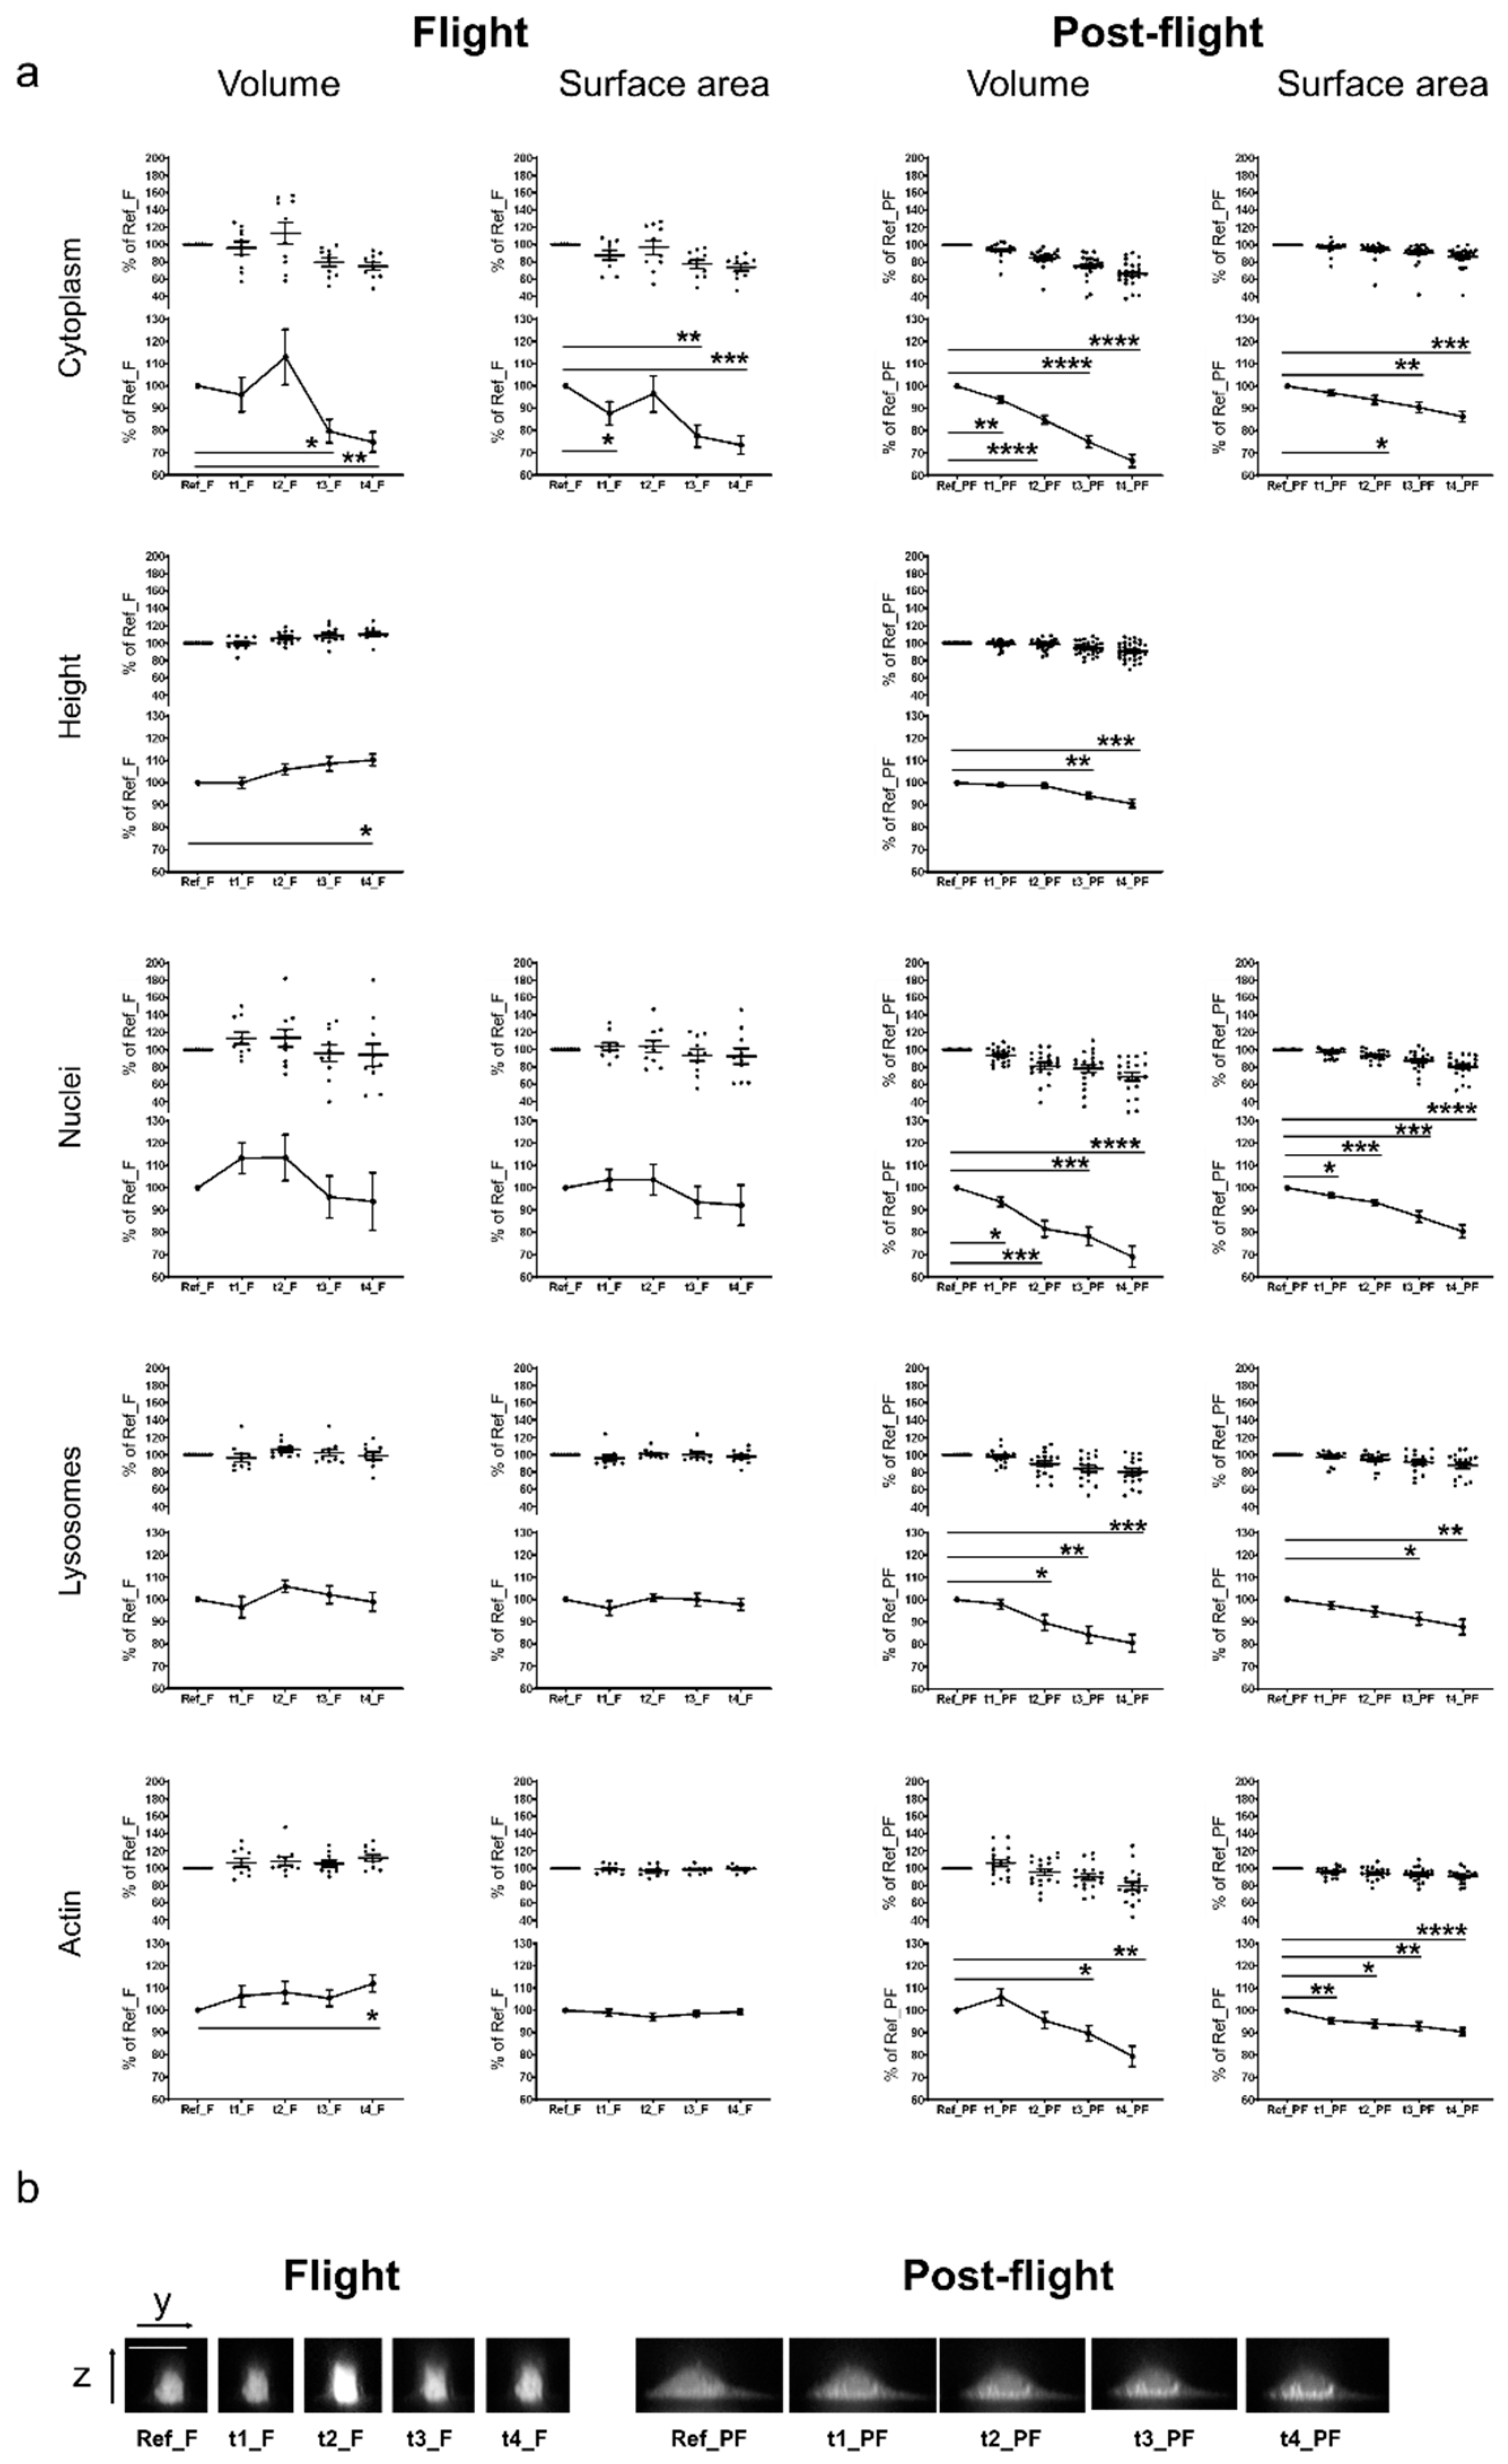
| Cellular Component | Volume | Surface Area | MIP | Height | Measurements/Time Points |
|---|---|---|---|---|---|
| Nuclei | x | x | - | - | 5 |
| Cytoplasm | x | x | - | x | 5 |
| Lysosomes | x | x | - | - | 5 |
| F-actin | x | x | x | - | 5/7 * |
| Effects on Cells, Cell-Organelles, and Cell-Structures | Cell Type | References | Microgravity Platform | Microgravity Exposure Time |
|---|---|---|---|---|
| Cell morphology | ||||
| Cytoplasmic retraction and membrane ruffling, decreased cell area | Osteosarcoma cells (ROS 17/2.8) | [48] | PF | 15 parabolas, 30 parabolas |
| Decreased cell area | Osteosarcoma cells (ROS 17/2.8) | [49] | PF | 15 parabolas, 30 parabolas |
| No shape change at two days microgravity | Osteosarcoma cells (ROS 17/2.8) | [66] | SF | two days |
| Shape change at 4 and 6 days microgravity: Round, increase in microvilli, three sub-groups of morphology (1) long cytoplasmic extensions; (2) round piling cells, unable to flatten; (3) normal spread out cells, resembling the ground controls | Osteosarcoma cells (ROS 17/2.8) | [66] | SF | four days, six days |
| Decrease of cell area, number of vinculin spots and mean vinculin spot area | Osteosarcoma cells (ROS 17/2.8) | [57] | SF | 12 h, 24 h |
| Decreased cell area, decreased number of vinculin spots per cell, decreased mean vinculin spot area, actin and focal adhesion decreased, fewer stress fibers, vimentin and microtubule network no major differences (12 h and 24 h) | Osteosarcoma cells (ROS 17/2.8) | [50] | SF | 12 h, 24 h |
| Contracted, roundish cell shape with short protrusions | J-111 cell line | [52] | SF | one day |
| Nuclear shape | ||||
| Reduced nuclei size by 30%, oblong shape, less punctate areas, actin cytoskeleton with a reduced number of stress fibers | MC3T3-E1 osteoblasts | [51] | SF | four days |
| High variability, many smaller and condensed and some fragmented nuclei, larger intact nuclei with larger diameter | Primary mouse osteoblasts, RAW 264.7 murine macrophage cell line | [58] | SF | five days |
| Other cellular organelles | ||||
| Increased cellular organelle volume of lysosome-like bodies, autophagosomes, Golgi complex, vacuoles and vesicles | Osteocytes, ileac crest of monkeys | [47] | SF | 14 days |
| Cytoskeleton | ||||
| Actin cytoskeleton with a reduced number of stress fibers perinuclear actin localization, lamellipodia | MC3T3-E1 osteoblasts | [51] | SF | four days |
| No changes in actin structure | Human Jurkat T cells | [10] | SR | 12 min |
| Localization of actin at cell border, contracted cell shape, changed the distribution of F-actin and tubulin filaments, no strong bundles, fewer lamellipodia | J-111 cell line | [52] | SF | one day |
| Accumulation of F-actin at the cell membrane, increase in F-actin around nucleus | Human endothelial cells | [53] | PF | one parabola |
| Rearrangement of the actin network, perinuclear clustering | ML-1 follicular thyroid cancer cells | [54] | PF | one parabola |
| Disturbance of actin bundles and cytoplasm discontinuity, disappearance of the microvilli or filopodia- and lamellipodia-like structures | follicular thyroid cancer cells FTC-133 | [11] | PF | 1–2 parabolas |
| Disturbance of actin bundles, formation of filopodia- and lamellipodia like structures, cellular detachment | follicular thyroid cancer cells FTC-133 | [11] | SR | six min |
| No changes of the actin and vimentin cytoskeleton structure | Primary human macrophages | [23] | SF | 11 days |
| Formation of thick vimentin and tubulin bundles, formation of aggregates of proteins, due to de-polymerization and discontinuities of the filamentous network | Human T lymphocytes from blood donations | [67] | SR | 30 s |
| Disorganization of microtubules | Human Jurkat T cells | [12] | SF | four h |
| Vimentin structural changes, increased appearance of large bundles | Human Jurkat T cells | [10] | SR | 12 min |
| No microtubule self-organization and local disorder | Purified tubulin from cow brains | [61] | SR | 13 min |
| Altered microtubule cytoskeleton after 4 h and partial re-organization after 48 h | Human Jurkat T cells | [55] | SF | four h, 48 h |
| Disoriented microtubule | Breast cancer MCF-7 | [56] | SF | 1.5 h |
| Presence of thicker, bundled microtubule, smaller focal adhesion size, reduced cortical actin, fewer actin stress fibers with reduced fiber thickness, a significant increase in cell area measured with phalloidin | Primary mouse osteoblasts, RAW 264.7 murine macrophage cell line | [58] | SF | five days |
| Disorganized sarcomeric structure with interfilament holes | C57BL/6N mice Cardiac muscle | [60] | SF | 30 days |
| Cell cytoplasm discontinuity, holes in the microtubule network, absence of stress fibers, actin network rearrangement and ring formation around the cell membrane | Human chondrocytes | [59] | PF | one parabola, 31 parabolas |
| No changes of the actin cytoskeleton structure | Primary humane fibroblasts | [68] | SF | three days, 14 days |
© 2019 by the authors. Licensee MDPI, Basel, Switzerland. This article is an open access article distributed under the terms and conditions of the Creative Commons Attribution (CC BY) license (http://creativecommons.org/licenses/by/4.0/).
Share and Cite
Thiel, C.S.; Tauber, S.; Lauber, B.; Polzer, J.; Seebacher, C.; Uhl, R.; Neelam, S.; Zhang, Y.; Levine, H.; Ullrich, O. Rapid Morphological and Cytoskeletal Response to Microgravity in Human Primary Macrophages. Int. J. Mol. Sci. 2019, 20, 2402. https://0-doi-org.brum.beds.ac.uk/10.3390/ijms20102402
Thiel CS, Tauber S, Lauber B, Polzer J, Seebacher C, Uhl R, Neelam S, Zhang Y, Levine H, Ullrich O. Rapid Morphological and Cytoskeletal Response to Microgravity in Human Primary Macrophages. International Journal of Molecular Sciences. 2019; 20(10):2402. https://0-doi-org.brum.beds.ac.uk/10.3390/ijms20102402
Chicago/Turabian StyleThiel, Cora Sandra, Svantje Tauber, Beatrice Lauber, Jennifer Polzer, Christian Seebacher, Rainer Uhl, Srujana Neelam, Ye Zhang, Howard Levine, and Oliver Ullrich. 2019. "Rapid Morphological and Cytoskeletal Response to Microgravity in Human Primary Macrophages" International Journal of Molecular Sciences 20, no. 10: 2402. https://0-doi-org.brum.beds.ac.uk/10.3390/ijms20102402