Green Tea Ameliorates Hyperglycemia by Promoting the Translocation of Glucose Transporter 4 in the Skeletal Muscle of Diabetic Rodents

Abstract
: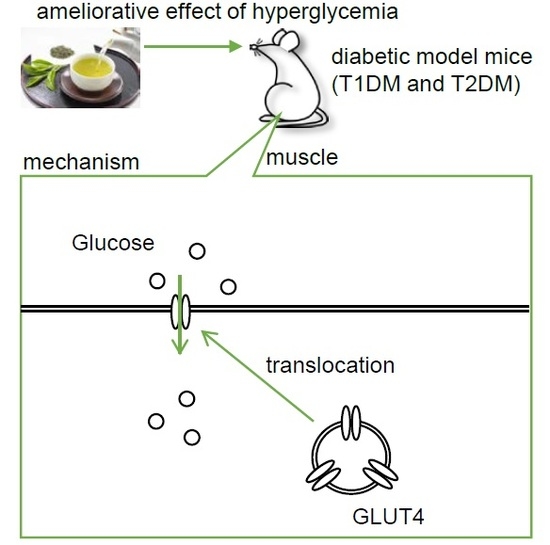
1. Introduction
2. Results
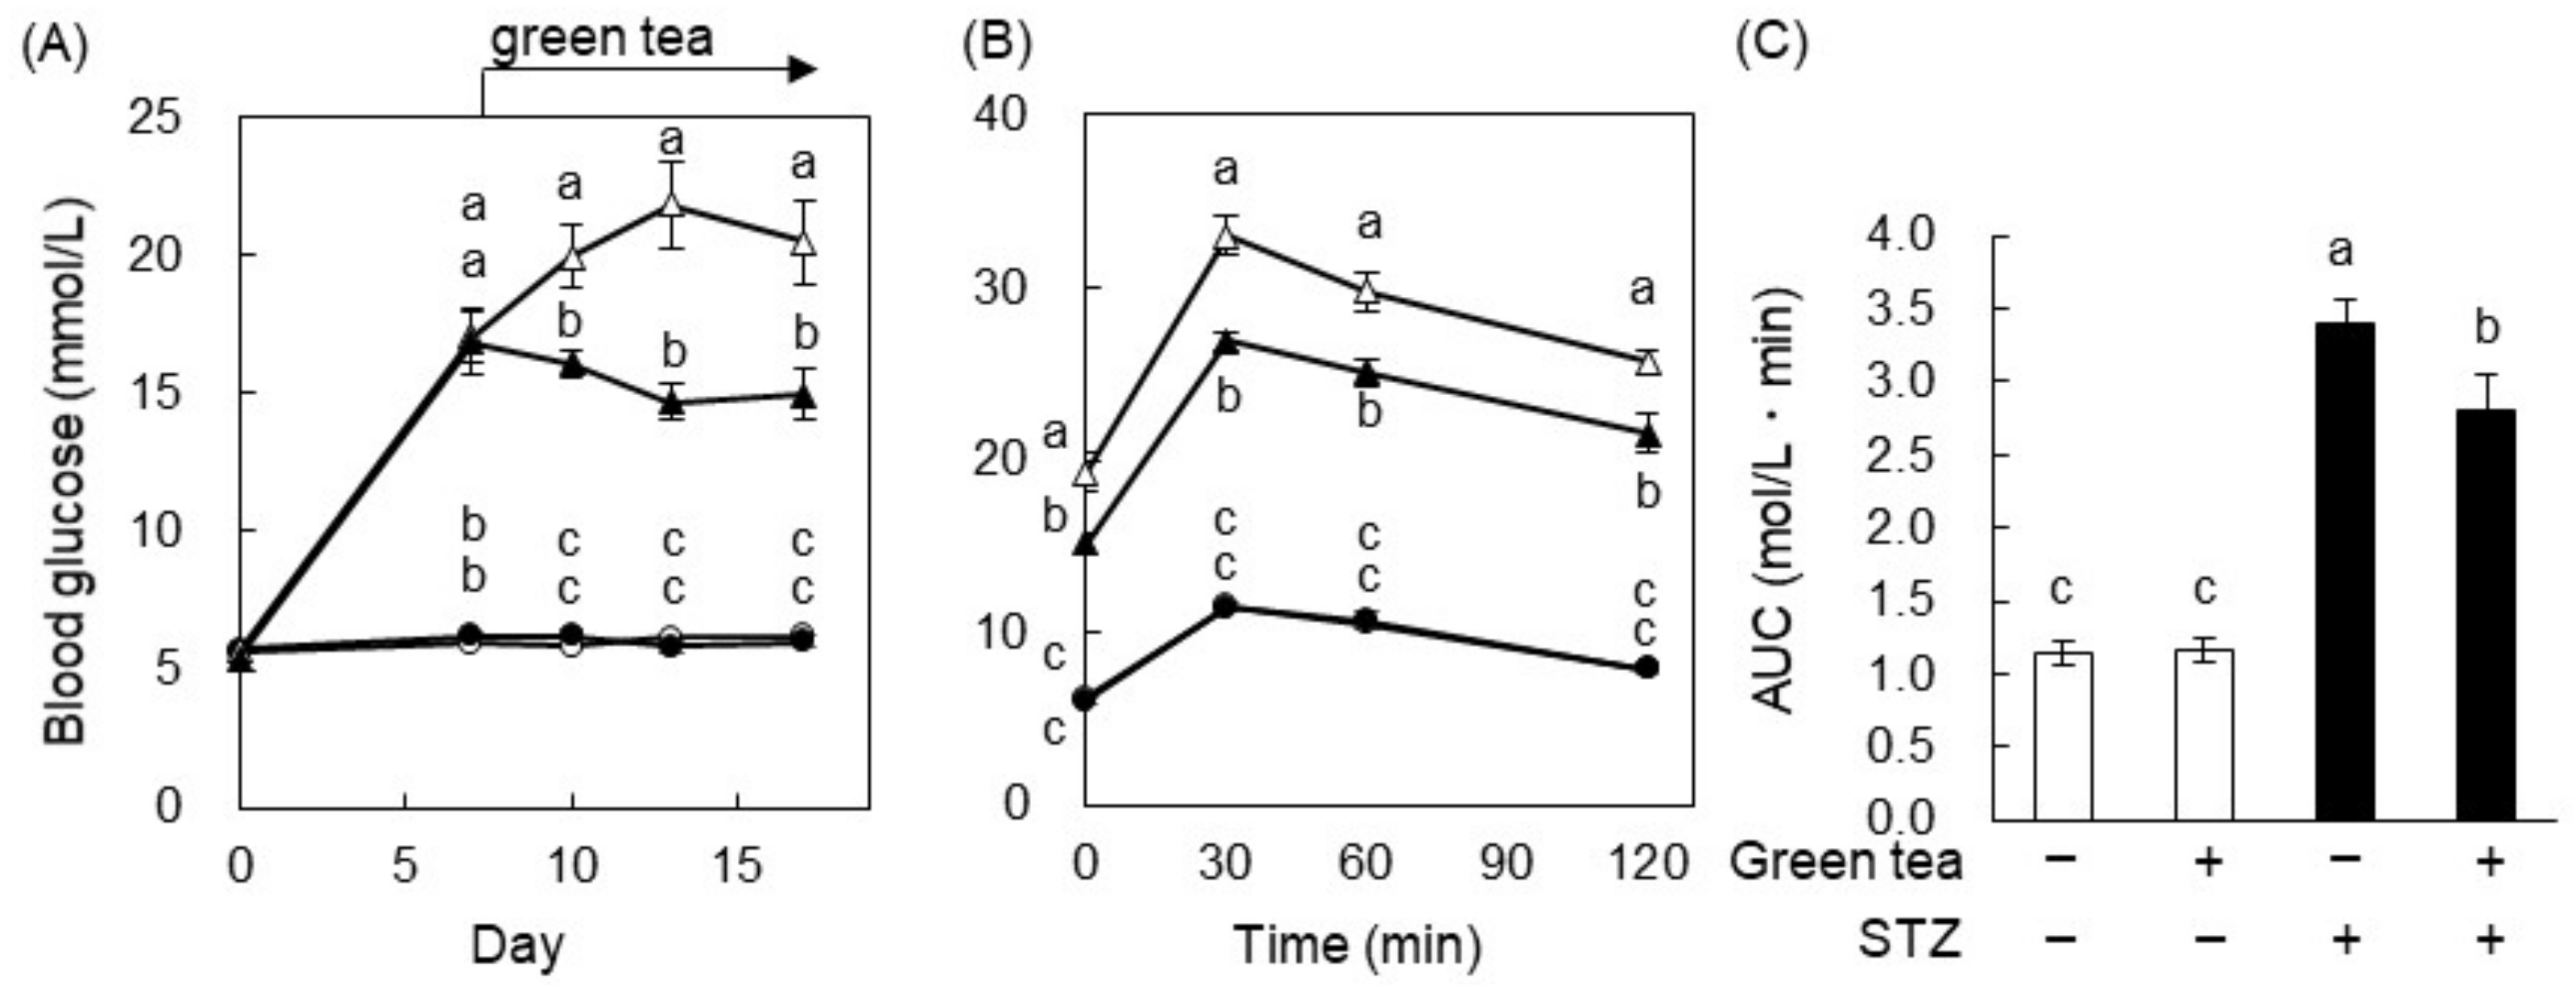
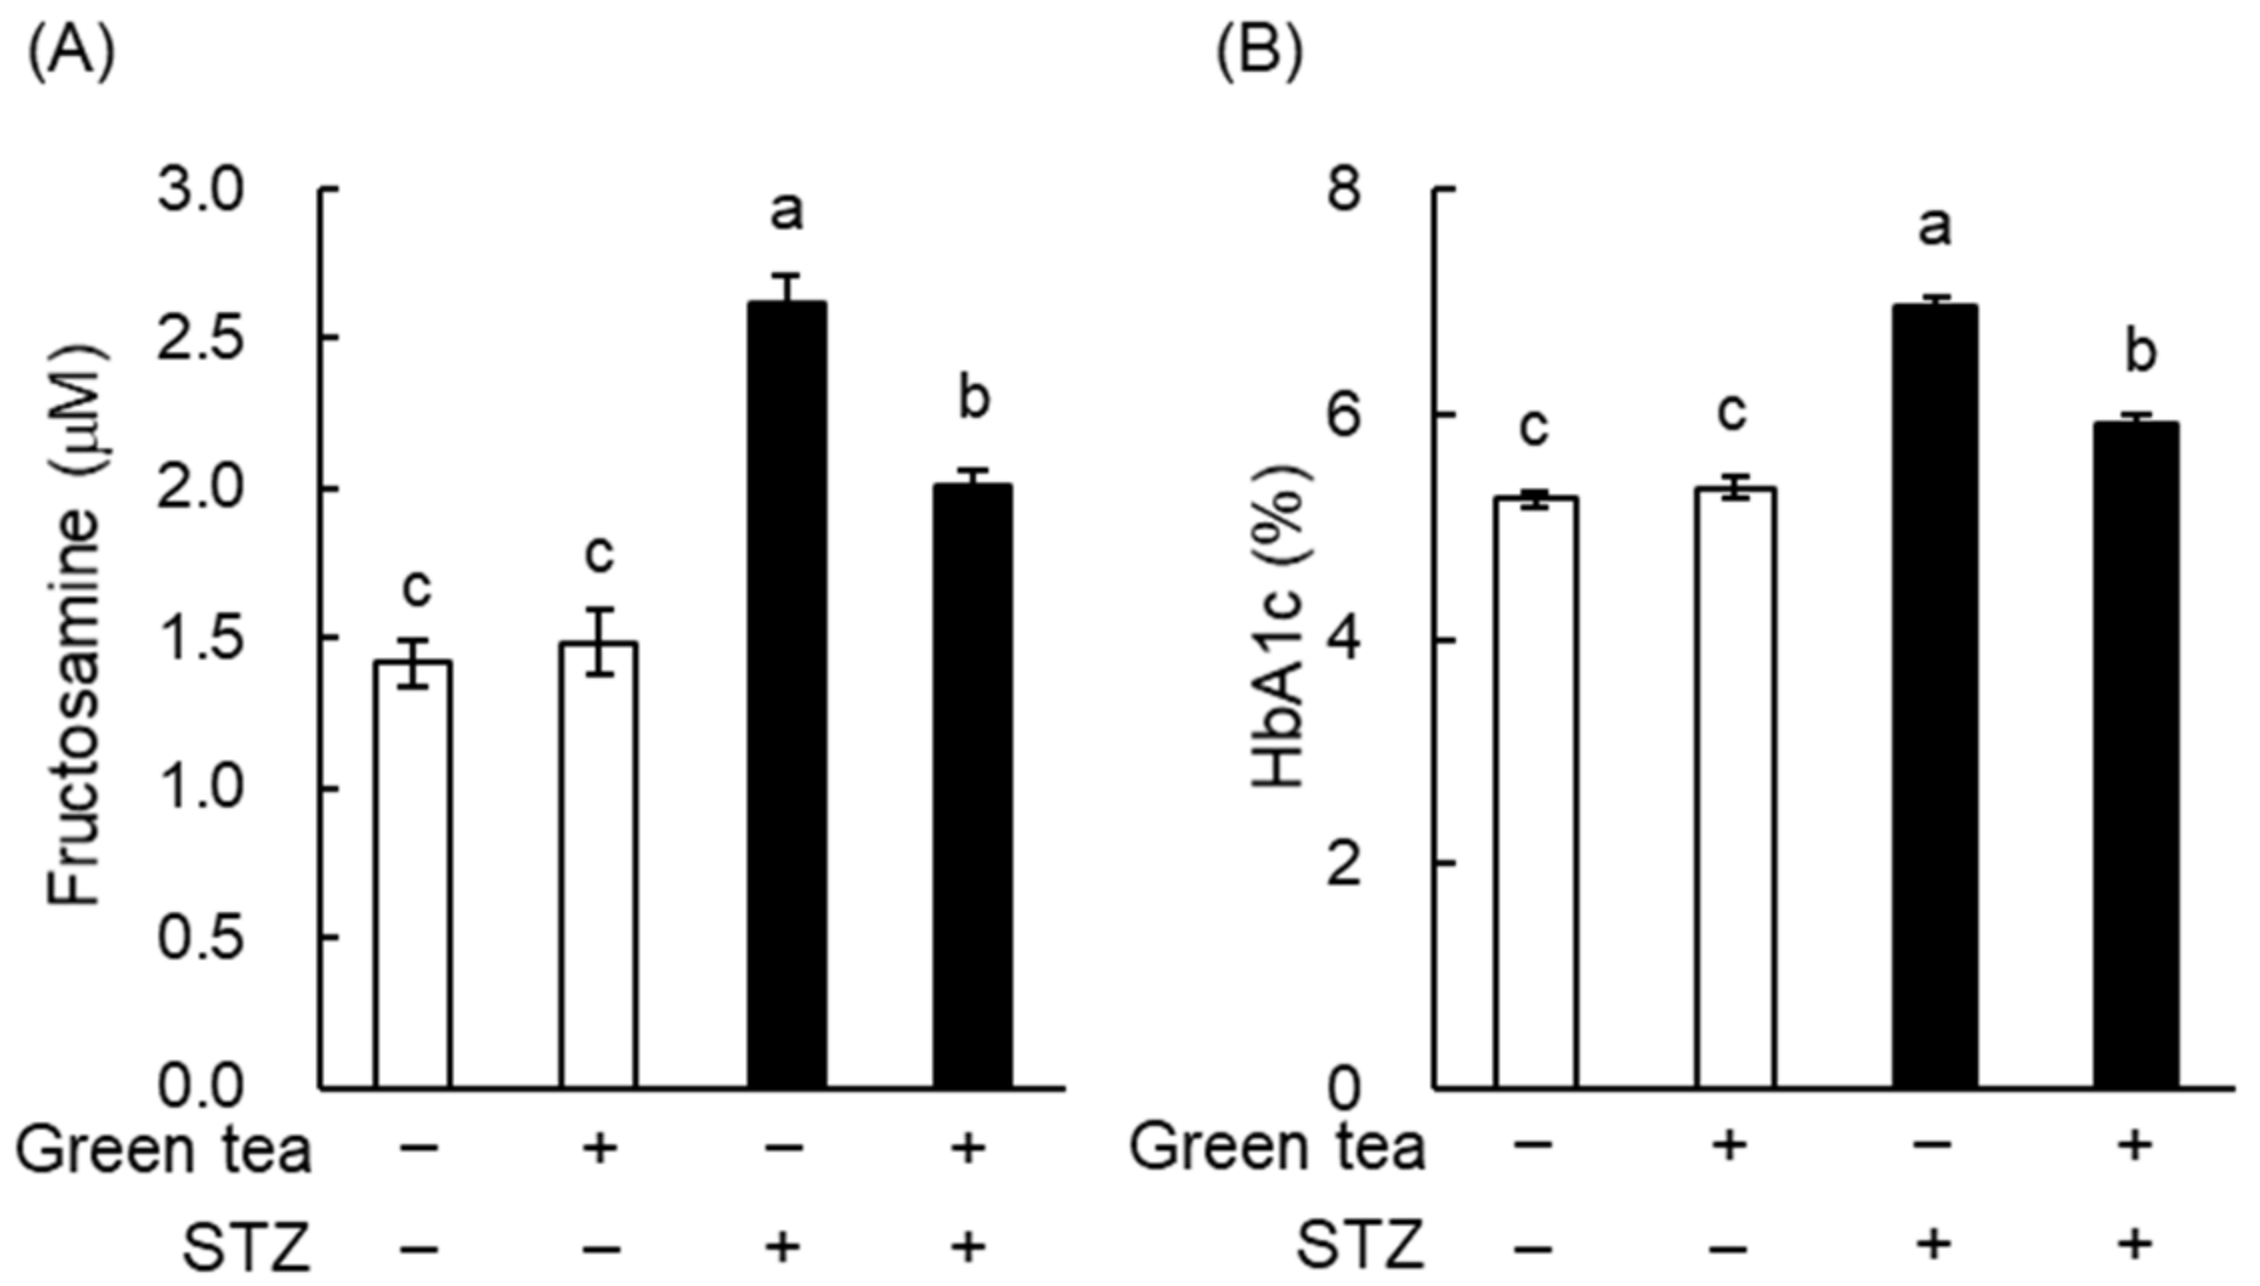
2.1. Green Tea Ameliorated Hyperglycemia and Glucose Intolerance in T1DM Rats
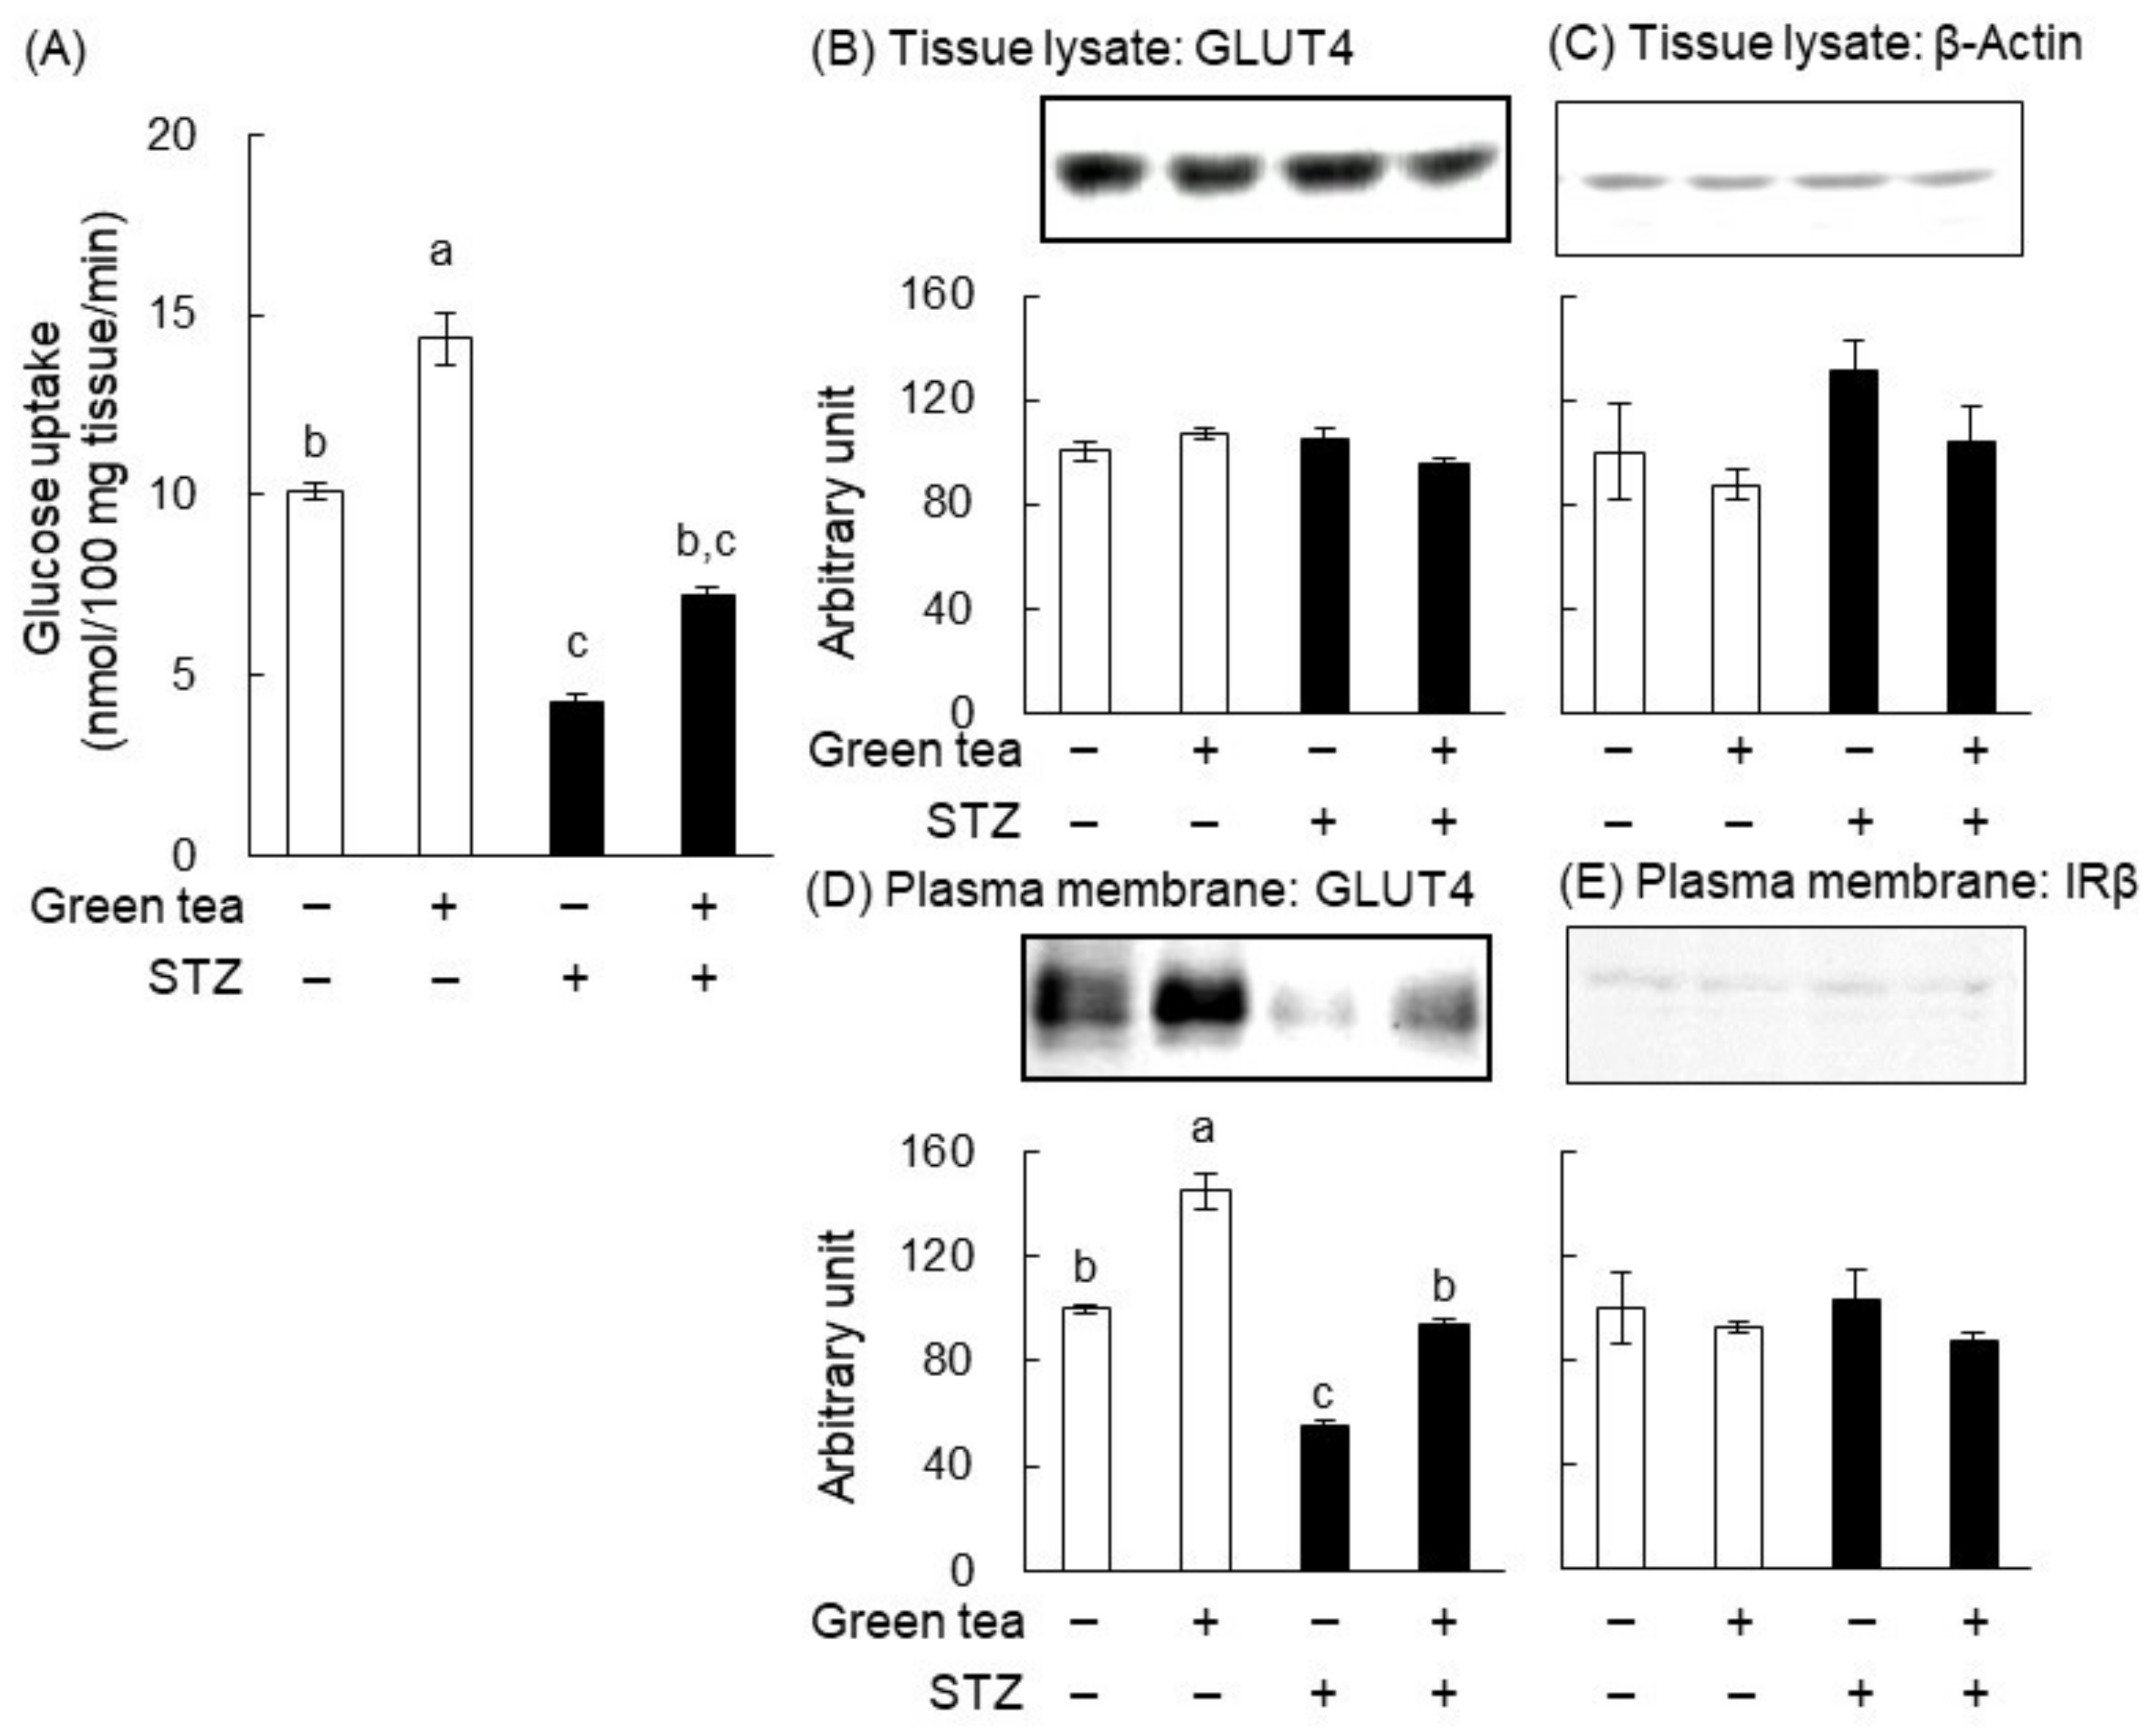
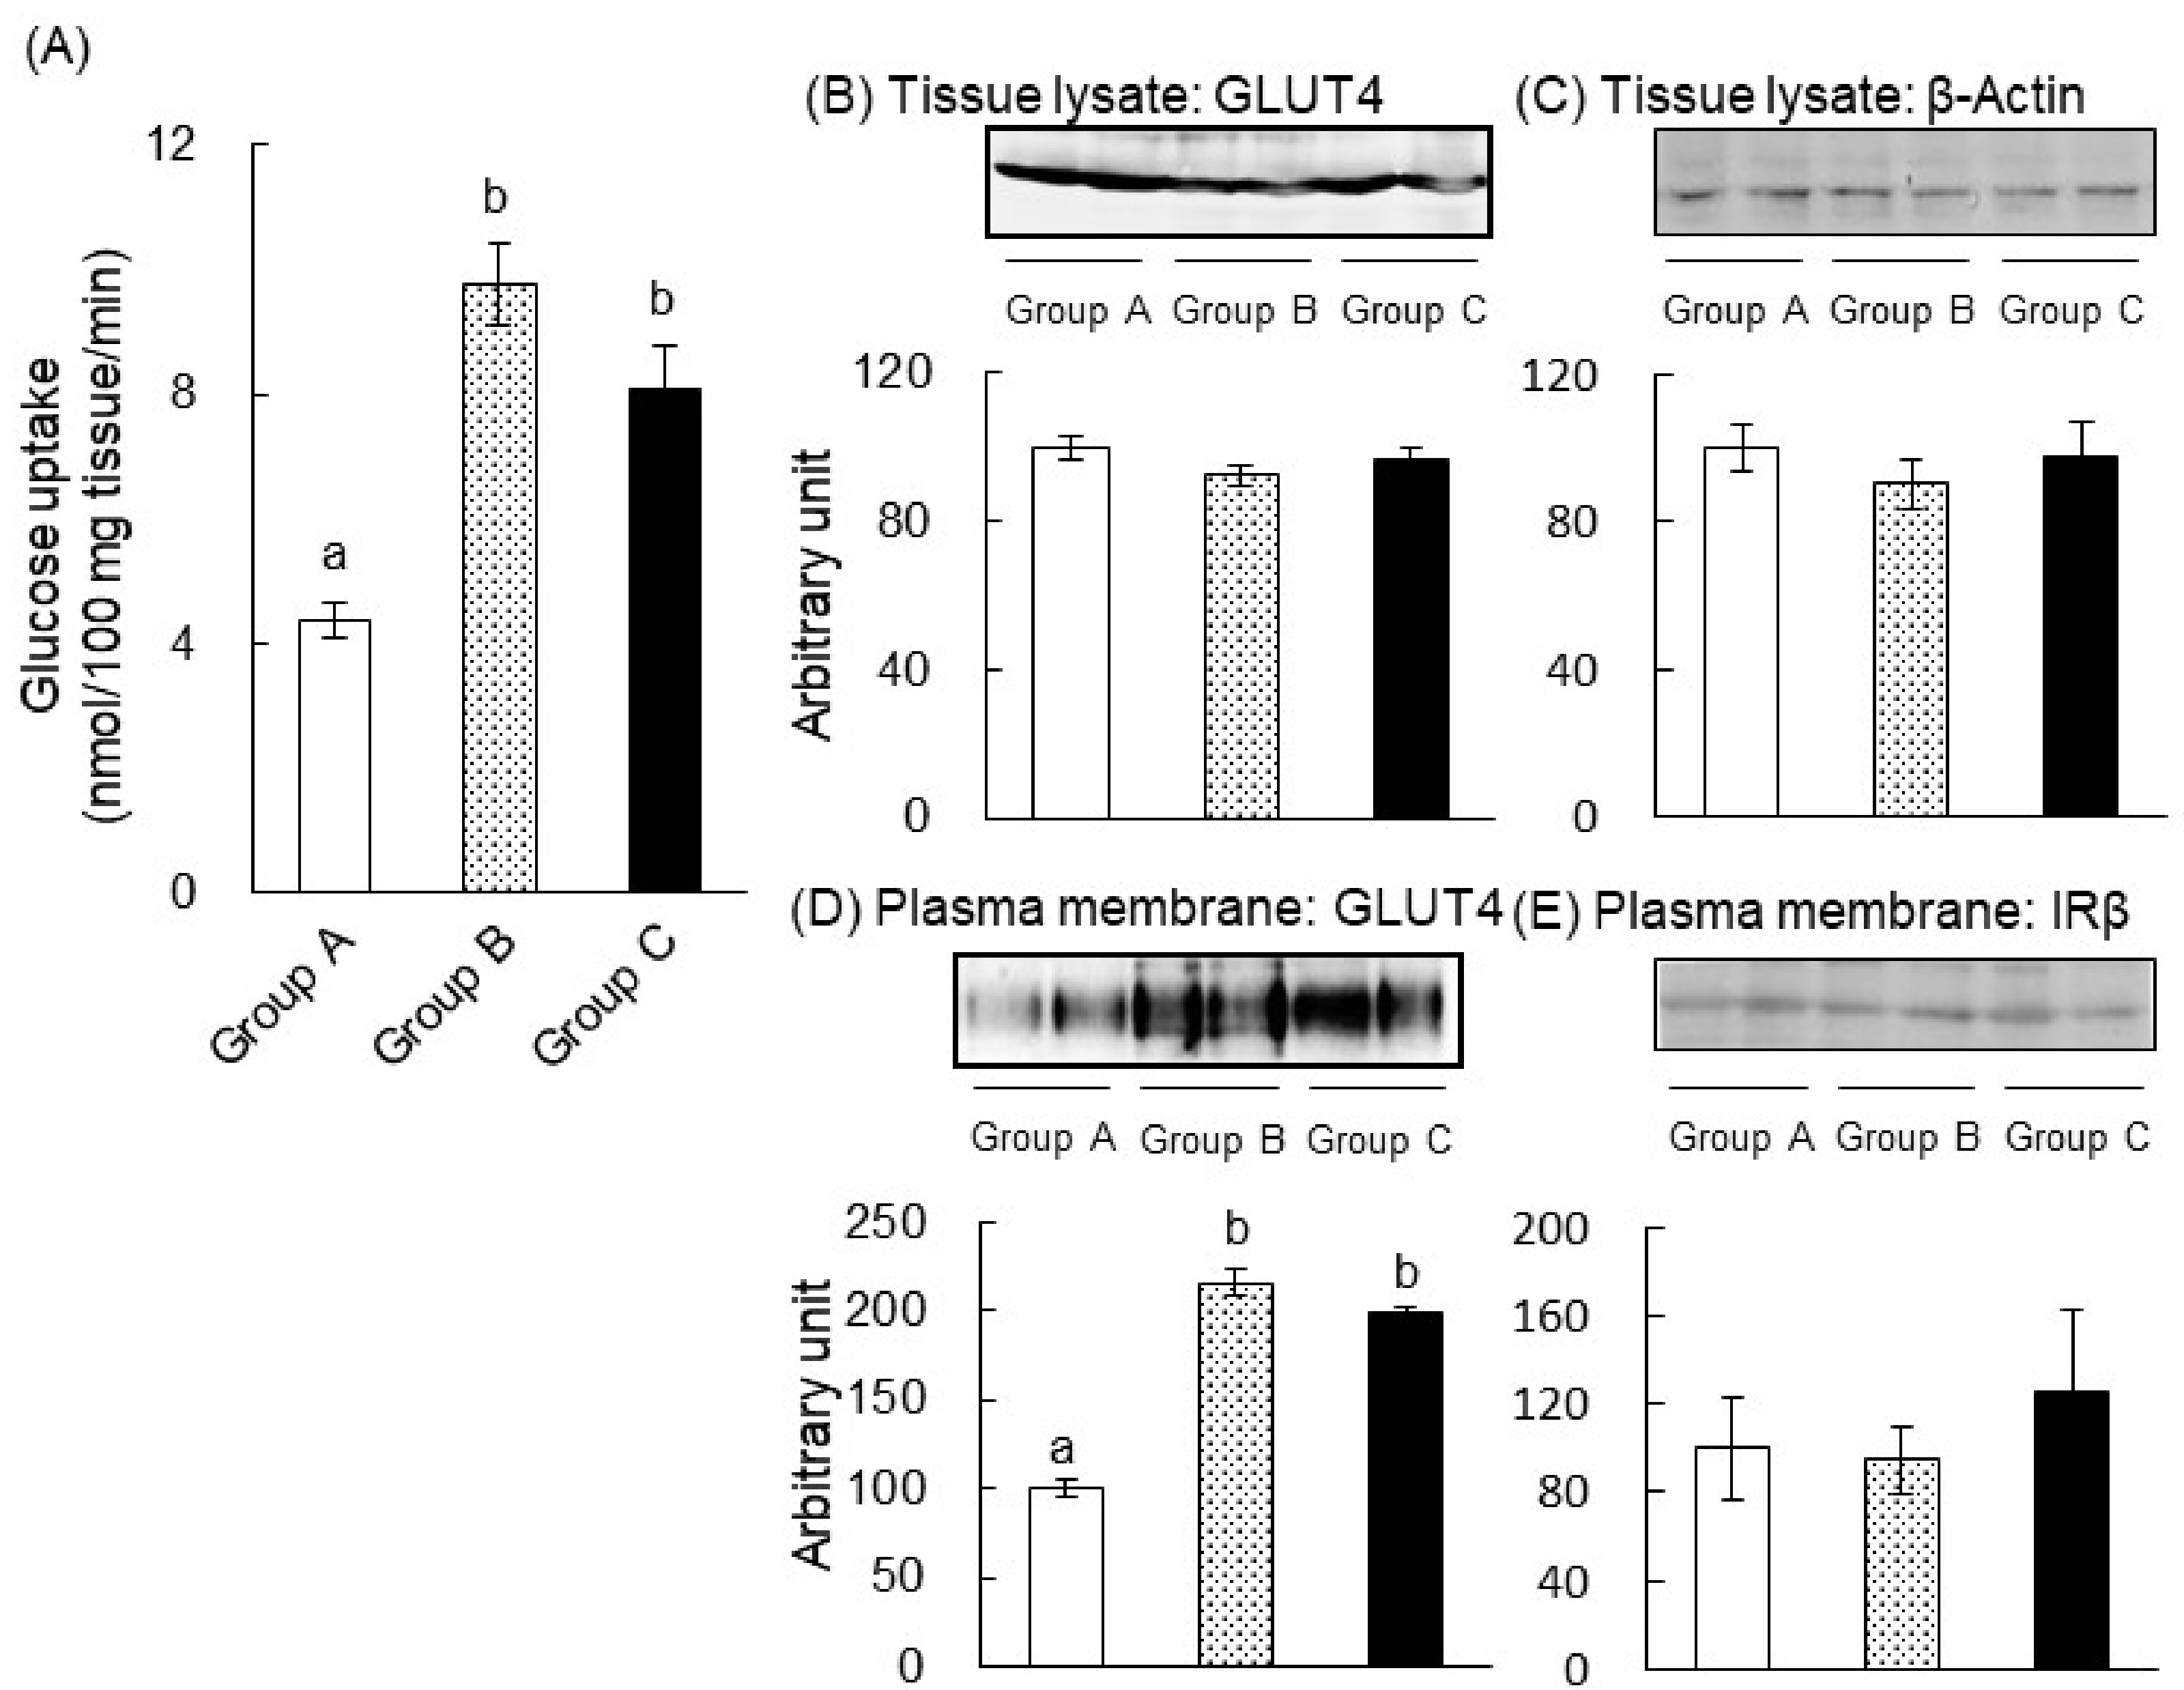
2.2. The Mechanism of the Anti-Hyperglycemic Effect of Green Tea in T1DM Rats
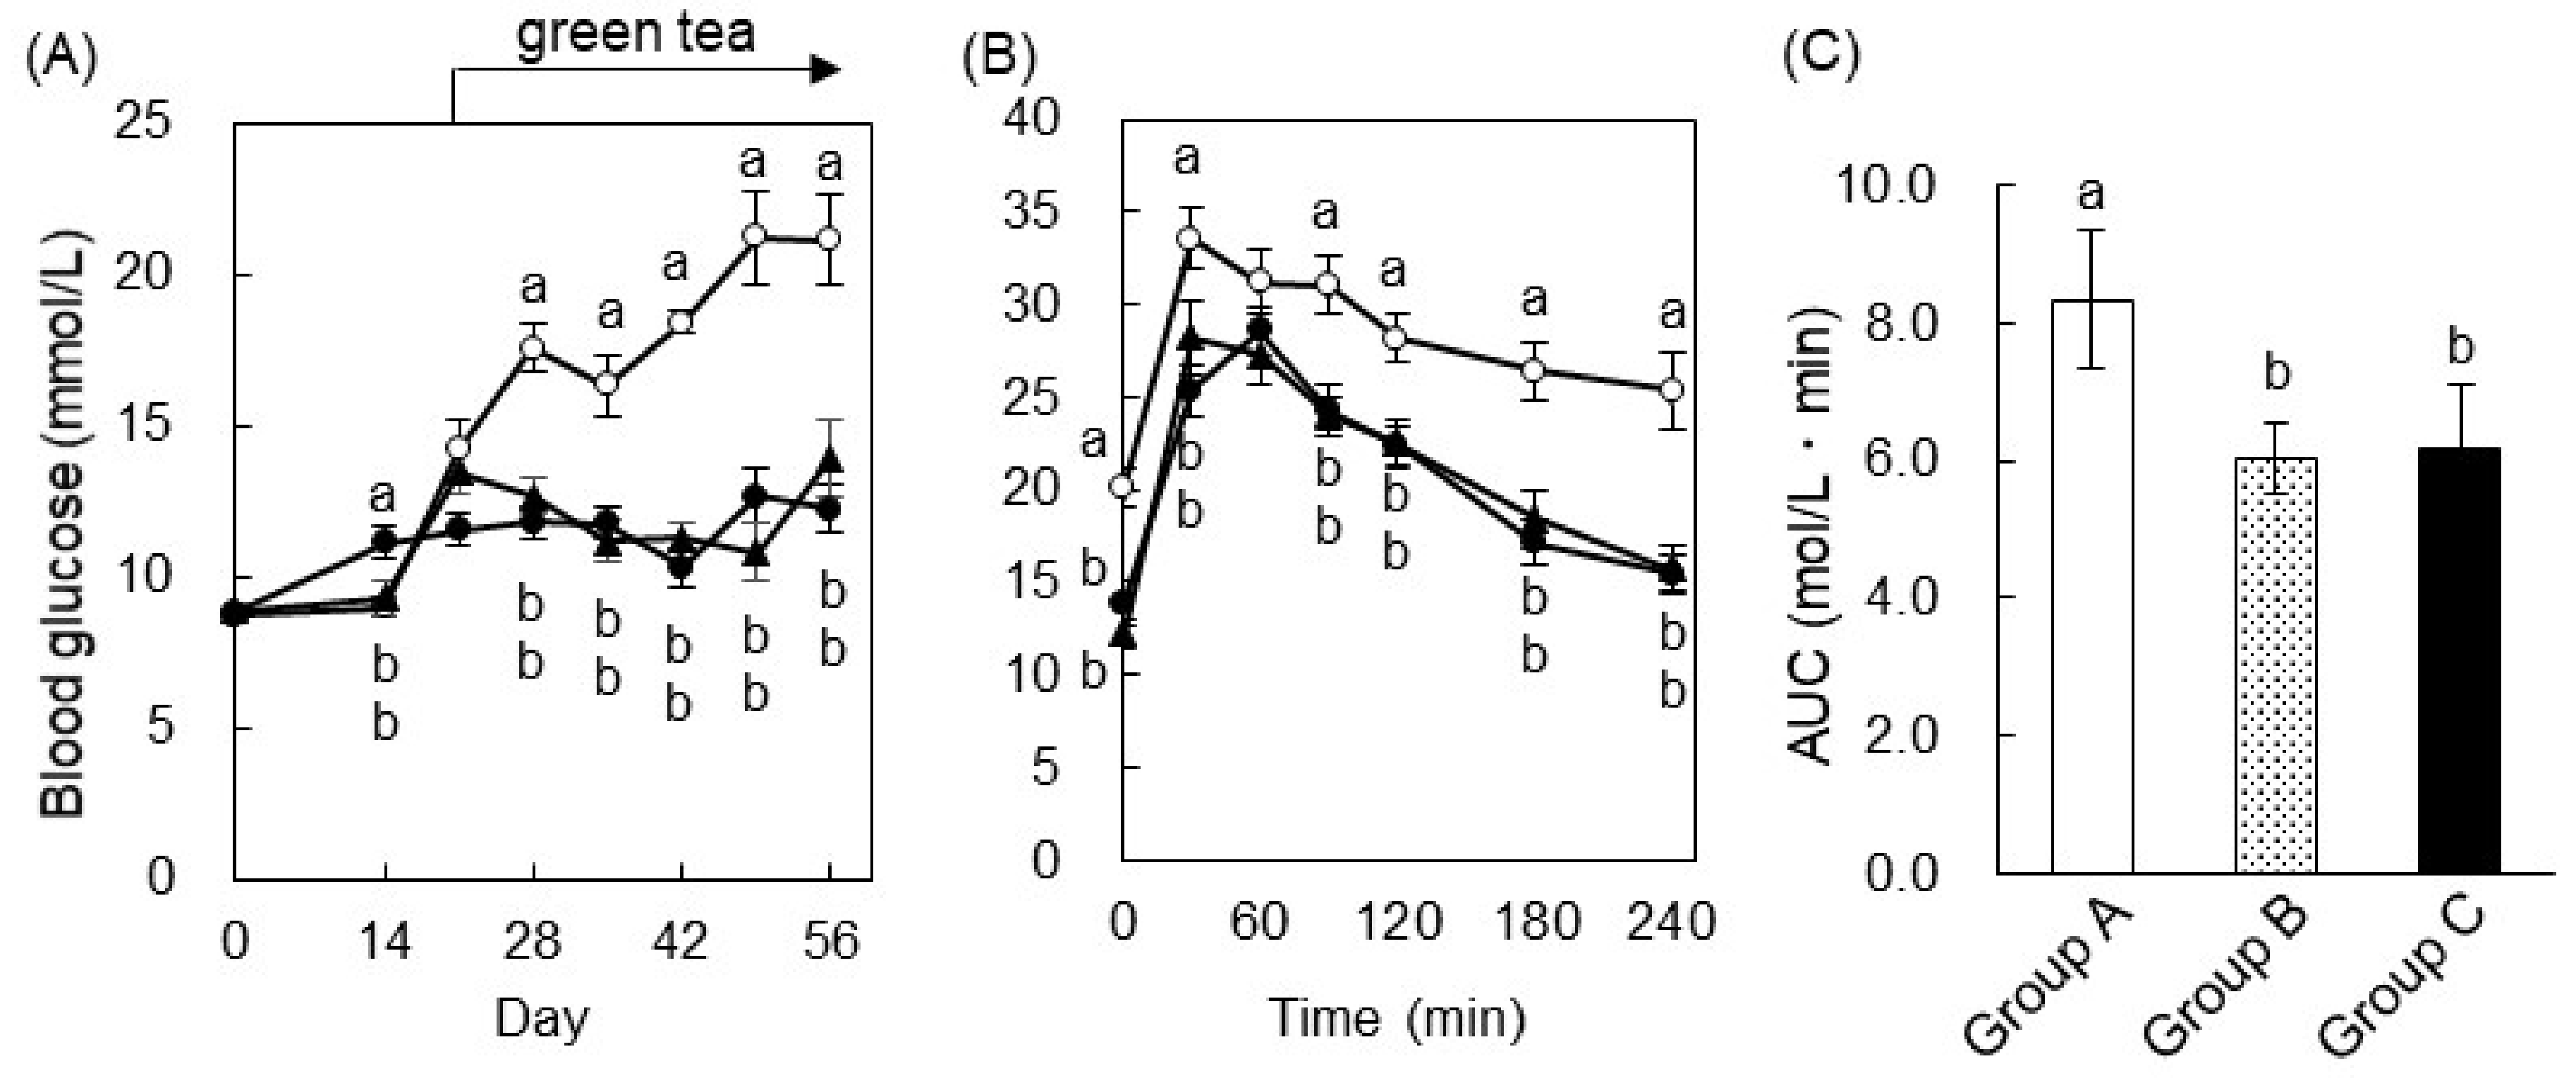
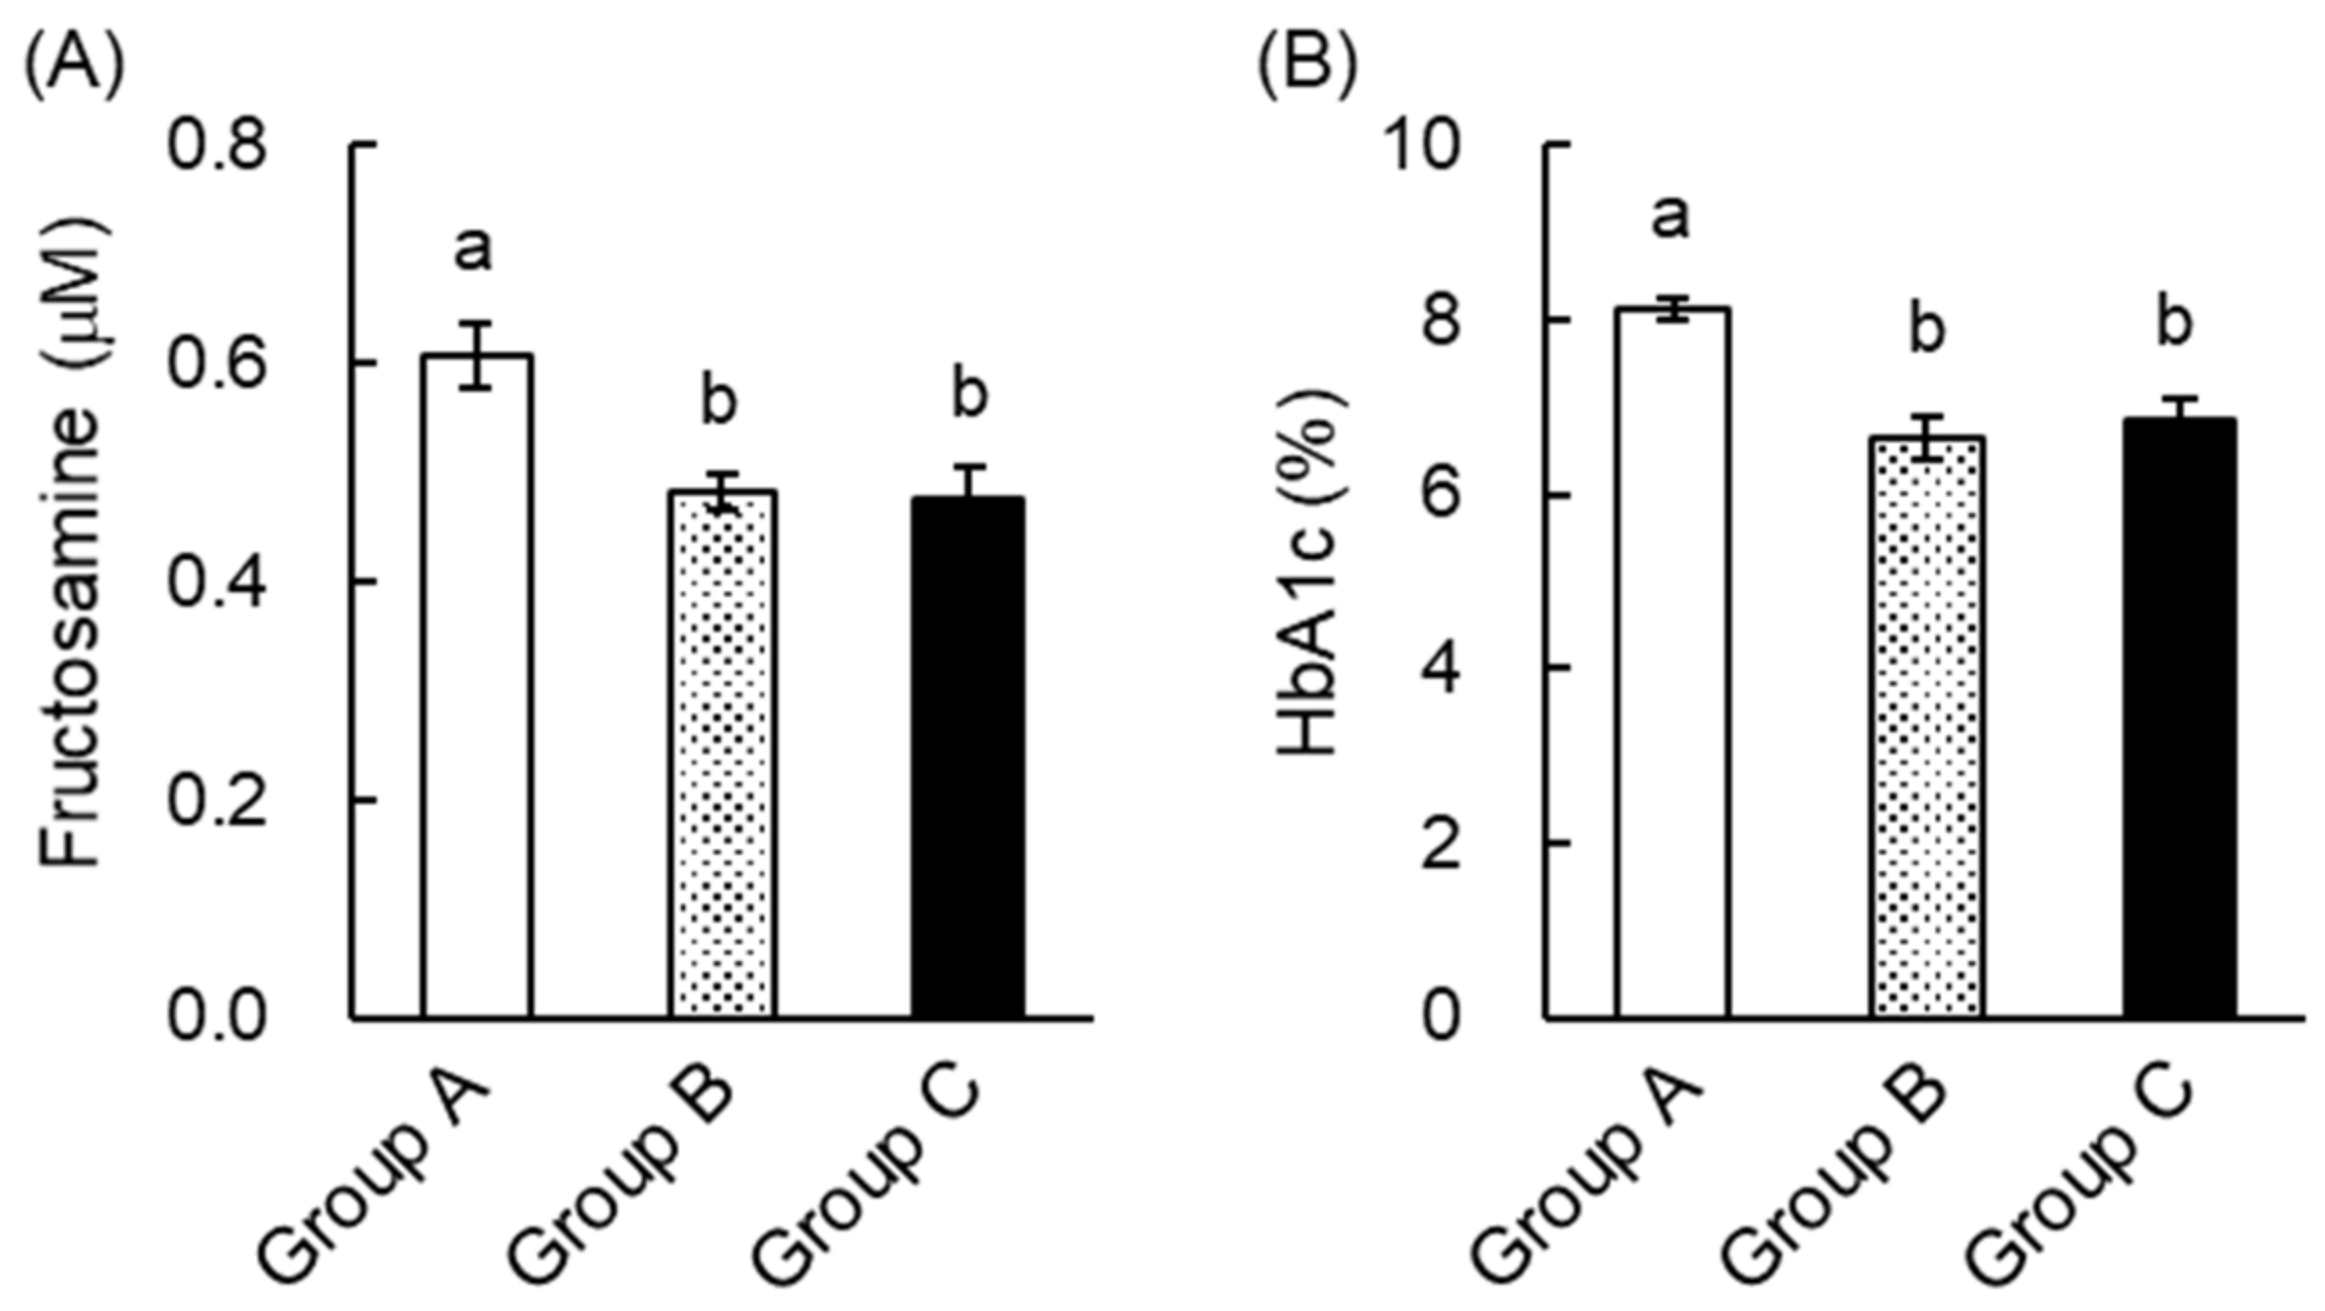
2.3. Green Tea Ameliorated Hyperglycemia and Glucose Intolerance in T2DM Mice
2.4. The Mechanism of the Anti-Hyperglycemic Effect of Green Tea in T2DM Mice
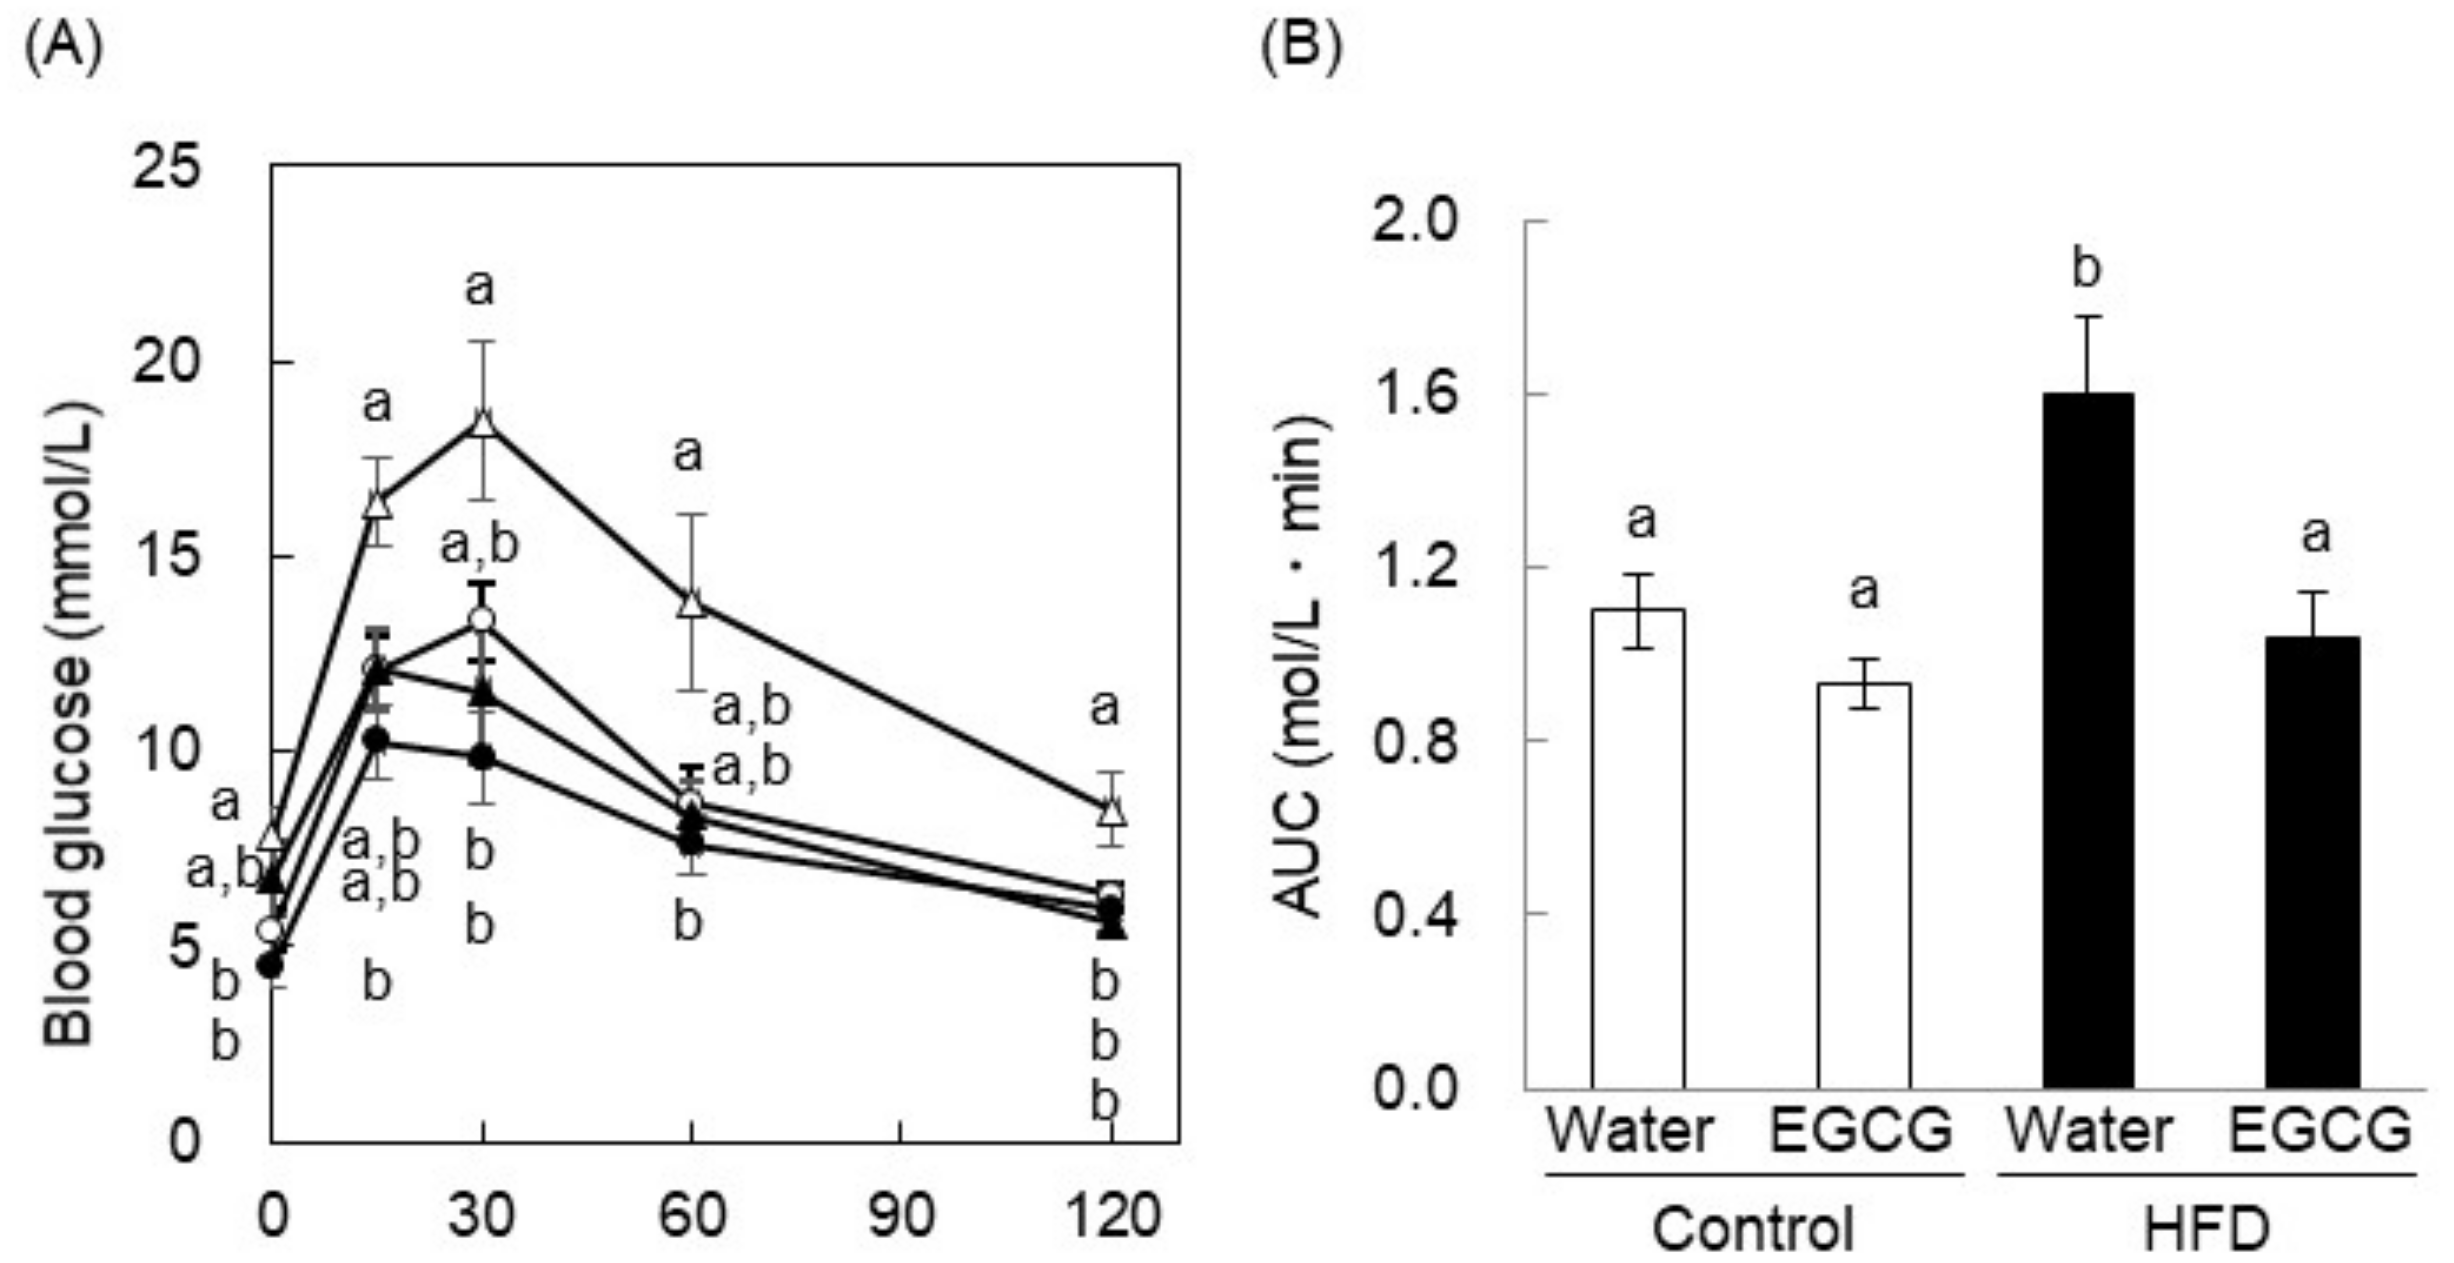
2.5. EGCG Ameliorated Glucose Intolerance in High-Fat Diet-Induced Obese, Diabetic Mice
3. Discussion
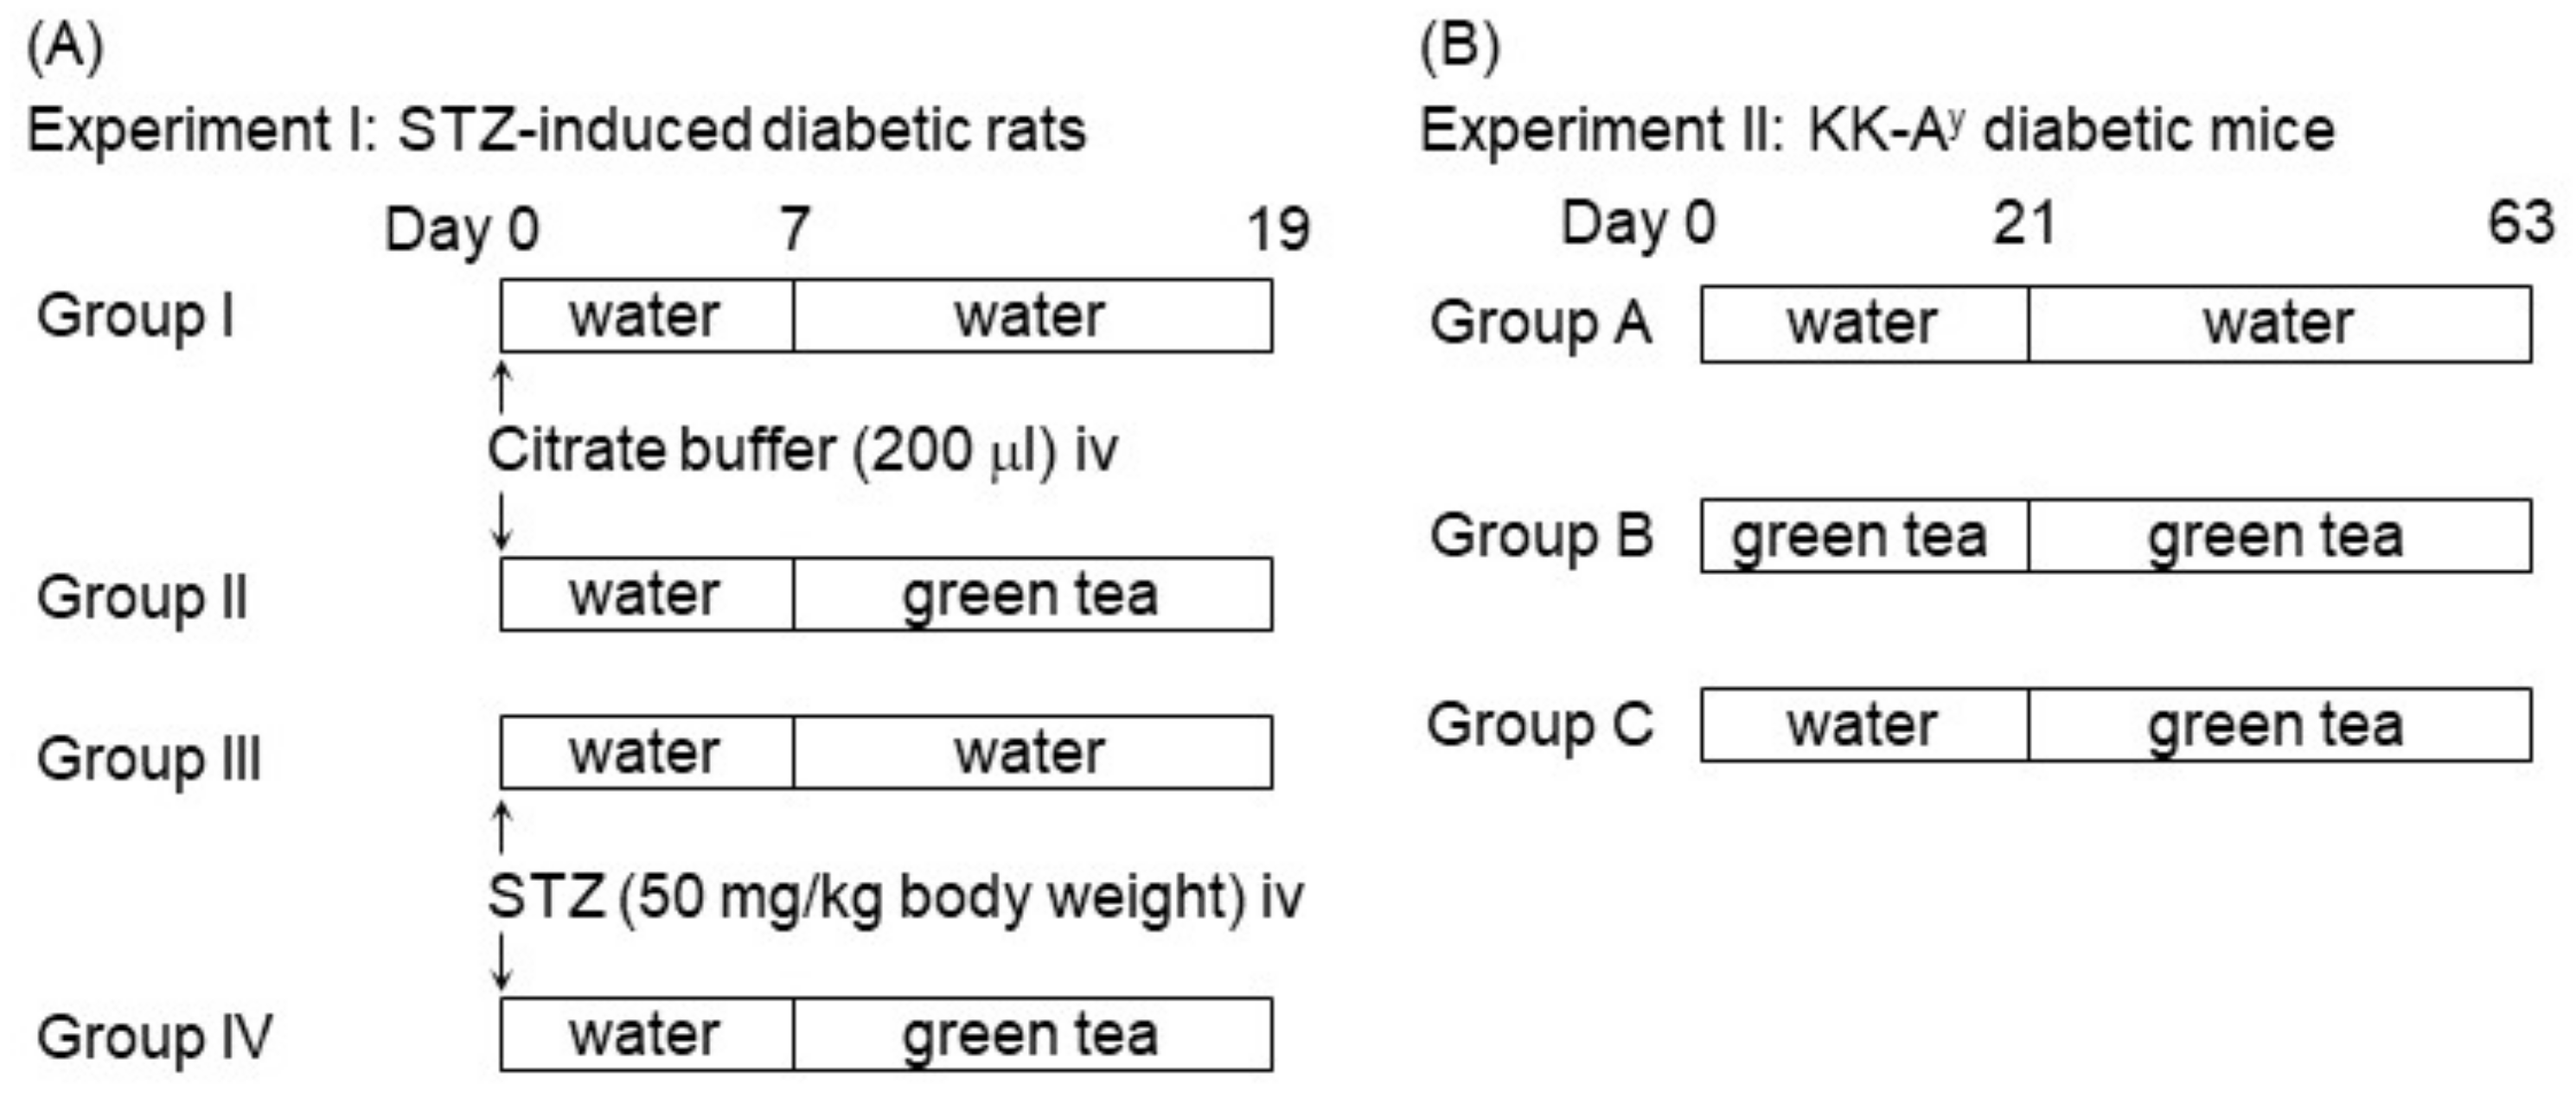
4. Materials and Methods
4.1. Chemicals and Reagents
4.2. Animal Treatments
4.3. Measurement of Plasma Fructosamine, HbA1c, and Lipid Concentrations
4.4. Measurement of Glucose Uptake into Skeletal Muscle
4.5. Assessment of GLUT4 Translocation in Skeletal Muscle
4.6. Statistical Analysis
5. Conclusions
Author Contributions
Funding
Acknowledgments
Conflicts of Interest
Abbreviations
| AMPK | AMP-activated protein kinase |
| AUC | Area under the curve |
| DM | Diabetes mellitus |
| EGCG | Epigallocatechin gallate |
| GLUT4 | Glucose transporter 4 |
| HbA1c | Glycated hemoglobin |
| HFD | High-fat diet |
| IRβ | β-subunit of the insulin receptor |
| KRH | Krebs–Ringer phosphate-HEPES buffer |
| LDL | Low-density lipoprotein |
| NBT | Nitro blue tetrazolium |
| NEFAs | Non-esterified fatty acids |
| OGTT | Oral glucose tolerance test |
| 3-OMG | 3-O-Methyl-D-[1-3H] glucose |
| PI3K | Phosphoinositol 3-kinase |
| PVDF | Polyvinylidene difluoride |
| STZ | Streptozotocin |
| TNF-α | Tumor necrosis factor-α |
| T1DM | Type I diabetes mellitus |
| T2DM | Type 2 diabetes mellitus |
| TC | Total cholesterol |
| TG | Triacylglycerol |
References
- American Diabetes Association. Diagnosis and Classification of Diabetes Mellitus. Diabetes Care 2014, 37, S81–S90. [Google Scholar] [CrossRef] [PubMed]
- Czech, M.P. Insulin Action and Resistance in Obesity and Type 2 Diabetes. Nat Med. 2017, 23, 804–814. [Google Scholar] [CrossRef]
- Rains, J.L.; Jain, S.K. Oxidative Stress, Insulin Signaling, and Diabetes. Free Rad. Biol. Med. 2011, 50, 567–575. [Google Scholar] [CrossRef] [PubMed]
- Meek, T.H.; Morton, G.J. The Role of Leptin in Diabetes: Metabolic Effects. Diabetologia 2016, 59, 928–932. [Google Scholar] [CrossRef] [PubMed]
- Steppan, C.M.; Bailey, S.T.; Bhat, S.; Brown, E.J.; Banerjee, R.R.; Wright, C.M.; Patel, H.R.; Ahima, R.S.; Lazar, M.A. The Hormone Resistin Links Obesity to Diabetes. Nature 2001, 409, 307–312. [Google Scholar] [CrossRef] [PubMed]
- Freitas Lima, L.C.; Braga, V.A.; do Socorro de França Silva, M.; Cruz, J.C.; Sousa Santos, S.H.; de Oliveira Monteiro, M.M.; Balarini, C.M. Adipokines, Diabetes and Atherosclerosis: An Inflammatory Association. Front Physiol. 2015, 6, 304. [Google Scholar] [CrossRef] [PubMed]
- Lee, J.E.; Kang, S.J.; Choi, S.H.; Song, C.H.; Lee, Y.J.; Ku, S.K. Fermentation of Green Tea with 2% Aquilariae Lignum Increases the Anti-Diabetic Activity of Green Tea Aqueous Extracts in the High Fat-Fed Mouse. Nutrients 2015, 7, 9046–9078. [Google Scholar] [CrossRef]
- Ahmad, R.S.; Butt, M.S.; Sultan, M.T.; Mushtaq, Z.; Ahmad, S.; Dewanjee, S.; De Feo, V.; Zia-Ul-Haq, M. Preventive Role of Green Tea Catechins from Obesity and Related Disorders Especially Hypercholesterolemia and Hyperglycemia. J. Transl. Med. 2015, 13, 79. [Google Scholar] [CrossRef] [PubMed]
- Yousaf, S.; Butt, M.S.; Suleria, H.A.; Iqbal, M.J. The Role of Green Tea Extract and Powder in Mitigating Metabolic Syndromes with Special Reference to Hyperglycemia and Hypercholesterolemia. Food Funct. 2014, 5, 545–556. [Google Scholar] [CrossRef] [PubMed]
- Yilmazer-Musa, M.; Griffith, A.M.; Michels, A.J.; Schneider, E.; Frei, B. Grape Seed and Tea Extracts and Catechin 3-Gallates are Potent Inhibitors of α-Amylase and α-Glucosidase Activity. J. Agric. Food Chem. 2012, 60, 8924–8929. [Google Scholar] [CrossRef]
- Nishiumi, S.; Bessyo, H.; Kubo, M.; Aoki, Y.; Tanaka, A.; Yoshida, K.; Ashida, H. Green and Black Tea Suppress Hyperglycemia and Insulin Resistance by Retaining the Expression of Glucose Transporter 4 in Muscle of High-Fat Diet-Fed C57BL/6J Mice. J. Agric. Food Chem. 2010, 24, 12916–12923. [Google Scholar] [CrossRef]
- Ashida, H.; Furuyashiki, T.; Nagayasu, H.; Bessho, H.; Sakakibara, H.; Hashimoto, T.; Kanazawa, K. Anti-Obesity Actions of Green Tea: Possible Involvements in Modulation of the Glucose Uptake System and Suppression of the Adipogenesis-Related Transcription Factors. Biofactors 2004, 22, 135–140. [Google Scholar] [CrossRef] [PubMed]
- Huang, S.; Czech, M.P. The GLUT4 Glucose Transporter. Cell Metab. 2007, 4, 237–252. [Google Scholar] [CrossRef]
- Ueda-Wakagi, M.; Hayashibara, K.; Nagano, T.; Ikeda, M.; Yuan, S.; Ueda, S.; Shirai, Y.; Yoshida, K.; Ashida, H. Epigallocatechin Gallate Induces GLUT4 Translocation in Skeletal Muscle through Both PI3K—And AMPK-Dependent Pathways. Food Funct. 2018, 9, 4223–4233. [Google Scholar] [CrossRef] [PubMed]
- Ueda, M.; Nishiumi, S.; Nagayasu, H.; Fukuda, I.; Yoshida, K.; Ashida, H. Epigallocatechin Gallate Promotes GLUT4 Translocation in Skeletal Muscle. Biochem. Biophys. Res. Commun. 2008, 377, 286–290. [Google Scholar] [CrossRef] [PubMed]
- Guenther Boden, M.D. Obesity, Insulin Resistance and Free Fatty Acids. Curr. Opin. Endocrinol. Diabetes Obes. 2011, 18, 139–143. [Google Scholar] [CrossRef] [PubMed]
- Ribeiro, R.T.; Macedo, M.P.; Raposo, J.F. HbA1c, Fructosamine, and Glycated Albumin in the Detection of Dysglycaemic Conditions. Curr. Diabetes Rev. 2016, 12, 14–19. [Google Scholar] [CrossRef]
- Kitada, M.; Ogura, Y.; Koya, D. Rodent Models of Diabetic Nephropathy: Their Utility and Limitations. Int. J. Nephrol. Renov. Dis. 2016, 9, 279–290. [Google Scholar] [CrossRef] [PubMed]
- Yang, C.S.; Zhang, J. Studies on the Prevention of Cancer and Cardiometabolic Diseases by Tea: Issues on Mechanisms, Effective Doses and Toxicities. J. Agric. Food Chem. 2019, 67, 5446–5456. [Google Scholar] [CrossRef] [PubMed]
- Xing, L.; Zhang, H.; Qi, R.; Tsao, R.; Mine, Y. Recent Advances in the Understanding of the Health Benefits and Molecular Mechanisms Associated with Green Tea Polyphenols. J. Agric. Food Chem. 2019, 67, 1029–1043. [Google Scholar] [CrossRef] [PubMed]
- Yan, J.; Zhao, Y.; Suo, S.; Liu, Y.; Zhao, B. Green Tea Catechins Ameliorate Adipose Insulin Resistance by Improving Oxidative Stress. Free Rad. Biol. Med. 2012, 52, 1648–1657. [Google Scholar] [CrossRef] [PubMed]
- DeFronzo, R.A.; Bonadonna, R.C.; Ferrannini, E. Pathogenesis of NIDDM—A Balanced Overview. Diabetes Care 1992, 15, 318–368. [Google Scholar] [CrossRef] [PubMed]
- Yamashita, Y.; Wang, L.; Tinshun, Z.; Nakamura, T.; Ashida, H. Fermented Tea Improves Glucose Intolerance in Mice by Enhancing Translocation of Glucose Transporter 4 in Skeletal Muscle. J. Agric. Food Chem. 2012, 60, 11366–11371. [Google Scholar] [CrossRef]
- Kawbata, K.; Sawada, K.; Ikeda, K.; Fukuda, I.; Kawasaki, K.; Yamamoto, N.; Ashida, H. Prenylated Chalcones 4-Hydroxyderricin and Xanthoangelol Stimulate Glucose Uptake in Skeletal Muscle Cells by Inducing GLUT4 Translocation. Mol. Nutr. Food Res. 2011, 55, 467–475. [Google Scholar] [CrossRef]
- Yamashita, Y.; Wang, L.; Nanba, F.; Ito, C.; Toda, T.; Ashida, H. Procyanidin Promotes Translocation of Glucose Transporter 4 in Muscle of Mice through Activation of Insulin and AMPK Signaling Pathways. PLoS ONE 2016, 11, e0161704. [Google Scholar] [CrossRef] [PubMed]
- Kamei, R.; Kitagawa, Y.; Kadokura, M.; Hattori, F.; Hazeki, O.; Ebina, Y.; Nishihara, T.; Oikawa, S. Shikonin Stimulates Glucose Uptake in 3T3-L1 Adipocytes Via an Insulin-Independent Tyrosine Kinase Pathway. Biochem. Biophys. Res. Commun. 2002, 292, 642–651. [Google Scholar] [CrossRef]
- Ueda, M.; Furuyashiki, T.; Yamada, K.; Aoki, Y.; Sakane, I.; Fukuda, I.; Yoshida, K.; Ashida, H. Tea Catechins Modulate the Glucose Transport System in 3T3-L1 Adipocytes. Food Funct. 2010, 1, 167–173. [Google Scholar] [CrossRef]
- Oritani, Y.; Setoguchi, Y.; Ito, R.; Maruki-Uchida, H.; Ichiyanagi, T.; Ito, T. Comparison of (−)-Epigallocatechin-3-O-Gallate (EGCG) and O-Methyl EGCG Bioavailability in Rats. Biol. Pharm. Bull. 2013, 36, 1577–1582. [Google Scholar] [CrossRef]
- Fukuda, I.; Nishiumi, S.; Mukai, R.; Yoshida, K.; Ashida, H. Catechins in Tea Suppress the Activity of Cytochrome P450 1A1 through the Aryl Hydrocarbon Receptor Activation Pathway in Rat Livers. Int. J. Food Sci. Nutr. 2015, 66, 300–307. [Google Scholar] [CrossRef] [PubMed]
- Steinberg, D. The LDL Modification Hypothesis of Atherogenesis: An Update. J. Lipid Res. 2009, 50, S376–S381. [Google Scholar] [CrossRef] [PubMed]
- Toth, P.P. Triglyceride-Rich Lipoproteins as a Causal Factor for Cardiovascular Disease. Vasc. Health Risk Manag. 2016, 12, 171–183. [Google Scholar] [CrossRef] [PubMed]
- Ahmed, N.A.; Radwan, N.M.; Aboul Ezz, H.S.; Salama, N.A. The Antioxidant Effect of Green Tea Mega EGCG Against Electromagnetic Radiation-Induced Oxidative Stress in the Hippocampus and Striatum of Rats. Electromagn. Biol. Med. 2017, 36, 63–73. [Google Scholar] [CrossRef]
- Nam, M.; Choi, M.S.; Choi, J.Y.; Kim, N.; Kim, M.S.; Jung, S.; Kim, J.; Ryu, D.H.; Hwang, G.S. Effect of Green Tea on Hepatic Lipid Metabolism in Mice Fed a High-Fat Diet. J. Nutr. Biochem. 2018, 51, 1–7. [Google Scholar] [CrossRef] [PubMed]
- Johnson, R.N.; Metcalf, P.A.; Baker, J.R. Fructosamine: A New Approach to the Estimation of Serum Glycosylprotein. An Index of Diabetic Control. Clin. Chim. Acta 1983, 127, 87–95. [Google Scholar] [CrossRef]


| Normal | STZ | |||
|---|---|---|---|---|
| Contents | Water | Green Tea | Water | Green Tea |
| Triacylglycerol (mg/dL) | 27.3 ± 1.61 a | 29.9 ± 1.95 a | 38.8 ± 2.08 b | 27.6 ± 0.97 a |
| Total cholesterol (mg/dL) | 56.2 ± 3.80 | 54.0 ± 5.05 | 56.1 ± 4.44 | 54.1 ± 3.98 |
| NEFAs (meq/dL) | 0.38 ± 0.02 a | 0.42 ± 0.06 a | 1.33 ± 0.05 b | 0.88 ± 0.07 c |
| Contents | Group A | Group B | Group B |
|---|---|---|---|
| Triacylglycerol (mg/dL) | 166.4 ± 7.3 a | 121.7 ± 5.6 b | 118.4 ± 6.3 b |
| Total cholesterol (mg/dL) | 140.8 ± 7.2 | 133.3 ± 9.3 | 157.2 ± 7.2 |
| NEFAs (meq/dL) | 0.37 ± 0.03 | 0.31 ± 0.03 | 0.30 ± 0.02 |
© 2019 by the authors. Licensee MDPI, Basel, Switzerland. This article is an open access article distributed under the terms and conditions of the Creative Commons Attribution (CC BY) license (http://creativecommons.org/licenses/by/4.0/).
Share and Cite
Ueda-Wakagi, M.; Nagayasu, H.; Yamashita, Y.; Ashida, H. Green Tea Ameliorates Hyperglycemia by Promoting the Translocation of Glucose Transporter 4 in the Skeletal Muscle of Diabetic Rodents. Int. J. Mol. Sci. 2019, 20, 2436. https://0-doi-org.brum.beds.ac.uk/10.3390/ijms20102436
Ueda-Wakagi M, Nagayasu H, Yamashita Y, Ashida H. Green Tea Ameliorates Hyperglycemia by Promoting the Translocation of Glucose Transporter 4 in the Skeletal Muscle of Diabetic Rodents. International Journal of Molecular Sciences. 2019; 20(10):2436. https://0-doi-org.brum.beds.ac.uk/10.3390/ijms20102436
Chicago/Turabian StyleUeda-Wakagi, Manabu, Hironobu Nagayasu, Yoko Yamashita, and Hitoshi Ashida. 2019. "Green Tea Ameliorates Hyperglycemia by Promoting the Translocation of Glucose Transporter 4 in the Skeletal Muscle of Diabetic Rodents" International Journal of Molecular Sciences 20, no. 10: 2436. https://0-doi-org.brum.beds.ac.uk/10.3390/ijms20102436