Partial Failure of Proteostasis Systems Counteracting TDP-43 Aggregates in Neurodegenerative Diseases


Abstract
:
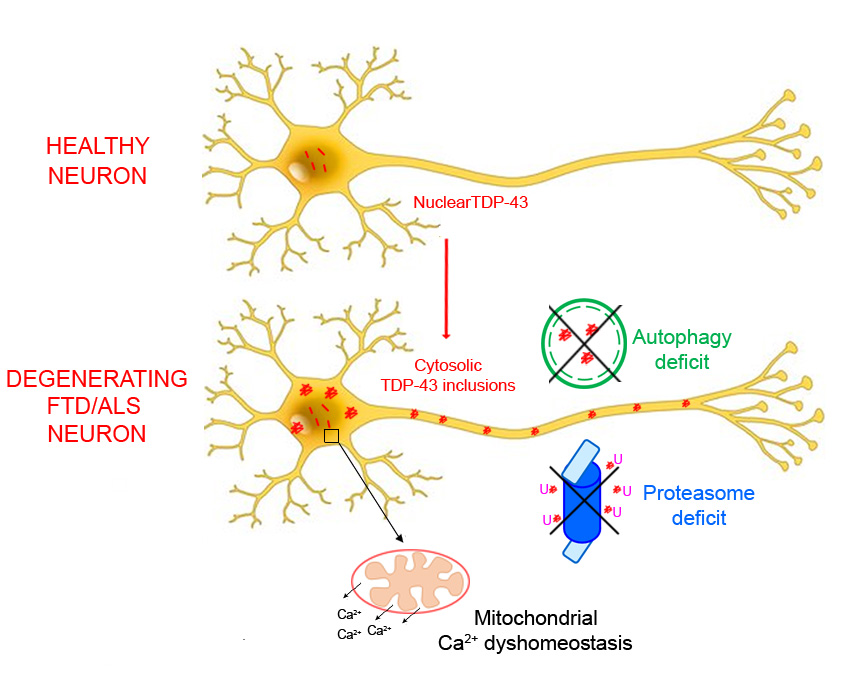
1. Introduction
2. Results
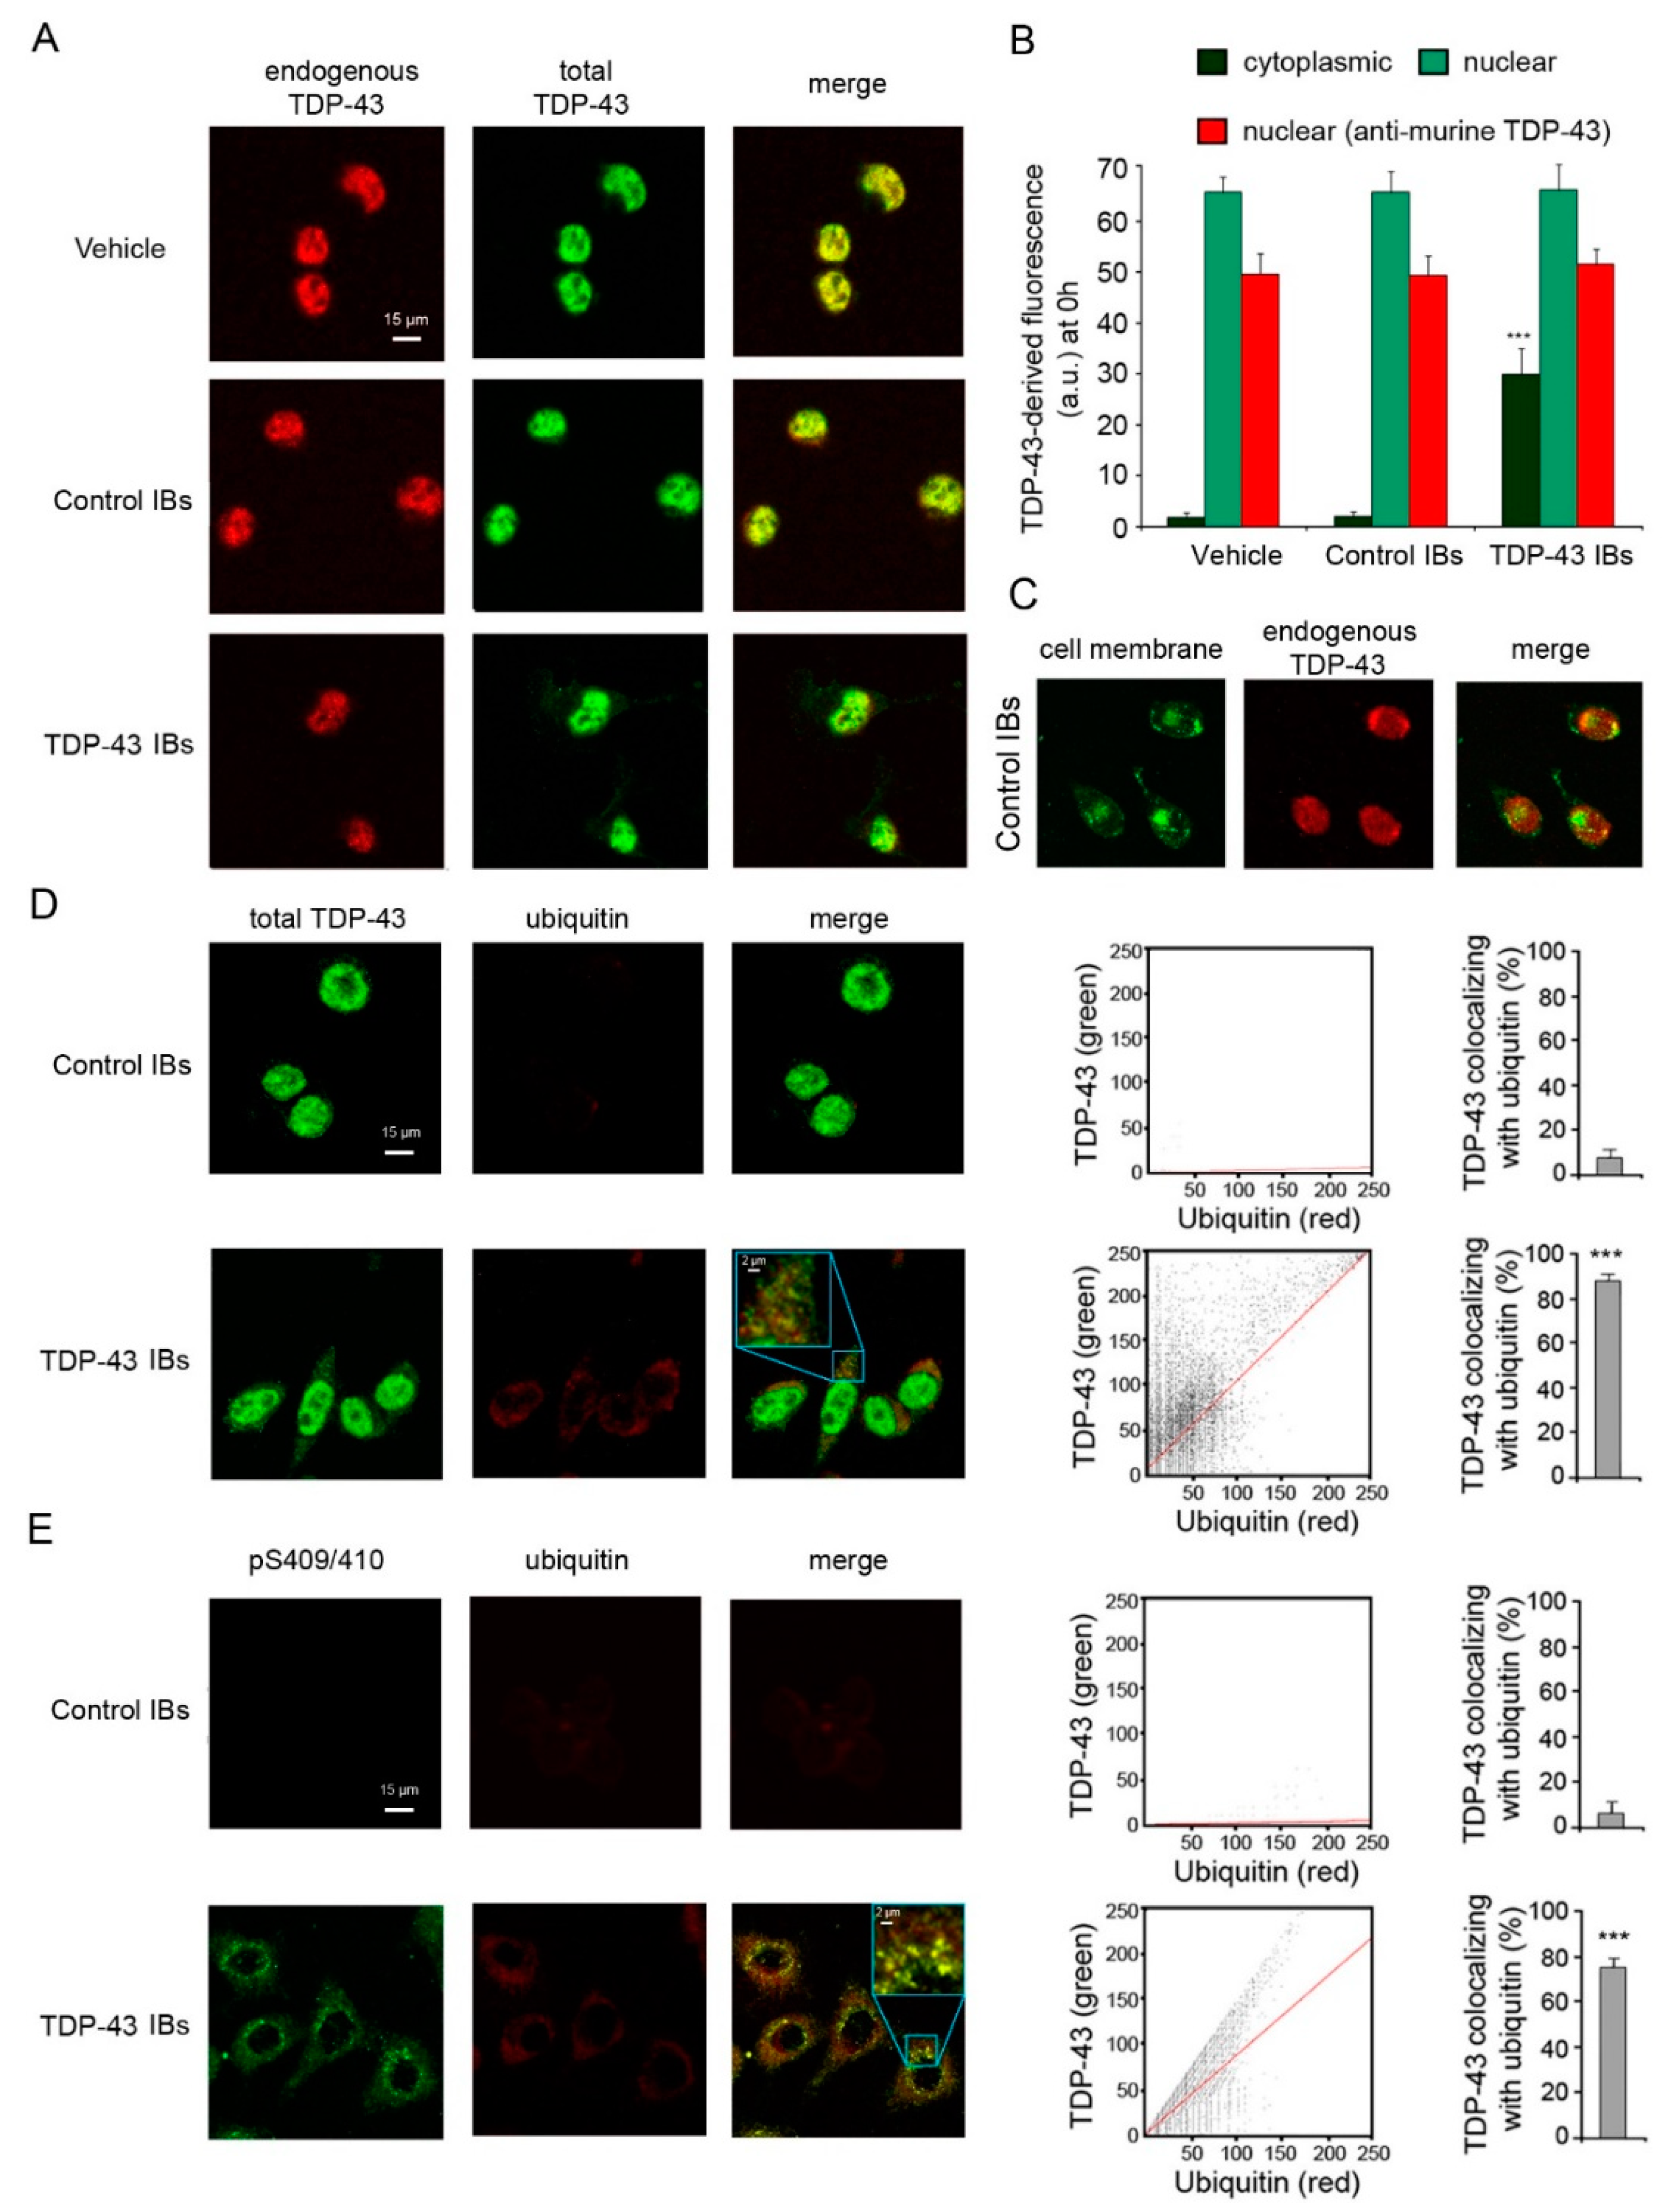
2.1. TDP-43 Aggregates Are Ubiquitinated and Phosphorylated in Neuronal Cells
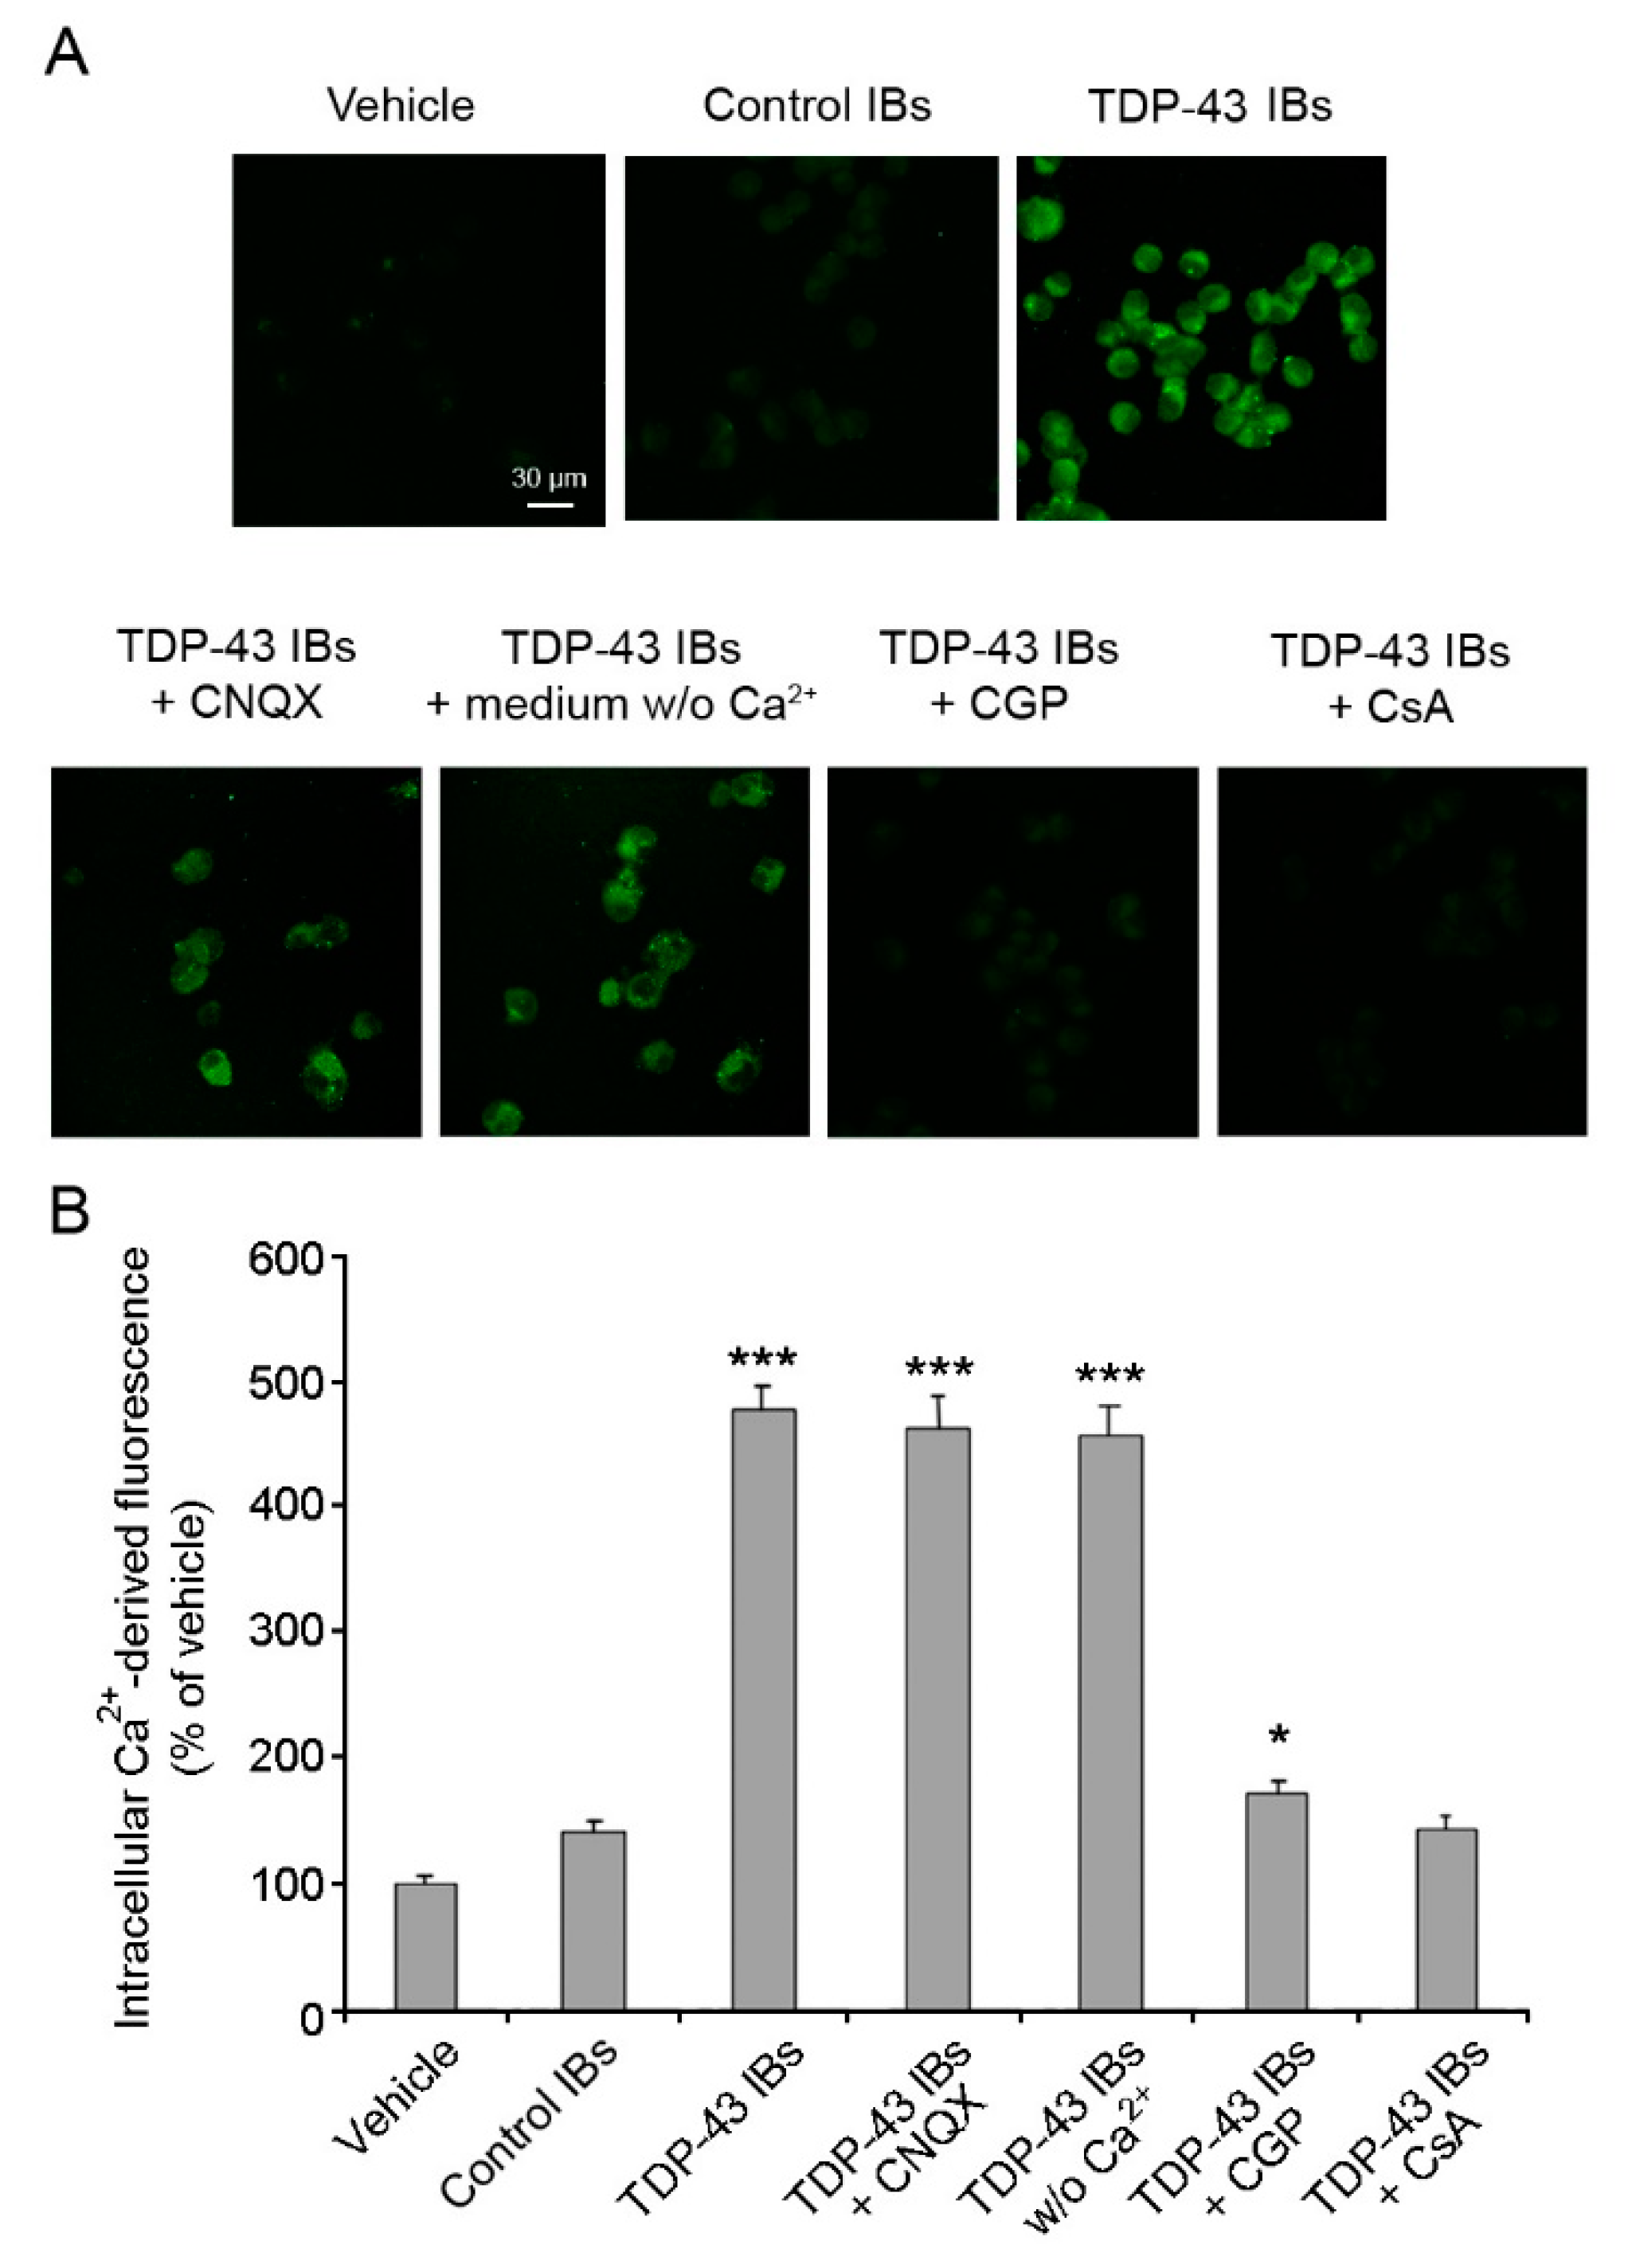
2.2. TDP-43 Aggregates Cause Ca2+ Release from Mitochondrial Stores in Neuronal Cells
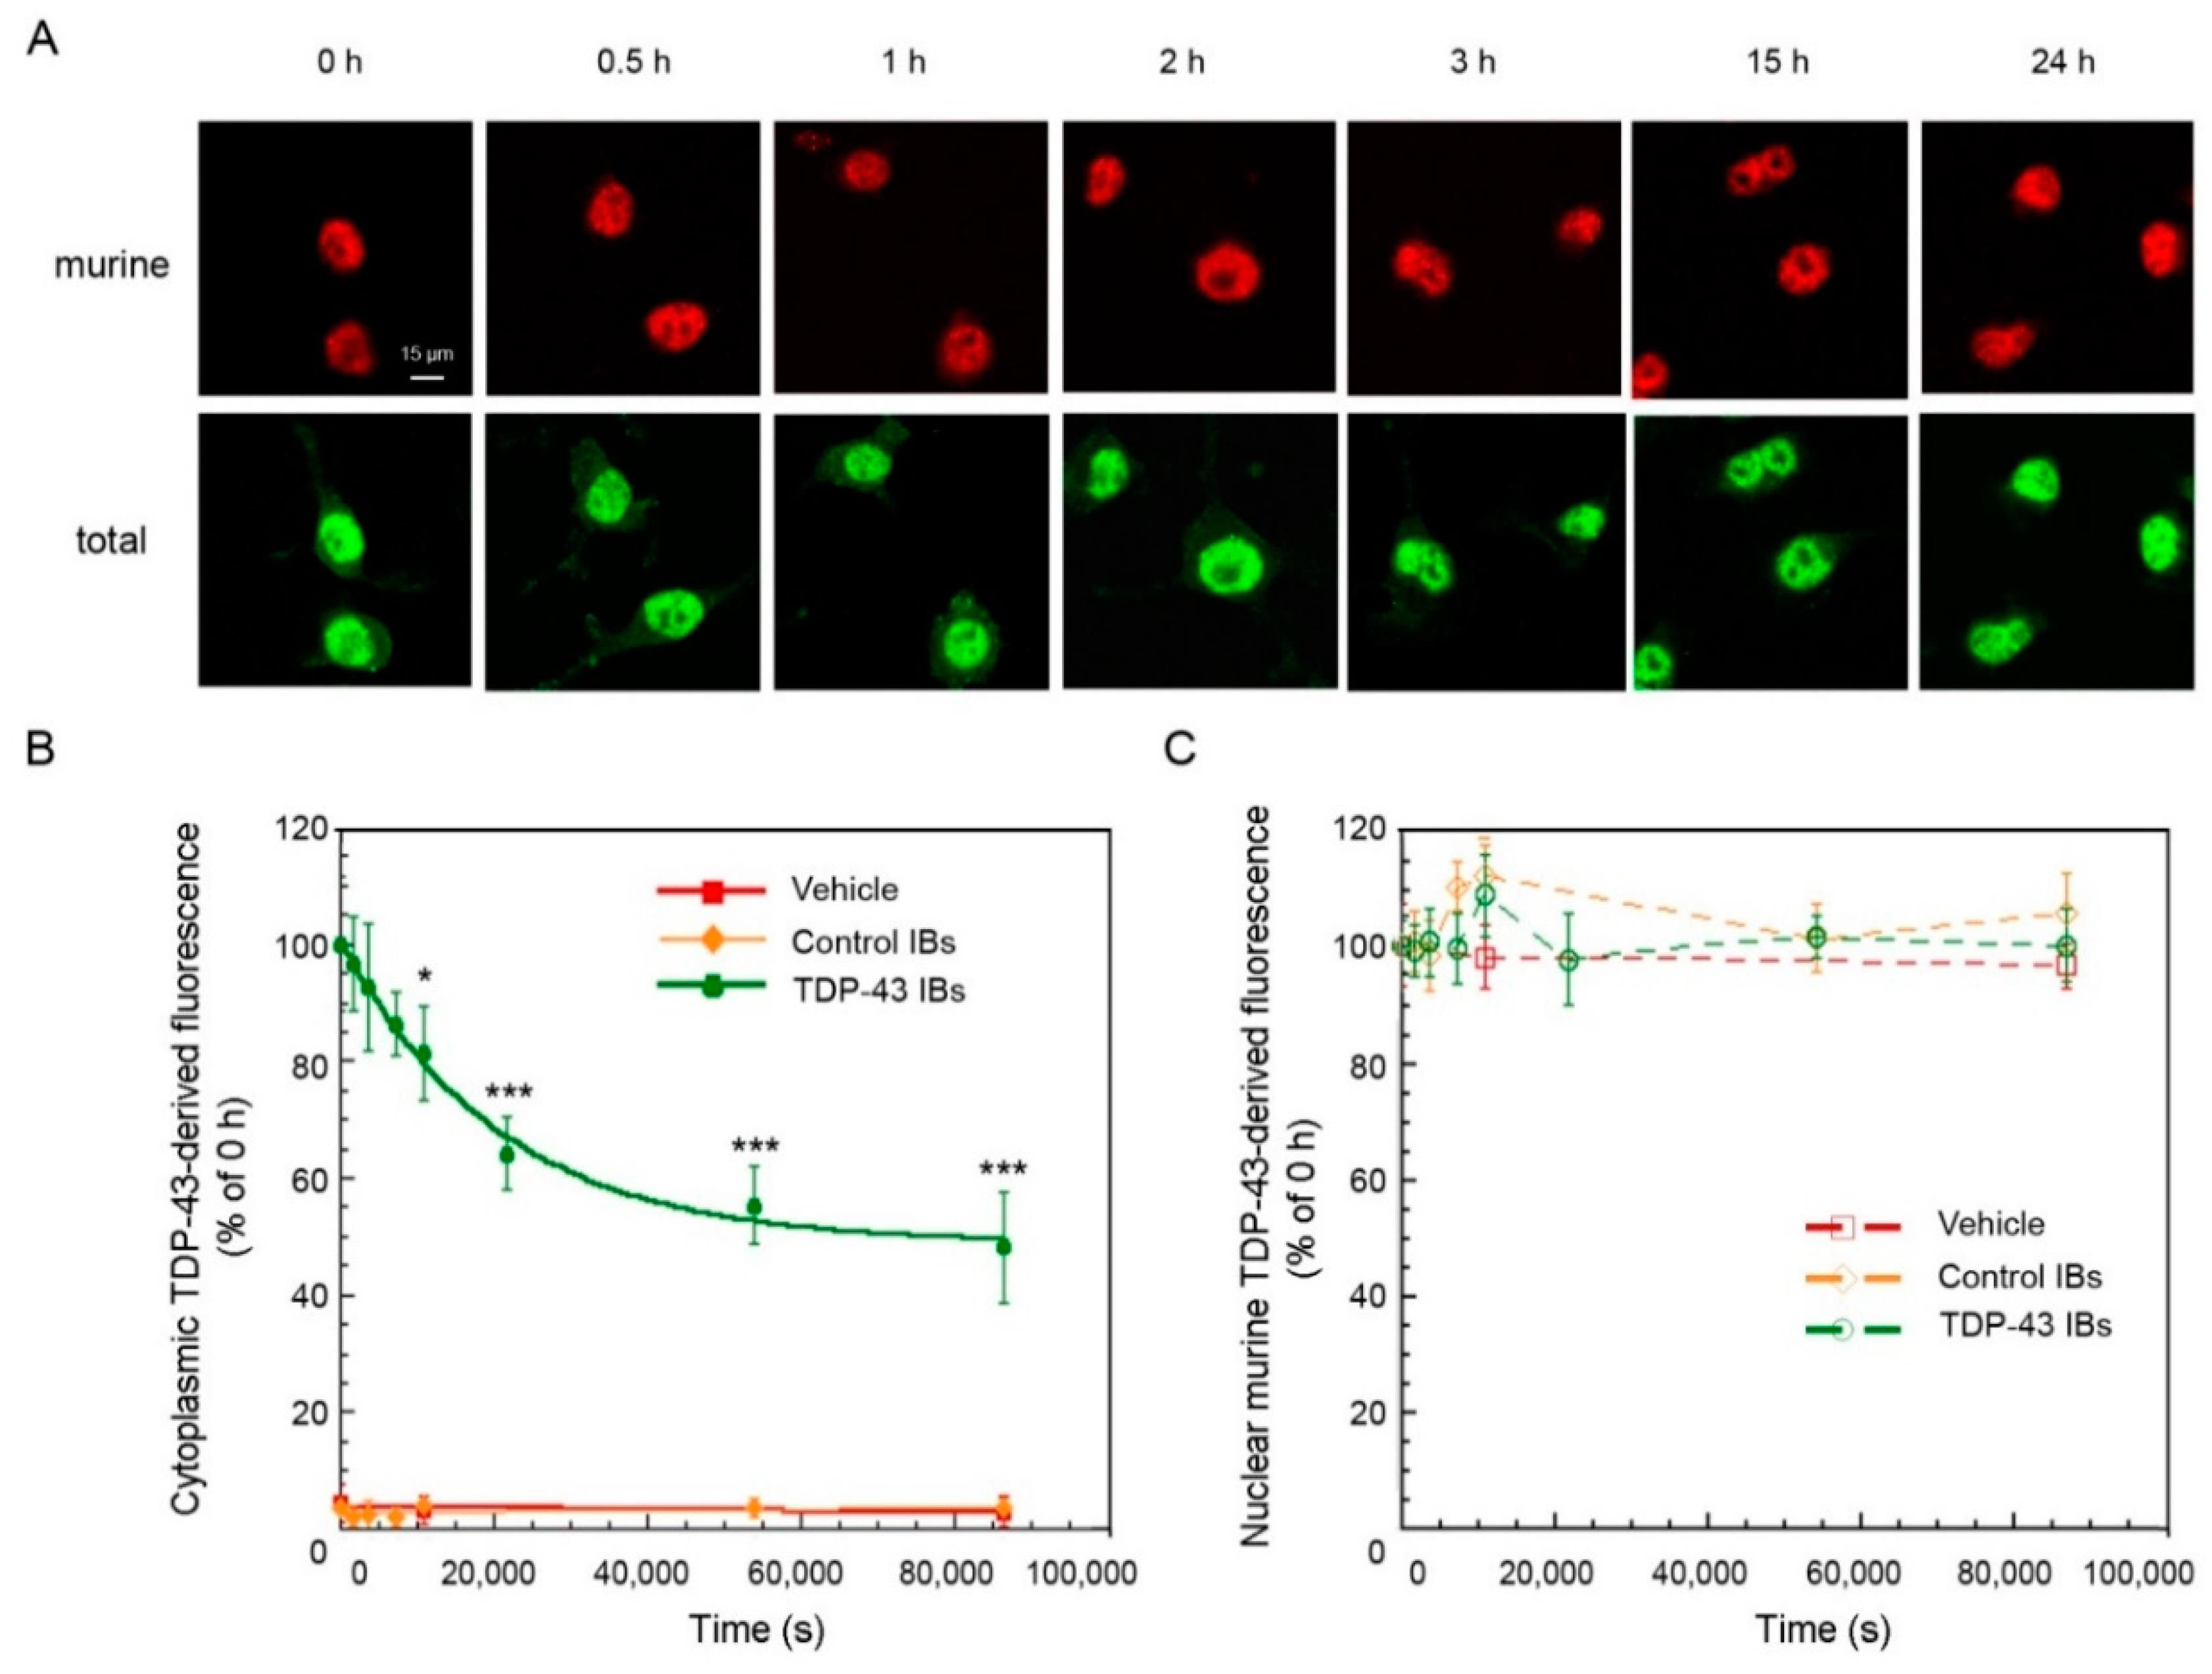
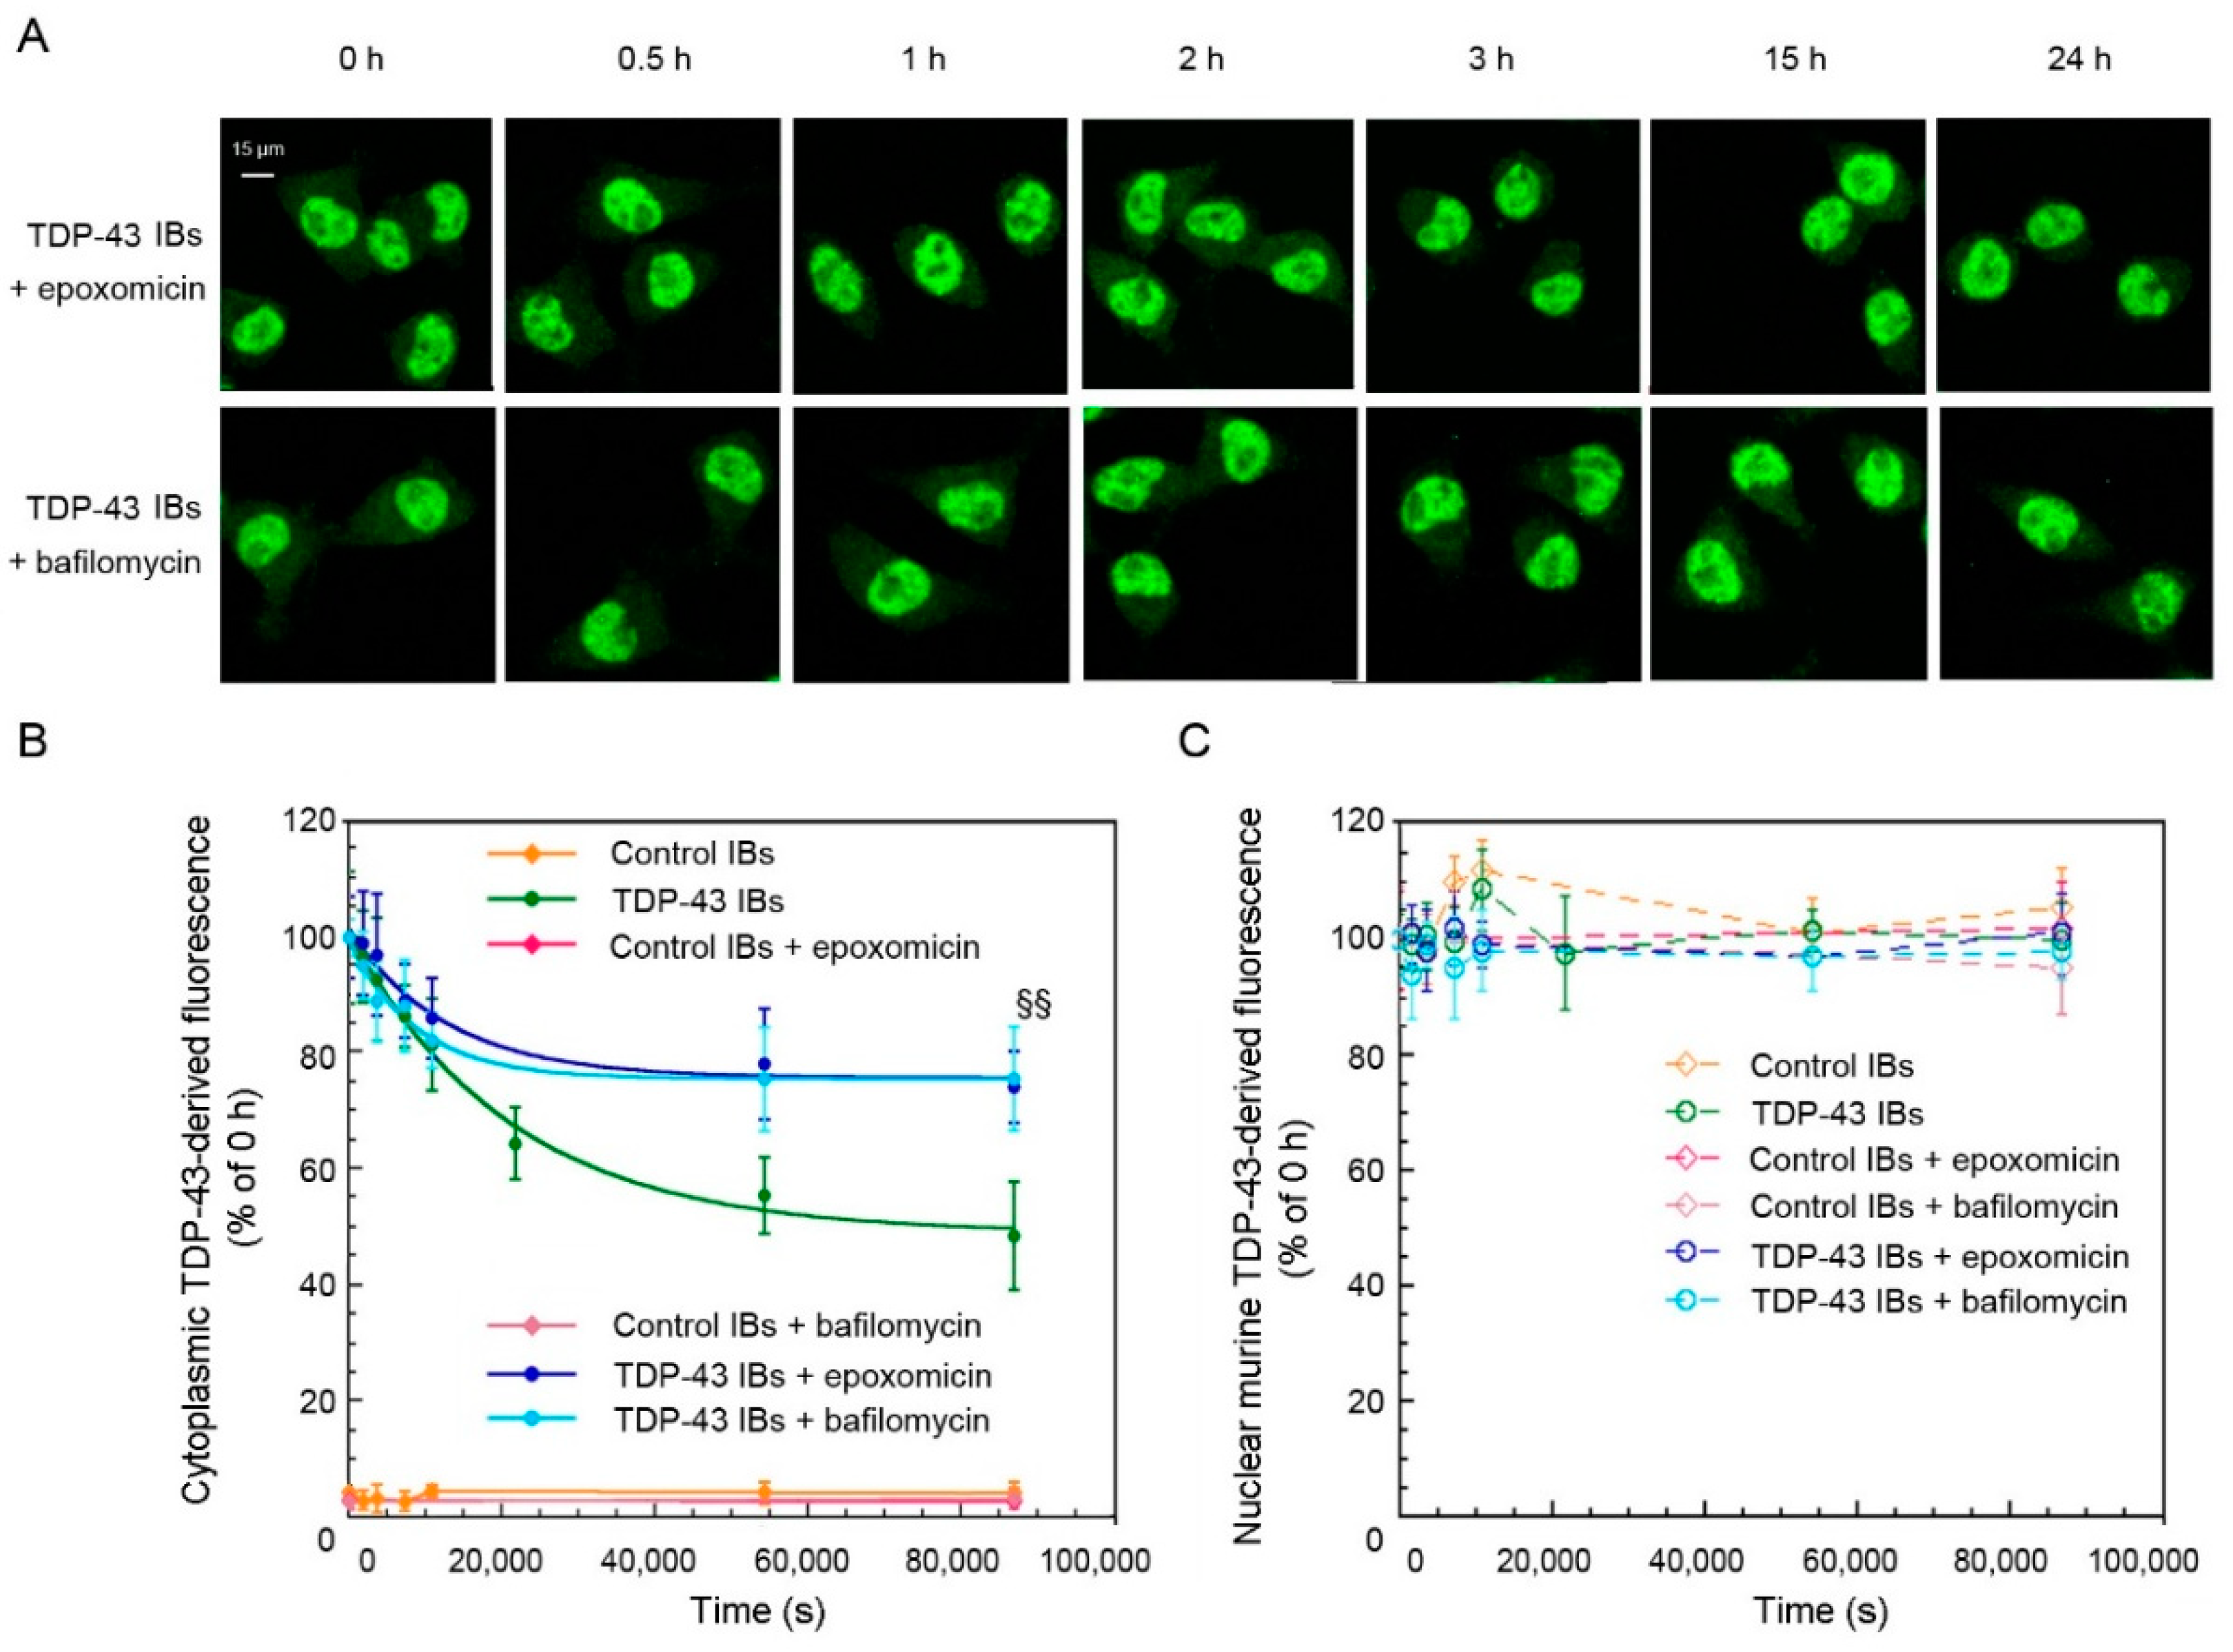
2.3. TDP-43 Aggregates Are Degraded by Proteasome and Autophagy Systems
3. Discussion
4. Materials and Methods
4.1. Purification of TDP-43 Inclusions and Internalization in N2a Neuroblastoma Cells
4.2. Confocal Microscopy Analysis of TDP-43 Inclusions in N2A Neuroblastoma Cells
4.3. Analysis of Phosphorylation and Ubiquitination of TDP-43 IBs
4.4. Analysis of Ca2+ Levels
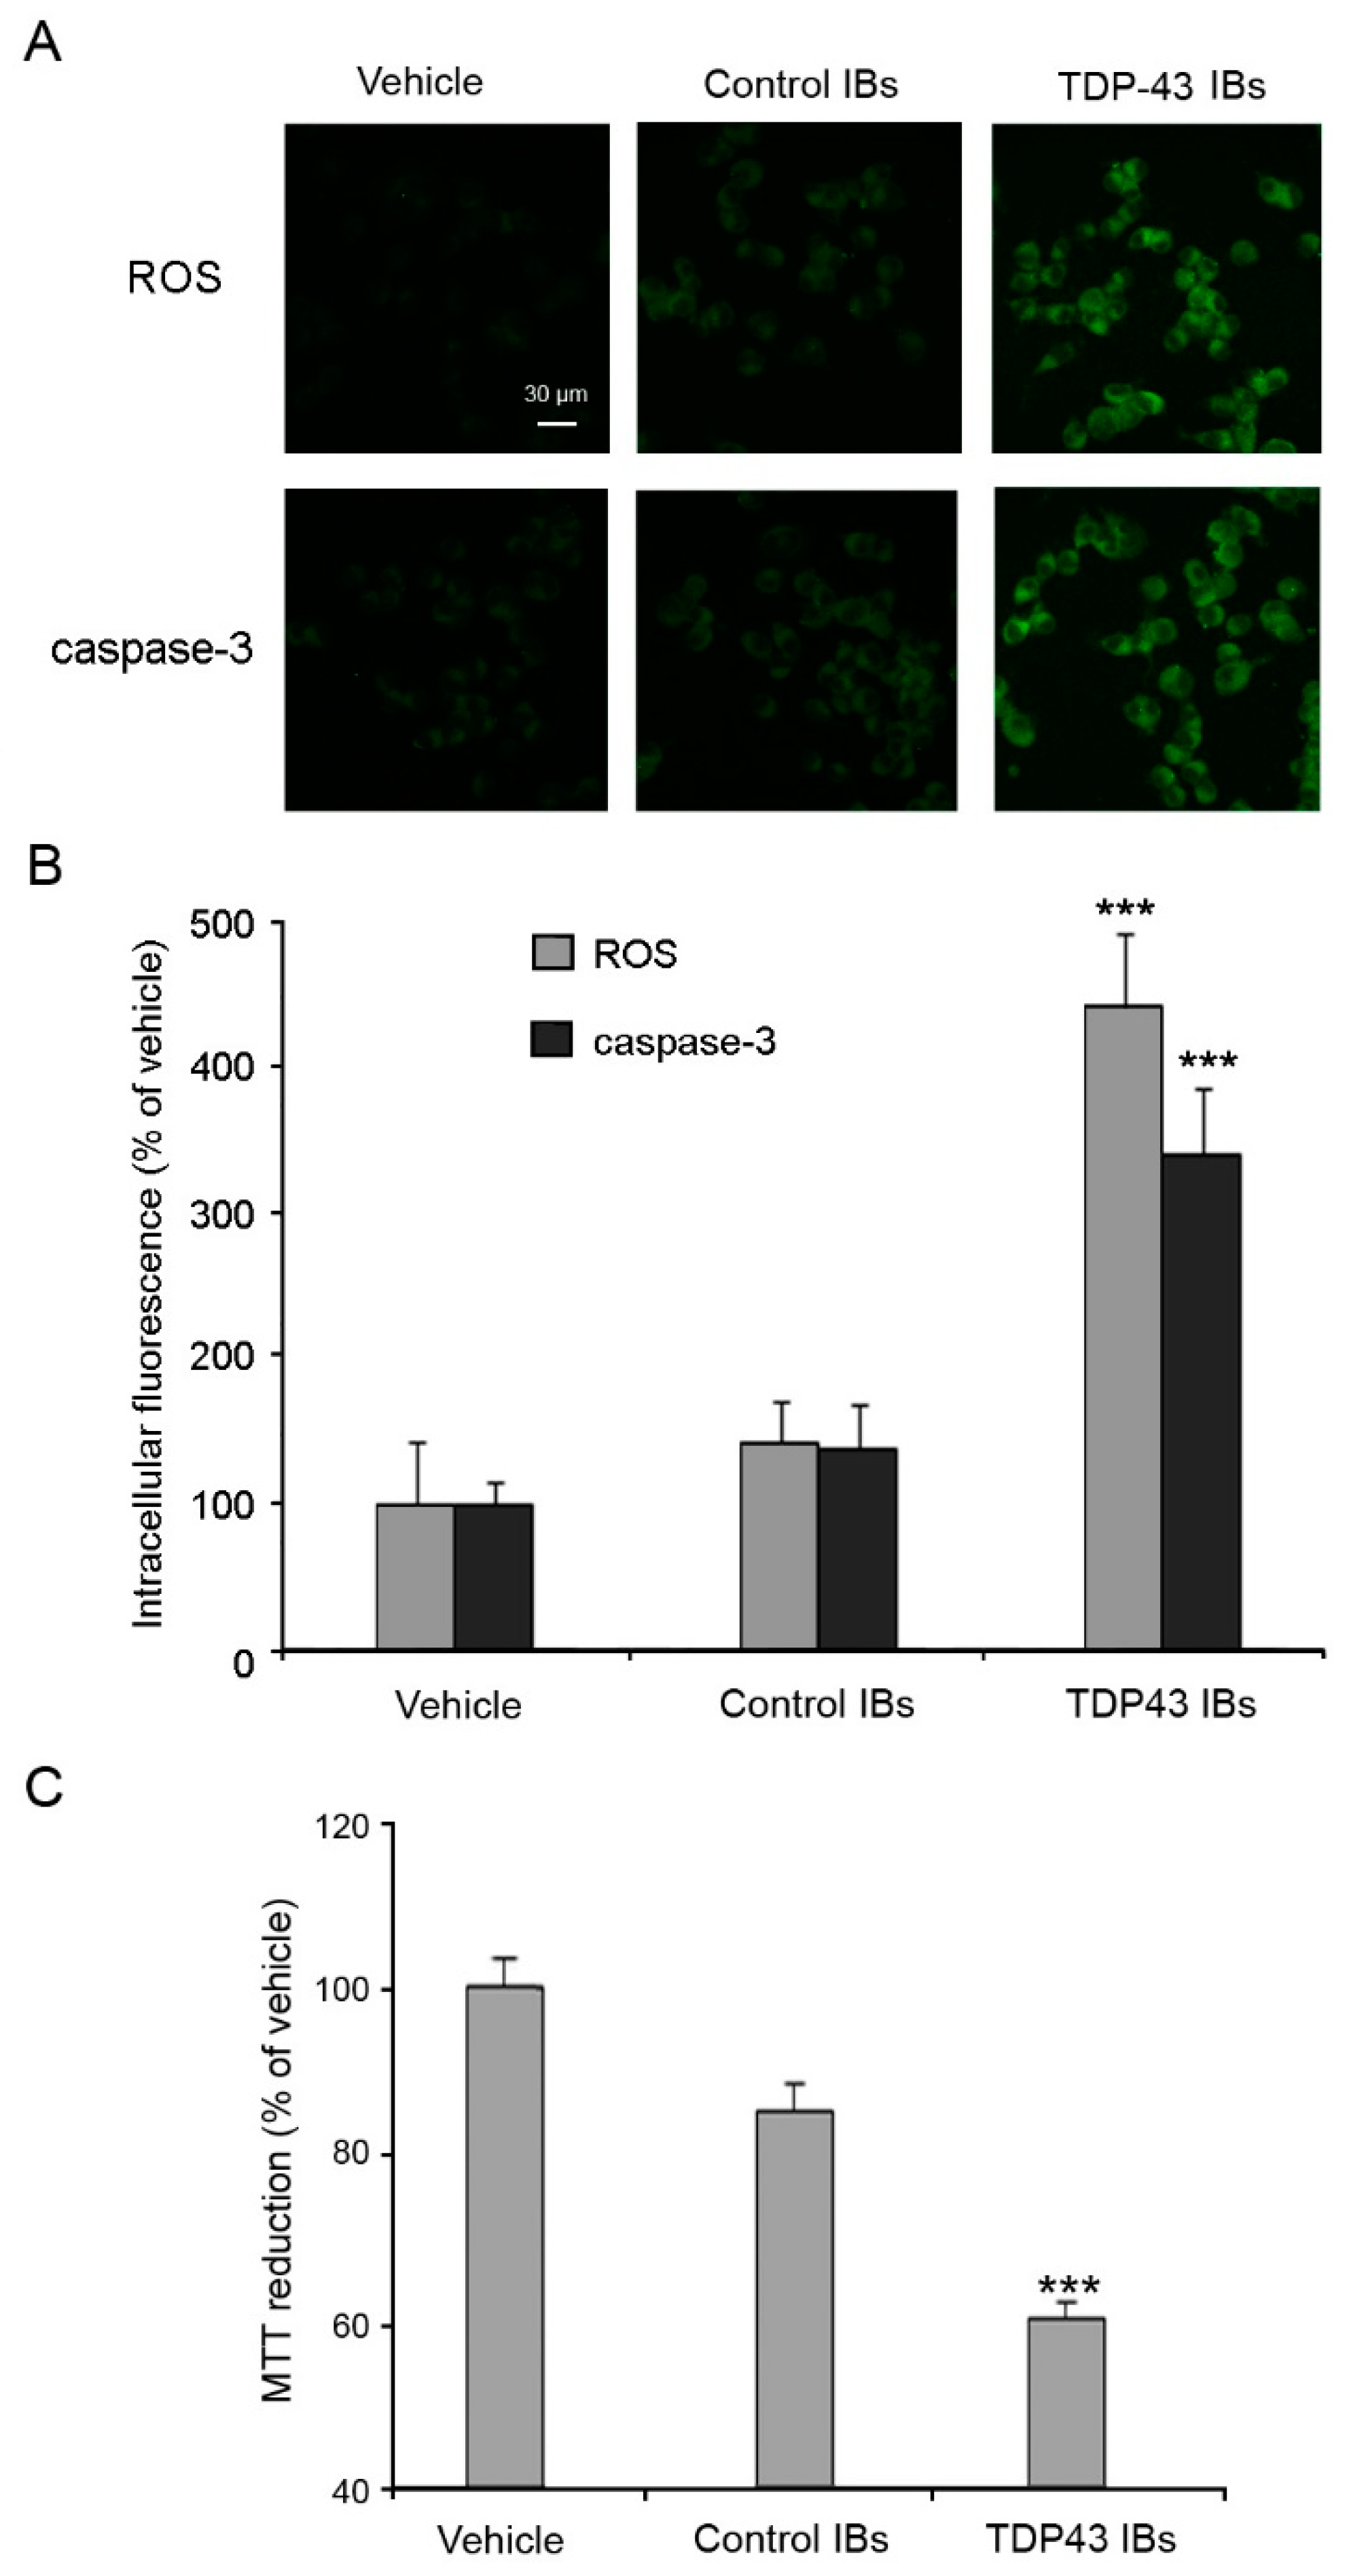
4.5. Measurement of Intracellular ROS Production, Caspase-3 Activation and Cell Viability
4.6. Time-Course of TDP-43 Degradation in the Absence or Presence of UPS and ALP Inhibitors
4.7. Statistical Analysis
5. Conclusion
Author Contributions
Funding
Conflicts of Interest
Abbreviations
| ALP | autophagy-lysosomal pathway |
| ALS | Amyotrophic lateral sclerosis |
| CGP | CGP-37157 |
| CNQX | 6-cyano-7-nitroquinoxaline-2,3-dione |
| CsA | cyclosporine A |
| DMEM | Dulbecco’s Modified Eagle’s Medium |
| FBS | fetal bovine serum |
| FTLD | frontotemporal lobar degeneration |
| GST | glutathione S-transferase |
| MTT | 3-(4,5-dimethylthiazol-2-yl)-2,5-diphenyltetrazolium bromide |
| TDP-43 | TAR DNA-binding protein 43 |
| TDP-43 IBs | TDP-43 inclusion bodies |
| UPS | ubiquitin-proteasome system |
References
- Neumann, M.; Sampathu, D.M.; Kwong, L.K.; Truax, A.C.; Micsenyi, M.C.; Chou, T.T.; Bruce, J.; Schuck, T.; Grossman, M.; Clark, C.M.; et al. Ubiquitinated TDP-43 in frontotemporal lobar degeneration and amyotrophic lateral sclerosis. Science 2006, 314, 130–133. [Google Scholar] [CrossRef] [PubMed]
- Igaz, L.M.; Kwong, L.K.; Xu, Y.; Truax, A.C.; Uryu, K.; Neumann, M.; Clark, C.M.; Elman, L.B.; Miller, B.L.; Grossman, M.; et al. Enrichment of C-terminal fragments in TAR DNA-binding protein-43 cytoplasmic inclusions in brain but not in spinal cord of frontotemporal lobar degeneration and amyotrophic lateral sclerosis. Am. J. Pathol. 2008, 173, 182–194. [Google Scholar] [CrossRef] [PubMed]
- Rowland, L.P.; Shneider, N.A. Amyotrophic lateral sclerosis. N. Engl. J. Med. 2011, 344, 1688–1700. [Google Scholar] [CrossRef] [PubMed]
- Ling, S.C.; Polymenidou, M.; Cleveland, D.W. Converging mechanisms in ALS and FTD: Disrupted RNA and protein homeostasis. Neuron 2013, 79, 416–438. [Google Scholar] [CrossRef] [PubMed]
- Davidson, Y.; Kelley, T.; MacKenzie, I.R.A.; Pickering-Brown, S.; Du Plessis, D.; Neary, D.; Snowden, J.S.; Mann, D.M.A. Ubiquitinated pathological lesions in frontotemporal lobar degeneration contain the TAR DNA-binding protein, TDP-43. Acta Neuropathol. 2007, 113, 521–533. [Google Scholar] [CrossRef]
- Arai, T.; Hasegawa, M.; Akiyama, H.; Ikeda, K.; Nonaka, T.; Mori, H.; Mann, D.; Tsuchiya, K.; Yoshida, M.; Hashizume, Y.; et al. TDP-43 is a component of ubiquitin-positive tau-negative inclusions in frontotemporal lobar degeneration and amyotrophic lateral sclerosis. Biochem. Biophys. Res. Commun. 2006, 351, 602–611. [Google Scholar] [CrossRef] [PubMed]
- Ferraiuolo, L.; Kirby, J.; Grierson, A.J.; Sendtner, M.; Shaw, P.J. Molecular pathways of motor neuron injury in amyotrophic lateral sclerosis. Nat. Rev. Neurol. 2011, 7, 616–630. [Google Scholar] [CrossRef]
- Borroni, B.; Alberici, A.; Buratti, E. Review: Molecular pathology of frontotemporal lobar degenerations. Neuropathol. Appl. Neurobiol. 2019, 45, 41–57. [Google Scholar] [CrossRef]
- Lee, E.B.; Lee, V.M.Y.; Trojanowski, J.Q. Gains or losses: Molecular mechanisms of TDP43-mediated neurodegeneration. Nat. Rev. Neurosci. 2011, 13, 38–50. [Google Scholar] [CrossRef]
- Cascella, R.; Capitini, C.; Fani, G.; Dobson, C.M.; Cecchi, C.; Chiti, F. Quantification of the relative contributions of loss-of-function and gain-of-function mechanisms in TAR DNA-binding protein 43 (TDP-43) proteinopathies. J. Biol. Chem. 2016, 291, 19437–19448. [Google Scholar] [CrossRef]
- Capitini, C.; Conti, S.; Perni, M.; Guidi, F.; Cascella, R.; De Poli, A.; Penco, A.; Relini, A.; Cecchi, C.; Chiti, F. TDP-43 Inclusion Bodies Formed in Bacteria Are Structurally Amorphous, Non-Amyloid and Inherently Toxic to Neuroblastoma Cells. PLoS ONE 2014, 9, e86720. [Google Scholar] [CrossRef] [PubMed]
- Ayala, Y.M.; Zago, P.; D’Ambrogio, A.; Xu, Y.F.; Petrucelli, L.; Buratti, E.; Baralle, F.E. Structural determinants of the cellular localization and shuttling of TDP-43. J. Cell Sci. 2008, 121, 3778–3785. [Google Scholar] [CrossRef] [PubMed] [Green Version]
- Winton, M.J.; Igaz, L.M.; Wong, M.M.; Kwong, L.K.; Trojanowski, J.Q.; Lee, V.M.Y. Disturbance of Nuclear and Cytoplasmic TAR DNA-binding Protein (TDP-43) Induces Disease-like Redistribution, Sequestration, and Aggregate Formation. J. Biol. Chem. 2008, 283, 13302–13309. [Google Scholar] [CrossRef] [PubMed] [Green Version]
- Chou, C.C.; Zhang, Y.; Umoh, M.E.; Vaughan, S.W.; Lorenzini, I.; Liu, F.; Sayegh, M.; Donlin-Asp, P.G.; Chen, Y.H.; Duong, D.M.; et al. TDP-43 pathology disrupts nuclear pore complexes and nucleocytoplasmic transport in ALS/FTD. Nat. Neurosci. 2018, 21, 228–239. [Google Scholar] [CrossRef] [PubMed] [Green Version]
- Grosskreutz, J.; Bosch, L.V.D.; Keller, B.U. Calcium dysregulation in amyotrophic lateral sclerosis. Cell Calcium 2010, 47, 165–174. [Google Scholar] [CrossRef] [PubMed]
- Lautenschläger, J.; Prell, T.; Ruhmer, J.; Weidemann, L.; Witte, O.W.; Grosskreutz, J. Overexpression of human mutated G93A SOD1 changes dynamics of the ER mitochondria calcium cycle specifically in mouse embryonic motor neurons. Exp. Neurol. 2013, 247, 91–100. [Google Scholar] [CrossRef] [PubMed]
- Krols, M.; van Isterdael, G.; Asselbergh, B.; Kremer, A.; Lippens, S.; Timmerman, V.; Janssens, S. Mitochondria-associated membranes as hubs for neurodegeneration. Acta Neuropathol. 2016, 131, 505–523. [Google Scholar] [CrossRef] [Green Version]
- Berson, A.; Sartoris, A.; Nativio, R.; Van Deerlin, V.; Toledo, J.B.; Porta, S.; Liu, S.; Chung, C.Y.; Garcia, B.A.; Lee, V.M.Y.; et al. TDP-43 Promotes Neurodegeneration by Impairing Chromatin Remodeling. Curr. Biol. 2017, 27, 3579–3590. [Google Scholar] [CrossRef]
- Urushitani, M.; Sato, T.; Bamba, H.; Hisa, Y.; Tooyama, I. Synergistic effect between proteasome and autophagosome in the clearance of polyubiquitinated TDP-43. J. Neurosci. Res. 2010, 88, 784–797. [Google Scholar] [CrossRef]
- Crippa, V.; Sau, D.; Rusmini, P.; Boncoraglio, A.; Onesto, E.; Bolzoni, E.; Galbiati, M.; Fontana, E.; Marino, M.; Carra, S.; et al. The small heat shock protein B8 (HspB8) promotes autophagic removal of misfolded proteins involved in amyotrophic lateral sclerosis (ALS). Hum. Mol. Genet. 2010, 19, 3440–3456. [Google Scholar] [CrossRef] [Green Version]
- Scotter, E.L.; Vance, C.; Nishimura, A.L.; Lee, Y.B.; Chen, H.J.; Urwin, H.; Sardone, V.; Mitchell, J.C.; Rogelj, B.; Rubinsztein, D.C.; et al. Differential roles of the ubiquitin proteasome system and autophagy in the clearance of soluble and aggregated TDP-43 species. J. Cell Sci. 2014, 127, 1263–1278. [Google Scholar] [CrossRef] [PubMed]
- Barmada, S.J.; Serio, A.; Arjun, A.; Bilican, B.; Daub, A.; Ando, D.M.; Tsvetkov, A.; Pleiss, M.; Li, X.; Peisach, D.; et al. Autophagy induction enhances TDP43 turnover and survival in neuronal ALS models. Nat. Methods 2014, 10, 677–685. [Google Scholar] [CrossRef] [PubMed] [Green Version]
- Ju, J.S.; Fuentealba, R.A.; Jackson, E.; Piwnica-Worms, D.; Baloh, H.; Wehil, C.C. Valosin-containing protein (VCP) is required for autophagy and is disrupted in VCP disease. J. Cell Biol. 2009, 187, 875–888. [Google Scholar] [CrossRef]
- Johnson, J.O.; Mandrioli, J.; Banatar, M.; Abramzon, Y.; Van Deerlin, V.M.; Trojanowski, J.Q.; Gibbs, J.R.; Brunetti, M.; Gronka, S.; Wuu, J.; et al. Exome sequencing reveals VCP mutations as a cause of familial ALS. Neuron 2010, 68, 857–864. [Google Scholar] [CrossRef] [PubMed]
- Parkinson, N.; Ince, P.G.; Smith, M.O.; Highley, R.; Skibinski, G.; Andersen, P.M.; Morrison, K.E.; Pall, H.S.; Hardiman, O.; Collinge, J.; et al. MRC Proteomics in ALS Study, FReJA Consortium. ALS phenotypes with mutations in CHMP2B (charged multivesicular body protein 2B). Neurology 2006, 67, 1074–1077. [Google Scholar] [CrossRef]
- Maruyama, H.; Morino, H.; Ito, H.; Izumi, Y.; Kato, H.; Watanabe, Y.; Kinoshita, Y.; Kamada, M.; Nodera, H.; Suzuki, H.; et al. Mutations of optineurin in amyotrophic lateral sclerosis. Nature 2010, 465, 223–226. [Google Scholar] [CrossRef]
- Pottier, C.; Bieniek, K.F.; Finch, N.; van de Vorst, M.; Baker, M.; Perkersen, R.; Brown, P.; Ravenscroft, T.; van Blitterswijk, M.; Nicholson, A.M.; et al. Whole-genome sequencing reveals important role for TBK1 and OPTN mutations in frontotemporal lobar degeneration without motor neuron disease. Acta Neuropathol. 2015, 130, 77–92. [Google Scholar] [CrossRef]
- Fecto, F.; Yan, J.; Vemula, S.P.; Liu, E.; Yang, Y.; Chen, W.; Zheng, J.G.; Shi, Y.; Siddique, N.; Arrat, H.; et al. SQSTM1 Mutations in Familial and Sporadic Amyotrophic Lateral Sclerosis. Arch. Neurol. 2011, 68, 1440–1446. [Google Scholar] [CrossRef]
- Rea, S.L.; Majcher, V.; Searle, M.S.; Layfield, R. SQSTM1 mutations–bridging Paget disease of bone and ALS/FTLD. Exp. Cell Res. 2014, 325, 27–37. [Google Scholar] [CrossRef]
- Cirulli, E.T.; Lasseigne, B.N.; Petrovski, S.; Sapp, P.C.; Dion, P.A.; Leblond, C.S.; Couthouis, J.; Lu, Y.-F.; Wang, Q.; Krueger, B.J.; et al. Exome sequencing in amyotrophic lateral sclerosis identifies risk genes and pathways. Science 2015, 347, 1436–1441. [Google Scholar] [CrossRef] [Green Version]
- Freischmidt, A.; Wieland, T.; Richter, B.; Ruf, W.; Schaeffer, V.; Müller, K.; Marroquin, N.; Nordin, F.; Hübers, A.; Weydt, P.; et al. Haploinsufficiency of TBK1 causes familial ALS and fronto-temporal dementia. Nat. Neurosci. 2015, 18, 631–636. [Google Scholar] [CrossRef] [PubMed]
- Chow, C.Y.; Landers, J.E.; Bergren, S.K.; Sapp, P.C.; Grant, A.E.; Jones, J.M.; Everett, L.; Lenk, G.M.; McKenna-Yasek, D.M.; Weisman, L.S.; et al. Deleterious Variants of FIG4, a Phosphoinositide Phosphatase, in Patients with ALS. Am. J. Hum. Genet. 2009, 84, 85–88. [Google Scholar] [CrossRef] [PubMed] [Green Version]
- Yang, Y.; Hentati, A.; Deng, H.X.; Dabbagh, O.; Sasaki, T.; Hirano, M.; Hung, W.Y.; Ouahchi, K.; Yan, J.; Azim, A.C.; et al. The gene encoding alsin, a protein with three guanine-nucleotide exchange factor domains, is mutated in a form of recessive amyotrophic lateral sclerosis. Nat. Genet. 2001, 29, 160–165. [Google Scholar] [CrossRef] [PubMed]
- Hadano, S.; Hand, C.K.; Osuga, H.; Yanagisawa, Y.; Otomo, A.; Devon, R.S.; Miyamoto, N.; Showguchi-Miyata, J.; Okada, Y.; Singaraja, R.; et al. A gene encoding a putative GTPase regulator is mutated in familial amyotrophic lateral sclerosis 2. Nat. Genet. 2001, 29, 166–173. [Google Scholar] [CrossRef] [PubMed]
- DeJesus-Hernandez, M.; Mackenzie, I.R.; Boeve, B.F.; Boxer, A.L.; Baker, M.; Rutherford, N.J.; Nicholson, A.M.; Finch, N.A.; Flynn, H.; Adamson, J.; et al. Expanded GGGGCC hexanucleotide repeat in noncoding region of C9ORF72 causes chromosome9p-linked FTD and ALS. Neuron 2011, 72, 245–256. [Google Scholar] [CrossRef] [PubMed]
- Cascella, R.; Fani, G.; Capitini, C.; Rusmini, P.; Poletti, A.; Cecchi, C.; Chiti, F. Quantitative assessment of the degradation of aggregated TDP-43 mediated by the ubiquitin proteasome system and macroautophagy. FASEB J. 2017, 12, 5609–5624. [Google Scholar] [CrossRef] [PubMed]
- Duffy, L.M.; Chapman, A.L.; Shaw, P.J.; Grierson, A.J. The role of mitochondriain the pathogenesis of amyotrophic lateral sclerosis. Neuropathol. Appl. Neurobiol. 2011, 37, 336–352. [Google Scholar] [CrossRef] [PubMed]
- Imamura, K.; Sahara, N.; Kanaan, N.M.; Tsukita, K.; Kondo, T.; Kutoku, Y.; Ohsawa, Y.; Sunada, Y.; Kawakami, K.; Hotta, A.; et al. Calcium dysregulation contributes to neurodegeneration in FTLD patient iPSC-derived neurons. Sci. Rep. 2016, 6, 34904. [Google Scholar] [CrossRef] [PubMed] [Green Version]
- McKinnon, C.; Tabrizi, S.J. The Ubiquitin-Proteasome System in Neurodegeneration. Antioxid. Redox Signal. 2014, 21, 2302–2321. [Google Scholar] [CrossRef]
- Martinez-Lopez, N.; Athonvarangkul, D.; Singh, R. Autophagy and aging. Adv. Exp. Med. Biol. 2015, 847, 73–87. [Google Scholar]
- Ruegsegger, C.; Saxena, S. Proteostasis impairment in LS. Brain Res. 2016, 1648, 571–579. [Google Scholar] [CrossRef] [PubMed]
- Cenini, G.; Lloret, A.; Cascella, R. Oxidative Stress in Neurodegenerative Diseases: From a Mitochondrial Point of View. Oxidative Med. Cell. Longev. 2019, 2019, 1–18. [Google Scholar] [CrossRef] [PubMed] [Green Version]
- Berridge, M.J. The endoplasmic reticulum: A multifunctional signaling organelle. Cell Calcium 2002, 32, 235–249. [Google Scholar] [CrossRef] [PubMed]
- Pinton, P.; Giorgi, C.; Siviero, R.; Zecchini, E.; Rizzuto, R. Calcium and apoptosis: ER-mitochondria Ca2+ transfer in the control of apoptosis. Oncogene 2008, 27, 6407–6418. [Google Scholar] [CrossRef] [PubMed]
- Magrane, J.; Cortez, C.; Gan, W.B.; Manfredi, G. Manfredi, Abnormal mitochondrial transport and morphology are common pathological denominators in SOD1 and TDP43 ALS mouse models. Hum. Mol. Genet. 2014, 23, 1413–1424. [Google Scholar] [CrossRef] [PubMed]
- Wang, X.J.; Yu, J.; Wong, S.H.; Cheng, A.S.; Chan, F.K.; Ng, S.S.; Cho, C.H.; Sung, J.J.; Wu, W.K. A novel crosstalk between two major protein degradation systems: Regulation of proteasomal activity by autophagy. Autophagy 2013, 9, 1500–1508. [Google Scholar] [CrossRef] [PubMed]
- Bang, Y.; Kang, B.Y.; Choi, H.J. Preconditioning stimulus of proteasome inhibitor enhances aggresome formation and autophagy in differentiated SH-SY5Y cells. Neurosci. Lett. 2014, 566, 263–268. [Google Scholar] [CrossRef]
- Cappelli, S.; Penco, A.; Mannini, B.; Wilson, M.R.; Buxbaum, J.N.; Dobson, C.M.; Chiti, F.; Cascella, R.; Ecroyd, H.; Li, X.; et al. Effect of molecular chaperones on aberrant protein oligomers in vitro: Super-versus sub-stoichiometric chaperone concentrations. Biol. Chem. 2016, 397, 401–415. [Google Scholar] [CrossRef]
- Cascella, R.; Evangelisti, E.; Bigi, A.; Becatti, M.; Fiorillo, C.; Stefani, M.; Chiti, F.; Cecchi, C. Soluble Oligomers Require a Ganglioside to Trigger Neuronal Calcium Overload. J. Alzheimers Dis. 2017, 60, 923–938. [Google Scholar] [CrossRef]
- Evangelisti, E.; Cascella, R.; Becatti, M.; Marrazza, G.; Dobson, C.M.; Chiti, F.; Stefani, M.; Cecchi, C. Binding affinity of amyloid oligomers to cellular membranes is a generic indicator of cellular dysfunction in protein misfolding diseases. Sci. Rep. 2016, 6, 32721. [Google Scholar] [CrossRef]
- Cox, D.A.; Matlib, M.A. A role for the mitochondrial Na(+)-Ca2+ exchanger in the regulation of oxidative phosphorylation in isolated heart mitochondria. J. Biol. Chem. 1993, 268, 938–947. [Google Scholar] [PubMed]
- Fournier, N.; Ducet, G.; Crevat, A. Action of cyclosporine on mitochondrial calcium fluxes. J. Bioenerg. Biomembr. 1987, 19, 297–303. [Google Scholar] [CrossRef] [PubMed]
- Meng, L.; Mohan, R.; Kwok, B.H.B.; Elofsson, M.; Sin, N.; Crews, C.M. Epoxomicin, a potent and selective proteasome inhibitor, exhibits in vivo antiinflammatory activity. Proc. Natl. Acad. Sci. USA 1999, 96, 10403–10408. [Google Scholar] [CrossRef] [PubMed]
- Yamamoto, A.; Tagawa, Y.; Yoshimori, T.; Moriyama, Y.; Masaki, R.; Tashiro, Y. Bafilomycin A1 prevents maturation of autophagic vacuoles by inhibiting fusion between autophagosomes and lysosomes in rat hepatoma cell line, H-4-II-E cells. Cell Struct. Funct. 1998, 23, 33–42. [Google Scholar] [CrossRef] [PubMed]


© 2019 by the authors. Licensee MDPI, Basel, Switzerland. This article is an open access article distributed under the terms and conditions of the Creative Commons Attribution (CC BY) license (http://creativecommons.org/licenses/by/4.0/).
Share and Cite
Cascella, R.; Fani, G.; Bigi, A.; Chiti, F.; Cecchi, C. Partial Failure of Proteostasis Systems Counteracting TDP-43 Aggregates in Neurodegenerative Diseases. Int. J. Mol. Sci. 2019, 20, 3685. https://0-doi-org.brum.beds.ac.uk/10.3390/ijms20153685
Cascella R, Fani G, Bigi A, Chiti F, Cecchi C. Partial Failure of Proteostasis Systems Counteracting TDP-43 Aggregates in Neurodegenerative Diseases. International Journal of Molecular Sciences. 2019; 20(15):3685. https://0-doi-org.brum.beds.ac.uk/10.3390/ijms20153685
Chicago/Turabian StyleCascella, Roberta, Giulia Fani, Alessandra Bigi, Fabrizio Chiti, and Cristina Cecchi. 2019. "Partial Failure of Proteostasis Systems Counteracting TDP-43 Aggregates in Neurodegenerative Diseases" International Journal of Molecular Sciences 20, no. 15: 3685. https://0-doi-org.brum.beds.ac.uk/10.3390/ijms20153685