Article

Effect of Tff3 Deficiency and ER Stress in the Liver

1
Department of Molecular Medicine, Ruđer Bošković Institute, Bijenička 54, 10 000 Zagreb, Croatia
2
Institute of Functional and Clinical Anatomy, Faculty of Medicine, Friedrich-Alexander-University Erlangen-Nürnberg, 91051 Erlangen, Germany
3
Department of Histology and Embryology, Faculty of Medicine, University of Osijek, J. Huttlera 4, HR-31000 Osijek, Croatia
4
ERA Chaire Team, Proteomics Laboratory, Faculty of Veterinary Medicine, University of Zagreb, Heinzelova 55, 10 000 Zagreb, Croatia
5
Department of Physiology and Immunology, Faculty of Medicine, University of Osijek, J. Huttlera 4, HR-31000 Osijek, Croatia
*
Author to whom correspondence should be addressed.
Int. J. Mol. Sci. 2019, 20(18), 4389; https://0-doi-org.brum.beds.ac.uk/10.3390/ijms20184389
Submission received: 1 August 2019 / Revised: 26 August 2019 / Accepted: 29 August 2019 / Published: 6 September 2019
(This article belongs to the Special Issue TFF Peptides: Lectins in Mucosal Protection and More)

Abstract

:
Endoplasmic reticulum (ER) stress, a cellular condition caused by the accumulation of unfolded proteins inside the ER, has been recognized as a major pathological mechanism in a variety of conditions, including cancer, metabolic and neurodegenerative diseases. Trefoil factor family (TFFs) peptides are present in different epithelial organs, blood supply, neural tissues, as well as in the liver, and their deficiency has been linked to the ER function. Complete ablation of Tff3 expression is observed in steatosis, and as the most prominent change in the early phase of diabetes in multigenic mouse models of diabesity. To elucidate the role of Tff3 deficiency on different pathologically relevant pathways, we have developed a new congenic mouse model Tff3−/−/C57BL6/N from a mixed background strain (C57BL6/N /SV129) by using a speed congenics approach. Acute ER stress was evoked by tunicamycin treatment, and mice were sacrificed after 24 h. Afterwards the effect of Tff3 deficiency was evaluated with regard to the expression of relevant oxidative and ER stress genes, relevant proinflammatory cytokines/chemokines, and the global protein content. The most dramatic change was noticed at the level of inflammation-related genes, while markers for unfolded protein response were not significantly affected. Ultrastructural analysis confirmed that the size of lipid vacuoles was affected as well. Since the liver acts as an important metabolic and immunological organ, the influence of Tff3 deficiency and physiological function possibly reflects on the whole organism.

1. Introduction

Proper protein folding and localization is crucial for protein function. Endoplasmic reticulum (ER) has the main role in the folding and dispatching of secretory and transmembrane proteins to the appropriate destinations. Various conditions, such as increased protein synthesis, decreased ER-associated degradation, disturbed lipid homeostasis, calcium efflux and oxidative stress, can lead to an accumulation of misfolded proteins, and subsequently trigger a condition known as ER stress (ERS) [1]. The adaptive mechanism activated in this situation is known as the unfolded protein response (UPR). The central role of the UPR is to restore protein homeostasis, but in case of a prolonged signal, such as chronic stress and/or severe damage, it can lead to apoptosis. The UPR forms a complex network mediated by three ER membrane-associated proteins, protein kinase R (PKR)-like endoplasmic reticulum kinase (PERK), inositol requiring enzyme 1 alpha (IRE1α) and activating transcription factor 6 alpha (ATF6α).
These signaling pathways change the expression of numerous genes involved in cytokine production, apoptosis, autophagy, glucose metabolism, folding chaperones and quality control [2]. ERS is recognized as a major pathological mechanism in a variety of conditions, including metabolic and neurodegenerative diseases. Its activation can exacerbate inflammatory and oxidative stress signaling pathways, leading to insulin resistance, fatty liver disease and obesity [3].
Trefoil factory family peptides (TFFs) have been linked to the ER function. Tff1-deficient mice have been shown to activate UPR in the stomach tissue [4], whilst Tff2-deficient mice exhibit an overexpression of the transporter associated with antigen processing 1 (Tap1), a protein involved in ER-associated degradation as well as the overexpression of chaperone Bcl2 associated athanogene 2 (Bag2) in the pyloric antrum [5]. Screening of the mouse cochlear cDNA library with yeast-two-hybrid assay identified Bcl2-associated athanogene 6 (Bag6/Bat3/Scythe) as a potential Tff3 interactive partner [6]. Bag6/Bat3/Scythe is a protein complex involved in apoptosis and the quality control of membrane proteins [7]. The study done on goblet cells analyzed the impact of lactic acid bacteria on intestinal health, and it demonstrated that tunicamycin (Tm), an inducer of ERS, downregulates the expression of the Tff3 gene [8]. Furthermore, mice deficient in the protein Oasis, a well-known ERS transducer, exhibit a significantly increased expression of Tff3 in goblet cells [9]. Tff3 (59 amino acid, 7 kDA), predominantly expressed in intestinal goblet cells, has a multifunctional role in protecting mucosa by being involved in cell migration, immune response and apoptosis [10,11].
TFFs’ presence in the bloodstream and in various other organs (lung, pancreas, mammary gland, inner ear, lymphoid tissue, and even in the brain) points to their general importance in the organism homeostasis [12]. It has been shown that Tff3 from the liver has neuroprotective and cardioprotective effects [13,14]. Liver Tff3, induced by ischemic brain injury, can pass the blood-brain barrier, and concentrate in an affected region, alleviating the damage. Gene expression of Tff3 in the liver is significantly downregulated in different mouse models of obesity [15,16], diabesity [17] and liver steatosis [18], conditions that are associated with ER dysfunction.
Considering its expression in various tissues and its multiple biological roles, including a role in relevant metabolic processes, it is necessary to have a controlled model to elucidate the specific role of Tff3 protein in different parts of organism. Existing Tff3-deficient mice [19], generated on a mixed genetic background (C57BL6J/Sv129), have a possible impact of additional mutations and unpredictable genetic combinations on different genetic loci. We have generated a novel congenic strain on a C57BL6/N genetic background to avoid, increased genetic heterogeneity [20], a known problem with heterozygous mixed background strains. Crossing males of the existing mixed background Tff3−/−/C57BL6/J/SV129 strain [19] with C57BL6/N females led to a novel strain deficient in Tff3 protein, while the rest of the genome is homozygotic, as in the wild type C57BL6/N strain. The C57BL6/J sub-strain has various mutations, including deletion within the nicotinamide nucleotide transhydrogenase (Nnt) gene, which causes an altered metabolic phenotype (https://www.jax.org/strain/000664) [21]. Hence, this C57BL6/N substrain is a more representative model for metabolic studies.
The aim of the present study was to develop a congenic Tff3-deficient mouse strain without any additional metabolically-relevant mutations, and to assess the impact of Tff3 deficiency on disease-related genes (ERS, oxidative stress and inflammation relevant genes) in the liver, as a major metabolic organ. Mice were exposed to acute ERS induced by Tm, a drug that blocks the initial step of N-glycosylation, leading to accumulation of misfolded proteins in the ER. Effects of acute ERS were monitored in the liver at the relevant gene/protein expression levels, which were shown to play roles in ERS and oxidative stress signaling, expression of inflammatory genes, and have an impact on the ultrastructural level.

2. Results

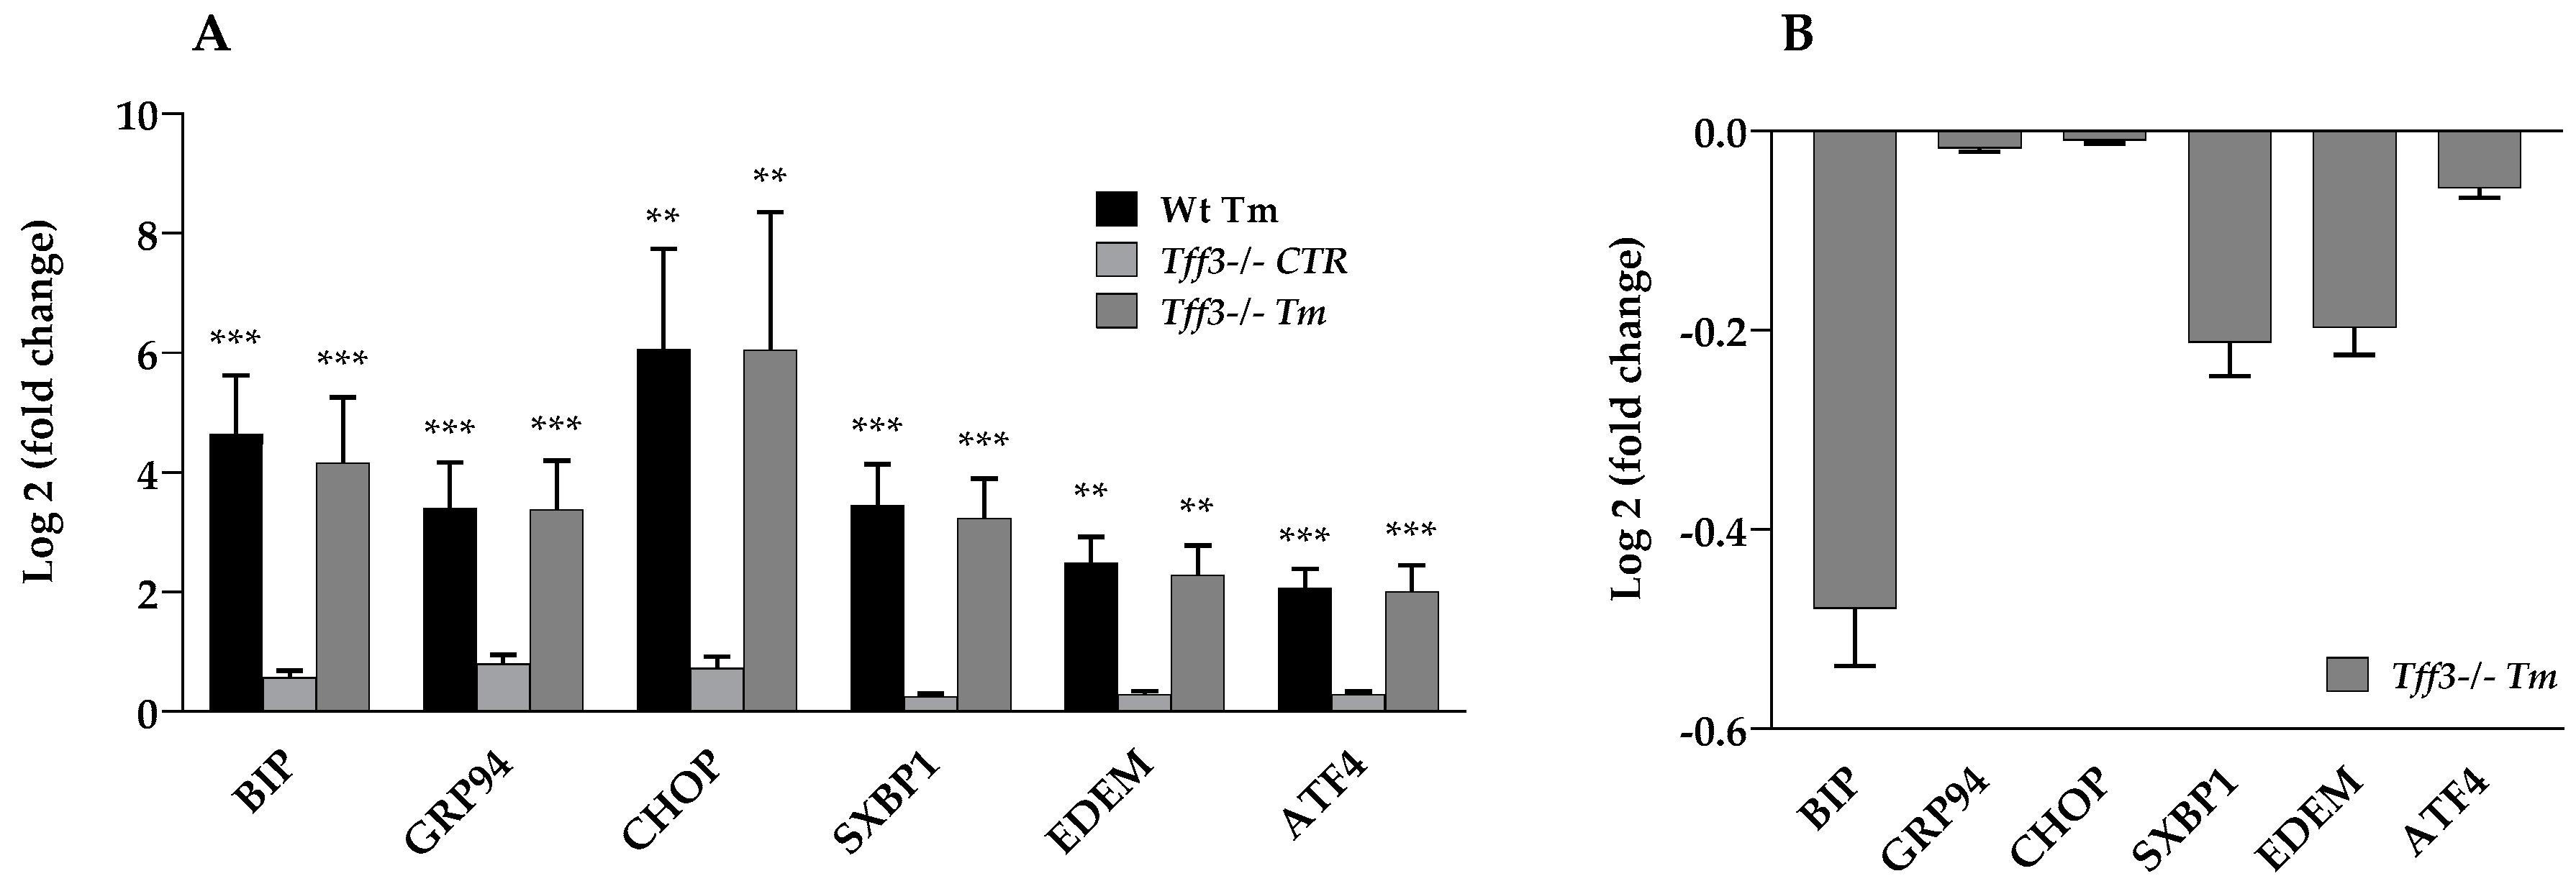
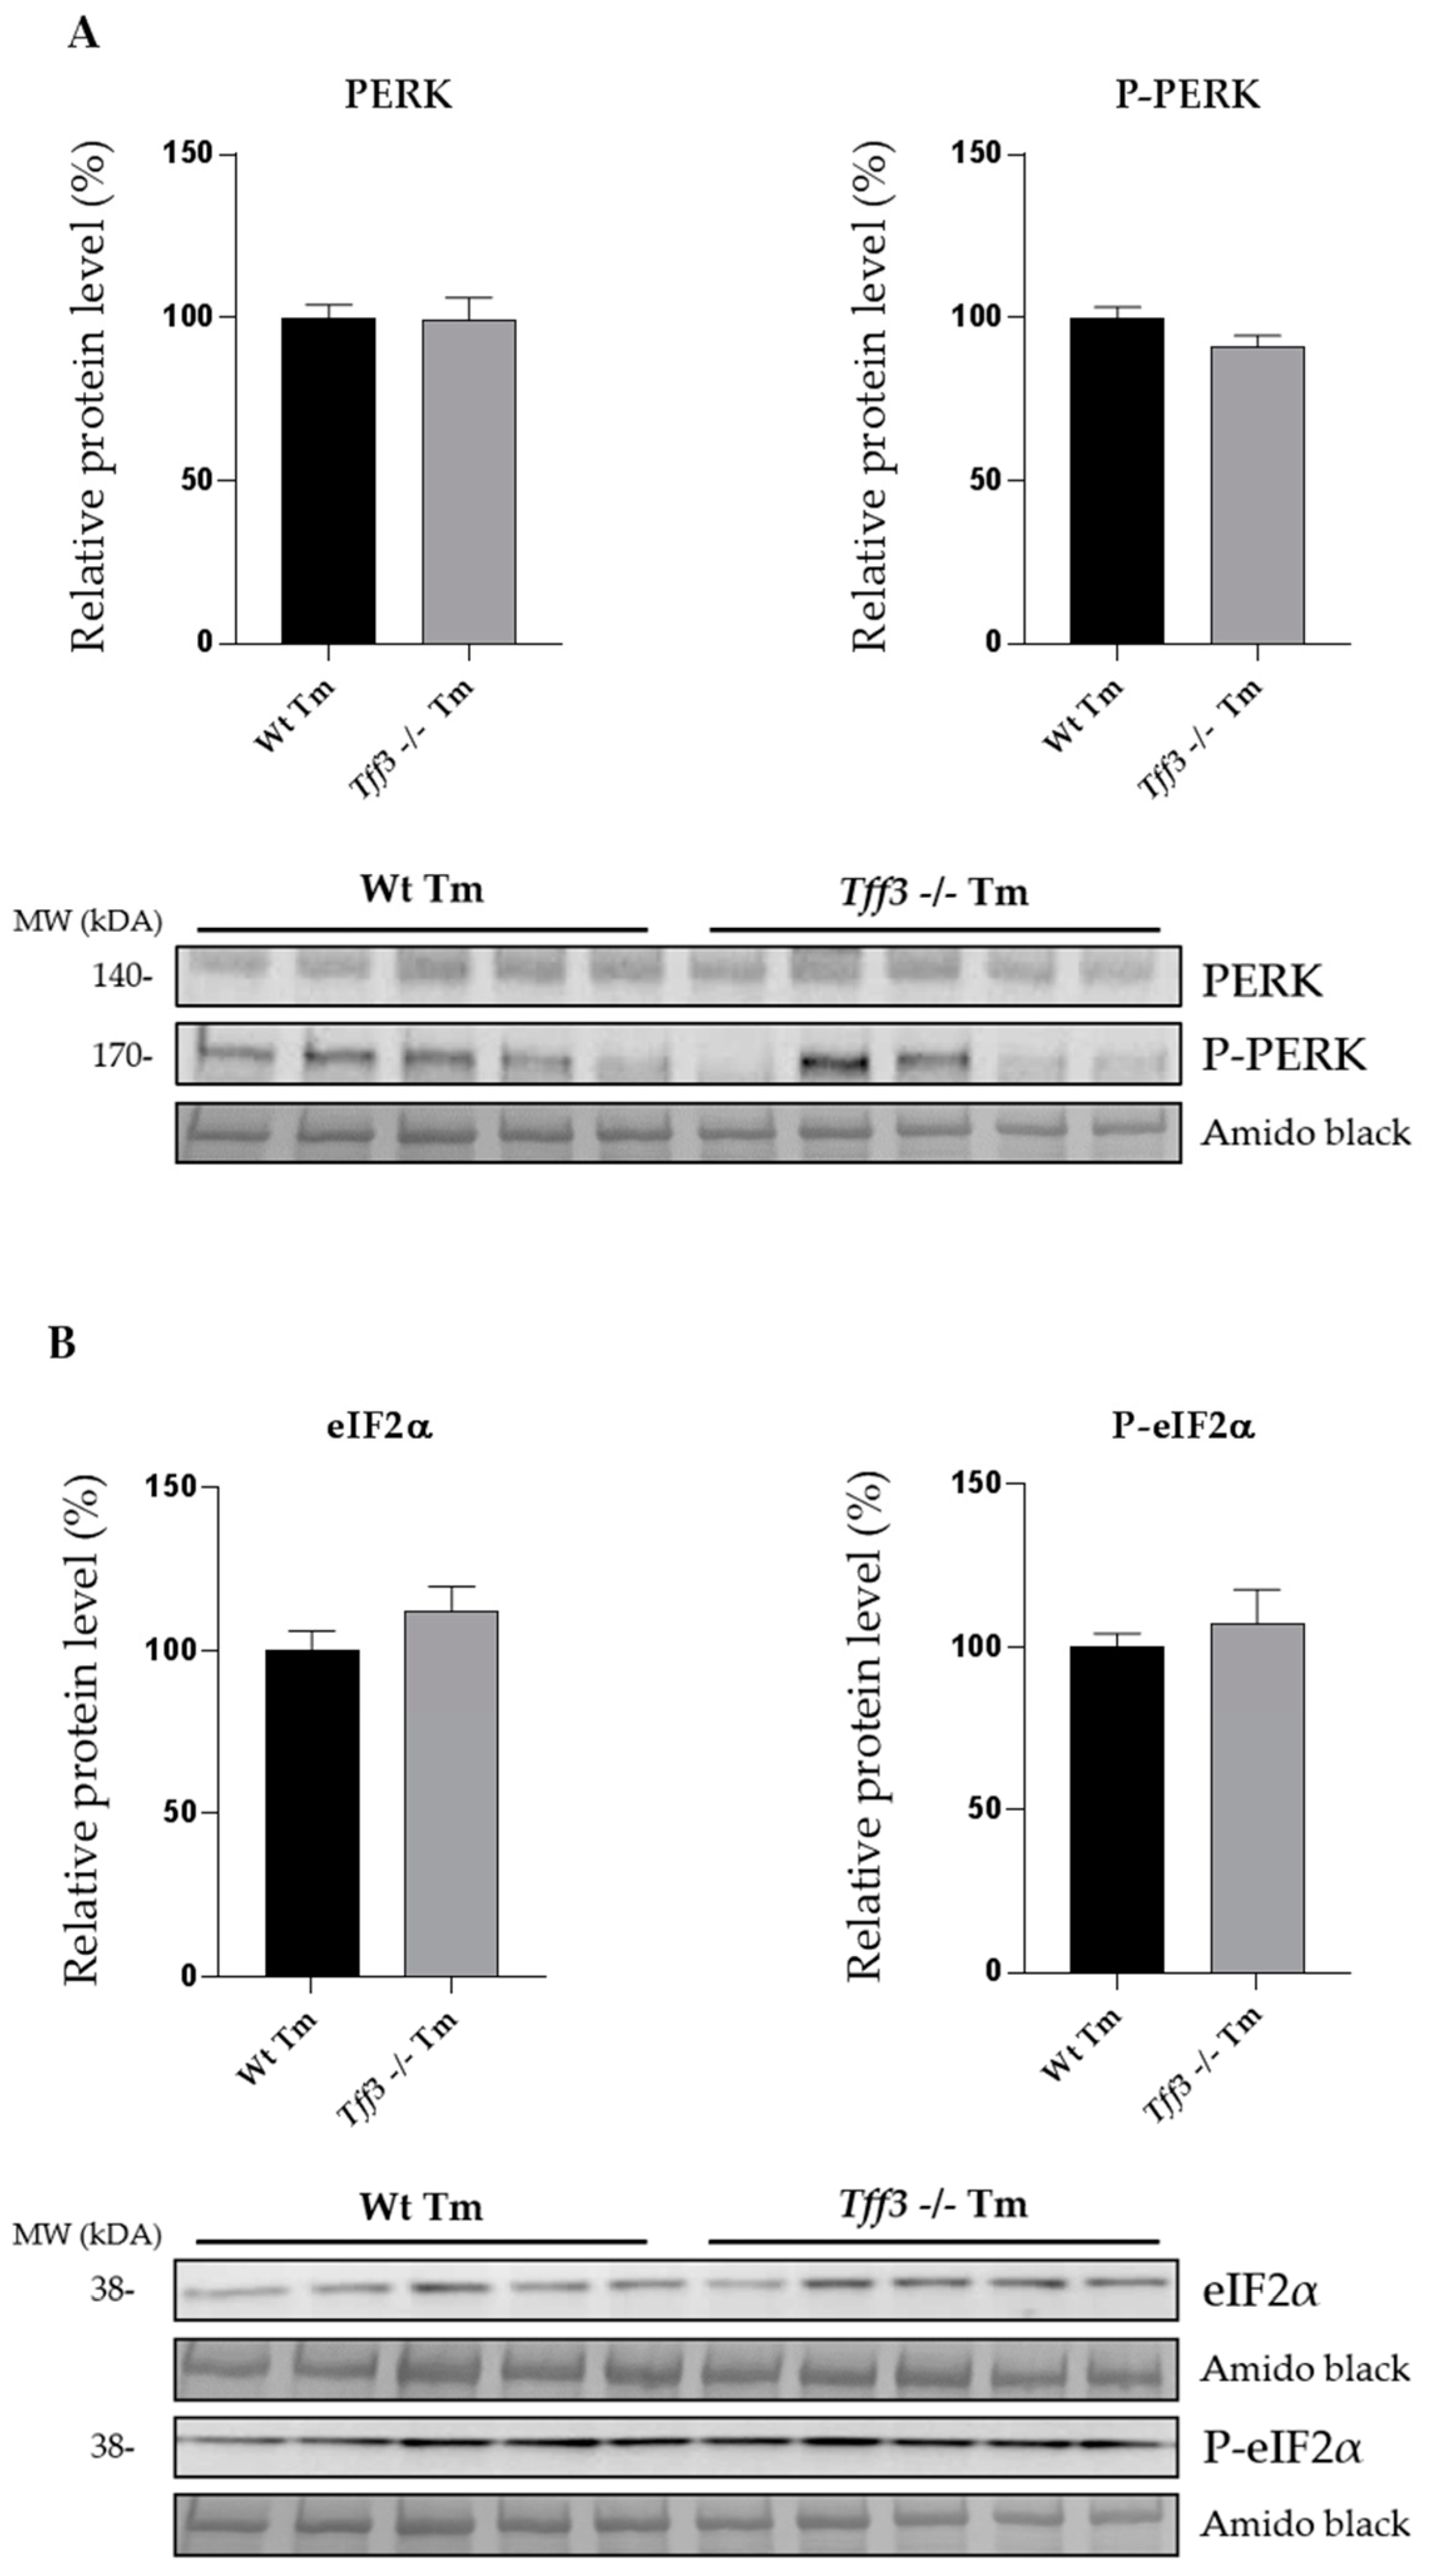
2.1. Expression of ER Stress Markers

To analyze the effect of Tff3 deficiency on ER stress in the liver, we monitored expression levels of the relevant ERS genes (Figure 1) and proteins (Figure 2) in wild type and Tff3-deficient, Tm-treated mice (Wt Tm and Tff3−/− Tm), as well as untreated controls (Wt CTR and Tff3−/− CTR). Liver tissue was collected 24 h after treatment. Using the SYBR green quantitative polymerase chain reaction (qPCR) method, we compared the levels of several ERS relevant genes: BIP, GRDP94, CHOP, sXBP1, EDEM and ATF4. Comparison of gene expression relative to Wt CTR mice (Figure 1A) showed that Tm treatment activated relevant ERS marker genes, which was statistically relevant and comparable in both mice genotypes. Tm-treated Wt and Tff3−/− mice showed a similar gene expression level (Figure 1B). Tff3−/− mice had slightly reduced levels of the ERS marker genes, although this was not statistically significant. Protein levels of PERK and eIF2α and their activated phosphorylated forms were similar in Wt and Tff3−/− mice (Figure 2).

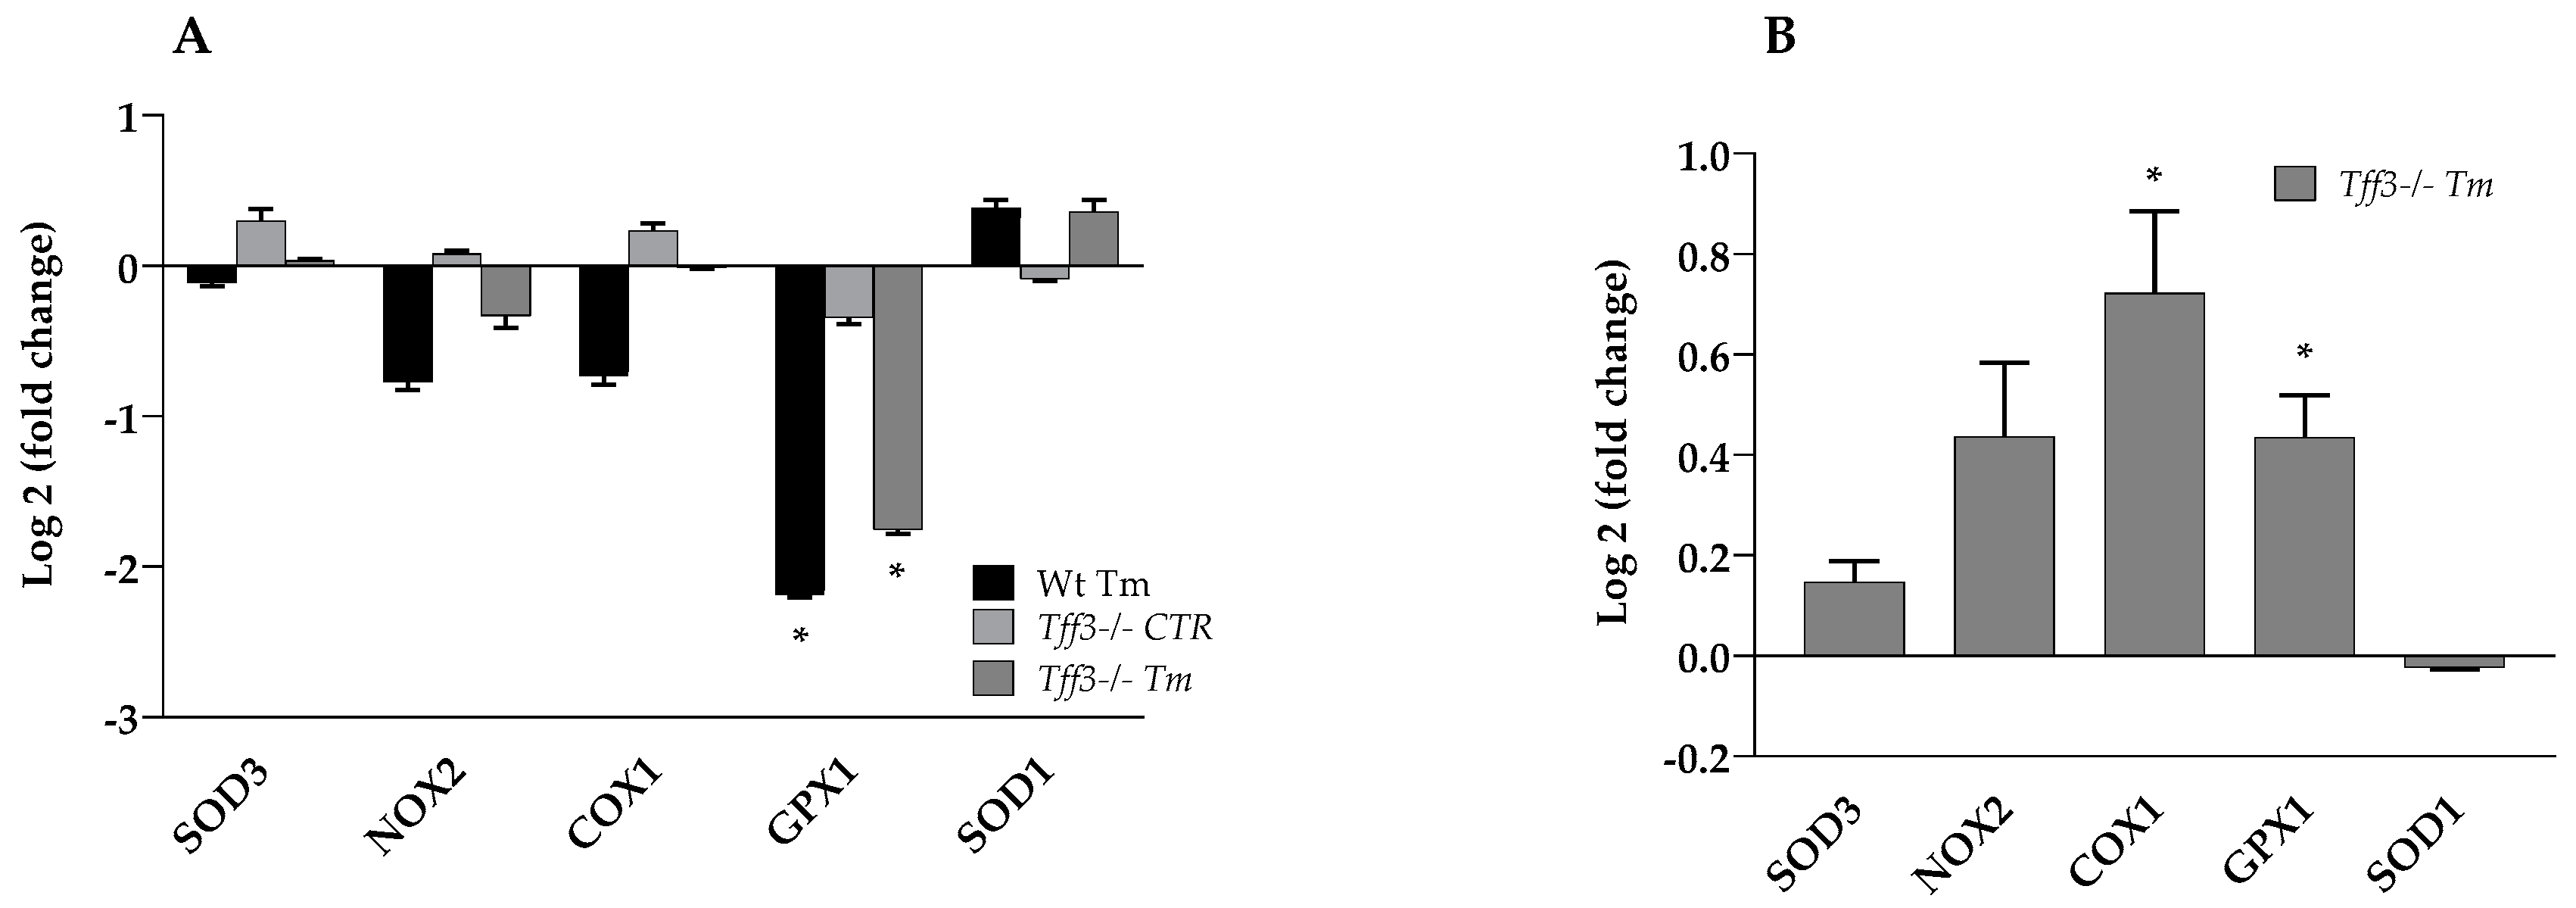
2.2. Expression of Oxidative Stress Marker Genes

The effect of Tff3 deficiency on the oxidative stress markers (Figure 3) was monitored in the livers of Wt and Tff3−/− mice with and without Tm treatment. Gene expression levels relative to untreated Wt mice showed that Tm treatment statistically reduced the expression of GPX1 in Wt (4.55 fold) and Tff3−/− (3.5 fold) mice.
Expression of other marker genes (SOD3, NOX2, COX1 and SOD1) was not affected (Figure 3A). Tm-treated Tff3−/− mice, compared to Wt Tm-treated mice, revealed a significantly increased expression level of COX1 (1.65 fold) and GPX1 (1.35 fold) (Figure 3B).

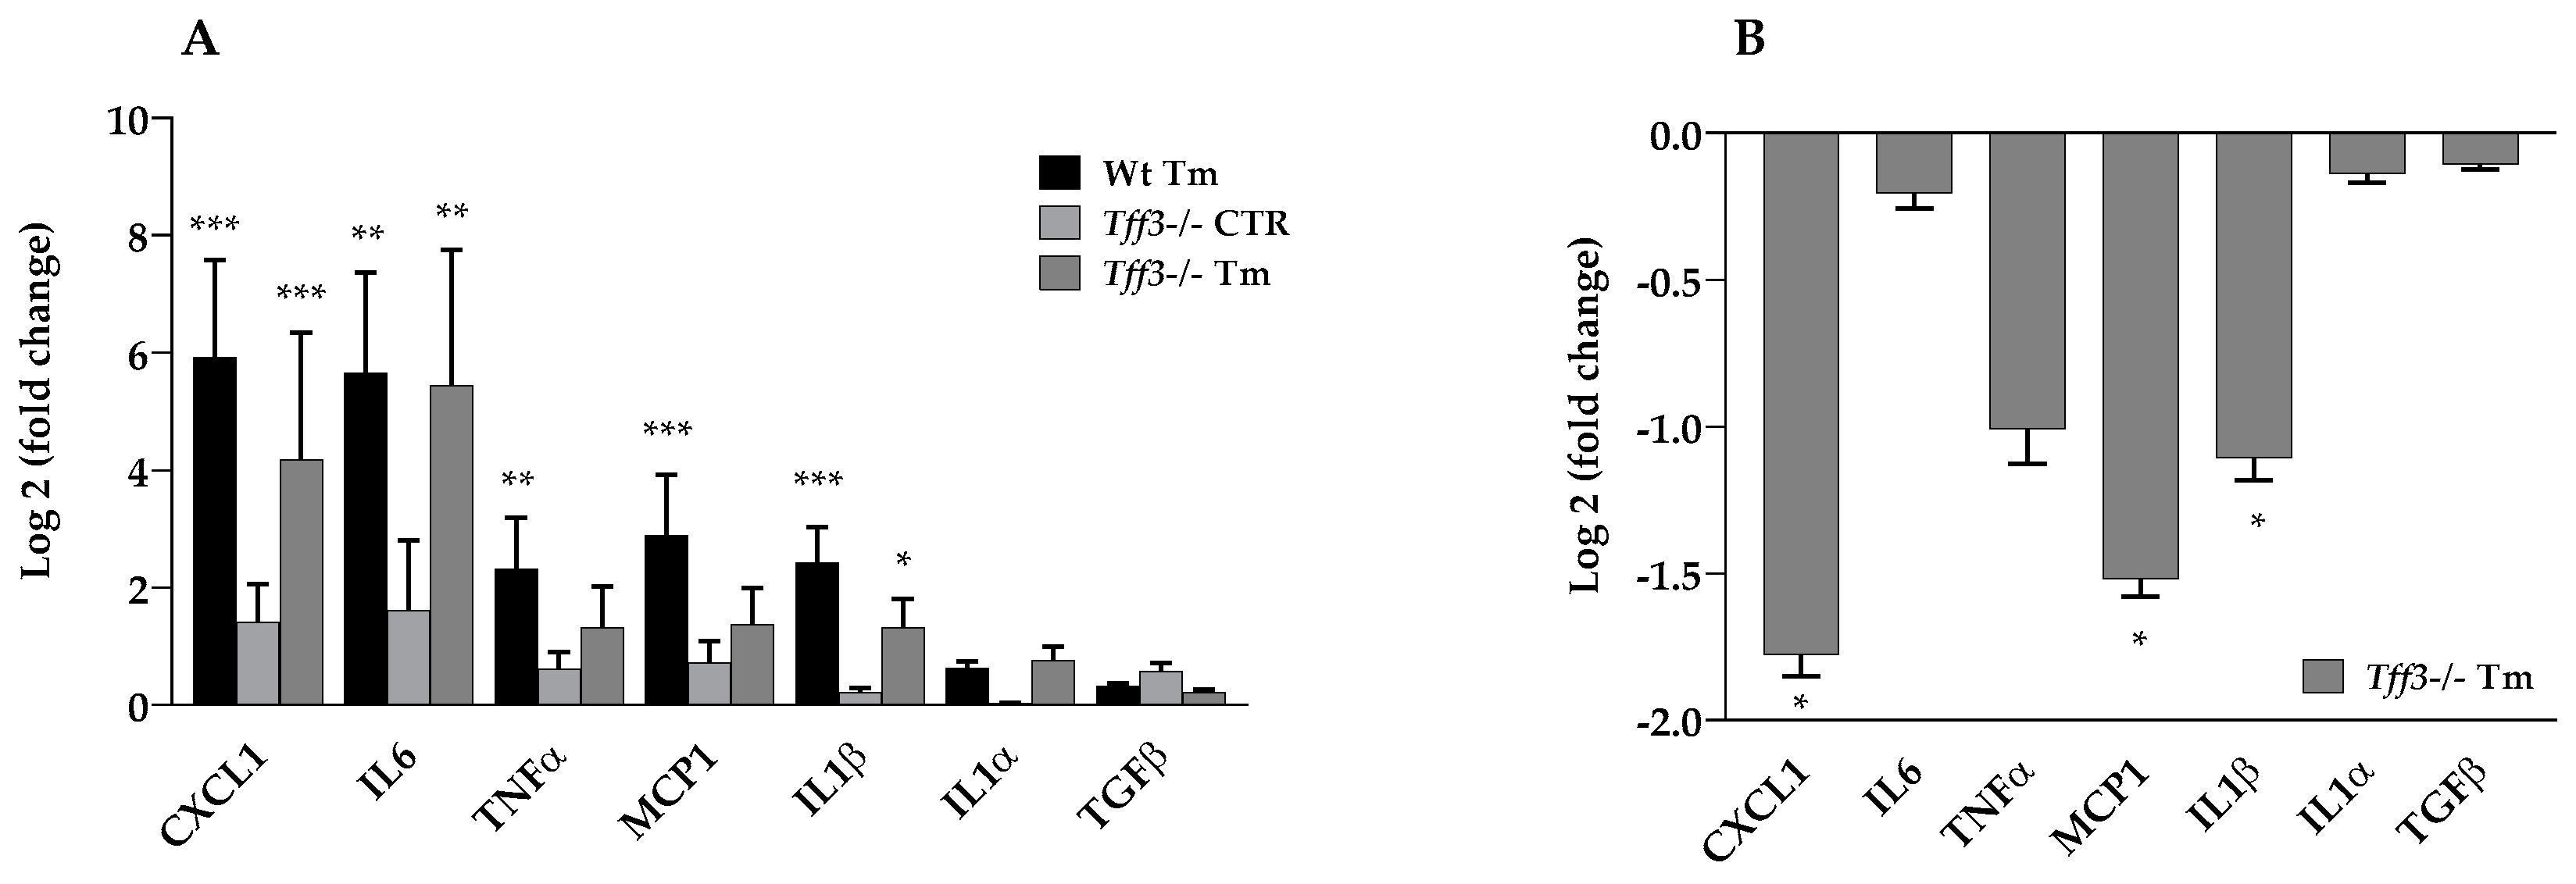
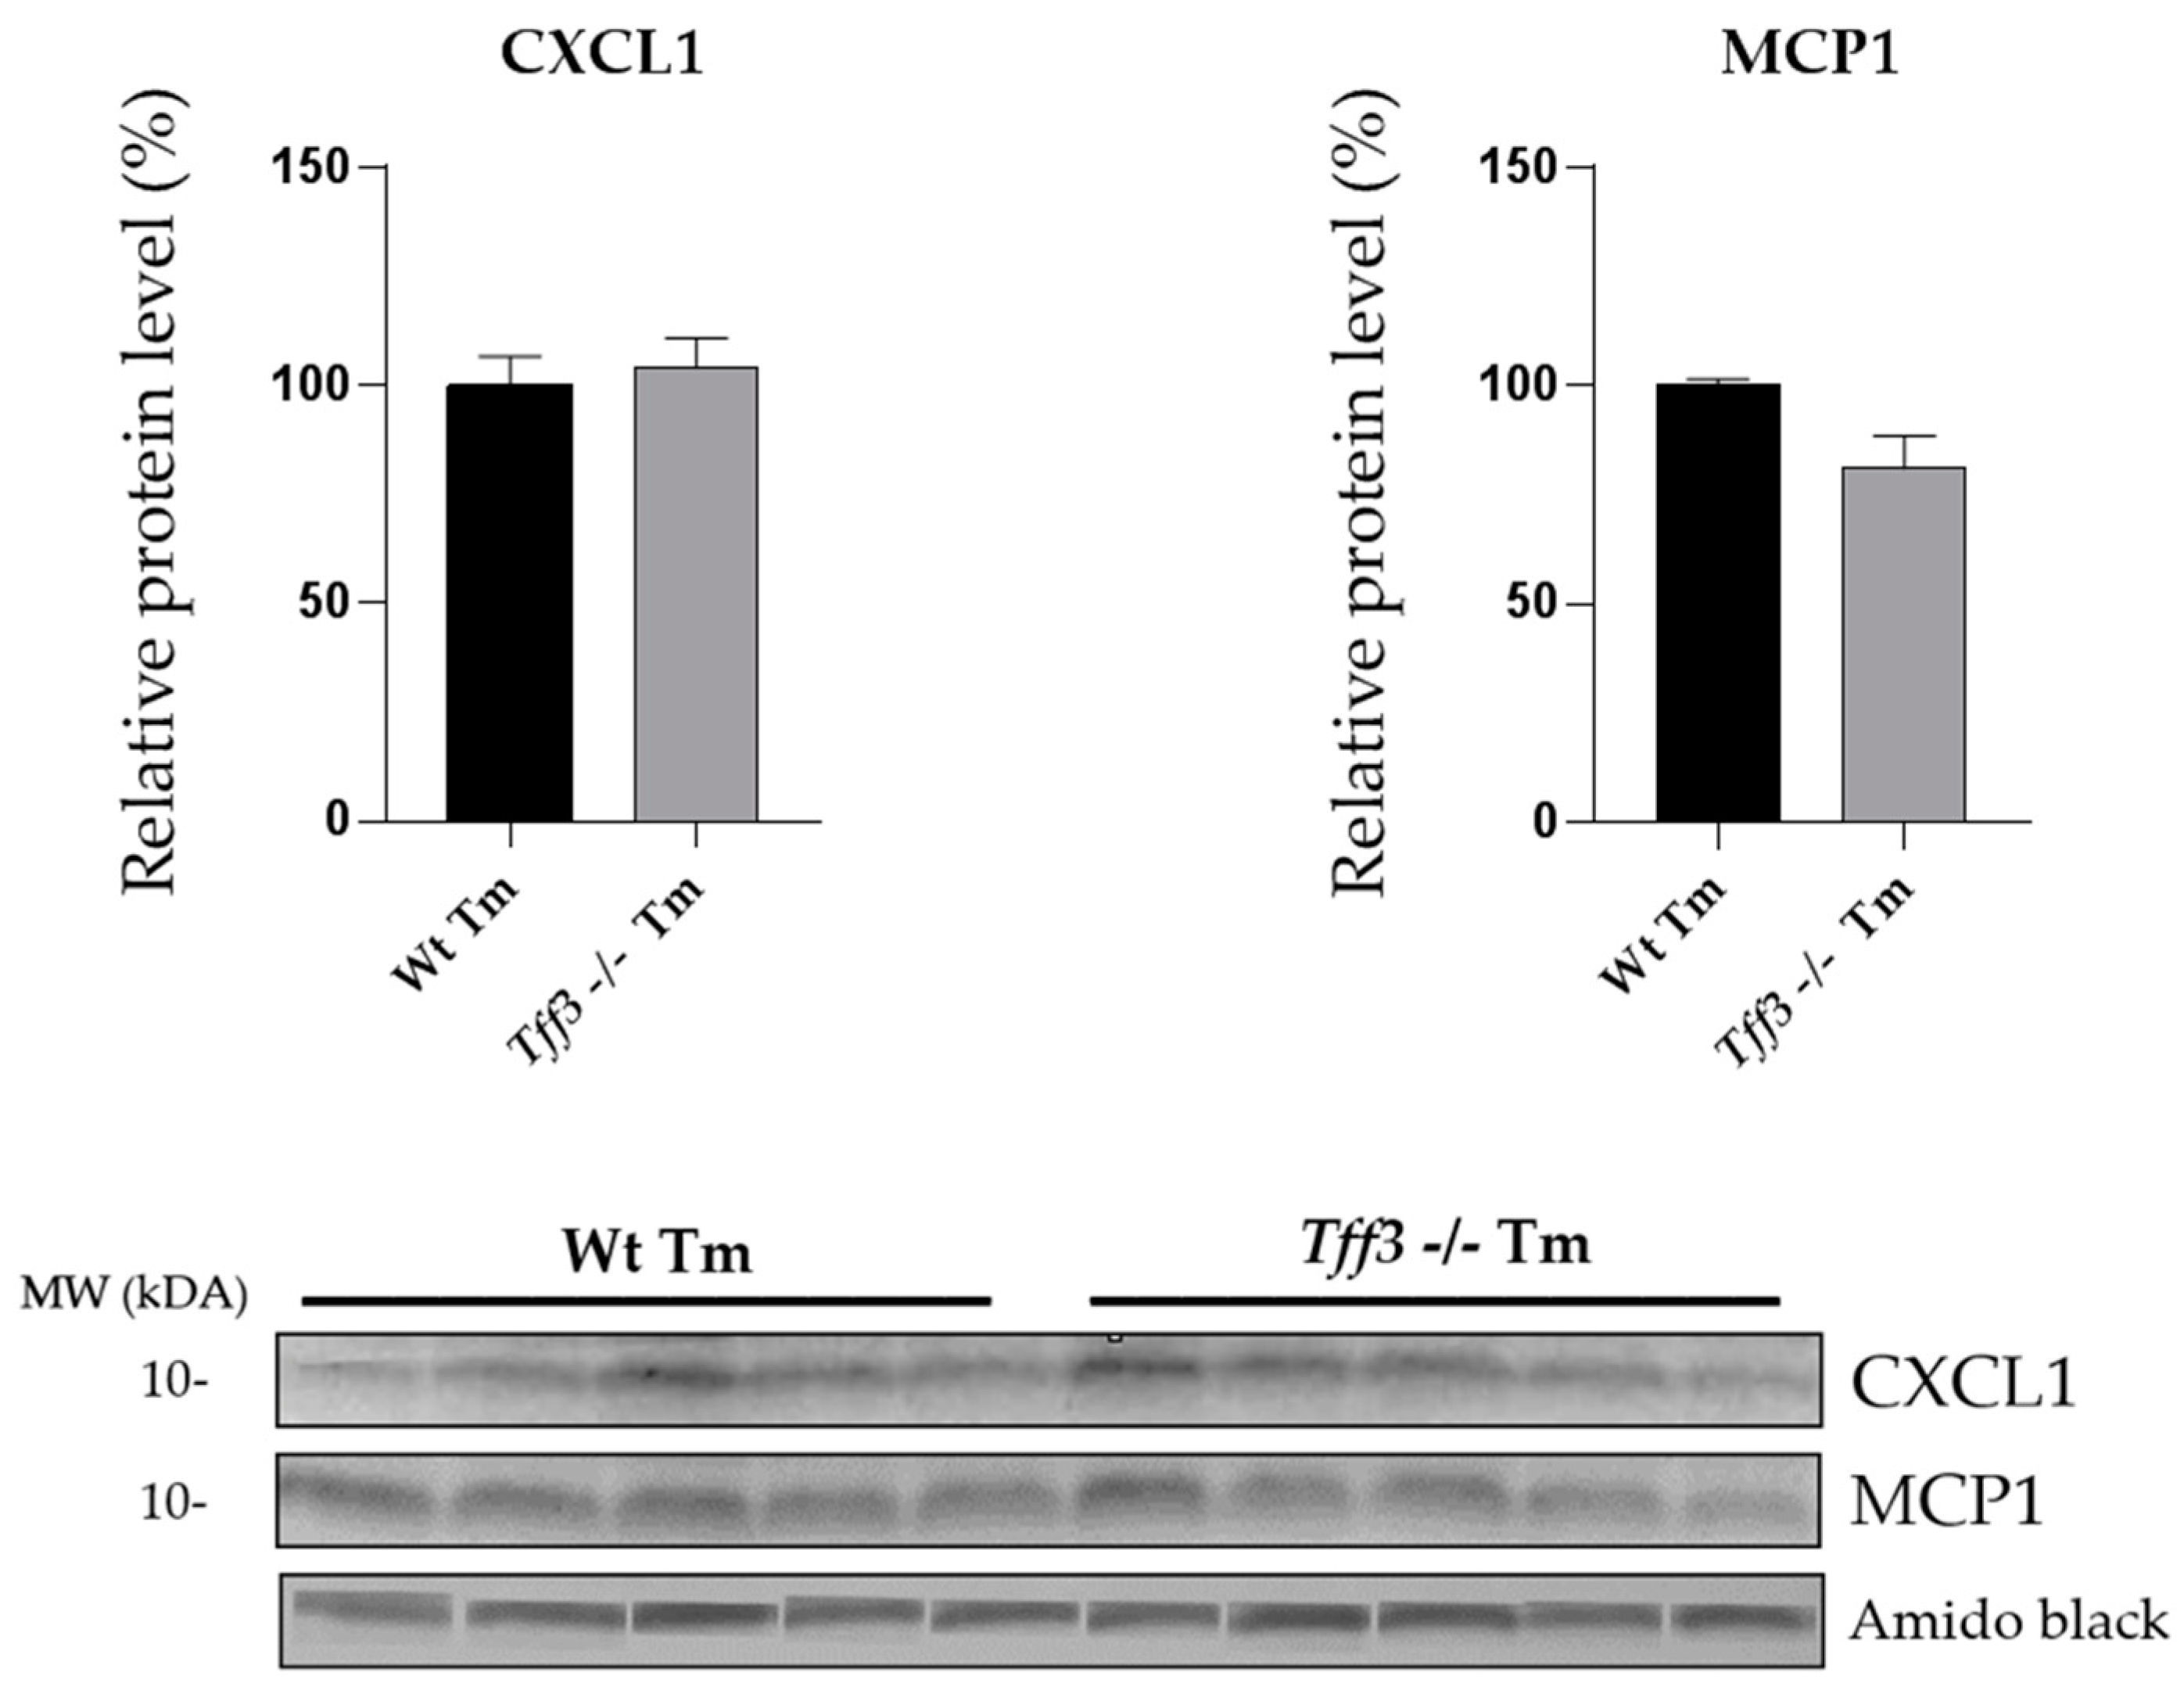
2.3. Tff3 Deficiency Reduces Cytokine Expression in Acute ERS

Both Wt and Tff3−/− mice showed an upregulation of liver cytokine gene expression upon ERS induction: CXCL1 (60.67 fold), IL6 (50.25 fold), MCP1 (7.40 fold), IL1β and TNFα (5 fold). IL1α and TGFβ were not affected (Figure 4A). Tff3−/− Tm mice had a statistically relevant reduced expression of CXCL1 (3.43 fold), MCP1 (2.87 fold) and IL1β (2.15 fold) compared to Wt Tm mice (Figure 4B). MCP1 and CXCL1 protein levels were monitored by Western blot analysis (Figure 5), but protein levels did not reveal the difference observed at the mRNA level (Figure 4B).

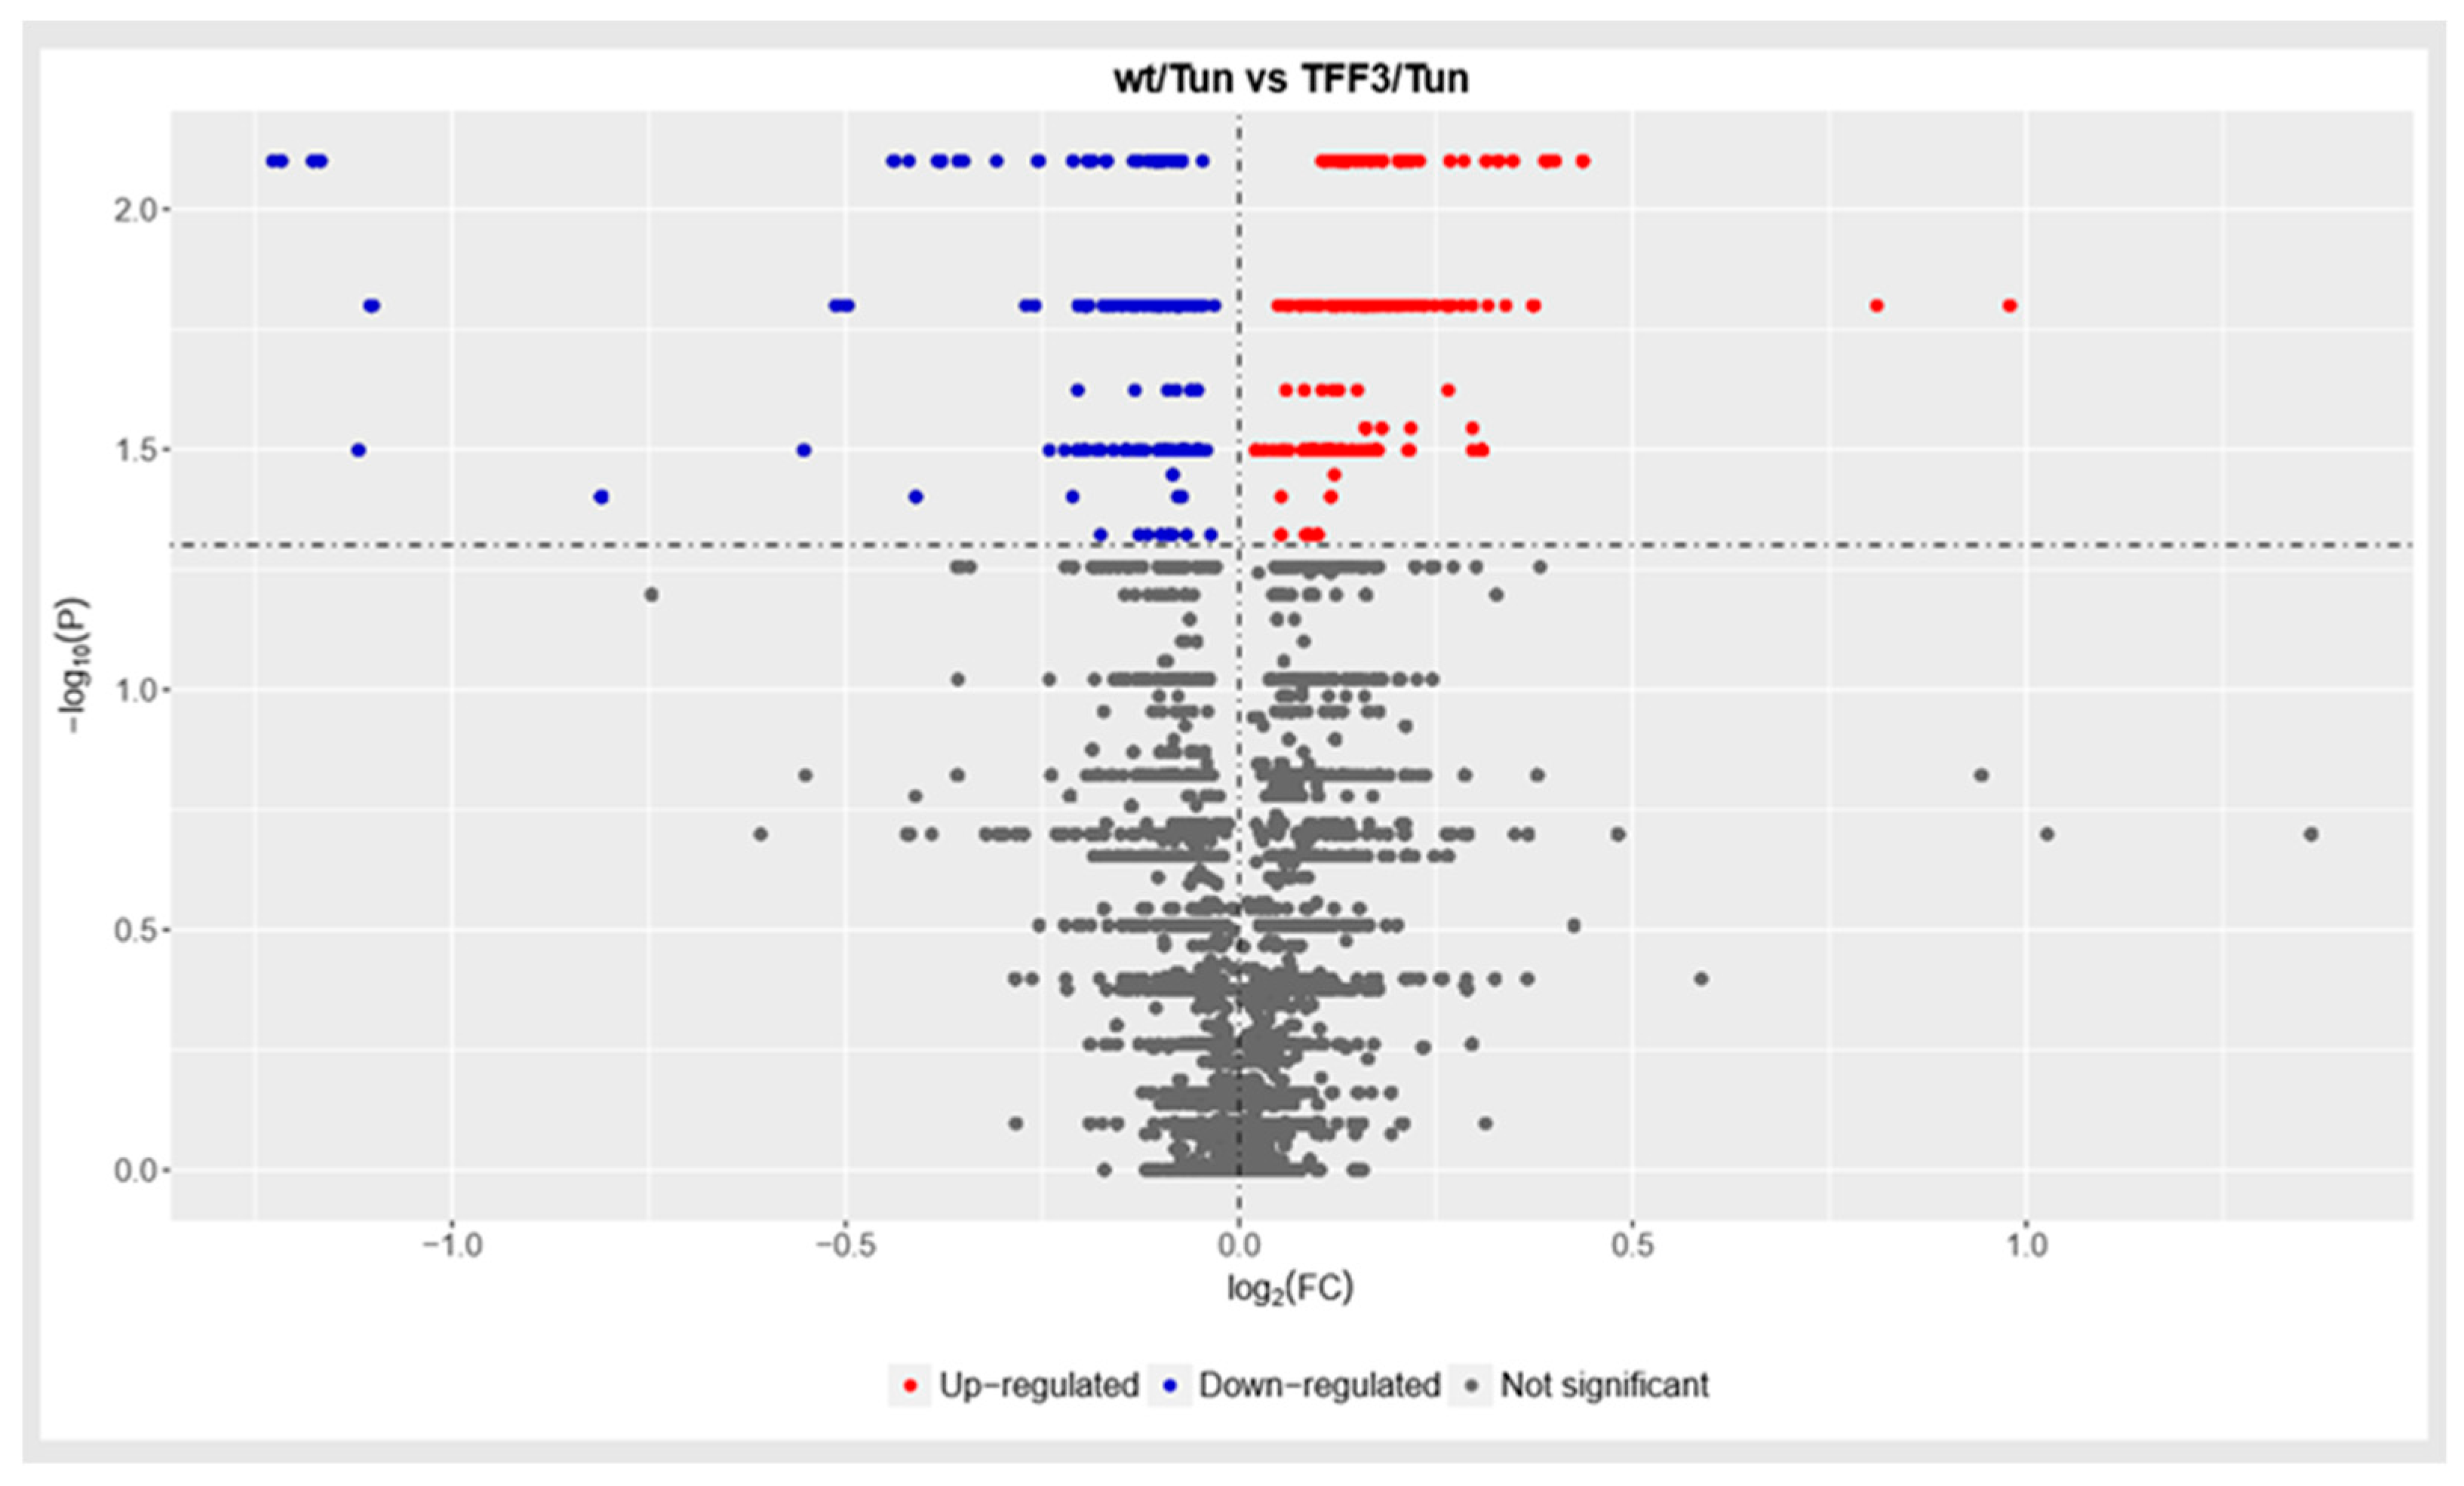
2.4. Shotgun Proteomic Analysis of Liver Proteome ERS Provoked WT and Tff3 Deficient Mice

Comparing the global protein expression levels of Tm-treated Wt and Tff3-deficient mice, a difference between the groups is shown (Figure 6). Tff3−/− mice livers had changed the expression of antioxidative proteins involved in the resolution of Tm-induced oxidative stress. Metallothionein-1 (MT1) and metallothionein-2 (MT2) had a 2-fold increase in level, while glutathione S-transferase pi 1 (GSTP1) and glutathione S-transferase I pi 2 (GSTP2) had a 3-fold level reduction. Applying an additional statistical approach using false discovery rates (FDR) that compensated for large data sets, these changes did not reveal any relevant statistical reliability (Data in Supplement: Table S1).

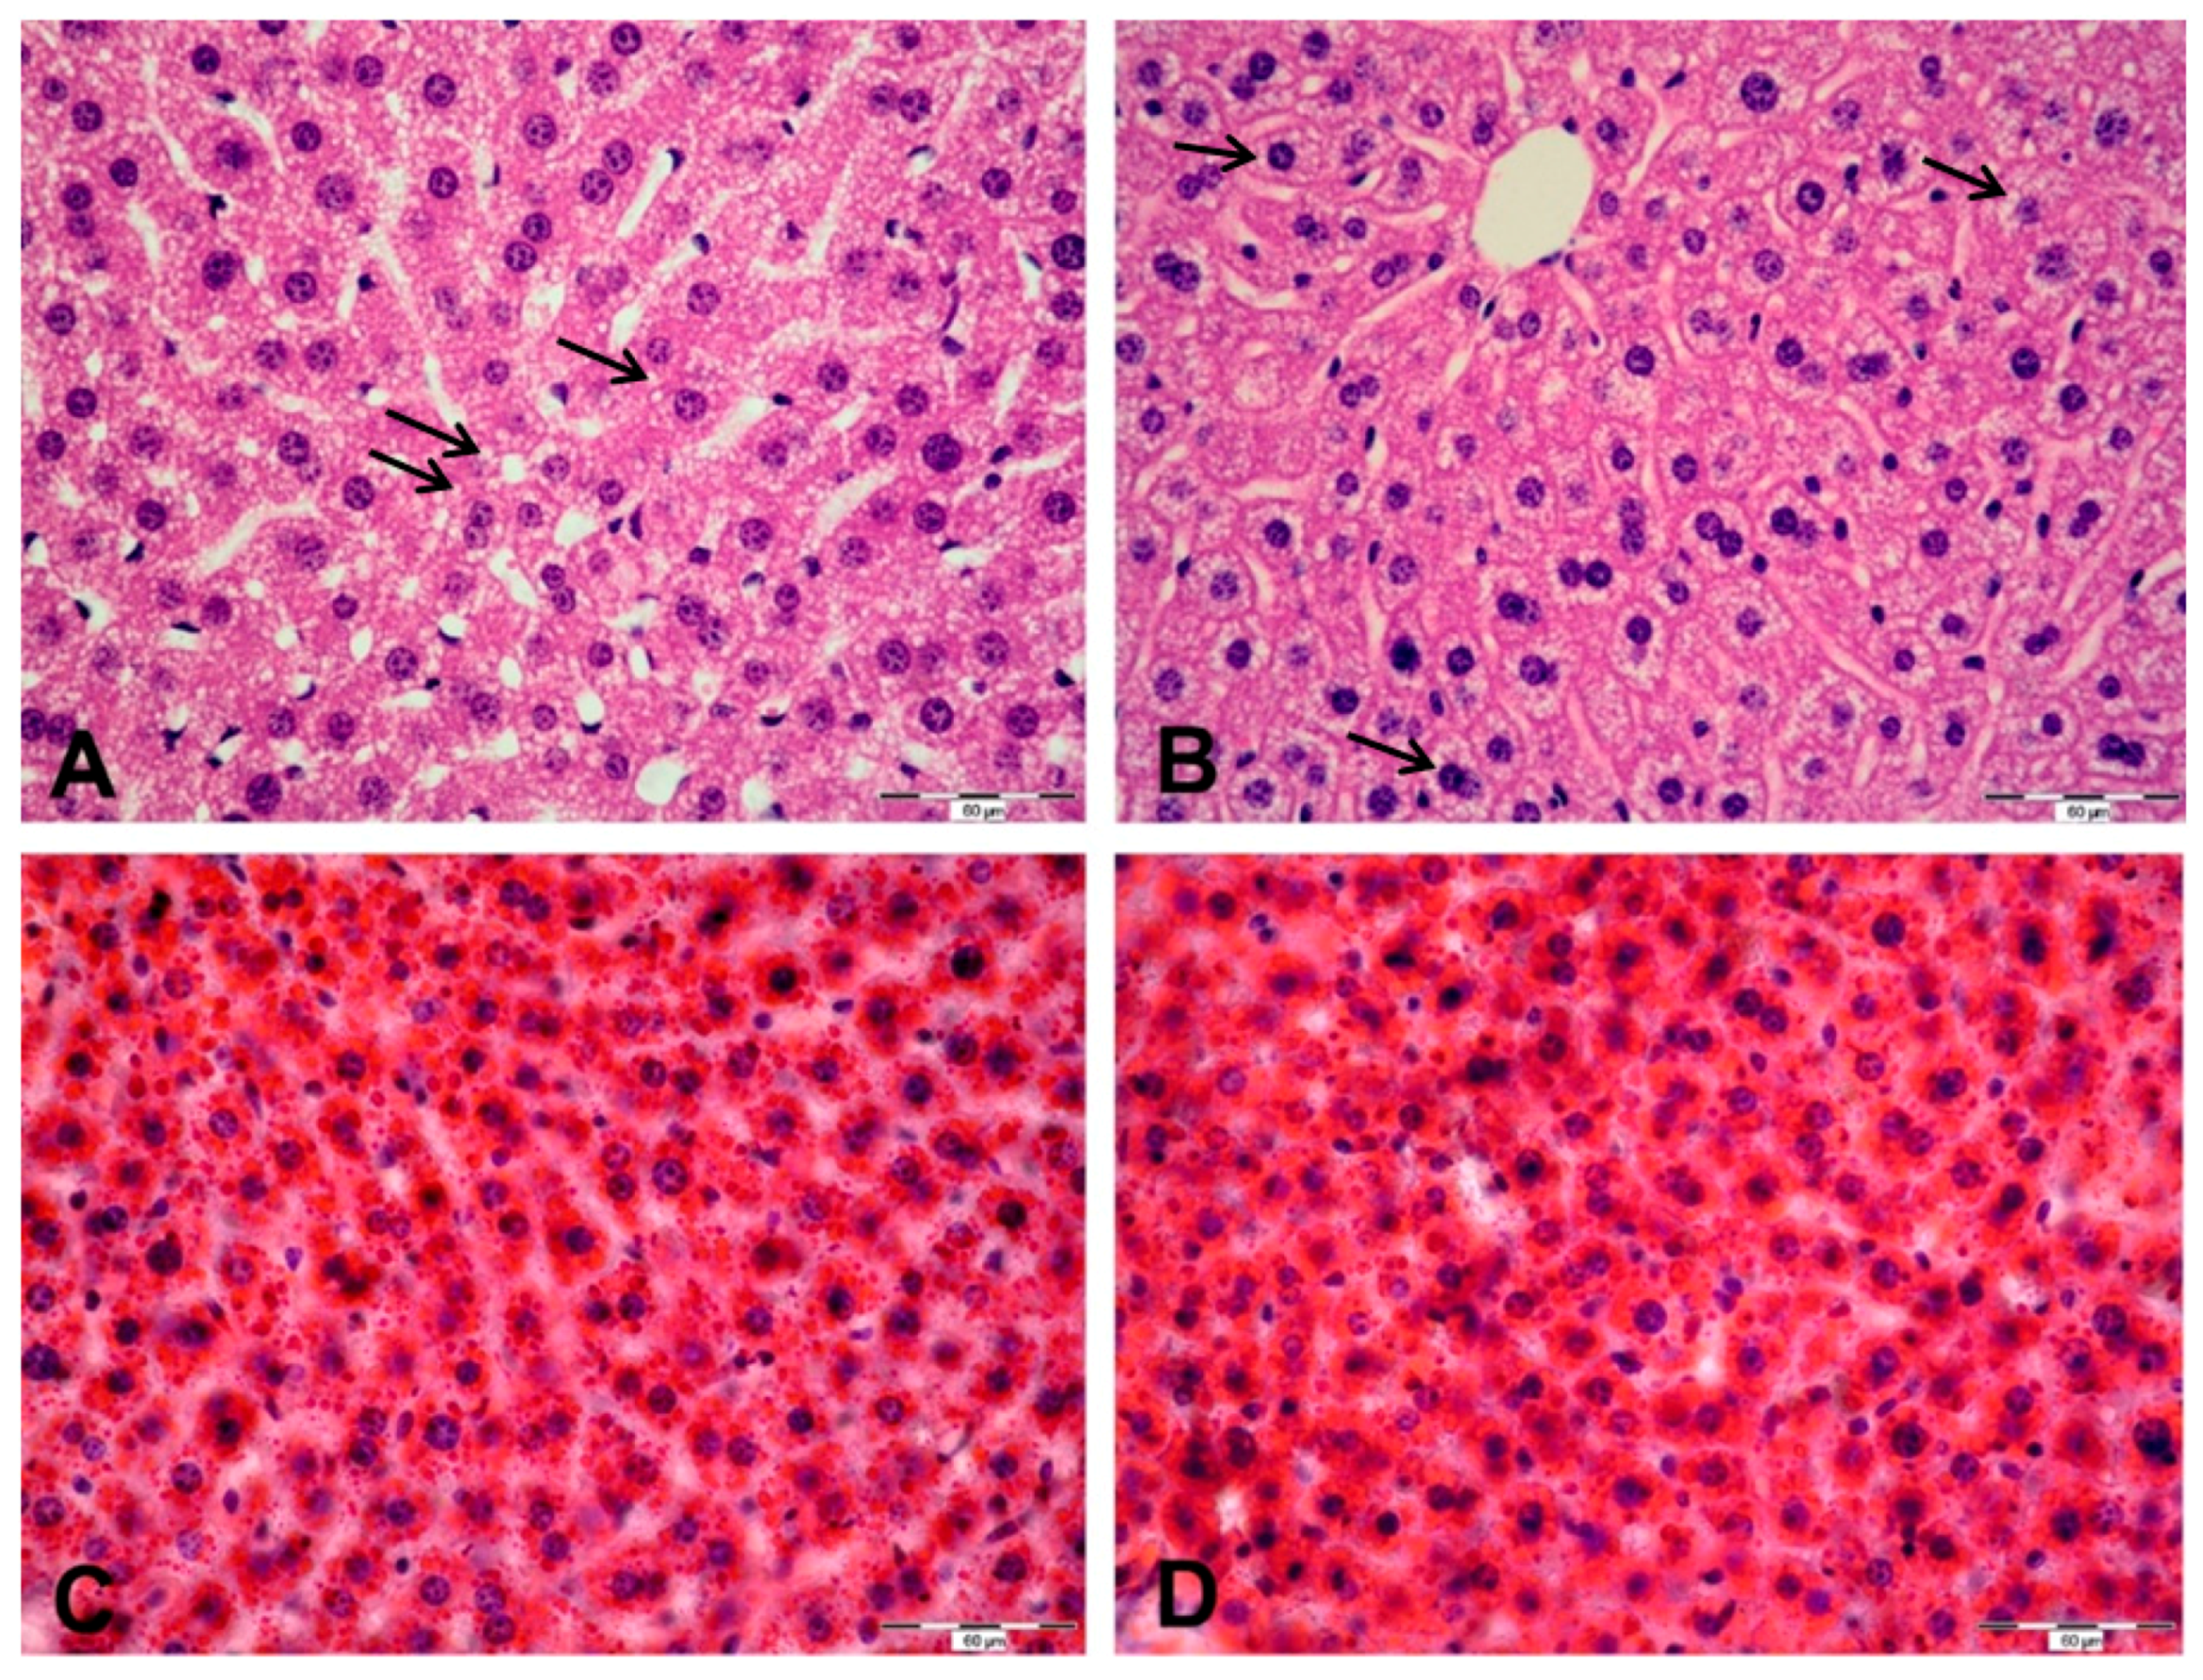
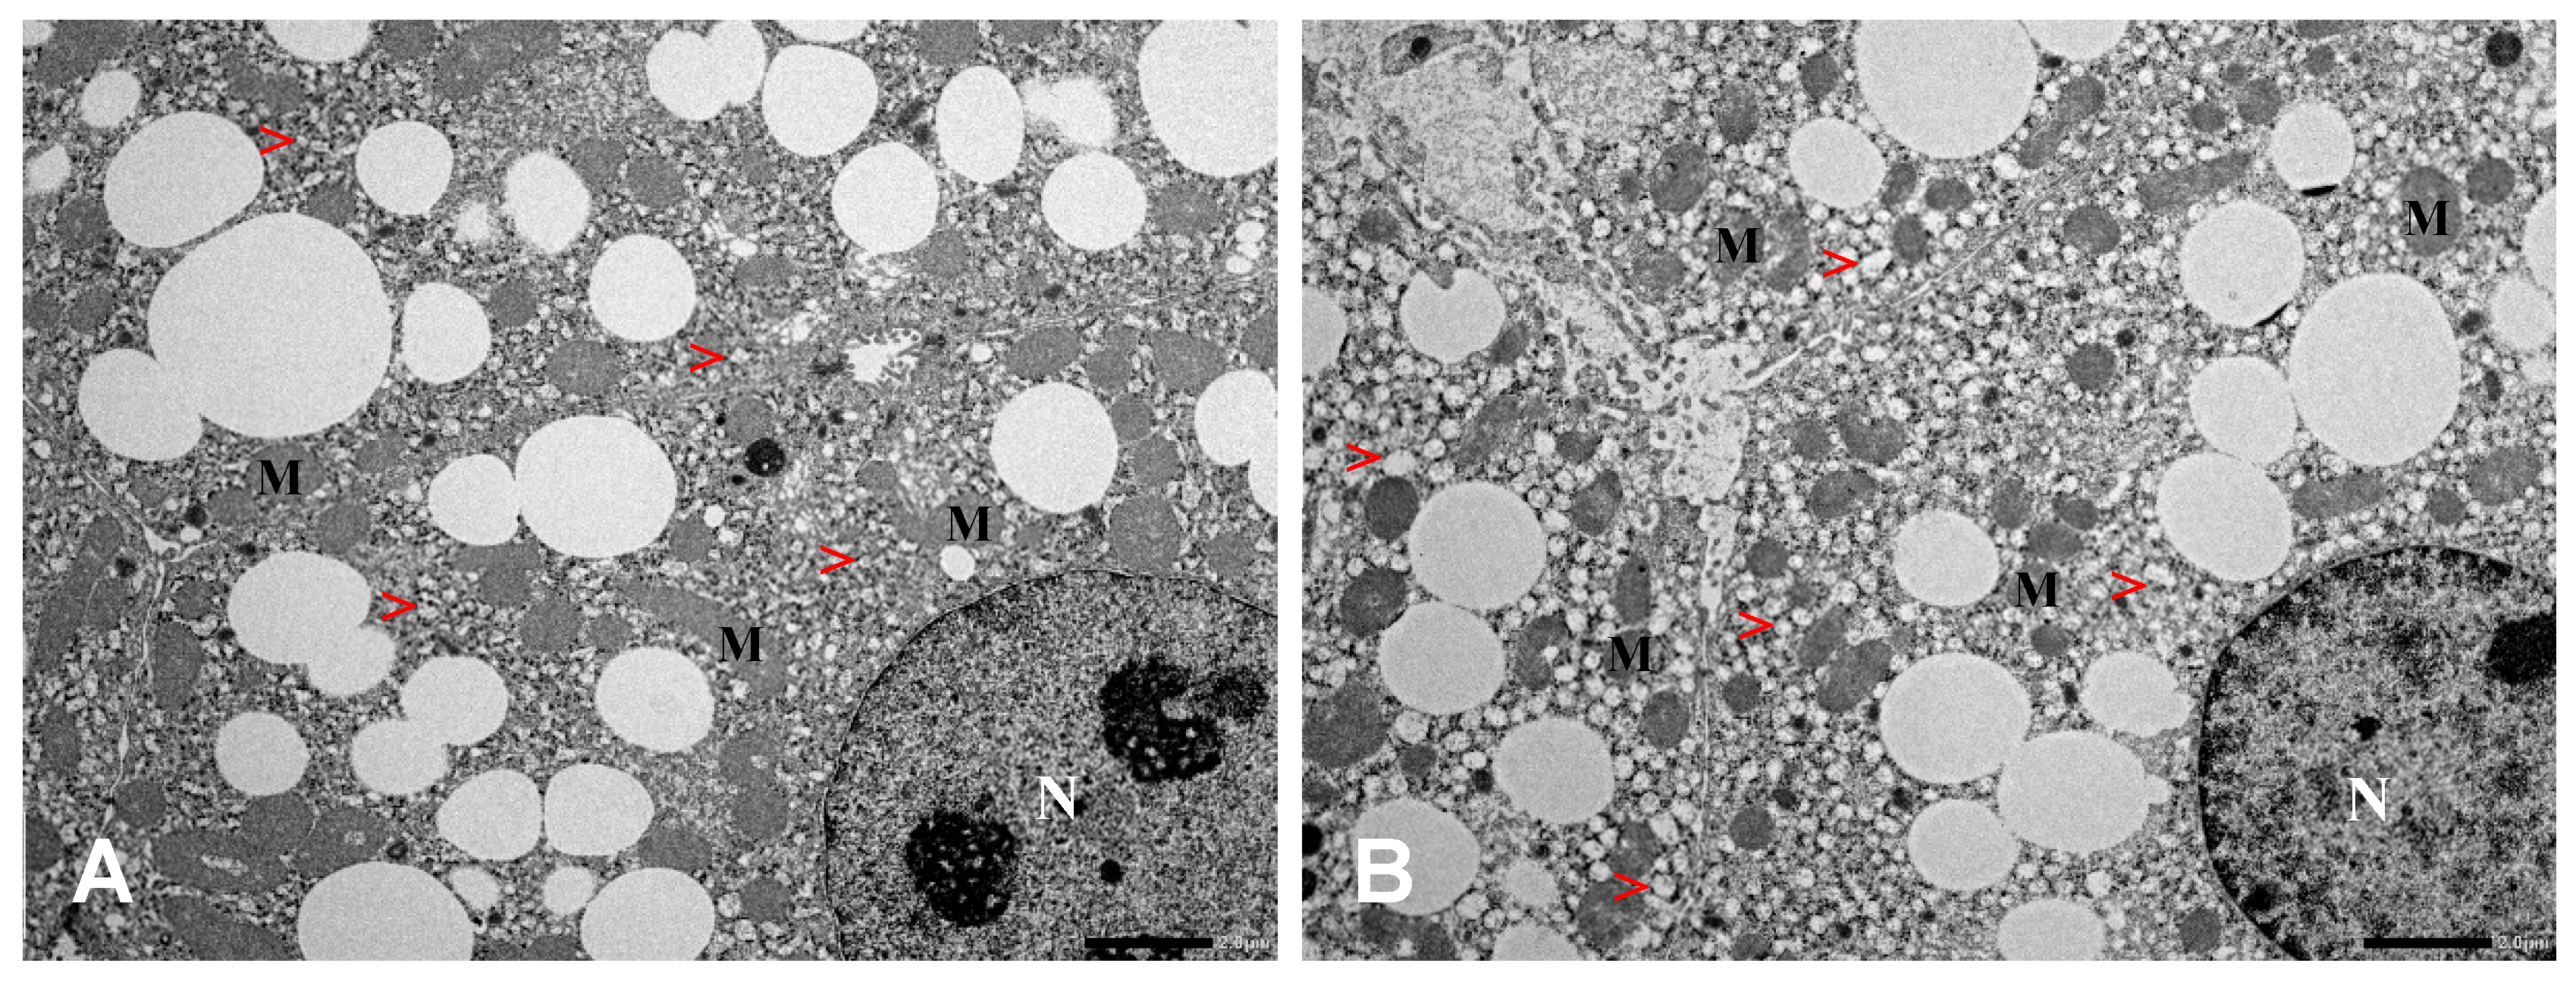
2.5. Histological and Ultrastructural Changes

Hematoxylin-eosin stain revealed an extensive fat accumulation in the form of numerous small lipid droplets in hepatocytes, both in Wt- and Tff3−/− Tm-treated mice (Figure 7). Almost all of the examined hepatocytes were affected. No histomorphological differences were observed between the two groups. No fibrosis or signs of inflammation were detectable. Cryosections of the same livers stained with Oil Red O supported this result, revealing numerous lipid droplets in hepatocytes stained intensively red. Semi-quantitative analysis of the share of lipid droplet area showed no statistically significant difference between the groups; median share of lipid droplets for the Wt and Tff3−/− groups was 56.42 and 59.63%, respectively (p = 0.75, Mann-Whitney U test).
Analysis of ultrastructure (Figure 8) showed no changes in the morphology of the hepatocytes or capillaries. Liver cells demonstrated normal cell bodies with dense and round nuclei and moderate amounts of cytoplasm. No accumulation of autophagosomes, lysosomes or peroxisomes was detected. Kupffer cells were counted, and a comparable amount of liver macrophages were found in control and Tff3−/− mice. General morphology of mitochondria appeared to be normal, including inner and outer mitochondrial membranes. Mitochondria were often surrounded by rough endoplasmic reticulum (RER) in both Tff3−/− and Wt animals. Fat vacuoles in the cytoplasm of the hepatocytes were found to be visibly enlarged in Tff3−/− mice (Figure 8).

3. Discussion

Unresolved ERS underlies various pathological changes in different organs, and its activation is associated with metabolic diseases like obesity, type 2 diabetes (T2D) and nonalcoholic fatty liver disease (NAFLD) [22,23,24]. Exact mechanisms of interaction between ERS and metabolic disruption are not yet fully understood. Liver, as an important metabolic organ, regulates blood glucose and synthesizes fatty acids from glycolytic products in the process of de novo lipogenesis [25]. Complete loss of Tff3 expression was the most prominent expressional change during the early stages of diabetes in the liver of the polygenic mice model of diabesity [17], and since then its role in relevant metabolic processes has emerged [15,16]. Hence, our goal was to investigate the impact of Tff3 deficiency on relevant ER, oxidative stress and inflammation pathways, which are the key mechanisms in the development of pathological changes in the liver. Since Tffs-deficient mouse models show evidence of disturbed protein processing and possible interaction with chaperones [4,5,6,7,8,9], we have compared the effect of acute ERS in the liver of novel, congenic, Tff3-deficient mice and relevant wild type control. ER stress was induced by Tm, a drug shown to successfully mimic hepatic steatosis [26]. Activation of the UPR was monitored by qPCR analysis of downstream targets of UPR. Analyzed genes are common genes used to examine UPR activation: endoplasmic reticulum chaperone BIP (BIP), activating transcription factor 4 (ATF4), DNA damage-inducible transcript 3 (CHOP), ER degradation enhancing alpha-mannosidase like protein 1 (EDEM1), heat shock protein 90 (GRP94) and spliced X-box binding protein 1 (sXBP1) [27]. Upon perturbance in protein folding, BIP dissociates from the three key master regulators of UPR, i.e., IRE1, PERK and ATF6, and consequently activates them. ATF4 and CHOP are transcription factors activated in the PERK signaling pathway. ATF4, amongst other functions, plays a distinct role in autophagy resulting from Tm-induced ERS [28], while CHOP has a complex proapoptotic role [24]. In response to ERS, IRE1 cleaves XBP1, resulting in sXBP-1, an active UPR transcription factor which exerts strong pro-survival effects under various conditions [29]. EDEM1 is an ER-associated protein degradation (ERAD) chaperone [30], and GRP94 performs unique chaperone functions in the ER [31]. Additionally, we analyzed UPR activation on the protein level by measuring PERK activation with a phospho-specific PERK antibody, as well as the phosphorylation of its downstream target eukaryotic translation initiation factor 2 alpha (eIF2α).
Results showed that an activation of analyzed UPR markers does not statistically differ in 7-week-old male Tff3−/− mice, compared to the relevant wild type control on transcriptional and protein levels (Figure 1). It seems that Tff3 deficiency does not have a significant effect on the expression of the key components of the UPR pathway in Tm-induced acute ERS.
Oxidative protein folding in endoplasmic reticulum is an important resource of reactive oxygen species (ROS) production. Some evidence suggests that endoplasmic reticulum has antioxidant protection that may not be sufficient to relieve the oxidative stress caused by increased protein folding [32]. Tff3 was linked to oxidative stress in human tumor cells, where it was upregulated in the late phase of response to oxidative stress caused by X-rays [33]. Glutathione peroxidase 1 (GPX1) is an antioxidant enzyme [34] expressed ubiquitously in the mitochondria and cytoplasm of many tissues. Wild type and Tff3−/− Tm-treated mice show a statistically significant reduction in the expression of GPX1 (4.55 and 3.5 fold, respectively) compared to Wt untreated mice (Figure 3A). Tff3−/− Tm-treated mice have a slightly but significantly higher expression level of GPX1 (1.35 fold) relative to Wt Tm-treated mice (Figure 3B). Previous reports showed no significant difference in liver GPX1 expression between WT and Tff3−/− mice of mixed background in control condition similar as in this new strain background [35]. GPX activity in NAFLD livers compared to control is significantly higher [36] and the severity of disease is correlated with the decreased activity of GPX [37].
Cyclooxygenase 1 (COX1) is an enzyme located in the endoplasmic reticulum and nuclear envelope of a wide variety of cells and tissues. It forms prostaglandins via arachidonic acid oxygenation by a free radical mechanism [38], hence, it may produce toxic oxygen species [39]. Expression of COX1 is essential for hepatic homeostatic maintenance [40]. Both Tff3 and COX-1 take part in the protection of intestinal mucosa and promotion of cell migration [41,42].
While Tff3 regulates gastric epithelial restitution via a COX1 independent pathway [43], the activation of cellular invasion by Tff3 is mediated by a COX1 dependent signaling pathway [42]. Tff3−/− untreated animals show a slightly higher expression of COX1 than untreated wild type animals (Figure 3A), and Tm-treated animals reveal a significant difference (Figure 3B), indicating the impact of Tff3 deficiency on COX1 expression in acute ERS. Xiao et al. found that deficiency or inhibition of COX-1 during acute liver injury, increased hepatic oxidative stress, inflammation and apoptosis in mice. Specifically, they showed a higher expression of MCP-1 and IL-1β [40]. The similar situation regarding the expression of previously mentioned genes is in accordance with our results (Figure 3A,B and Figure 4A,B). Tff3 protein has been found to be upregulated in forms of intestinal inflammation, which is the site of its predominant expression. It is also synthesized in lymphoid tissues (spleen, thymus, lymph nodes, bone marrow), and it stimulates migration of monocytes, which suggests a potential role in the immunological response to tissue injury [44]. Furthermore, it is demonstrated that Toxoplasma gondii-infected, Tff3-deficient mice, show a significantly down-regulated expression of IFN γ, IL-12, IL-1β and TNFα, involved in the inflammatory response [45].
ERS leads to the production of various pro-inflammatory molecules [46] and Tm treatment causes a strong increase in the expression of CXCL1 (60.67 fold), IL6 (50.25 fold), MCP1 (7.40 fold) in the liver of both Wt and Tff3−/− mice. Tff3−/− mice have significantly reduced levels of several proinflammatory cytokines (downregulated CXCL1: 3.43 fold; MCP1: 2.87 fold and IL-1β: 2,15 fold) compared to the wild type (Figure 4B), indicating a diminished inflammatory response in the case of Tff3 deficiency. As mentioned before, IL-1β was also found to be downregulated in the ileum of Tff3−/− mice infected by Toxoplasma gondii [45].
Immune cells and hepatic inflammation have a central role in the pathogenesis of metabolic disease, and chemokines are crucial immune cells in the regulation and activation of hepatocytes and circulating immune cells [47]. MCP1 is an important CC-chemokine, involved in the recruiting and activation of immune cells to the site of tissue injury [48]. Transgenic mice overexpressing MCP1 demonstrate insulin resistance and increased hepatic triglyceride content in adipose tissue, suggesting a significant role of MCP1 in the hepatic steatosis of early liver injury [49]. Mandrekar et al. show that MCP1−/− mice have reduced steatosis in alcoholic liver injury, and they also demonstrate that MCP1 in the liver regulates macrophage activation and proinflammatory cytokines [50].
CXCL1 is a chemokine expressed in macrophages, epithelial cells and neutrophils with a key role in neutrophil recruitment and activation [51]. It is known that hepatic neutrophil infiltration, a symptom of steatosis, is linked with various liver pathological conditions via mechanisms of generating reactive oxygen species (ROS) and the production of pro-inflammatory mediators [52]. Wang et al. show that inhibition of CXCL1 did reduce hepatic neutrophil infiltration, and consequently ameliorated steatohepatitis in a mice model of disease. IL-1β signaling can exacerbate an accumulation of cholesterol [53] and triglyceride [54] in the liver. Moreover, IL-1β-deficient mice during NAFLD had reduced inflammation and steatosis in the liver [55].
The changes noticed at the level of gene expression were not followed at the protein level. Western blot showed unchanged levels of MCP1 and CXCL1 protein. This could be explained by the differential dynamics of the mRNA and the complex relationship in concentrations of mRNAs and proteins during misfolding stress, having a peak between 2–8 h upon ERS induction [56], and we have monitored the effects 24 h upon treatment. Thus far the role of Tff3 protein in immune processes is not thoroughly known. Our data suggest that Tff3-deficient mice have less ability to start a pro-inflammatory cascade in acute ERS.
Total proteome analysis distinguishes two different sample types. Changes were found at the level of antioxidative proteins that are involved in the resolution of Tm-induced oxidative stress in the liver of Tff3-deficient mice. MT1 and MT2 have a 2-fold increase in levels, while GSTP1 and GSTP2 have a 3-fold level reduction. Metallothioneins are cysteine-rich, heavy metal-binding proteins with antioxidant properties [57]. They are involved in DNA protection, oxidative stress, angiogenesis and apoptosis [58], and hepatic metallothionein expression seems to have a protective role in liver pathology [59]. Decreased expression of MT1 and MT2 in the liver is associated with liver steatosis in high fat diet-induced, obese mice [60]. In line with our findings, Kondoh et al. found that the Tm treatment enhanced the hepatic MT levels in C57BL/6J mice [61].
Metallothionein-1G overexpression in human colorectal cancer cells HT-29 considerably enhances the induction of Tff3 [62]. Gluthatione S-transferases play a role in cell defense against oxidative stress and are involved in liver pathologies [63]. GSTP was identified as an ER-resident protein, where it demonstrates both chaperone and catalytic functions. Glutathionylation of multiple ER-resident proteins is vital for ER homeostasis and UPR, and it impacts cell sensitivity to ERS-inducing drugs, like Tm [64]. It can also interfere with ERS-induced apoptosis.
Applying a specific large database statistical approach called false discovery rate (FDR) analysis that normalizes large data sets, we observed no statistically significant changes between Tm-treated Wt and Tff3-deficient mice 24 h upon treatment.
Tm-induced ERS causes hepatic steatosis via the upregulation of a very low-density lipoprotein receptor (VLDLR) and consequently increases lipoprotein delivery to the liver [65]. It also disturbs lipid metabolism and the accumulation of fat in a form of numerous small lipid droplets in hepatocytes that is evident in Wt and Tff3-deficient mice liver (Figure 7). Our histological approach applying hematoxylin-eosin and oil red O staining did not reveal obvious differences between the groups. However, ultrastructural analysis revealed that ERS provoked Tff3-deficient mice have slightly enlarged fat vacuoles compared to wild type mice (Figure 8). This finding is consistent with results from a former study where Guillén et al. showed a decreased Tff3 gene expression in mice with a stronger extent of liver steatosis [18]. Our findings in the liver of mixed background Tff3−/− mice on a normal diet show that fat vacuole formation was also affected [35]. Ultrastructural analysis of the liver tissues show no difference in a number of immunologically relevant cells, and no difference in the general morphology of mitochondria, hepatocyte cell bodies, cytoplasm or capillaries between Tm-treated Tff3−/− mice and Wt control mice.

4. Materials and Methods

4.1. Experimental Animals

A novel congenic Trefoil factor family 3 (Tff3)-deficient mouse strain on C57BL6/NCrl (Charles River) background was developed from an existing Tff3-deficient mixed background strain (C57BL6/J/SV129) [19] using a ‘speed congenics’ approach. Mixed background Tff3−/− males were crossed with C57BL6/NCrl females, and heterozygote Tff3−/− males were detected and analyzed for 500 SNP polymorphisms (ENVIGO) to identify the Tff3-/+ male closely resembled to the C57BL6/NCrl strain. This approach was used for five consecutive back crossings to identify the male carrier with 100% similarity to the C57BL6/NCrl strain regarding relevant SNP loci. Resulting offspring were set up to mate according to a brother x sister scheme, homozygous Tff3−/− male and female mice (F0 generation) were identified and used to start breeding a new Tff3−/−/C57BL6/NCrl strain. This new congenic Tff3−/− mice and wild type mice (C57BL6/NCrl) differ only in the Tff3 region and a small surrounding fragment inherited from the embryonic cell of SV129 strain, while the rest of the genetic loci are homozygous. Thus, we can be more confident that the observed phenotype is a consequence of inactivated Tff3 protein. Male mice of Tff3−/−/C57BL6/NCrl and the related C57BL6/NCrl wild type strain were used for all further experiments. Animals were kept under standard care conditions. Experimental animal manipulations and procedures performed in course of the Croatian Science Foundation grant IP-06-2016-2717 were approved by the local ethical committee.

4.2. Inducing ER Stress

Acute ERS was induced by a single injection Tm treatment. Stock Tm solution was prepared in sterile dimethyl sulfoxide (DMSO) (10 µg/mL) and diluted with 150 mM dextrose. Tm (3 µg of Tm/g of mouse body weight in a 300 µL final volume) was administered intraperitoneally to Tff3-deficient and wild type mice that were seven weeks old. Control animals received 300 µL of 150 mM dextrose. Mice were sacrificed and their tissue was harvested for further analysis after 24 h. During that time food and water were available ad libitum.

4.3. Quantitative PCR

Total RNA was isolated from the livers of Tff3−/− mice and Wt controls using an RNeasy Mini Kit (Qiagen, Hilden, Germany), according to the manufacturer’s instructions. 1.5 µg of RNA was transcribed into cDNA with a High-Capacity cDNA Reverse Transcription Kit (Applied Biosystems, Dreieich, Germany). We performed a quantitative polymerase chain reaction (qPCR) using SYBR Green I (Invitrogen, Waltham, MA, USA) detection chemistry and specific primers (Table 1) on the StepOnePlus™ qPCR System (Applied Biosystems). The cycling conditions comprised three min polymerase activation at 95 °C and 40 cycles, including 95 °C for 1min, annealing temperature specific for each primer pair (Table 1) for 30 s, and elongation at 72 °C for 30 s. A single product amplification was confirmed by melting curve analysis. Gene expression was analyzed by REST © software (ΔΔCt method) and normalized to stable housekeeping genes, β-actin (ACTβ) and β2-microglobulin (B2M). Changes were represented as log2 (fold change).

4.4. Western Blot

Liver proteins were isolated from Tm-treated Tff3−/− (n = 5) and Wt mice (n = 5) using RIPA buffer (50 mM TRIS HCL, pH8, 150 mM NaCl, 1 mM EDTA, 1% NP40, 1% sodium deoxycholate, 0.1% SDS) supplemented with phosphatase and protease inhibitors (Roche, Basel, Switzerland). Total protein concentration was determined by a BCA protein assay kit (Pierce, ThermoFischer, Waltham, MA, USA) and 25 µg of proteins per lane was separated by Sodium dodecyl sulfate polyacrylamide gel electrophoresis (SDS-PAGE). Proteins were transferred to a nitrocellulose (ERS markers) or PVDF membrane (cytokines), blocked with 5% BSA in TBS-T and incubated overnight at 4 °C with primary antibodies. The following monoclonal antibodies were used: Anti-(PKR)-like endoplasmic reticulum kinase (PERK) (#3912), anti-phospho-PERK (#3179), polyclonal anti-eIF2α (#9722) and anti-phospho eIF2α (#9721) antibodies from Cell Signaling Technology at dilution 1:1000 in 5% BSA/TBST. Cytokines were detected using rabbit anti-MCP-1 at 1:500 dilution (A00056-4) and anti-CXCL1 at 1:8.000 dilution (A00533) (Boster Biological Technology, Pleasanton, CA, USA) by incubation overnight at 4 °C. The following secondary antibodies were used for detection, that is, goat anti-rabbit IgG-HRP antibody (#170-6515; Bio-Rad, Hercules, CA, USA) or goat anti-rabbit IgG -HRP (#170-6515; Bio-rad). The chemo luminescence signals were detected (Alliance 4.7 Imaging System UVITEC, Cambridge) and analyzed with Image J. Amido Black staining was used as loading control and for the normalization of the bands.

4.5. Proteomic Analysis

4.5.1. Protein Extraction and Sample Preparation

Proteins from the tissue were extracted using a Minute Kit according to manufacturer’s instructions. The total protein concentration in lysates was determined using a BCA protein Assay (Thermo Scientific, Rockford, Waltham, MA, USA). The internal standard was prepared by pooling all samples used in the study (equal protein amounts). TMT labeling was performed as described [66]. Shortly, 30 µg of proteins was diluted with 0.1 M triethyl ammonium bicarbonate (TEAB, pH 7.8 (slightly alkaline) up to a final volume of 50 µl. Samples were reduced (2.5 µL of 200 mM DTT, 1 h at 55 °C, alkylated (2.5 µL of 375 mM IAA, 30 min at room temperature in the dark) and acetone-precipitated (six volumes of ice-cold acetone, −20 °C overnight). After centrifugation (8000× g, 10 min at 4 °C), 50 µg of pellets were dissolved in 50 µL of 0.1 M TEAB and trypsin digested (1:40, w/w) at 37 °C overnight. Tryptic peptides were labeled using TMT tenplex reagents (Thermo Scientific, Rockford, Waltham, MA, USA) which were prepared according manufacturer’s instructions. An amount of 19 µL was added to each sample for the labeling reaction (60 min, RT), which was quenched using 5% hydroxylamine (15 min, RT). Four TMT-labeled peptide samples were combined with the internal standard into the new tube, aliquoted, dried and stored at −80 °C for further analysis.

4.5.2. LC-MS/MS Analysis

High-resolution LC-MS/MS analysis was performed for protein identification and relative quantification as previously reported [66]. In short, prior to analysis, dried TMT-labeled peptides were dissolved in loading buffer (2% ACN in 0.1% FA) and an amount of 1 μg was desalted on the trapping column by employing the Ultimate 3000 RSLCnano system (Dionex, Germering, Germany). Peptides were then separated using PepMap™ RSLC C18 (50 cm × 75 μm ID) column during 2 h linear gradient of 5–35% buffer B (0.1% FA in 80% ACN) at a flow rate of 300 nL/min. Nanospray Flex ion source and stainless steel emitter (New Objective, Woburn, MA, USA) was used. The ionization voltage was set to 2.1 kV, and the ion transfer tube temperature at 250 °C. DDA was performed in a positive ion mode using the Top 8 method, using Q Exactive Plus (Thermo Scientific, Bremen, Germany). Full scan FTMS spectra were acquired in a mass range m/z 350.0 to m/z 1900.0 with a resolution of 70,000, AGC target 1 × 10⁶, and the maximum injection time 110 ms. For MS/MS scan, step collision energy was set to 25, 35 and 40% NCE with resolution 17,500 and AGC target 2 × 10⁵. An isolation window of ± 2.0 Da was applied to isolate precursor ions with dynamic exclusion of 30 s.

4.5.3. Data Analysis

A database search was performed using the SEQUEST algorithm implemented into Proteome Discoverer (version 2.3., Thermo Fisher Scientific) against Mus musculus FASTA files (NCBI database, downloaded 7/12/2017, 46105 entries) according the following parameters: two trypsin missed cleavage sites, precursor and fragment mass tolerances of 10 ppm and 0.05 Da, respectively; carbamidomethyl (C) as a fixed peptide modification, oxidation (M) and TMT sixplex (K, peptide N-terminus) as dynamic modifications. The FDR for peptide identification was calculated using the Percolator algorithm within Proteome Discoverer workflow, based on the search results against a decoy database. At least two unique peptides and 5% FDR were set to obtain reliable protein identification. For the reporter-based relative quantification, an internal standard was used to compare the data between the experiments.
All statistics was performed using R v3.2.2 [67]. Proteins with 100% missing data were removed from the analysis. Sample outliers were detected per each group for each of the proteins using the Dixon’s test from R package outliers v0.14 [68]. If any sample outlier was significant (p > 0.05) it was removed from further analysis. To test the difference in protein abundance between groups, the Wilcoxon-Mann-Whitney test was performed. Fold change between two groups was calculated as mean (Group2)/mean (Group1) and expressed on log2 scale. PCA and volcano plots were designed using R package ggplot2 v3.1.1 [69]

4.6. Histology

Liver tissue was fixed in 4% paraformaldehyde; half of it was paraffin-embedded, and the other part cryo-protected in sucrose, frozen in liquid nitrogen and stored at −80 °C. Paraffin-embedded tissues were cut into 5 µm sections using a rotary microtome (Slee CUT 4060, Slee, Mainz, Germany), deparaffinized and used for hematoxylin-eosin staining. Frozen tissues were cut on a cryostat (Leica CM 3050 S, Leica, Wetzlar, Germany) into 20 µm-sections and stained with oil red O stain. The Olympus® BX-50 light microscope (Olympus, Tokyo, Japan), Olympus® C-5050 digital camera and QuickPHOTO Pro software (Promicra s.r.o, Prague, Czech Republic) were used to obtain digital photographs. Images of oil red O-stained tissue were processed and analyzed in FIJI software (FIJI is Just ImageJ), a distribution of ImageJ2 open-source image processing software (Schindelin et al., 2012, 2015). Images were transformed into black and white masks by adjusting the color balance, using Color transformer 2 plugin and image thresholding on the channel containing a signal from red-stained lipid droplets. Lipid droplet area and total tissue area were measured in FIJI, and share of lipid droplet area was calculated [70,71]. Blood vessels larger than liver sinusoids and artifacts were subtracted from the total tissue area, if present on digital photographs. Three representative photographs were taken for each animal under 40× objective, and after measurements, average values were calculated for each animal and used for statistical analysis.

4.7. Ultrastructure

Tff3-deficient mouse strains on C57Bl6/NCrl were perfused with 4% PFA, and tissues were immersion fixed immediately after removing in Ito’s fixative. Liver was post-fixed in OsO4, dehydrated in a graded ethanol series, and whole tissues were embedded in Epon resin. Tissue sections (1 µm thick) were cut with an ultramicrotome (Ultracut E; Reichert Jung, Vienna, Austria) and stained with toluidine blue. Toluidine blue-stained slides were viewed and photographed with a Biorevo BZ-9000 microscope. Ultrathin sections of the tissue were cut, stained with uranyl acetate and lead citrate, and viewed with a Transmission electron microscope (Jeol JEM-1400Plus).

5. Conclusions

The novel congenic mouse strain Tff3−/−/C57BL6NCrl is a valuable model for assessing the role of Tff3 deficiency on liver disease relevant pathways. Here presented data show that Tff3 deficiency is not crucial for acute ERS response caused by Tm. The impact of Tff3 deficiency in the liver can be seen at the level of the transcriptional regulation of immune response relevant genes.
Since liver acts as an important metabolic and immunological organ, the influence of Tff3 deficiency and physiological function possibly reflects upon the whole organism. However, this has to be determined in future investigations.

Supplementary Materials

Author Contributions

Conceptualization, F.P., M.M. and M.B.L.; Formal analysis, K.Š., I.B., M.S., E.R., A.H., A.G. and N.B.; Funding acquisition, M.B.L.; Investigation, K.Š., I.B., J.W., M.S., N.B., A.H. and M.M.; Methodology, K.Š., I.B., E.R., A.H. and J.W.; Resources, F.P. and M.B.L.; Supervision, F.P. and M.B.L.; Writing—original draft, K.Š., I.B., J.W., F.P., N.B., A.H. and M.B.L. All authors participated in original draft preparation, review and editing of the manuscript. All authors read and approved the final version of the manuscript.

Funding

This research was funded by Croatian Science Foundation grant IP-2016-06-2717. The work of doctoral student Iva Bazina has been fully supported by the “Young researchers career development project – training of doctoral students” of the Croatian Science Foundation funded by the European Union from the European Social Fund.

Conflicts of Interest

The authors declare no conflict of interest.

Abbreviations

ACTBactin beta
ATF4activating transcription factor 4
BIP endoplasmic reticulum chaperone bip
B2Mbeta-2-microglobulin
CHOPDNA damage-inducible transcript 3
COX1cyclooxygenase I
CXCL1C-X-C motif chemokine ligand 1
eIF2αeukaryotic translation initiation factor 2α
EDEM1ER degradation enhancing alpha-mannosidase like protein 1
ERendoplasmic reticulum
ERSendoplasmic reticulum stress
GSTP1glutathione S-transferase pi 1
GSTP2glutathione S-transferase pi 2
GPX1glutathione peroxidase 1
GRP94heat shock protein 90 beta family member 1
IL1αinterleukin 1 alpha
IL1βinterleukin 1 beta
IL6interleukin 6
MCP1monocyte chemoattractant protein-1
MT1metallothionein-1
MT2metallothionein-1
NOX2NADPH oxidase 2
PERKprotein kinase R (PKR)-like endoplasmic reticulum kinase
SOD1superoxide dismutase 1
SOD3superoxide dismutase 3
sXBP1spliced X-box binding protein 1
Tffstrefoil factor family proteins
TNFαtumor necrosis factor alpha
TGFαtumor growth factor alpha
Tmtunicamycin
UPRunfolded protein response
Wtwild type

References

  1. Wang, S.; Kaufman, R.J. The impact of the unfolded protein response on human disease. J. Cell Biol. 2012, 197, 857–867. [Google Scholar] [CrossRef] [Green Version]
  2. Almanza, A.; Carlesso, A.; Chintha, C.; Creedican, S.; Doultsinos, D.; Leuzzi, B.; Luís, A.; McCarthy, N.; Montibeller, L.; More, S.; et al. Endoplasmic reticulum stress signalling—from basic mechanisms to clinical applications. FEBS J. 2019, 286, 241–278. [Google Scholar] [CrossRef]
  3. Fu, S.; Watkins, S.M.; Hotamisligil, G.S. The role of endoplasmic reticulum in hepatic lipid homeostasis and stress signaling. Cell Metab. 2012, 15, 623–634. [Google Scholar] [CrossRef]
  4. Torres, L.F.; Karam, S.M.; Wendling, C.; Chenard, M.P.; Kershenobich, D.; Tomasetto, C.; Rio, M.C. Trefoil Factor 1 (TFF1/pS2) Deficiency Activates the Unfolded Protein Response. Mol. Med. 2002, 8, 273–282. [Google Scholar] [CrossRef]
  5. Baus-Loncar, M.; Schmid, J.; Lalani, E.N.; Rosewell, I.; Goodlad, R.A.; Stamp, G.W.H.; Blin, N.; Kayademir, T. Trefoil Factor 2 (Tff2) Deficiency in Murine Digestive Tract Influences the Immune System. Cell. Physiol. Biochem. 2005, 16, 31–42. [Google Scholar] [CrossRef] [Green Version]
  6. Lubka, M.; Shah, A.A.; Blin, N.; Baus-Lončar, M. The intestinal trefoil factor (Tff3), also expressed in the inner ear, interacts with peptides contributing to apoptosis. J. Appl. Genet. 2009, 50, 167–171. [Google Scholar] [CrossRef]
  7. Desmots, F.; Russell, H.R.; Michel, D.; McKinnon, P.J. Scythe regulates apoptosis-inducing factor stability during endoplasmic reticulum stress-induced apoptosis. J. Biol. Chem. 2008, 283, 3264–3271. [Google Scholar] [CrossRef]
  8. Ren, C.; Dokter-Fokkens, J.; Figueroa Lozano, S.; Zhang, Q.; de Haan, B.J.; Zhang, H.; Faas, M.M.; de Vos, P. Lactic Acid Bacteria May Impact Intestinal Barrier Function by Modulating Goblet Cells. Mol. Nutr. Food Res. 2018, 62, 1–14. [Google Scholar] [CrossRef]
  9. Asada, R.; Saito, A.; Kawasaki, N.; Kanemoto, S.; Iwamoto, H.; Oki, M.; Miyagi, H.; Izumi, S.; Imaizumi, K. The endoplasmic reticulum stress transducer OASIS is involved in the terminal differentiation of goblet cells in the large intestine. J. Biol. Chem. 2012, 287, 8144–8153. [Google Scholar] [CrossRef]
  10. Taupin, D.; Podolsky, D.K. Trefoil factors: Initiators of mucosal healing. Nat. Rev. Mol. Cell Biol. 2003, 4, 721–732. [Google Scholar] [CrossRef]
  11. Loncar, M.B.; Al-azzeh, E.; Sommer, P.S.M.; Marinovic, M.; Schmehl, K.; Kruschewski, M.; Blin, N.; Stohwasser, R.; Gött, P.; Kayademir, T. Tumour necrosis factor α and nuclear factor κB inhibit transcription of human TFF3 encoding a gastrointestinal healing peptide. Gut 2003, 52, 1297–1303. [Google Scholar] [CrossRef]
  12. Bernstein, H.G.; Dobrowolny, H.; Trübner, K.; Steiner, J.; Bogerts, B.; Hoffmann, W. Differential regional and cellular distribution of TFF3 peptide in the human brain. Amino Acids 2015, 47, 1053–1063. [Google Scholar] [CrossRef]
  13. Liu, S.Q.; Tefft, B.J.; Roberts, D.T.; Zhang, L.Q.; Ren, Y.; Li, Y.C.; Huang, Y.; Zhang, D.; Phillips, H.R.; Wu, Y.H. Cardioprotective proteins upregulated in the liver in response to experimental myocardial ischemia. Am. J. Physiol. Circ. Physiol. 2012, 303, H1446–H1458. [Google Scholar] [CrossRef] [Green Version]
  14. Liu, S.Q.; Roberts, D.; Zhang, B.; Ren, Y.; Zhang, L.Q.; Wu, Y.H. Trefoil Factor 3 as an Endocrine Neuroprotective Factor from the Liver in Experimental Cerebral Ischemia/Reperfusion Injury. PLoS ONE 2013, 8, 1–15. [Google Scholar] [CrossRef]
  15. Xue, Y.; Shen, L.; Cui, Y.; Zhang, H.; Chen, Q.; Cui, A.; Fang, F.; Chang, Y. Tff3, as a Novel Peptide, Regulates Hepatic Glucose Metabolism. PLoS ONE 2013, 8, 1–8. [Google Scholar] [CrossRef]
  16. Ge, H.; Gardner, J.; Wu, X.; Rulifson, I.; Wang, J.; Xiong, Y.; Ye, J.; Belouski, E.; Cao, P.; Tang, J.; et al. Trefoil factor 3 (TFF3) is regulated by food intake, improves glucose tolerance and induces mucinous metaplasia. PLoS ONE 2015, 10, 1–15. [Google Scholar] [CrossRef]
  17. Brown, A.C.; Olver, W.I.; Donnelly, C.J.; May, M.E.; Naggert, J.K.; Shaffer, D.J.; Roopenian, D.C. Searching QTL by gene expression: Analysis of diabesity. BMC Genet. 2005, 6, 1–9. [Google Scholar] [CrossRef]
  18. Guillén, N.; Navarro, M.A.; Arnal, C.; Noone, E.; Arbonés-Mainar, J.M.; Acín, S.; Surra, J.C.; Muniesa, P.; Roche, H.M.; Osada, J. Microarray analysis of hepatic gene expression identifies new genes involved in steatotic liver. Physiol. Genom. 2009, 37, 187–198. [Google Scholar] [CrossRef] [Green Version]
  19. Mashimo, H.; Wu, D.C.; Podolsky, D.K.; Fishman, M.C. Impaired Defense of Intestinal Mucosa in Mice Lacking Intestinal Trefoil Factor. Science 1996, 274, 262–265. [Google Scholar] [CrossRef]
  20. Sigmund, C.D. Viewpoint: Are Studies in Genetically Altered Mice Out of Control? Curt D. Sigmund Arterioscler. Arterioscler. Thromb. 2000, 1425–1429. [Google Scholar] [CrossRef]
  21. Fisher-Wellman, K.H.; Ryan, T.E.; Smith, C.D.; Gilliam, L.A.A.; Lin, C.T.; Reese, L.R.; Torres, M.J.; Neufer, P.D. A direct comparison of metabolic responses to high-fat diet in c57bl/6j and c57bl/6nj mice. Diabetes 2016, 65, 3249–3261. [Google Scholar] [CrossRef]
  22. Eizirik, D.L.; Cardozo, A.K.; Cnop, M. The Role for Endoplasmic Reticulum Stress in Diabetes Mellitus. Endocr. Rev. 2008, 29, 42–61. [Google Scholar] [CrossRef]
  23. Hotamisligil, G.S. Endoplasmic reticulum stress and the inflammatory basis of metabolic disease. Cell 2010, 140, 900–917. [Google Scholar] [CrossRef]
  24. Zhang, X.Q.; Xu, C.F.; Yu, C.H.; Chen, W.X.; Li, Y.M. Role of endoplasmic reticulum stress in the pathogenesis of nonalcoholic fatty liver disease. World J. Gastroenterol. 2014. [Google Scholar] [CrossRef]
  25. Nguyen, P.; Leray, V.; Diez, M.; Serisier, S.; Le Bloc’H, J.; Siliart, B.; Dumon, H. Liver lipid metabolism. J. Anim. Physiol. Anim. Nutr. (Berl.) 2008. [Google Scholar] [CrossRef]
  26. Abdullahi, A.; Stanojcic, M.; Parousis, A.; Patsouris, D.; Jeschke, M.G. Modeling Acute ER Stress in Vivo and in Vitro. Shock 2017, 47, 506–513. [Google Scholar] [CrossRef] [Green Version]
  27. Oslowski, C.M.; Urano, F. Measuring ER Stress and the Unfolded Protein Response Using Mammalian Tissue Culture System. Methods Enzymol. 2011, 490, 71–92. [Google Scholar] [CrossRef] [Green Version]
  28. Luhr, M.; Torgersen, M.L.; Szalai, P.; Hashim, A.; Brech, A.; Staerk, J.; Engedal, N. The kinase PERK and the transcription factor ATF4 play distinct and essential roles in autophagy resulting from tunicamycin-induced ER stress. J. Biol. Chem. 2019. [Google Scholar] [CrossRef]
  29. Li, Y.; Guo, Y.; Tang, J.; Jiang, J.; Chen, Z. New insights into the roles of CHOP-induced apoptosis in ER stress. Acta Biochim. Biophys Sin 2014, 46, 629–640. [Google Scholar] [CrossRef] [Green Version]
  30. Cormier, J.H.; Tamura, T.; Sunryd, J.C.; Hebert, D.N. EDEM1 recognition and delivery of misfolded proteins to the SEL1L-containing ERAD complex. Mol. Cell 2009, 34, 627–633. [Google Scholar] [CrossRef]
  31. Eletto, D.; Dersh, D.; Argon, Y. GRP94 in ER quality control and stress responses. Semin. Cell Dev. Biol. 2010, 21, 479–485. [Google Scholar] [CrossRef] [Green Version]
  32. Cao, S.S.; Kaufman, R.J. Endoplasmic reticulum stress and oxidative stress in cell fate decision and human disease. Antioxid. Redox Signal. 2014, 21, 396–413. [Google Scholar] [CrossRef]
  33. Balcer-Kubiczek, E.K.; Harrison, G.H.; Xu, J.F.; Gutierrez, P.L. Coordinate late expression of trefoil peptide genes (pS2/TFF1 and ITF/TFF3) in human breast, colon and gastric tumor cells exposed to X-rays. Mol. Cancer Ther. 2002, 1, 405–415. [Google Scholar]
  34. Cohen, G.; Hochstein, P. Glutathione Peroxidase: The primary agent for the elimination of hydrogen peroxide in erythrocytes. Biochemistry 1963, 6, 1420–1428. [Google Scholar] [CrossRef]
  35. Bujak, M.; Bujak, I.T.; Sobočanec, S.; Mihalj, M.; Novak, S.; Cosić, A.; Levak, M.T.; Kopačin, V.; Mihaljević, B.; Balog, T.; et al. Trefoil factor 3 deficiency affects liver lipid metabolism. Cell. Physiol. Biochem. 2018, 47, 827–841. [Google Scholar] [CrossRef]
  36. Perlemuter, G.; Davit-Spraul, A.; Cosson, C.; Conti, M.; Bigorgne, A.; Paradis, V.; Corre, M.P.; Prat, L.; Kuoch, V.; Basdevant, A.; et al. Increase in liver antioxidant enzyme activities in non-alcoholic fatty liver disease. Liver Int. 2005, 25, 946–953. [Google Scholar] [CrossRef]
  37. Ucar, F.; Sezer, S.; Erdogan, S.; Akyol, S.; Armutcu, F.; Akyol, O. The relationship between oxidative stress and nonalcoholic fatty liver disease: Its effects on the development of nonalcoholic steatohepatitis. Redox Rep. 2013, 18, 127–133. [Google Scholar] [CrossRef]
  38. Marnett, L.J.; Rowlinson, S.W.; Goodwin, D.C.; Kalgutkar, A.S.; Lanzo, C.A. Arachidonic acid oxygenation by COX-1 and COX-2. Mechanisms of catalysis and inhibition. J. Biol. Chem. 1999, 274, 22903–22906. [Google Scholar] [CrossRef]
  39. Gores, G.J.; Flarsheim, C.E.; Dawson, T.L.; Nieminen, A.L.; Herman, B.; Lemasters, J.J. Swelling, reductive stress, and cell death during chemical hypoxia in hepatocytes. Am. J. Physiol. Physiol. 1989, 257, 347–354. [Google Scholar] [CrossRef]
  40. Xiao, J.; Liong, E.C.; Huang, H.; On Tse, W.; Lau, K.S.; Pan, J.; Nanji, A.A.; Fung, M.L.; Xing, F.; Tipoe, G.L. Cyclooxygenase-1 serves a vital hepato-protective function in chemically induced acute liver injury. Toxicol. Sci. 2014, 143, 430–440. [Google Scholar] [CrossRef]
  41. Jackson, L.M.; Wu, K.C.; Mahida, Y.R.; Jenkins, D.; Hawkey, C.J. Cyclooxygenase (COX) 1 and 2 in normal, inflamed, and ulcerated human gastric mucosa. Gut 2000, 47, 762–770. [Google Scholar] [CrossRef]
  42. Rodrigues, S.; Nguyen, Q.D.; Faivre, S.; Bruyneel, E.; Thim, L.; Westley, B.; May, F.; Flatau, G.; Mareel, M.; Gespach, C.; et al. Activation of cellular invasion by trefoil peptides and src is mediated by cyclooxygenase- and thromboxane A2 receptor-dependent signaling pathways. FASEB J. 2002, 15, 1517–1528. [Google Scholar] [CrossRef]
  43. Xue, L.; Aihara, E.; Podolsky, D.K.; Wang, T.C.; Montrose, M.H. In vivo action of trefoil factor 2 (TFF2) to speed gastric repair is independent of cyclooxygenase. Gut 2010, 59, 1184–1191. [Google Scholar] [CrossRef]
  44. Cook, G.A.; Familari, M.; Thim, L.; Giraud, A.S. The trefoil peptides TFF2 and TFF3 are expressed in rat lymphoid tissues and participate in the immune response. FEBS Lett. 1999, 456, 155–159. [Google Scholar] [CrossRef] [Green Version]
  45. Fu, T.; Znalesniak, E.B.; Kalinski, T.; Möhle, L.; Biswas, A.; Salm, F.; Dunay, I.R.; Hoffmann, W. TFF Peptides Play a Role in the Immune Response Following Oral Infection of Mice with Toxoplasma Gondii. Eur. J. Microbiol. Immunol. (Bp). 2015, 5, 221–231. [Google Scholar] [CrossRef]
  46. Kolattukudy, P.E.; Niu, J. Inflammation, endoplasmic reticulum stress, autophagy, and the monocyte chemoattractant protein-1/CCR2 pathway. Circ. Res. 2012, 110, 174–189. [Google Scholar] [CrossRef]
  47. Chen, W.; Zhang, J.; Fan, H.N.; Zhu, J.S. Function and therapeutic advances of chemokine and its receptor in nonalcoholic fatty liver disease. Therap. Adv. Gastroenterol. 2018, 11, 1–13. [Google Scholar] [CrossRef]
  48. Deshmane, S.L.; Kremlev, S.; Amini, S.; Sawaya, B.E. Monocyte chemoattractant protein-1 (MCP-1): An overview. J. Interferon Cytokine Res. 2009, 29, 313–326. [Google Scholar] [CrossRef]
  49. Kanda, H.; Tateya, S.; Tamori, Y.; Kotani, K.; Hiasa, K.; Kitazawa, R.; Kitazawa, S.; Miyachi, H.; Maeda, S.; Egashira, K.; et al. MCP-1 contributes to macrophage infiltration into adipose tissue, insulin resistance, and hepatic steatosis in obesity. J. Clin. Invest. 2006, 116, 1494–1505. [Google Scholar] [CrossRef]
  50. Mandrekar, P.; Ambade, A.; Lim, A.; Szabo, G.; Catalano, D. An essential role for monocyte chemoattractant protein-1 in alcoholic liver injury: Regulation of proinflammatory cytokines and hepatic steatosis in mice. Hepatology 2011, 54, 2185–2197. [Google Scholar] [CrossRef] [Green Version]
  51. Sawant, K.V.; Poluri, K.M.; Dutta, A.K.; Sepuru, K.M.; Troshkina, A.; Garofalo, R.P.; Rajarathnam, K. Chemokine CXCL1 mediated neutrophil recruitment: Role of glycosaminoglycan interactions. Sci. Rep. 2016. [Google Scholar] [CrossRef]
  52. Gao, B.; Tsukamoto, H. Inflammation in Alcoholic and Nonalcoholic Fatty Liver Disease: Friend or Foe? Gastroenterology 2016, 150, 1704–1709. [Google Scholar] [CrossRef] [Green Version]
  53. Isoda, K.; Sawada, S.; Ayaori, M.; Matsuki, T.; Horai, R.; Kagata, Y.; Miyazaki, K.; Kusuhara, M.; Okazaki, M.; Matsubara, O.; et al. Deficiency of interleukin-1 receptor antagonist deteriorates fatty liver and cholesterol metabolism in hypercholesterolemic mice. J. Biol. Chem. 2005, 280, 7002–7009. [Google Scholar] [CrossRef]
  54. Miura, K.; Kodama, Y.; Inokuchi, S.; Schnabl, B.; Aoyama, T.; Ohnishi, H.; Olefsky, J.M.; Brenner, D.A.; Seki, E. Toll-like receptor 9 promotes steatohepatitis by induction of interleukin-1beta in mice. Gastroenterology 2010, 139, 323–334. [Google Scholar] [CrossRef]
  55. Kamari, Y.; Shaish, A.; Vax, E.; Shemesh, S.; Kandel-Kfir, M.; Arbel, Y.; Olteanu, S.; Barshack, I.; Dotan, S.; Voronov, E.; et al. Lack of interleukin-1α or interleukin-1β inhibits transformation of steatosis to steatohepatitis and liver fibrosis in hypercholesterolemic mice. J. Hepatol. 2011, 55, 1086–1094. [Google Scholar] [CrossRef]
  56. Cheng, Z.; Teo, G.; Krueger, S.; Rock, T.M.; Koh, H.W.; Choi, H.; Vogel, C. Differential dynamics of the mammalian mRNA and protein expression response to misfolding stress. Mol. Syst. Biol. 2016, 12, 855. [Google Scholar] [CrossRef]
  57. Nejdl, L.; Gumulec, J.; Ruttkay-Nedecky, B.; Stiborova, M.; Zitka, O.; Adam, V.; Kizek, R.; Masarik, M.; Eckschlager, T. The role of metallothionein in oxidative Stress. Int. J. Mol. Sci. 2013, 14, 6044–6066. [Google Scholar] [CrossRef]
  58. Thirumoorthy, N.; Shyam Sunder, A.; Manisenthil Kumar, K.T.; Senthil kumar, M.; Ganesh, G.N.K.; Chatterjee, M. A review of metallothionein isoforms and their role in pathophysiology. World J. Surg. Oncol. 2011, 9, 1–7. [Google Scholar] [CrossRef]
  59. Nagamine, T.; Nakajima, K. Significance of metallothionein expression in liver disease. Curr. Pharm. Biotechnol. 2013, 14, 420–426. [Google Scholar] [CrossRef]
  60. Waller-Evans, H.; Hue, C.; Fearnside, J.; Rothwell, A.R.; Lockstone, H.E.; Caldérari, S.; Wilder, S.P.; Cazier, J.B.; Scott, J.; Gauguier, D. Nutrigenomics of high fat diet induced obesity in mice suggests relationships between susceptibility to fatty liver disease and the proteasome. PLoS ONE 2013, 8, 1–12. [Google Scholar] [CrossRef]
  61. Kondoh, M.; Tsukada, M.; Kuronaga, M.; Higashimoto, M.; Takiguchi, M.; Himeno, S.; Watanabe, Y.; Sato, M. Induction of hepatic metallothionein synthesis by endoplasmic reticulum stress in mice. Toxicol. Lett. 2004, 148, 133–139. [Google Scholar] [CrossRef]
  62. Arriaga, J.M.; Bravo, A.I.; Mordoh, J.; Bianchini, M. Metallothionein 1G promotes the differentiation of HT-29 human colorectal cancer cells. Oncol. Rep. 2017, 37, 2633–2651. [Google Scholar] [CrossRef] [Green Version]
  63. Baltruskeviciene, E.; Kazbariene, B.; Badaras, R.; Bagdonaitė, L.; Krikštaponienė, A.; Zdanavičius, L.; Aleknavicius, E.; Didziapetrienė, J. Glutathione and glutathione S-transferase levels in patients with liver metastases of colorectal cancer and other hepatic disorders. Turk. J. Gastroenterol. 2016, 27, 336–341. [Google Scholar] [CrossRef] [Green Version]
  64. Ye, Z.W.; Zhang, J.; Ancrum, T.; Manevich, Y.; Townsend, D.M.; Tew, K.D. Glutathione S-transferase P-mediated protein S-glutathionylation of resident endoplasmic reticulum proteins influences sensitivity to drug-induced unfolded protein response. Antioxid. Redox Signal. 2017, 26, 247–261. [Google Scholar] [CrossRef]
  65. Jo, H.; Choe, S.S.; Shin, K.C.; Jang, H.; Lee, J.H.; Seong, J.K.; Back, S.H.; Kim, J.B. Endoplasmic reticulum stress induces hepatic steatosis via increased expression of the hepatic very low-density lipoprotein receptor. Hepatology 2013, 57, 1366–1377. [Google Scholar] [CrossRef]
  66. McKeegan, D.; Kaab, H.; Bain, M.; Kuleš, J.; O’Reilly, E.; Horvatić, A.; Eckersall, P.D.; Guillemin, N. Quantitative proteomics using tandem mass tags in relation to the acute phase protein response in chicken challenged with Escherichia coli lipopolysaccharide endotoxin. J. Proteom. 2019, 192, 64–77. [Google Scholar] [CrossRef]
  67. R Core Team. R: A Language and Environment for Statistical Computing; R Core Team: Vienna, Austria, 2013; Available online: https://www.R-project.org/ (accessed on 5 June 2019).
  68. Komsta, L. Outliers: Tests for Outliers (R Package Version 0.14). 2011. Available online: https://rdrr.io/cran/outliers/ (accessed on 5 June 2019).
  69. Wickham, H. Ggplot2: Elegant Graphics for Data Analysis, 1st ed.; Springer: Cham, Switzerland, 2009. [Google Scholar]
  70. Schindelin, J.; Arganda-Carreras, I.; Frise, E.; Kaynig, V.; Longair, M.; Pietzsch, T.; Preibisch, S.; Rueden, C.; Saalfeld, S.; Schmid, B.; et al. Fiji: An open-source platform for biological-image analysis. Nat. Methods 2012, 9, 676–682. [Google Scholar] [CrossRef]
  71. Schindelin, J.; Rueden, C.T.; Hiner, M.C.; Eliceiri, K.W. The ImageJ ecosystem: An open platform for biomedical image analysis. Mol. Reprod. Dev. 2015, 82, 518–529. [Google Scholar] [CrossRef] [Green Version]
Figure 1. Effect of tunicamycin treatment on the expression of ER stress markers. We performed a quantitative polymerase chain reaction (qPCR) using SYBR green detection chemistry for each group (n = 5 animals per group), wherein Ct data were analyzed by REST software and presented relative to the Wt control group as log2 (fold change) (A). Additionally, expression of genes in tunicamycin-treated trefoil factor family 3 (Tff3)−/− mice was expressed relative to Wt tunicamycin-treated mice (B). ** p ≤ 0.01, *** p ≤ 0.001; Wt Tm = wild type tunicamycin-treated mice, Tff3−/− CTR = Tff3-deficient untreated mice, Tff3−/− Tm = Tff3−/− tunicamycin-treated mice.
Ijms 20 04389 g001
Figure 2. Effect of ER stress on PERK (A) and eIF2α (B) protein phosphorylation. Relative protein levels of ER stress markers, (PKR)-like endoplasmic reticulum kinase (PERK), p-PERK (A) and eIF2α and p-eIF2α (B) in liver homogenate of wild type mice and Tff3−/− mice treated with tunicamycin. Protein level is presented relative to Wt mice as mean ± SEM of specific protein band density normalized with amido black. The difference between the groups was compared by the Student t-test. Wt Tm = wild type tunicamycin-treated mice, Tff3−/− Tm = Tff3−/− tunicamycin-treated mice.
Ijms 20 04389 g002
Figure 3. Effect of tunicamycin treatment on the expression of relevant oxidative stress genes in Wt- and Tff3-deficient mice. We performed qPCR using SYBR green detection for each group (n = 5 animals per group), Ct data were analyzed by the REST program and presented relative to Wt control (A). Expression of genes in tunicamycin-treated Tff3-deficient mice was expressed relative to Wt tunicamycin-treated mice (B). * p ≤ 0.05; Wt Tm = wild type tunicamycin-treated mice, Tff3−/− CTR = Tff3 deficient untreated mice, Tff3−/− Tm = Tff3−/− tunicamycin-treated mice.
Ijms 20 04389 g003
Figure 4. Effect of tunicamycin treatment on the expression of cytokine genes in Wt and Tff3-deficient mice. We performed qPCR using SYBR green detection for each group (n = 5 animals per group), Ct data were analyzed by REST program and presented relative to Wt control as log2 (fold change) (A). Expression of genes in tunicamycin-treated Tff3−/− mice was expressed relative to the Wt tunicamycin-treated mice (B). * p ≤ 0.05, ** p ≤ 0.01, *** p ≤ 0.001; Wt Tm = wild type tunicamycin-treated mice, Tff3−/− CTR = Tff3 deficient untreated mice, Tff3−/− Tm = Tff3−/− tunicamycin treated mice.
Ijms 20 04389 g004
Figure 5. Effect of tunicamycin treatment on the expression of CXCL1 and MCP1 protein in Wt and Tff3-deficient mice. Protein level of CXCL1 and MCP1 was determined by Western blot in liver homogenate of WT (C57BL6/N) and Tff3−/− mice treated with tunicamycin. Protein level is presented relative to Wt mice as mean ± SEM of specific protein band density normalized with amido black. The differences between groups were compared by the Student t-test. Wt Tm = wild type tunicamycin-treated mice, Tff3−/− Tm = Tff3−/− tunicamycin-treated mice.
Ijms 20 04389 g005
Figure 6. Volcano plot, plotting significance (−log(P)) on the y-axis, versus fold change (log2FC) on the x-axis.
Ijms 20 04389 g006
Figure 7. Liver tissue of wild type (A,C) and Tff3 knock-out (B,D) tunicamycin-treated mice stained using hematoxylin-eosin (A,B) and oil red O (C,D). Numerous small lipid droplets (marked with black →) are visible in the cytoplasm of hepatocytes stained using hematoxylin-eosin. There is no apparent morphological difference in fatty changes between the two groups. On oil red O-stained slides, lipid droplets stained intensively red are abundant in hepatocyte cytoplasm across the slide. There is no apparent morphological difference in fatty changes between the two groups. Scale bar: 60 µm.
Ijms 20 04389 g007
Figure 8. Liver tissue of wild type (A) and Tff3 knock-out (B) tunicamycin-treated mice analyzed by transmission electron microscopy (TEM); (M) mitochondria, (N) nucleus, (>) lipid droplets. The size of lipid droplets in hepatocytes appeared to be increased in Tff3−/− mice compared to wild type mice. There was no difference in the ultrastructure of hepatocytes including cell bodies and cell organelles. Scale bar: 2 µm.
Ijms 20 04389 g008
Table 1. Oligonucleotides used for qPCR analysis.
Gene SymbolAccession No.Primer Sequence Forward (5′-3′) Reverse (5′-3′)Optimized qPCR Conditions (Annealing Temp/MgCl)
ERS markers
ATF4NM_009716.3CCACTCCAGAGCATTCCTTTAG
CTCCTTTACACATGGAGGGATTAG
59 °C; 3.5 mM
BIPNM_001163434.1GAGACTGCTGAGGCGTATTT
CAGCATCTTTGGTTGCTTGTC
58 °C; 3.5 mM
CHOPNM_007837.4TTGAGCCTAACACGTCGATTAT
CACTTCCTTCTGGAACACTCTC
58 °C; 3 mM
EDEMNM_138677.2TGAAAGCATGTGAGGGTAGTG
GAGAGAAGGGAAGACAGGATAGA
61 °C; 3.5 mM
GRP94NM_011631.1AAGAATGAAGGAAAAACAGGACAAAA
CAAATGGAGAAGATTCCGCC
58 °C; 3 mM
sXBP1NM_008934.4GAGTCCGCAGCAGGTG
GTGTCAGAGTCCATGGGA
56 °C; 3 mM
Cytokines
CXCL1NM_008176.3GTGTCAACCACTGTGCTAGT
CACACATGTCCTCACCCTAATAC
61 °C; 3.5 mM
IL1αNM_010554.4CCTTACACCTACCAGAGTGATTT
CCTTACACCTACCAGAGTGATTT
65 °C; 3 mM
IL1βNM_008361.4ATGGGCAACCACTTACCTATTT
GTTCTAGAGAGTGCTGCCTAATG
64 °C; 3 mM
IL6NM_031168.2GATAAGCTGGAGTCACAGAAGG
TTGCCGAGTAGATCTCAAAGTG
59 °C; 3.5 mM
MCP1NM_011333.3CCTGGATCGGAACCAAATGA
CGGGTCAACTTCACATTCAAAG
62 °C; 3 mM
TGFαNM_031199.4CTTTAGGAAGGACCTGGGTTG
GTGTGTCCAGGCTCCAAATA
66 °C; 3 mM
TNFαNM_013693.3GTCTCAGAATGAGGCTGGATAAG
CATTGCACCTCAGGGAAGAA
63 °C; 2.5 mM
Oxidative stress markers
COX1NM_008969.4 GTGCCAGAACCAGGGTGTCT
GTAGCCCGTGCGAGTACAATC
58 °C 3 mM
GPX1NM_008160.6GGTTCGAGCCCAATTTTACA
CATTCCGCAGGAAGGTAAAG
58 °C 2.5 mM
NOX2NM_007807.5ACTCCTTGGGTCAGCACTGG
GTTCCTGTCCAGTTGTCTTCG
62 °C 3 mM
SOD1NM_011434.2 GCCTTCTGCTCGAAGTGGAT
GGAAGCATGGCGATGAAAGC
59 °C 3.5 mM
SOD3NM_011435.3 TGGCTGATGGTTGTACCCTG
TGAGAAGATAGGCGACACGC
60 °C 2.5 mM
Housekeeping genes
ACTBNM_007393.5 GCAAGCAGGAGTACGATGAG
CCATGCCAATGTTGTCTCTT
61 °C; 3.5 mM
B2MNM_009735.3CCTGCAGAGTTAAGCATGACAGT
TCATGATGCTTGATCACATGTCT
60 °C; 3 mM

