Whole Genome Expression Analyses of miRNAs and mRNAs Suggest the Involvement of miR-320a and miR-155-3p and their Targeted Genes in Lithium Response in Bipolar Disorder

 ,
,  , , and
Abstract
: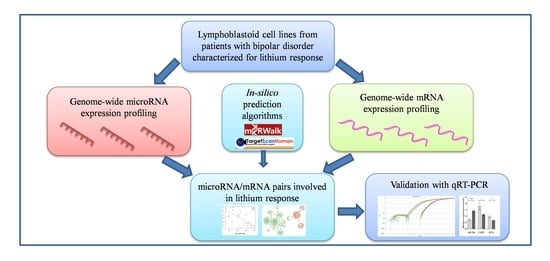
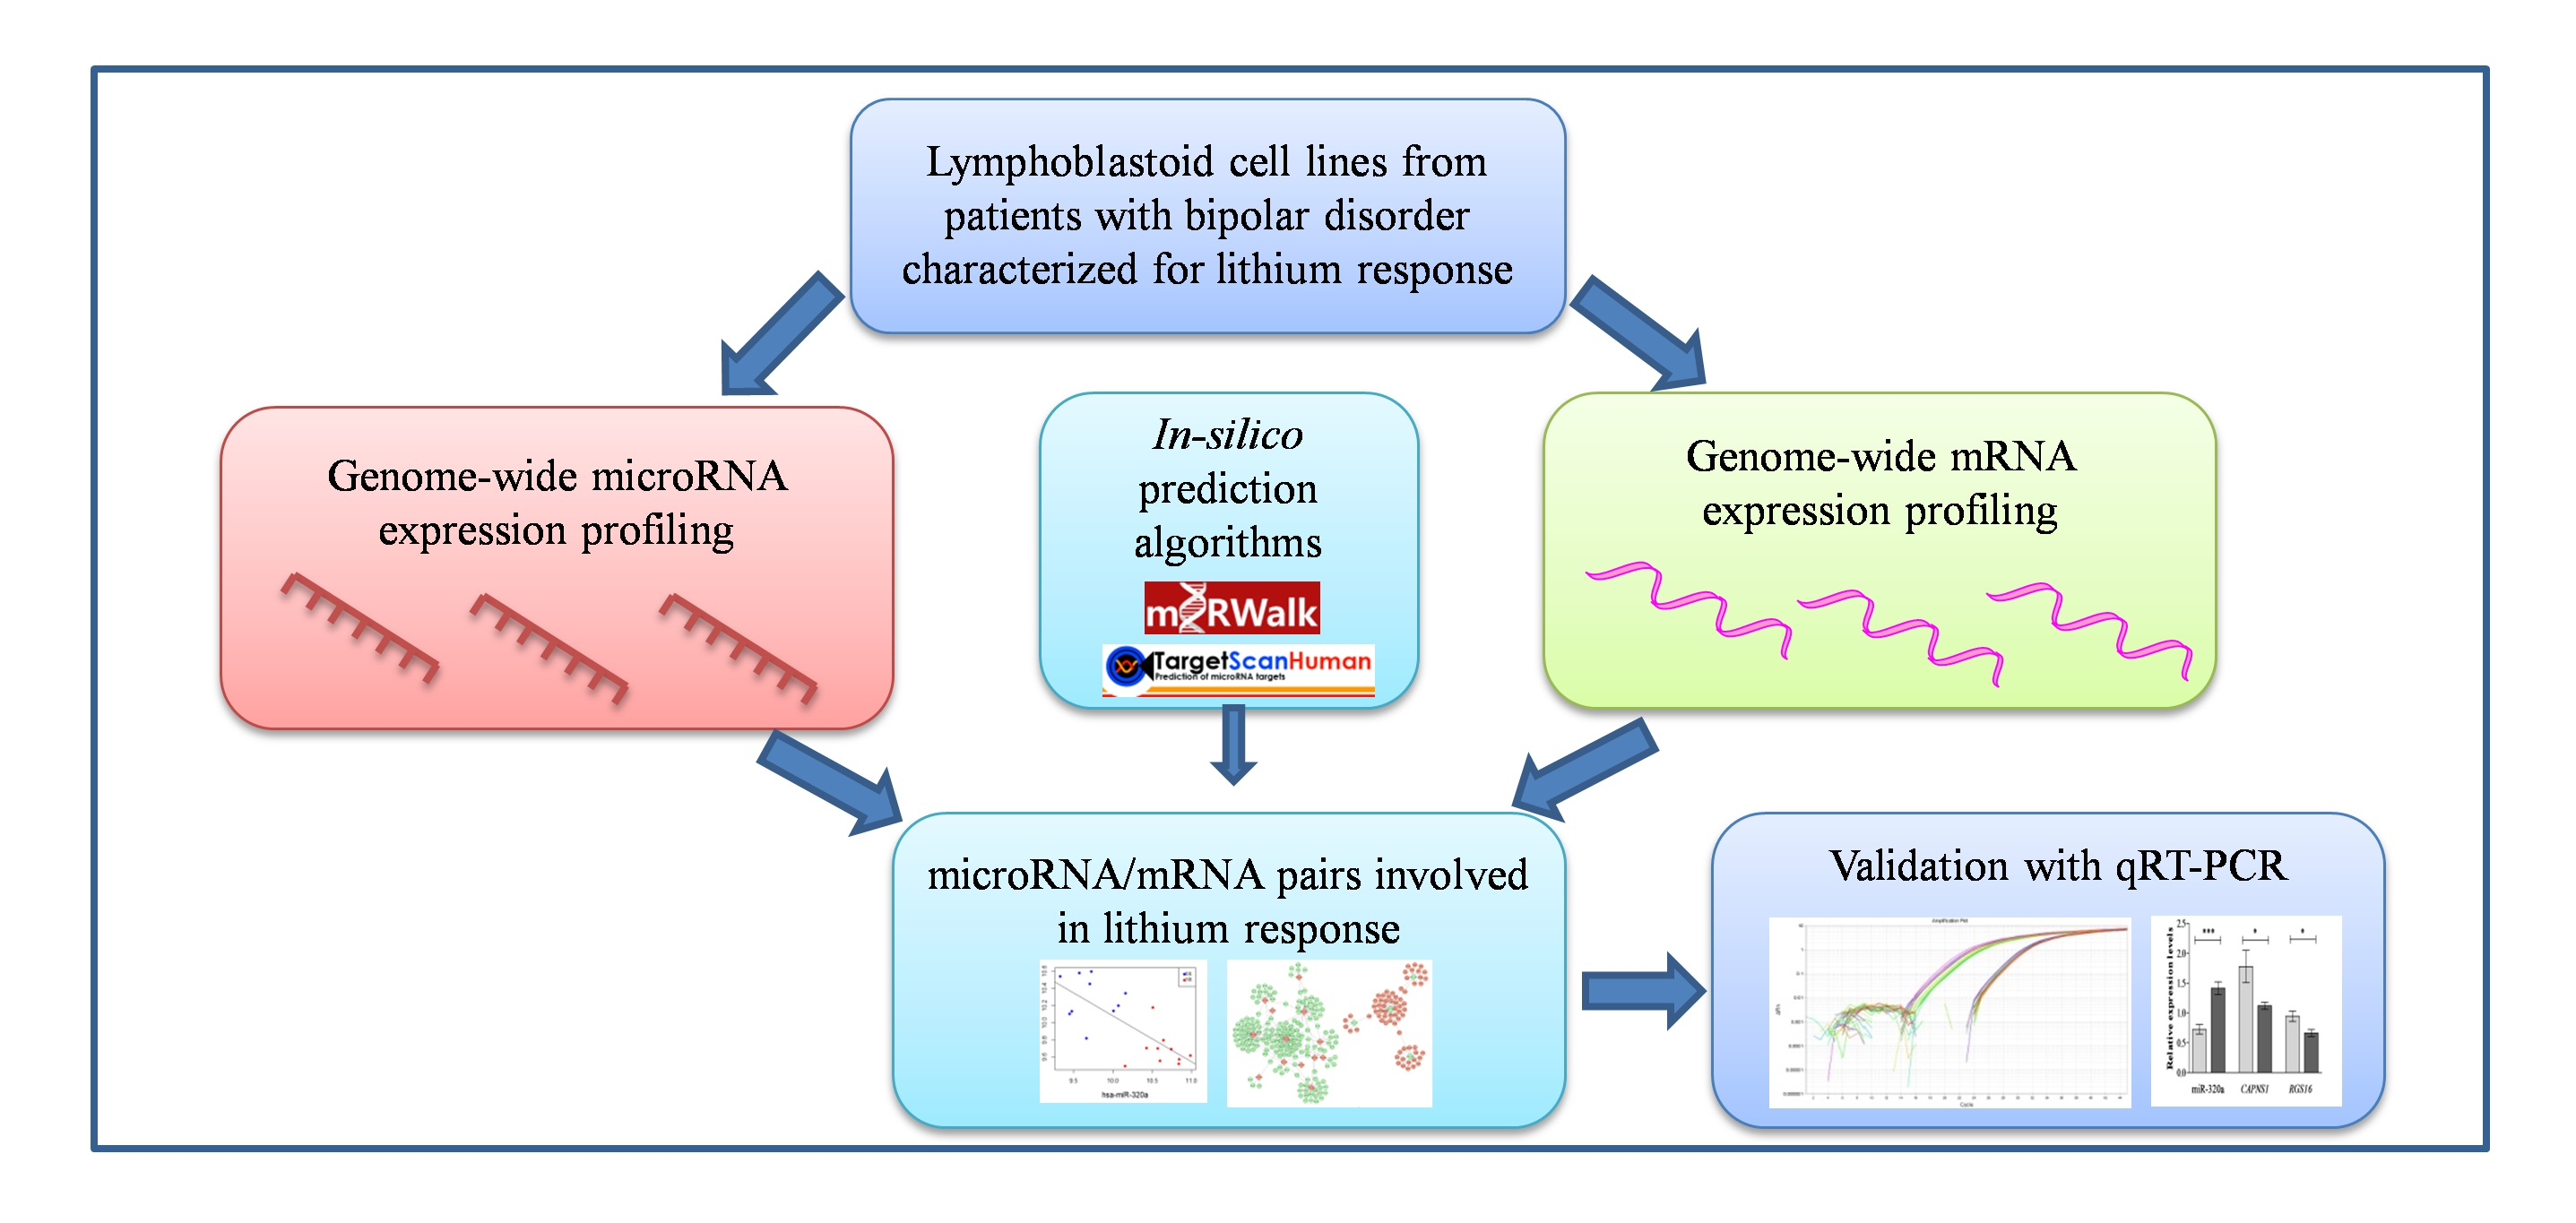
1. Introduction
2. Results
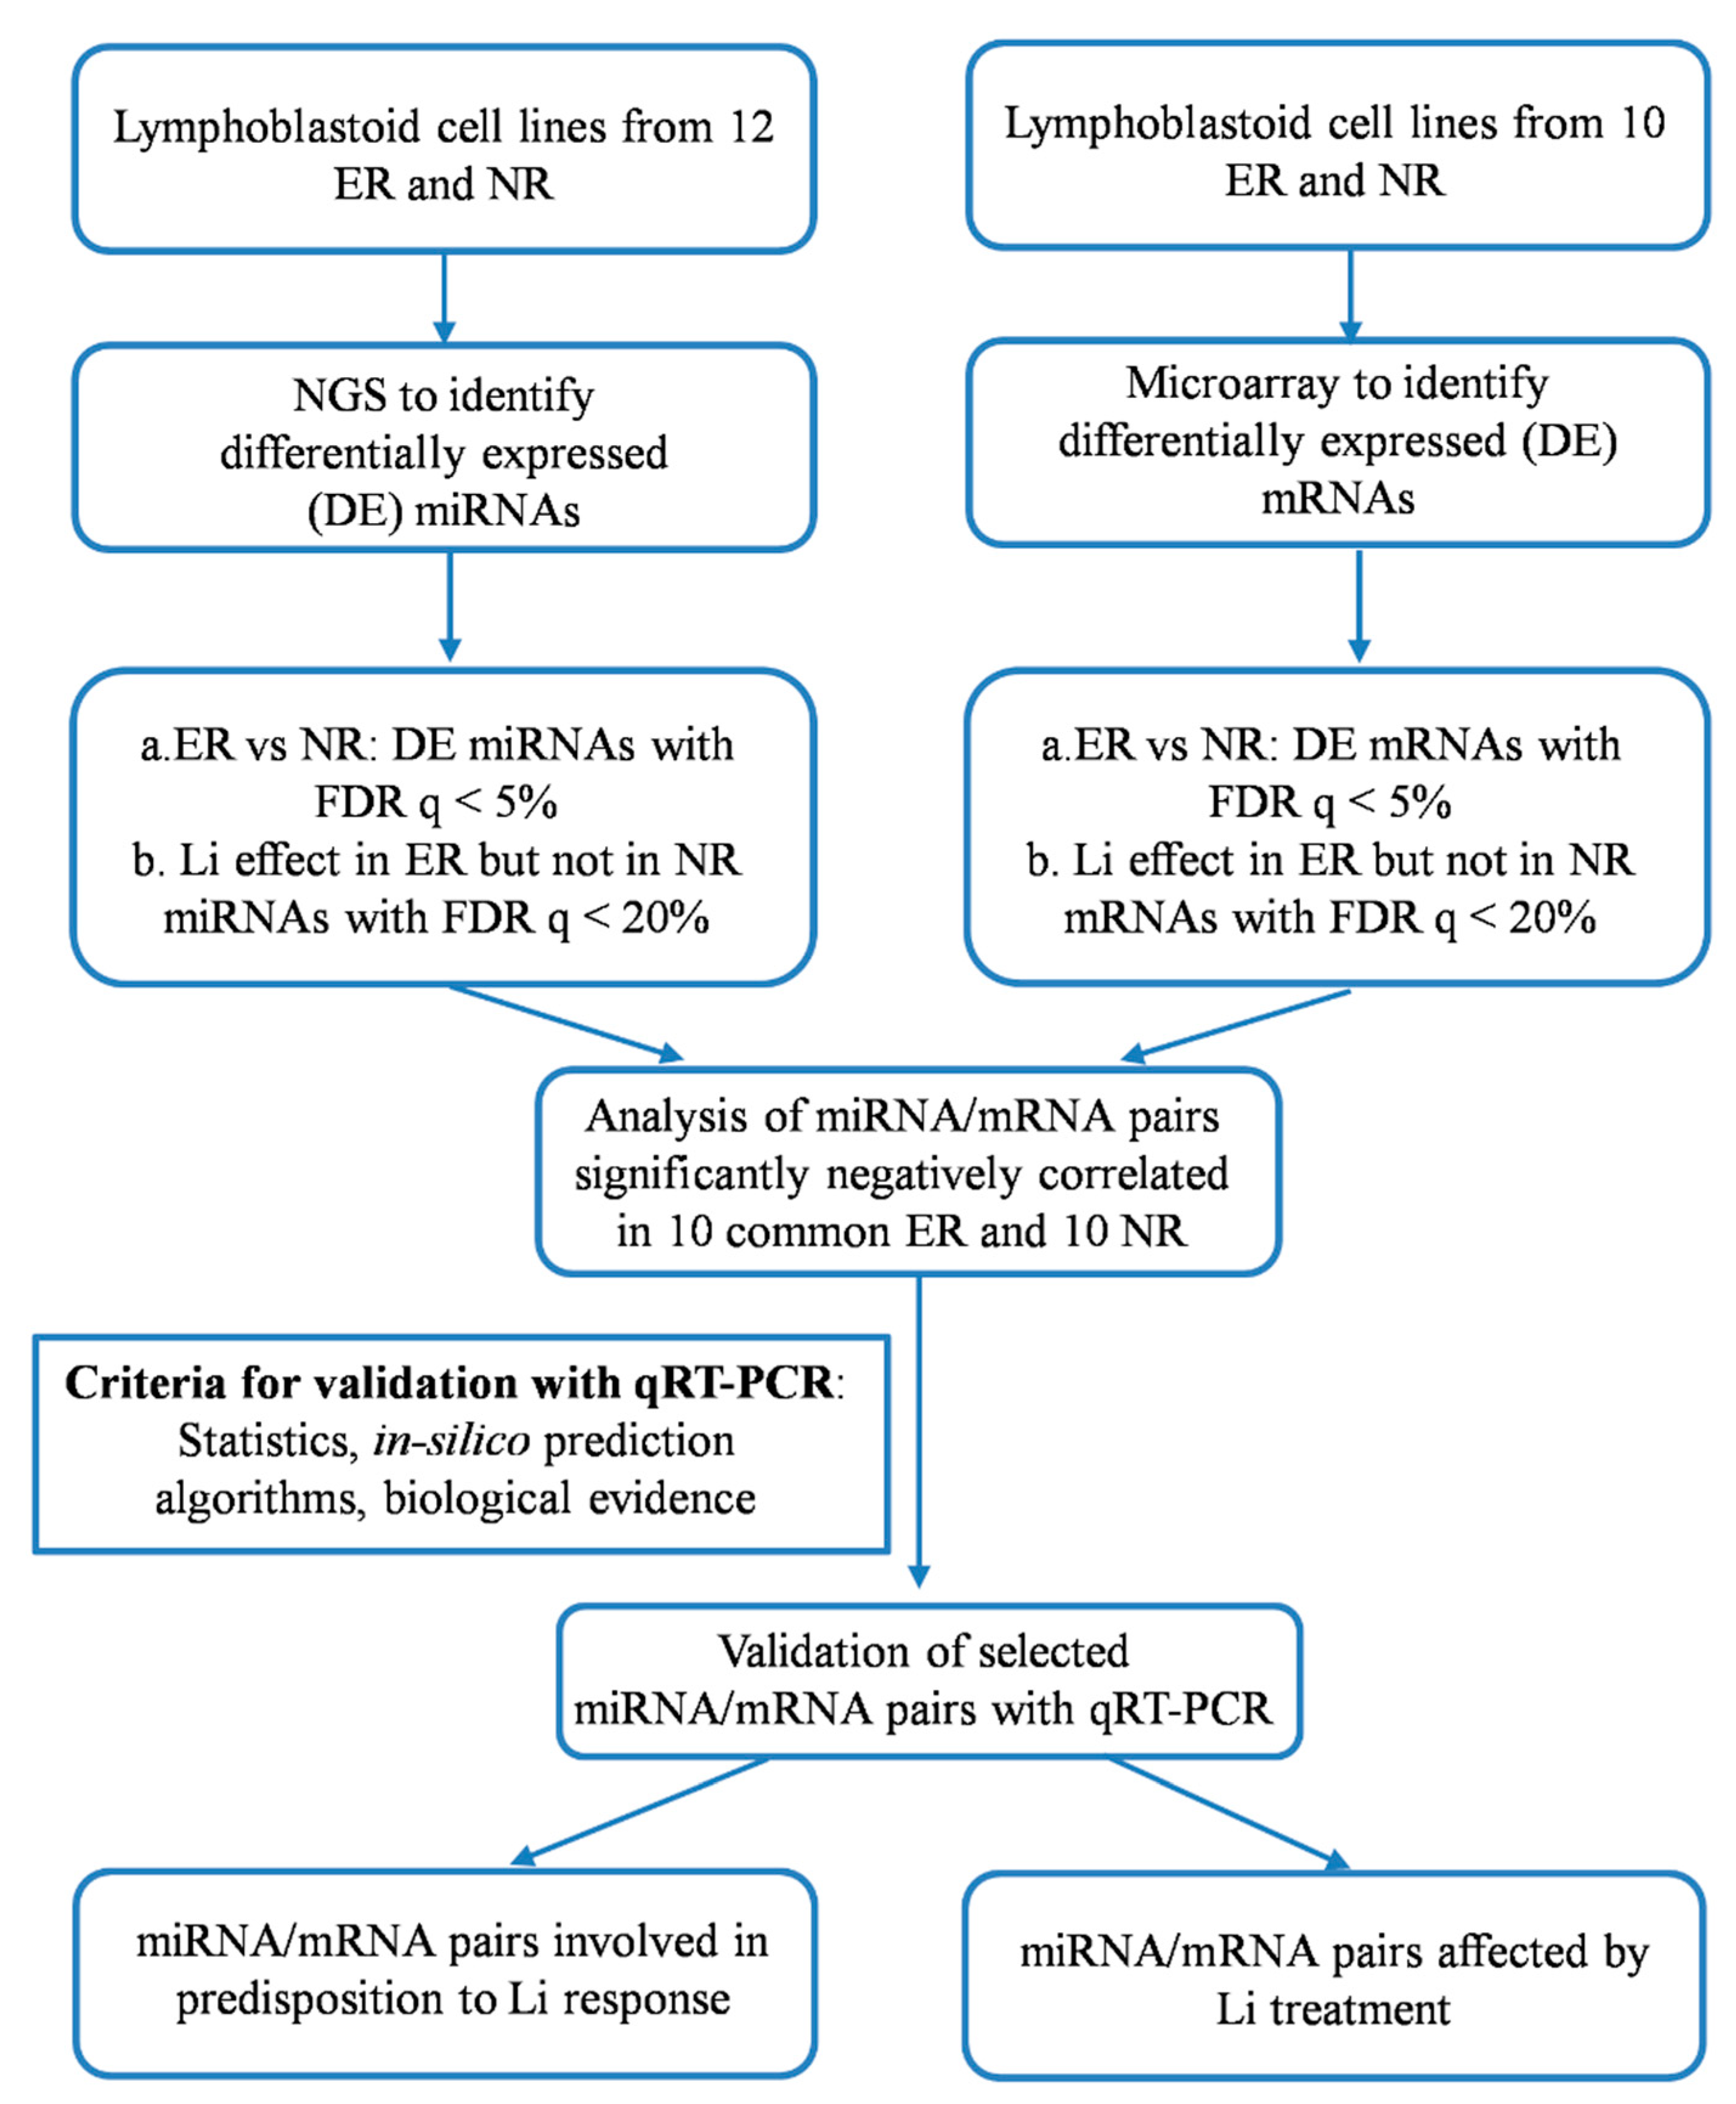
2.1. Genome-Wide Analysis of miRNAs and mRNAs
2.2. Correlation between miRNAs and mRNAs Expression Levels
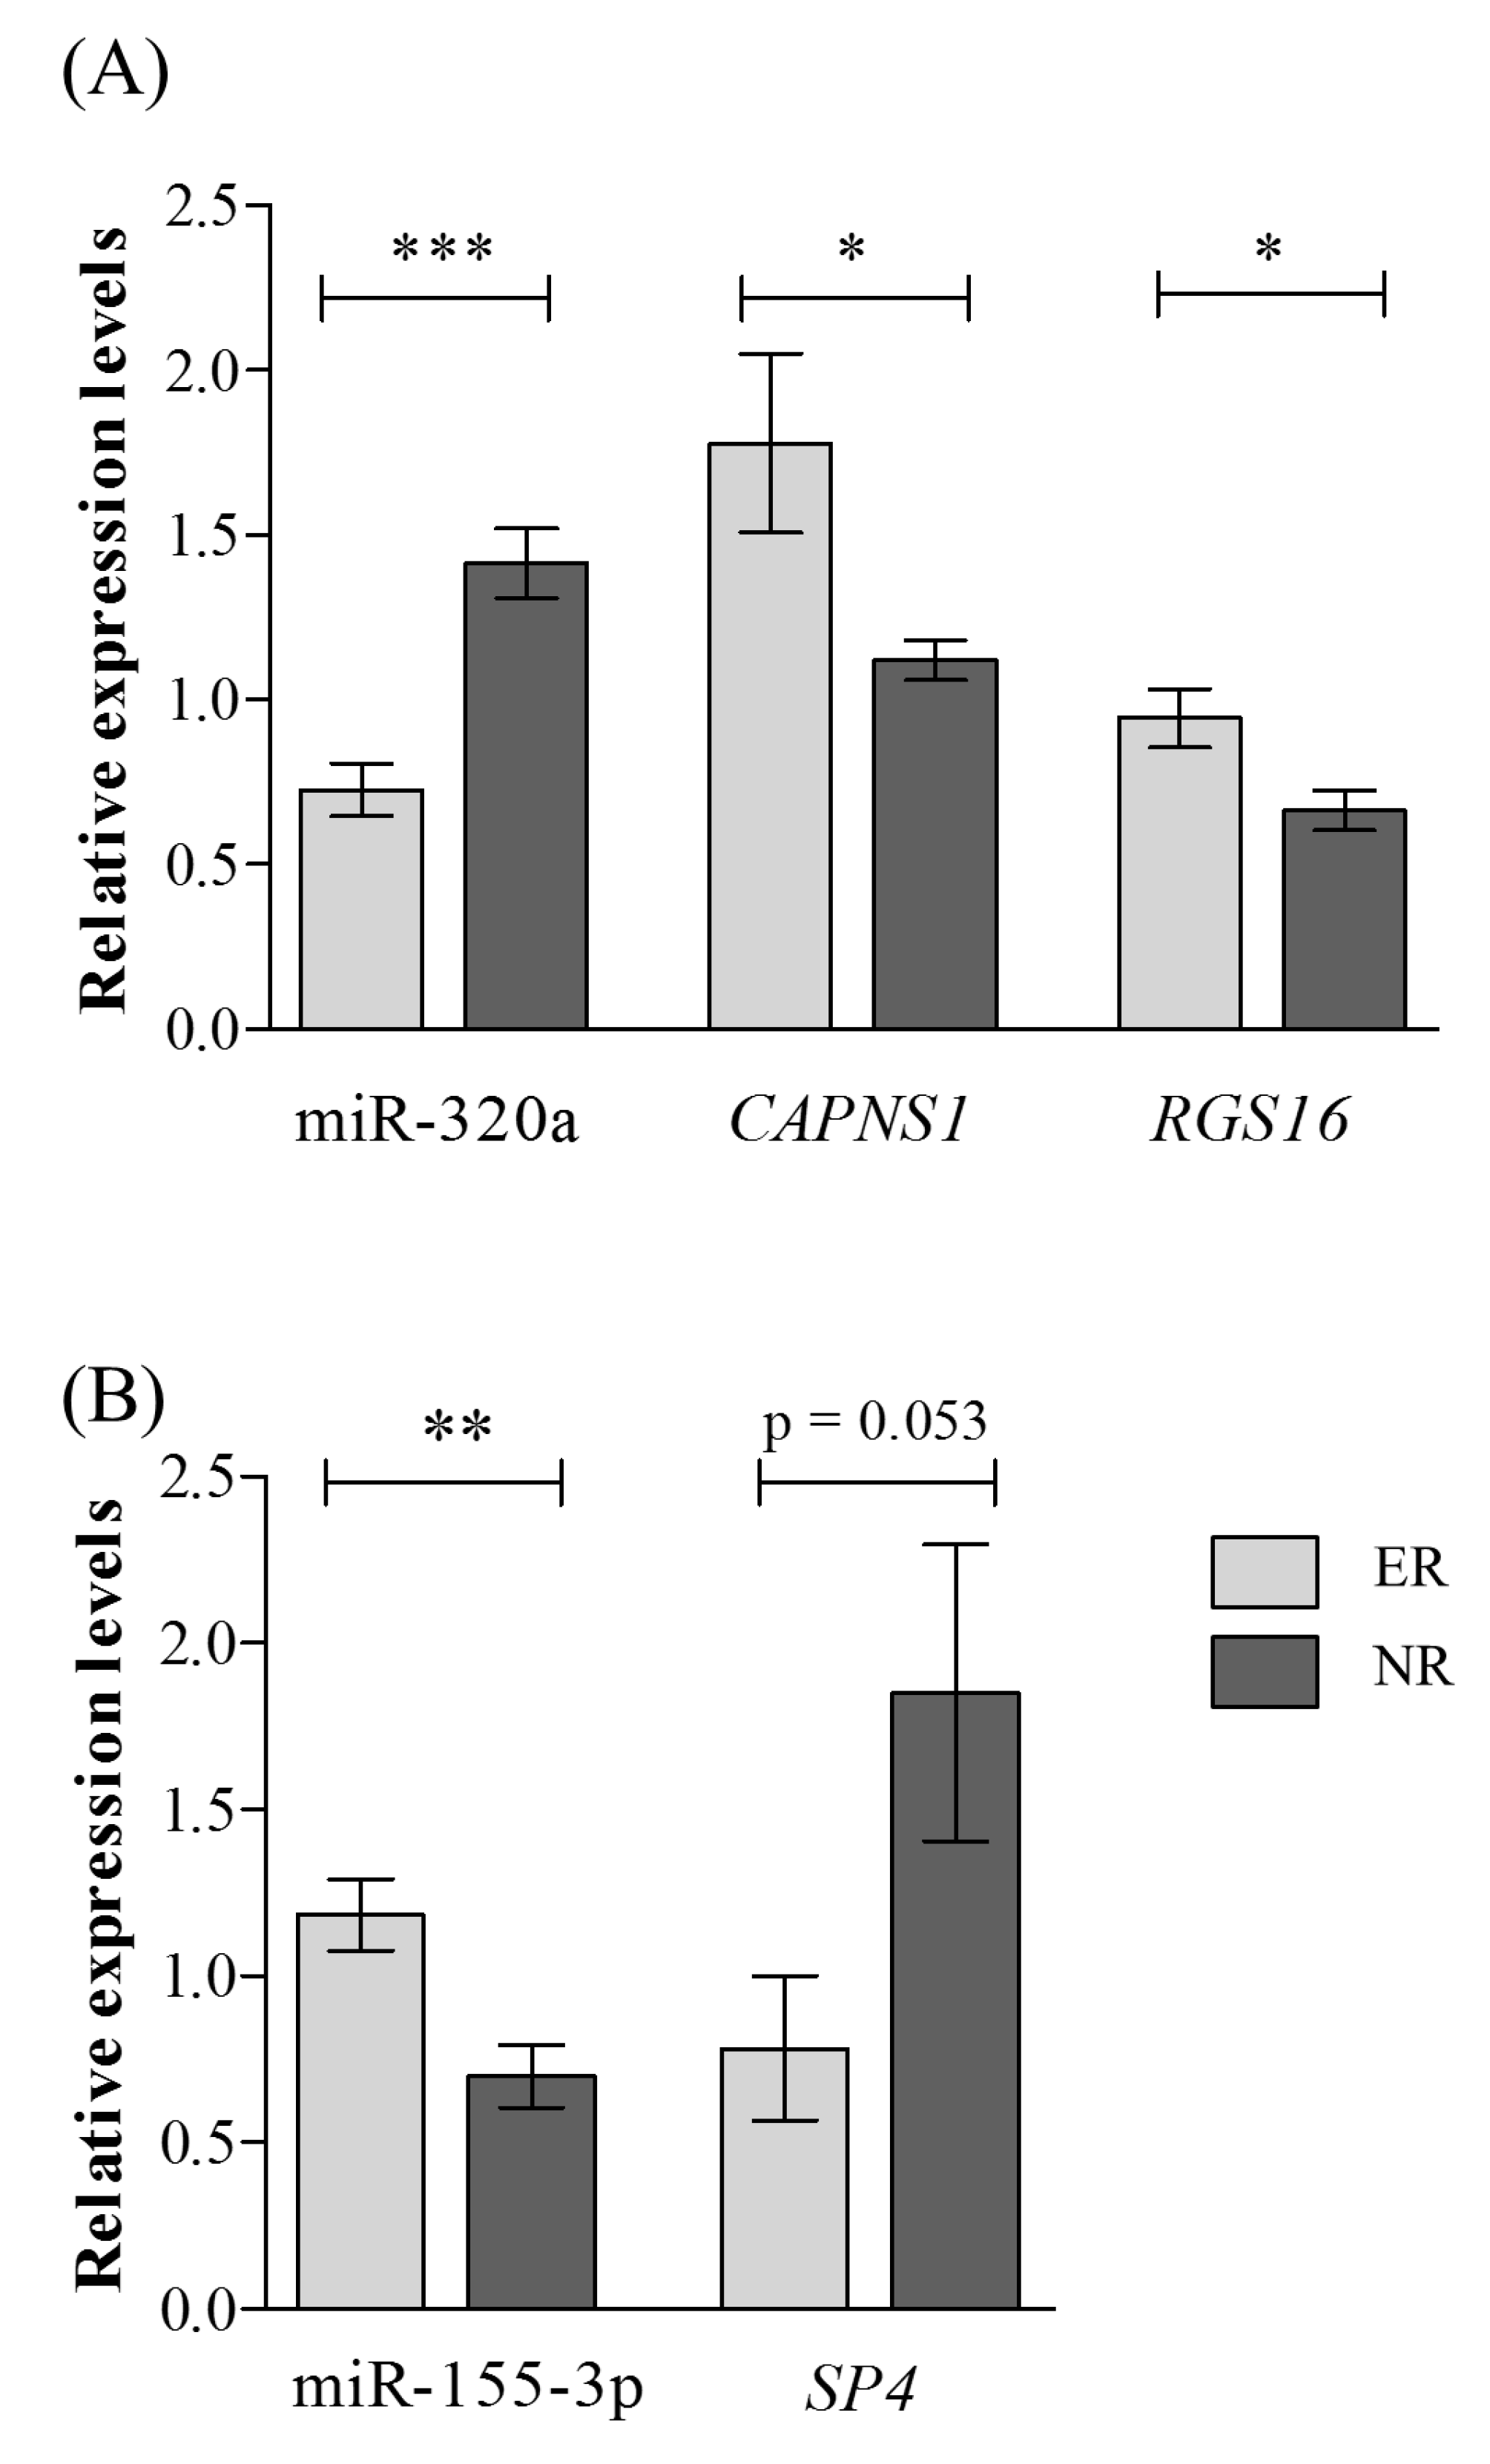
2.3. Validation of Selected miRNAs-mRNAs Pairs with qRT-PCR
3. Discussion
4. Materials and Methods
4.1. Sample
4.2. LCLs and In Vitro Lithium Treatment
4.3. Genome-Wide NGS Analysis of miRNAs
4.4. Genome-Wide Microarray Analysis of mRNAs
4.5. Validation with Quantitative Reverse Transcription-PCR (qRT-PCR)
4.6. Data Analysis
4.6.1. Genome-Wide Analysis NGS of miRNAs
4.6.2. Genome-Wide Analysis of mRNAs
4.6.3. Correlation between miRNA and mRNA Expression Levels
4.6.4. Validation with qRT-PCR
Supplementary Materials
Author Contributions
Funding
Conflicts of Interest
Abbreviations
| AUTS2 | Activator of Transcription and Developmental Regulator |
| BD | Bipolar disorder |
| cAMP | Cyclic AMP |
| CAPNS1 | Calpain Small Subunit 1 |
| BH | Benjamini–Hochberg |
| BHLHE40 | Basic Helix-Loop-Helix Family Member E40 |
| cDNA | Complementary DNA |
| ConLiGen | Consortium on Lithium Genetics |
| DE | Differentially expressed |
| CPM | Counts per million |
| dUTP | 2’-Deoxyuridine 5’-Triphosphate |
| ER | Excellent responders |
| FC | Fold change |
| FDR | False discovery rate |
| GAPDH | Glyceraldehyde-3-Phosphate Dehydrogenase |
| GWAS | Genome-wide association study |
| KYAT1 | Kynurenine Aminotransferase 1 |
| LCL | Lymphoblastoid cell lines |
| LiCl | Lithium chloride |
| MDD | Major depressive disorder |
| mRNA | Messenger RNA |
| miRNA | microRNA |
| NGS | Next generation sequencing |
| NR | Non-responders |
| NTC | No-template controls |
| qRT-PCR | Quantitative reverse transcription-PCR |
| RDC | Research Diagnostic Criteria |
| RHOA | Ras Homolog Family Member A |
| RNU6B | RNA, U6 Small Nuclear 6, Pseudogene |
| RGS16 | Regulator of G Protein Signaling 16 |
| SCZ | Schizophrenia |
| SNP | Single nucleotide polymorphisms |
| SP4 | Sp4 Transcription Factor |
| SADS-L | Schedule for Affective Disorder and Schizophrenia Lifetime Version |
| SD | Standard deviation |
| SP4 | Sp4 Transcription Factor |
| TS | Total score |
References
- Grande, I.; Berk, M.; Birmaher, B.; Vieta, E. Bipolar disorder. Lancet 2016, 387, 1561–1572. [Google Scholar] [CrossRef]
- Kleine-Budde, K.; Touil, E.; Moock, J.; Bramesfeld, A.; Kawohl, W.; Rossler, W. Cost of illness for bipolar disorder: A systematic review of the economic burden. Bipolar Disord. 2014, 16, 337–353. [Google Scholar] [CrossRef] [PubMed]
- Alda, M. Lithium in the treatment of bipolar disorder: Pharmacology and pharmacogenetics. Mol. Psychiatry 2015, 20, 661–670. [Google Scholar] [CrossRef]
- Sani, G.; Perugi, G.; Tondo, L. Treatment of Bipolar Disorder in a Lifetime Perspective: Is Lithium Still the Best Choice? Clin. Drug Investig. 2017, 37, 713–727. [Google Scholar] [CrossRef]
- Baldessarini, R.J.; Tondo, L. Does lithium treatment still work? Evidence of stable responses over three decades. Arch. Gen. Psychiatry 2000, 57, 187–190. [Google Scholar] [CrossRef]
- Garnham, J.; Munro, A.; Slaney, C.; Macdougall, M.; Passmore, M.; Duffy, A.; O’Donovan, C.; Teehan, A.; Alda, M. Prophylactic treatment response in bipolar disorder: Results of a naturalistic observation study. J. Affect. Disord. 2007, 104, 185–190. [Google Scholar] [CrossRef]
- Fornaro, M.; Stubbs, B.; De Berardis, D.; Iasevoli, F.; Solmi, M.; Veronese, N.; Carano, A.; Perna, G.; De Bartolomeis, A. Does the “Silver Bullet“ Lose its Shine Over the Time? Assessment of Loss of Lithium Response in a Preliminary Sample of Bipolar Disorder Outpatients. Clin. Pract. Epidemiol. Ment. Health 2016, 12, 142–157. [Google Scholar] [CrossRef]
- Fornaro, M.; Anastasia, A.; Monaco, F.; Novello, S.; Fusco, A.; Iasevoli, F.; De Berardis, D.; Veronese, n.; Solmi, M.; de Bartolomeis, A. Clinical and psychopathological features associated with treatment-emergent mania in bipolar-II depressed outpatients exposed to antidepressants. J. Affect. Disord. 2018, 234, 131–138. [Google Scholar] [CrossRef]
- Bowden, C.L. Clinical correlates of therapeutic response in bipolar disorder. J. Affect. Disord. 2001, 67, 257–265. [Google Scholar] [CrossRef]
- Calabrese, J.R.; Fatemi, S.H.; Kujawa, M.; Woyshville, M.J. Predictors of response to mood stabilizers. J. Clin. Psychopharmacol. 1996, 16, 24S–31S. [Google Scholar] [CrossRef]
- Fornaro, M.; De Berardis, D.; Anastasia, A.; Novello, S.; Fusco, A.; Cattaneo, C.I.; Solmi, M.; Monaco, F.; Veronese, n.; Kim, Y.K.; et al. The identification of biomarkers predicting acute and maintenance lithium treatment response in bipolar disorder: A plea for further research attention. Psychiatry Res. 2018, 269, 658–672. [Google Scholar] [CrossRef] [PubMed]
- Grof, P.; Alda, M.; Grof, E.; Fox, D.; Cameron, P. The challenge of predicting response to stabilising lithium treatment. The importance of patient selection. Br. J. Psychiatry Suppl. 1993, 21, 16–19. [Google Scholar] [CrossRef]
- Kleindienst, n.; Engel, R.; Greil, W. Which clinical factors predict response to prophylactic lithium? A systematic review for bipolar disorders. Bipolar Disord. 2005, 7, 404–417. [Google Scholar] [CrossRef] [PubMed]
- Budde, M.; Degner, D.; Brockmoller, J.; Schulze, T.G. Pharmacogenomic aspects of bipolar disorder: An update. Eur. Neuropsychopharmacol. 2017, 27, 599–609. [Google Scholar] [CrossRef] [PubMed]
- Pisanu, C.; Heilbronner, U.; Squassina, A. The Role of Pharmacogenomics in Bipolar Disorder: Moving Towards Precision Medicine. Mol. Diagn. 2018, 22, 409–420. [Google Scholar] [CrossRef] [PubMed]
- Hou, L.; Heilbronner, U.; Degenhardt, F.; Adli, M.; Akiyama, K.; Akula, n.; Ardau, R.; Arias, B.; Backlund, L.; Banzato, C.E.M.; et al. Genetic variants associated with response to lithium treatment in bipolar disorder: A genome-wide association study. Lancet 2016, 387, 1085–1093. [Google Scholar] [CrossRef]
- Pisanu, C.; Papadima, E.M.; Del Zompo, M.; Squassina, A. Understanding the molecular mechanisms underlying mood stabilizer treatments in bipolar disorder: Potential involvement of epigenetics. Neurosci. Lett. 2018, 669, 24–31. [Google Scholar] [CrossRef]
- Gebert, L.F.R.; MacRae, I.J. Regulation of microRNA function in animals. Nat. Rev. Mol. Cell Biol. 2019, 20, 21–37. [Google Scholar] [CrossRef]
- Chen, H.; Wang, N.; Burmeister, M.; McInnis, M.G. MicroRNA expression changes in lymphoblastoid cell lines in response to lithium treatment. Int. J. Neuropsychopharmacol. 2009, 12, 975–981. [Google Scholar] [CrossRef]
- Wang, Z.; Zhang, C.; Huang, J.; Yuan, C.; Hong, W.; Chen, J.; Yu, S.; Xu, L.; Gao, K.; Fang, Y. MiRNA-206 and BDNF genes interacted in bipolar I disorder. J. Affect. Disord. 2014, 162, 116–119. [Google Scholar] [CrossRef]
- Hunsberger, J.G.; Chibane, F.L.; Elkahloun, A.G.; Henderson, R.; Singh, R.; Lawson, J.; Cruceanu, C.; Nagarajan, V.; Turecki, G.; Squassina, A.; et al. Novel integrative genomic tool for interrogating lithium response in bipolar disorder. Transl. Psychiatry 2015, 5, e504. [Google Scholar] [CrossRef] [PubMed]
- Reinbold, C.S.; Forstner, A.J.; Hecker, J.; Fullerton, J.M.; Hoffmann, P.; Hou, L.; Heilbronner, U.; Degenhardt, F.; Adli, M.; Akiyama, K.; et al. Analysis of the Influence of microRNAs in Lithium Response in Bipolar Disorder. Front. Psychiatry 2018, 9, 207. [Google Scholar] [CrossRef] [PubMed]
- Squassina, A.; Costa, M.; Congiu, D.; Manchia, M.; Angius, A.; Deiana, V.; Ardau, R.; Chillotti, C.; Severino, G.; Calza, S.; et al. Insulin-like growth factor 1 (IGF-1) expression is up-regulated in lymphoblastoid cell lines of lithium responsive bipolar disorder patients. Pharm. Res. 2013, 73, 1–7. [Google Scholar] [CrossRef]
- Camkurt, M.A.; Acar, S.; Coskun, S.; Gunes, M.; Gunes, S.; Yilmaz, M.F.; Gorur, A.; Tamer, L. Comparison of plasma MicroRNA levels in drug naive, first episode depressed patients and healthy controls. J. Psychiatr. Res. 2015, 69, 67–71. [Google Scholar] [CrossRef]
- Wang, Y.; Wang, J.; Guo, T.; Peng, Y.; Wang, K.; Bai, K.; Huang, Y. Screening of schizophrenia associated miRNAs and the regulation of miR-320a-3p on integrin beta1. Medicine 2019, 98, e14332. [Google Scholar] [CrossRef]
- Mundalil Vasu, M.; Anitha, A.; Takahashi, T.; Thanseem, I.; Iwata, K.; Asakawa, T.; Suzuki, K. Fluoxetine Increases the Expression of miR-572 and miR-663a in Human Neuroblastoma Cell Lines. PLoS ONE 2016, 11, e0164425. [Google Scholar] [CrossRef]
- Liu, X.; Zhang, L.; Cheng, K.; Wang, X.; Ren, G.; Xie, P. Identification of suitable plasma-based reference genes for miRNAome analysis of major depressive disorder. J. Affect. Disord. 2014, 163, 133–139. [Google Scholar] [CrossRef]
- Amini, M.; Ma, C.L.; Farazifard, R.; Zhu, G.; Zhang, Y.; Vanderluit, J.; Zoltewicz, J.S.; Hage, F.; Savitt, J.M.; Lagace, D.C.; et al. Conditional disruption of calpain in the CNS alters dendrite morphology, impairs LTP, and promotes neuronal survival following injury. J. Neurosci. 2013, 33, 5773–5784. [Google Scholar] [CrossRef]
- Baudry, M.; Bi, X. Calpain-1 and Calpain-2: The Yin and Yang of Synaptic Plasticity and Neurodegeneration. Trends Neurosci. 2016, 39, 235–245. [Google Scholar] [CrossRef]
- Glatt, S.J.; Everall, I.P.; Kremen, W.S.; Corbeil, J.; Sasik, R.; Khanlou, N.; Han, M.; Liew, C.C.; Tsuang, M.T. Comparative gene expression analysis of blood and brain provides concurrent validation of SELENBP1 up-regulation in schizophrenia. Proc. Natl. Acad. Sci. USA 2005, 102, 15533–15538. [Google Scholar] [CrossRef]
- Lee, S.A.; Huang, K.C. Epigenetic profiling of human brain differential DNA methylation networks in schizophrenia. BMC Med. Genom. 2016, 9, 68. [Google Scholar] [CrossRef] [PubMed] [Green Version]
- Goto, K.; Doi, M.; Wang, T.; Kunisue, S.; Murai, I.; Okamura, H. G-protein-coupled receptor signaling through Gpr176, Gz, and RGS16 tunes time in the center of the circadian clock [Review]. Endocr. J. 2017, 64, 571–579. [Google Scholar] [CrossRef] [PubMed] [Green Version]
- Takaesu, Y. Circadian rhythm in bipolar disorder: A review of the literature. Psychiatry Clin. Neurosci. 2018, 72, 673–682. [Google Scholar] [CrossRef] [Green Version]
- McCarthy, M.J.; Wei, H.; Nievergelt, C.M.; Stautland, A.; Maihofer, A.X.; Welsh, D.K.; Shilling, P.; Alda, M.; Alliey-Rodriguez, n.; Anand, A.; et al. Chronotype and cellular circadian rhythms predict the clinical response to lithium maintenance treatment in patients with bipolar disorder. Neuropsychopharmacology 2019, 44, 620–628. [Google Scholar] [CrossRef] [PubMed]
- Costa, M.; Squassina, A.; Piras, I.S.; Pisanu, C.; Congiu, D.; Niola, P.; Angius, A.; Chillotti, C.; Ardau, R.; Severino, G.; et al. Preliminary Transcriptome Analysis in Lymphoblasts from Cluster Headache and Bipolar Disorder Patients Implicates Dysregulation of Circadian and Serotonergic Genes. J. Mol. Neurosci. 2015, 56, 688–695. [Google Scholar] [CrossRef] [PubMed]
- Geoffroy, P.A.; Curis, E.; Courtin, C.; Moreira, J.; Morvillers, T.; Etain, B.; Laplanche, J.L.; Bellivier, F.; Marie-Claire, C. Lithium response in bipolar disorders and core clock genes expression. World J. Biol. Psychiatry 2018, 19, 619–632. [Google Scholar] [CrossRef]
- Higgins, G.A.; Allyn-Feuer, A.; Barbour, E.; Athey, B.D. A glutamatergic network mediates lithium response in bipolar disorder as defined by epigenome pathway analysis. Pharmacogenomics 2015, 16, 1547–1563. [Google Scholar] [CrossRef]
- Oliveira, T.; Marinho, V.; Carvalho, V.; Magalhaes, F.; Rocha, K.; Ayres, C.; Teixeira, S.; Nunes, M.; Bastos, V.H.; Pinto, G.R. Genetic polymorphisms associated with circadian rhythm dysregulation provide new perspectives on bipolar disorder. Bipolar Disord. 2018, 20, 515–522. [Google Scholar] [CrossRef]
- Papadima, E.M.; Niola, P.; Melis, C.; Pisanu, C.; Congiu, D.; Cruceanu, C.; Lopez, J.P.; Turecki, G.; Ardau, R.; Severino, G.; et al. Evidence towards RNA Binding Motif (RNP1, RRM) Protein 3 (RBM3) as a Potential Biomarker of Lithium Response in Bipolar Disorder Patients. J. Mol. Neurosci. 2017, 62, 304–308. [Google Scholar] [CrossRef]
- Pisanu, C.; Congiu, D.; Melis, C.; Severino, G.; Angius, A.; Ardau, R.; Chillotti, C.; Del Zompo, M.; Squassina, A. Involvement of core clock genes in lithium response. World J. Biol. Psychiatry 2018, 19, 645–646. [Google Scholar] [CrossRef]
- Severino, G.; Manchia, M.; Contu, P.; Squassina, A.; Lampus, S.; Ardau, R.; Chillotti, C.; Del Zompo, M. Association study in a Sardinian sample between bipolar disorder and the nuclear receptor REV-ERBalpha gene, a critical component of the circadian clock system. Bipolar Disord. 2009, 11, 215–220. [Google Scholar] [CrossRef] [PubMed]
- Marques-Rocha, J.L.; Garcia-Lacarte, M.; Samblas, M.; Bressan, J.; Martinez, J.A.; Milagro, F.I. Regulatory roles of miR-155 and let-7b on the expression of inflammation-related genes in THP-1 cells: Effects of fatty acids. J. Physiol. Biochem. 2018, 74, 579–589. [Google Scholar] [CrossRef] [PubMed]
- Ceppi, M.; Pereira, P.M.; Dunand-Sauthier, I.; Barras, E.; Reith, W.; Santos, M.A.; Pierre, P. MicroRNA-155 modulates the interleukin-1 signaling pathway in activated human monocyte-derived dendritic cells. Proc. Natl. Acad. Sci. USA 2009, 106, 2735–2740. [Google Scholar] [CrossRef] [Green Version]
- Pinacho, R.; Saia, G.; Meana, J.J.; Gill, G.; Ramos, B. Transcription factor SP4 phosphorylation is altered in the postmortem cerebellum of bipolar disorder and schizophrenia subjects. Eur. Neuropsychopharmacol. 2015, 25, 1650–1660. [Google Scholar] [CrossRef] [Green Version]
- Pinacho, R.; Saia, G.; Fuste, M.; Melendez-Perez, I.; Villalta-Gil, V.; Haro, J.M.; Gill, G.; Ramos, B. Phosphorylation of transcription factor specificity protein 4 is increased in peripheral blood mononuclear cells of first-episode psychosis. PLoS ONE 2015, 10, e0125115. [Google Scholar] [CrossRef] [Green Version]
- Viswanath, B.; Jose, S.P.; Squassina, A.; Thirthalli, J.; Purushottam, M.; Mukherjee, O.; Vladimirov, V.; Patrinos, G.P.; Del Zompo, M.; Jain, S. Cellular models to study bipolar disorder: A systematic review. J. Affect. Disord. 2015, 184, 36–50. [Google Scholar] [CrossRef]
- Spitzer, R.L.; Endicott, J.; Robins, E. Research diagnostic criteria: Rationale and reliability. Arch. Gen. Psychiatry 1978, 35, 773–782. [Google Scholar] [CrossRef]
- Endicott, J.; Spitzer, R.L. A diagnostic interview: The schedule for affective disorders and schizophrenia. Arch. Gen. Psychiatry 1978, 35, 837–844. [Google Scholar] [CrossRef]
- Grof, P.; Duffy, A.; Cavazzoni, P.; Grof, E.; Garnham, J.; MacDougall, M.; O’Donovan, C.; Alda, M. Is response to prophylactic lithium a familial trait? J. Clin. Psychiatry 2002, 63, 942–947. [Google Scholar] [CrossRef]
- Manchia, M.; Adli, M.; Akula, N.; Ardau, R.; Aubry, J.M.; Backlund, L.; Banzato, C.E.; Baune, B.T.; Bellivier, F.; Bengesser, S.; et al. Assessment of Response to Lithium Maintenance Treatment in Bipolar Disorder: A Consortium on Lithium Genetics (ConLiGen) Report. PLoS ONE 2013, 8, e65636. [Google Scholar] [CrossRef] [Green Version]
- Neitzel, H. A routine method for the establishment of permanent growing lymphoblastoid cell lines. Hum. Genet. 1986, 73, 320–326. [Google Scholar] [CrossRef] [PubMed]
- Martin, M. Cutadapt removes adapter sequences from high-throughput sequencing reads. EMBnet J. 2011, 17, 10–12. [Google Scholar] [CrossRef]
- Langmead, B.; Trapnell, C.; Pop, M.; Salzberg, S.L. Ultrafast and memory-efficient alignment of short DNA sequences to the human genome. Genome Biol. 2009, 10, R25. [Google Scholar] [CrossRef] [PubMed] [Green Version]
- Robinson, M.D.; McCarthy, D.J.; Smyth, G.K. edgeR: A Bioconductor package for differential expression analysis of digital gene expression data. Bioinformatics 2010, 26, 139–140. [Google Scholar] [CrossRef] [PubMed] [Green Version]
- R Core-Team. R: A Language and Environment for Statistical Computing; R Foundation for Statistical Computing: Vienna, Austria, 2018. [Google Scholar]
- Smyth, G.K. Linear models and empirical bayes methods for assessing differential expression in microarray experiments. Stat. Appl. Genet. Mol. Biol. 2004, 3. [Google Scholar] [CrossRef] [PubMed]
- Vila-Casadesus, M.; Gironella, M.; Lozano, J.J. MiRComb: An R Package to Analyse miRNA-mRNA Interactions. Examples across Five Digestive Cancers. PLoS ONE 2016, 11, e0151127. [Google Scholar] [CrossRef]
- Dweep, H.; Sticht, C.; Pandey, P.; Gretz, N. miRWalk--database: Prediction of possible miRNA binding sites by "walking" the genes of three genomes. J. Biomed. Inf. 2011, 44, 839–847. [Google Scholar] [CrossRef] [Green Version]
- Shannon, P.; Markiel, A.; Ozier, O.; Baliga, N.S.; Wang, J.T.; Ramage, D.; Amin, N.; Schwikowski, B.; Ideker, T. Cytoscape: A software environment for integrated models of biomolecular interaction networks. Genome Res. 2003, 13, 2498–2504. [Google Scholar] [CrossRef]


| miRNA | FC | p | FDR q |
|---|---|---|---|
| hsa-miR-320a | 0.55 | 3.2 × 10⁻¹⁰ | 3.8 × 10⁻⁸ |
| hsa-miR-125a-5p | 0.16 | 6.6 × 10⁻⁸ | 3.9 × 10⁻⁶ |
| hsa-miR-148a-3p | 2.23 | 1.2 × 10⁻⁷ | 4.9 × 10⁻⁶ |
| hsa-miR-574-3p | 0.32 | 5.4 × 10⁻⁷ | 1.6 × 10⁻⁵ |
| hsa-miR-1273h-3p | 0.49 | 3.5 × 10⁻⁵ | 0.0008 |
| hsa-miR-22-3p | 1.79 | 7.2 × 10⁻⁵ | 0.0014 |
| hsa-miR-9-5p | 0.57 | 0.0001 | 0.0019 |
| hsa-miR-26b-5p | 1.78 | 0.0001 | 0.0019 |
| hsa-miR-378a-5p | 0.43 | 0.0002 | 0.0030 |
| hsa-miR-223-3p | 4.13 | 0.0003 | 0.0030 |
| hsa-miR-155-3p | 2.27 | 0.0003 | 0.0031 |
| hsa-miR-505-3p | 0.50 | 0.0005 | 0.0043 |
| hsa-miR-744-5p | 1.59 | 0.0005 | 0.0043 |
| hsa-let-7e-5p | 0.32 | 0.0005 | 0.0043 |
| hsa-miR-138-5p | 0.32 | 0.0006 | 0.0044 |
| hsa-miR-181a-3p | 2.61 | 0.0006 | 0.0044 |
| hsa-miR-15a-5p | 1.62 | 0.0006 | 0.0044 |
| hsa-miR-941 | 0.54 | 0.0007 | 0.0045 |
| hsa-miR-148b-3p | 2.32 | 0.0007 | 0.0045 |
| hsa-miR-652-3p | 0.46 | 0.0008 | 0.0049 |
| hsa-miR-130b-3p | 0.69 | 0.0009 | 0.0050 |
| hsa-miR-15b-3p | 1.81 | 0.0013 | 0.0068 |
| hsa-miR-345-5p | 0.56 | 0.0014 | 0.0070 |
| hsa-miR-454-5p | 2.14 | 0.0019 | 0.0096 |
| hsa-miR-4677-3p | 2.51 | 0.0021 | 0.0102 |
| hsa-miR-374a-3p | 1.74 | 0.0024 | 0.0111 |
| hsa-miR-19b-3p | 1.59 | 0.0029 | 0.0125 |
| hsa-let-7d-3p | 0.71 | 0.0030 | 0.0125 |
| hsa-miR-181d-5p | 0.55 | 0.0034 | 0.0136 |
| hsa-miR-101-3p | 1.76 | 0.0035 | 0.0136 |
| hsa-miR-629-5p | 0.46 | 0.0036 | 0.0136 |
| hsa-miR-574-5p | 0.49 | 0.0039 | 0.0144 |
| hsa-miR-378a-3p | 0.68 | 0.0042 | 0.0150 |
| hsa-miR-148a-5p | 1.61 | 0.0044 | 0.0152 |
| hsa-miR-142-3p | 1.47 | 0.0045 | 0.0152 |
| hsa-miR-454-3p | 1.45 | 0.0050 | 0.0163 |
| hsa-miR-142-5p | 1.58 | 0.0051 | 0.0163 |
| hsa-miR-598-3p | 0.51 | 0.0052 | 0.0163 |
| hsa-let-7f-5p | 1.33 | 0.0054 | 0.0163 |
| hsa-miR-27a-5p | 1.66 | 0.0084 | 0.0241 |
| hsa-let-7a-5p | 1.29 | 0.0085 | 0.0241 |
| hsa-miR-210-5p | 1.41 | 0.0087 | 0.0241 |
| hsa-miR-30e-3p | 1.43 | 0.0087 | 0.0241 |
| hsa-miR-146a-5p | 1.95 | 0.0117 | 0.0315 |
| hsa-miR-23a-3p | 0.73 | 0.0131 | 0.0346 |
| hsa-miR-15b-5p | 1.39 | 0.0149 | 0.0385 |
| hsa-miR-425-5p | 0.73 | 0.0171 | 0.0430 |
| hsa-miR-197-3p | 0.71 | 0.0182 | 0.0450 |
| hsa-miR-335-3p | 3.38 | 0.0204 | 0.0489 |
| hsa-miR-421 | 1.34 | 0.0208 | 0.0489 |
| hsa-miR-26a-5p | 1.34 | 0.0210 | 0.0489 |
| hsa-miR-194-5p | 0.60 | 0.0215 | 0.0490 |
| NGS/Microarray | qRT-PCR | ||||
|---|---|---|---|---|---|
| FC | p | FDR q | FC | p | |
| miRNA | |||||
| hsa-miR-320a | 0.55 | 3.2 × 10⁻¹⁰ | 3.8 × 10⁻⁸ | 0.51 | 3.2 × 10⁻⁵ |
| hsa-miR-155-3p | 2.27 | 0.0003 | 0.0031 | 1.70 | 0.003 |
| hsa-mir-138 | 0.32 | 0.0006 | 0.0044 | 0.63 | 0.180 |
| mRNA | |||||
| CAPNS1 | 1.21 | 9.2 × 10⁻⁵ | 0.0021 | 1.59 | 0.040 |
| RGS16 | 1.52 | 1.3 × 10⁻⁵ | 0.0006 | 1.42 | 0.017 |
| BHLHE40 | 1.37 | 2.4 × 10⁻⁶ | 0.0002 | 1.05 | 0.167 |
| RHOA | 1.11 | 3.1 × 10⁻⁵ | 0.0010 | 1.60 | 0.556 |
| SP4 | 0.68 | 2.9 × 10⁻⁵ | 0.0001 | 0.43 | 0.053 |
| KYAT1 | 0.75 | 1.5 × 10⁻⁸ | 7.2 × 10⁻⁶ | 0.43 | 0.065 |
| AUTS2 | 0.43 | 8.5 × 10⁻⁵ | 0.0020 | 1.71 | 0.250 |
© 2019 by the authors. Licensee MDPI, Basel, Switzerland. This article is an open access article distributed under the terms and conditions of the Creative Commons Attribution (CC BY) license (http://creativecommons.org/licenses/by/4.0/).
Share and Cite
Pisanu, C.; Merkouri Papadima, E.; Melis, C.; Congiu, D.; Loizedda, A.; Orrù, N.; Calza, S.; Orrù, S.; Carcassi, C.; Severino, G.; et al. Whole Genome Expression Analyses of miRNAs and mRNAs Suggest the Involvement of miR-320a and miR-155-3p and their Targeted Genes in Lithium Response in Bipolar Disorder. Int. J. Mol. Sci. 2019, 20, 6040. https://0-doi-org.brum.beds.ac.uk/10.3390/ijms20236040
Pisanu C, Merkouri Papadima E, Melis C, Congiu D, Loizedda A, Orrù N, Calza S, Orrù S, Carcassi C, Severino G, et al. Whole Genome Expression Analyses of miRNAs and mRNAs Suggest the Involvement of miR-320a and miR-155-3p and their Targeted Genes in Lithium Response in Bipolar Disorder. International Journal of Molecular Sciences. 2019; 20(23):6040. https://0-doi-org.brum.beds.ac.uk/10.3390/ijms20236040
Chicago/Turabian StylePisanu, Claudia, Eleni Merkouri Papadima, Carla Melis, Donatella Congiu, Annalisa Loizedda, Nicola Orrù, Stefano Calza, Sandro Orrù, Carlo Carcassi, Giovanni Severino, and et al. 2019. "Whole Genome Expression Analyses of miRNAs and mRNAs Suggest the Involvement of miR-320a and miR-155-3p and their Targeted Genes in Lithium Response in Bipolar Disorder" International Journal of Molecular Sciences 20, no. 23: 6040. https://0-doi-org.brum.beds.ac.uk/10.3390/ijms20236040