Oxidative Damage of DNA as Early Marker of Alzheimer’s Disease

 ,
,
Abstract
:
1. Introduction
2. Results
2.1. Demographic and Clinical Variables
2.2. Determination of Oxidation Biomarkers in the Urine Samples
3. Discussion
4. Material and Methods
4.1. Study Design and Participants
4.2. Materials and Reagents
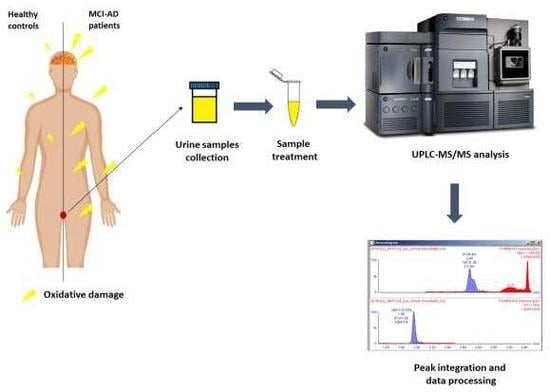
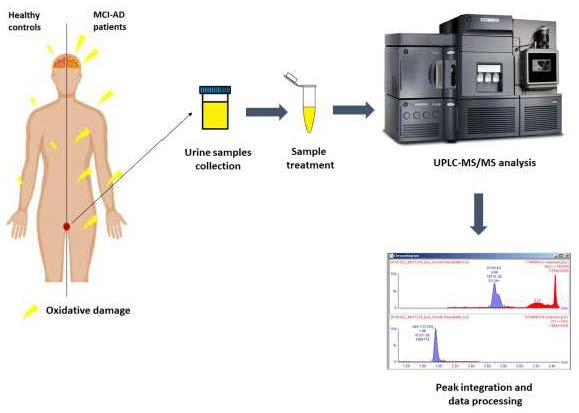
4.3. Sample Collection and Treatment
4.4. Stock, Working, and Standard Solutions
4.5. UPLC-MS/MS Analysis
4.6. Statistical Analysis
Author Contributions
Funding
Acknowledgments
Conflicts of Interest
Abbreviations
| AD | Alzheimer’s Disease |
| CSF | Cerebrospinal fluid |
| DOR | Diagnostic odds ratio |
| ELISA | Enzyme-linked immunosorbent assay |
| IQR | Interquartile range |
| LR− | Negative likelihood ratio |
| LR+ | Positive likelihood ratio |
| MCI | Mild cognitive impairment |
| MS | Mass spectrometry |
| NFT | Neurofibrillary tangles |
| NPV | Negative predictive value |
| HPLC | High-performance liquid chromatography |
| EC | Electrochemical detection |
| DNPH | 2,4-dinitrophenylhydrazide |
| SD | Standard deviation |
| PLS | Partial least squares |
| PPV | Positive predictive value |
References
- Bermejo, P.; Martín-Aragón, S.; Benedí, J.; Susín, C.; Felici, E.; Gil, P.; Ribera, J.M.; Villar, A.M. Differences of peripheral inflammatory markers between mild cognitive impairment and Alzheimer’s disease. Immunol. Lett. 2008, 117, 198–202. [Google Scholar] [CrossRef] [PubMed]
- Butterfield, D.A.; Reed, T.; Newman, S.F.; Sultana, R. Roles of amyloid beta-peptide-associated oxidative stress and brain protein modifications in the pathogenesis of Alzheimer’s disease and mild cognitive impairment. Free Radic. Biol. Med. 2007, 43, 658–677. [Google Scholar] [CrossRef] [PubMed] [Green Version]
- Chauhan, V.; Chauhan, A. Oxidative stress in Alzheimer’s disease. Pathophysiology 2006, 13, 195–208. [Google Scholar] [CrossRef] [PubMed]
- Dalle-Donne, I.; Rossi, R.; Colombo, R.; Giustarini, D.; Milzani, A. Biomarkers of oxidative damage in human disease. Clin. Chem. 2006, 52, 601–623. [Google Scholar] [CrossRef] [PubMed]
- Ahmad, W.; Ijaz, B.; Shabbiri, K.; Ahmed, F.; Rehman, S. Oxidative toxicity in diabetes and Alzheimer’s disease: Mechanisms behind ROS/ RNS generation. J. Biomed. Sci. 2017, 24, 76. [Google Scholar] [CrossRef] [PubMed]
- Calabrese, V.; Sultana, R.; Scapagnini, G.; Guagliano, E.; Sapienza, M.; Bella, R.; Kanski, J.; Pennisi, G.; Mancuso, C.; Stella, A.M.; et al. Nitrosative stress, cellular stress response, and thiol homeostasis in patients with Alzheimer’s disease. Antioxid. Redox Signal. 2006, 8, 1975–1986. [Google Scholar] [CrossRef] [Green Version]
- Zafrilla, P.; Mulero, J.; Xandri, J.M.; Santo, E.; Caravaca, G.; Morillas, J.M. Oxidative stress in Alzheimer patients in different stages of the disease. Curr. Med. Chem. 2006, 13, 1075–1083. [Google Scholar] [CrossRef]
- Butterfield, D.A.; Lauderback, C.M. Lipid peroxidation and protein oxidation in Alzheimer’s disease brain: Potential causes and consequences involving amyloid beta-peptide-associated free radical oxidative stress. Free Radic. Biol. Med. 2002, 32, 1050–1060. [Google Scholar] [CrossRef]
- Cristalli, D.O.; Arnal, N.; Marra, F.A.; de Alaniz, M.J.; Marra, C.A. Peripheral markers in neurodegenerative patients and their first-degree relatives. J. Neurol. Sci. 2012, 314, 48–56. [Google Scholar] [CrossRef]
- Korolainen, M.A.; Pirttilä, T. Cerebrospinal fluid, serum and plasma protein oxidation in Alzheimer’s disease. Acta Neurol. Scand. 2009, 119, 32–38. [Google Scholar] [CrossRef]
- Franco, M.C.; Estévez, A.G. Tyrosine nitration as mediator of cell death. Cell Mol. Life Sci. 2014, 71, 3939–3950. [Google Scholar] [CrossRef] [PubMed]
- Torres-Cuevas, I.; Kuligowski, J.; Cárcel, M.; Cháfer-Pericás, C.; Asensi, M.; Solberg, R.; Cubells, E.; Nuñez, A.; Saugstad, O.D.; Vento, M.; et al. Protein-bound tyrosine oxidation, nitration and chlorination by-products assessed by ultraperformance liquid chromatography coupled to tandem mass spectrometry. Anal. Chim. Acta 2016, 913, 104–110. [Google Scholar] [CrossRef] [PubMed]
- Kuligowski, J.; Torres-Cuevas, I.; Quintás, G.; Rook, D.; van Goudoever, J.B.; Cubells, E.; Asensi, M.; Lliso, I.; Nuñez, A.; Vento, M.; et al. Assessment of oxidative damage to proteins and DNA in urine of newborn infants by a validated UPLC-MS/MS approach. PLoS ONE 2014, 9, e93703. [Google Scholar]
- Bolner, A.; Pilleri, M.; De Riva, V.; Nordera, G.P. Plasma and urinary HPLC-ED determination of the ratio of 8-OHdG/2-dG in Parkinson’s disease. Clin. Lab. 2011, 57, 859–866. [Google Scholar] [PubMed]
- Ahmed, N.; Ahmed, U.; Thornalley, P.J.; Hager, K.; Fleischer, G.; Münch, G. Protein glycation, oxidation and nitration adduct residues and free adducts of cerebrospinal fluid in Alzheimer’s disease and link to cognitive impairment. J. Neurochem. 2005, 92, 255–263. [Google Scholar] [CrossRef]
- Tohgi, H.; Abe, T.; Yamazaki, K.; Murata, T.; Ishizaki, E.; Isobe, C. Alterations of 3-nitrotyrosine concentration in the cerebrospinal fluid during aging and in patients with Alzheimer’s disease. Neurosci. Lett. 1999, 269, 52–54. [Google Scholar] [CrossRef]
- Sultana, R.; Mecocci, P.; Mangialasche, F.; Cecchetti, R.; Baglioni, M.; Butterfield, D.A. Increased protein and lipid oxidative damage in mitochondria isolated from lymphocytes from patients with Alzheimer’s disease: Insights into the role of oxidative stress in Alzheimer’s disease and initial investigations into a potential biomarker for this dementing disorder. J. Alzheimers Dis. 2011, 24, 77–84. [Google Scholar]
- Migliore, L.; Fontana, I.; Trippi, F.; Colognato, R.; Coppedè, F.; Tognoni, G.; Nucciarone, B.; Siciliano, G. Oxidative DNA damage in peripheral leukocytes of mild cognitive impairment and AD patients. Neurobiol. Aging 2005, 26, 567–573. [Google Scholar] [CrossRef]
- Moslemnezhad, A.; Mahjoub, S.; Moghadasi, M. Altered plasma marker of oxidative DNA damage and total antioxidant capacity in patients with Alzheimer’s disease. Caspian J. Intern. Med. 2016, 7, 88–92. [Google Scholar]
- Randolph, C.; Tierney, M.C.; Mohr, E.; Chase, T.N. The Repeatable Battery for the Assessment of Neuropsychological Status (RBANS): Preliminary clinical validity. J. Clin. Exp. Neuropsychol. 1998, 20, 310–319. [Google Scholar] [CrossRef]
- Pfeffer, R.I.; Kurosaki, T.T.; Harrah, C.H., Jr.; Chance, J.M.; Filos, S. Measurement of functional activities in older adults in the community. J. Gerontol. 1982, 37, 323–329. [Google Scholar] [CrossRef] [PubMed]
- Hughes, C.P.; Berg, L.; Danziger, W.L.; Coben, L.A.; Martin, R.L. A new clinical scale for the staging of dementia. Br. J. Psychiatry 1982, 140, 566–572. [Google Scholar] [CrossRef] [PubMed]
- Anoop, A.; Singh, P.K.; Jacob, R.S.; Maji, S.K. CSF Biomarkers for Alzheimer’s Disease Diagnosis. Int. J. Alzheimers Dis. 2010, 2010, 606802. [Google Scholar] [CrossRef] [PubMed] [Green Version]
- Blennow, K.; Dubois, B.; Fagan, A.M.; Lewczuk, P.; de Leon, M.J.; Hampel, H. Clinical utility of cerebrospinal fluid biomarkers in the diagnosis of early Alzheimer’s disease. Alzheimers Dement. 2015, 11, 58–69. [Google Scholar] [CrossRef] [PubMed] [Green Version]
- Yao, F.; Zhang, K.; Zhang, Y.; Guo, Y.; Li, A.; Xiao, S.; Liu, Q.; Shen, L.; Ni, J. Identification of Blood Biomarkers for Alzheimer’s Disease Through Computational Prediction and Experimental Validation. Front. Neurol. 2019, 9, 1158. [Google Scholar] [CrossRef] [PubMed]
- Pluta, R.; Ułamek-Kozioł, M.; Januszewski, S.; Czuczwar, S.J. Platelets, lymphocytes and erythrocytes from Alzheimer’s disease patients: The quest for blood cell-based biomarkers. Folia Neuropathol. 2018, 56, 14–20. [Google Scholar] [CrossRef]
- Hartmann, S.; Ledur Kist, T.B. A review of biomarkers of Alzheimer’s disease in noninvasive samples. Biomark. Med. 2018, 12, 677–690. [Google Scholar] [CrossRef]
- Ryberg, H.; Söderling, A.S.; Davidsson, P.; Blennow, K.; Caidahl, K.; Persson, L.I. Cerebrospinal fluid levels of free 3-nitrotyrosine are not elevated in the majority of patients with amyotrophic lateral sclerosis or Alzheimer’s Disease. Neurochem. Int. 2004, 45, 57–62. [Google Scholar] [CrossRef]
- Khan, W.; Aguilar, C.; Kiddle, S.J.; Doyle, O.; Thambisetty, M.; Muehlboeck, S.; Sattlecker, M.; Newhouse, S.; Lovestone, S.; Dobson, R.; et al. A Subset of Cerebrospinal Fluid Proteins from a Multi-Analyte Panel Associated with Brain Atrophy, Disease Classification and Prediction in Alzheimer’s Disease. PLoS ONE 2015, 10, e0134368. [Google Scholar] [CrossRef] [Green Version]
- Hakobyan, S.; Harding, K.; Aiyaz, M.; Hye, A.; Dobson, R.; Baird, A.; Liu, B.; Harris, C.L.; Lovestone, S.; Morgan, B.P. Complement Biomarkers as Predictors of Disease Progression in Alzheimer’s Disease. J. Alzheimers Dis. 2016, 54, 707–716. [Google Scholar] [CrossRef] [Green Version]
- McKhann, G.M.; Knopman, D.S.; Chertkow, H.; Hyman, B.T.; Jack, C.R., Jr.; Kawas, C.H.; Klunk, W.E.; Koroshetz, W.J.; Manly, J.J.; Mayeux, R.; et al. The diagnosis of dementia due to Alzheimer’s disease: Recommendations from the National Institute on Aging-Alzheimer’s Association workgroups on diagnostic guidelines for Alzheimer’s disease. Alzheimers Dement. 2011, 7, 263–269. [Google Scholar] [CrossRef] [PubMed] [Green Version]
- Albert, M.S.; DeKosky, S.T.; Dickson, D.; Dubois, B.; Feldman, H.H.; Fox, N.C.; Gamst, A.; Holtzman, D.M.; Jagust, W.J.; Petersen, R.C.; et al. The diagnosis of mild cognitive impairment due to Alzheimer’s disease: Recommendations from the National Institute on Aging-Alzheimer’s Association workgroups on diagnostic guidelines for Alzheimer’s disease. Alzheimers Dement. 2011, 7, 270–279. [Google Scholar] [CrossRef] [PubMed] [Green Version]
- García-Blanco, A.; Peña-Bautista, C.; Oger, C.; Vigor, C.; Galano, J.M.; Durand, T.; Martín-Ibáñez, N.; Baquero, M.; Vento, M.; Cháfer-Pericás, C. Reliable determination of new lipid peroxidation compounds as potential early Alzheimer Disease biomarkers. Talanta 2018, 184, 193–201. [Google Scholar] [CrossRef] [PubMed]
- Folstein, M.F.; Folstein, S.E.; McHugh, P.R. Mini-mental state. A practical method for grading the cognitive state of patients for the clinician. J. Psychiatr. Res. 1975, 12, 189–198. [Google Scholar] [CrossRef]
- Carretero, A.; León, Z.; García-Cañaveras, J.C.; Zaragoza, A.; Gómez-Lechón, M.J.; Donato, M.T.; Lahoz, A. In vitro/in vivo screening of oxidative homeostasis and damage to DNA, protein, and lipids using UPLC/MS-MS. Anal. Bioanal. Chem. 2014, 406, 5465–5476. [Google Scholar] [CrossRef]


| Gender (female) (n (%)) | MCI-AD (n = 53) | Control (n = 27) | p-value | |
| 32 (60.4%) | 10 (37%) | 0.048 | ||
| Age (years) (median (IQR)) | 70.50 (68.25–74.00) | 66.00 (62.00–70.00) | 0.003 | |
| Educational level (n (%)) | Primary | 30 (57%) | 6 (24%) | 0.026 |
| Secondary | 11 (20%) | 10 (36%) | ||
| Academic | 12 (23%) | 11 (40%) | ||
| Treatment (n (%)) | None | 20 (38%) | 13 (46%) | 0.374 |
| Psychotropic drug | 7 (13%) | 3 (12%) | ||
| Others | 26 (49%) | 11 (42%) | ||
| Comorbidity (n (%)) | None | 21 (41%) | 11 (42%) | 0.223 |
| Dyslipidemia | 20 (37%) | 6 (21%) | ||
| Hypertension | 12 (22%) | 10 (37%) | ||
| Alcohol consumption (yes, n (%)) | 4 (8%) | 6 (24%) | 0.065 | |
| Tobacco consumption (yes, n (%)) | 18 (34%) | 12 (44%) | 0.399 | |
| Depression (yes, n (%)) | 7 (12%) | 2 (8%) | 0.599 | |
| GDS (median (IQR)) | 8.00 (3.00–11.50) | 4.00 (1.00–8.00) | 0.006 | |
| β-Amyloid (median (IQR)) (pg mL−1) * | 600.50 (450.75–727.75) | 1197.00 (1124.50–1423.50) | 0.000 | |
| t-Tau (median (IQR)) (pg mL−1) * | 572.50 (372.00–818.00) | 196.00 (141.00–326.00) | 0.000 | |
| p-Tau (median (IQR)) (pg mL−1) * | 85.00 (69.25–107.75) | 48.00 (34.00–68.50) | 0.000 | |
| Temporal atrophy (yes, n (%)) | 40 (76%) | 3 (12%) | 0.000 | |
| CDR | 0.0 (n (%)) | 9 (16%) | 26 (96.3%) | 0.000 |
| 0.5 (n (%)) | 29 (55%) | 1 (3.7%) | ||
| 1.0 (n (%)) | 13 (25%) | 0 | ||
| 2.0 (n (%)) | 2 (4%) | 0 | ||
| MMSE (median (IQR)) | 24.00 (20.00–26.00) | 30.00 (28.00–30.00) | 0.000 | |
| RBANS.IM (median (IQR)) | 61 (44–71) | 90 (81–106) | 0.000 | |
| RBANS.VC (scores, mean ± SD) | 78 (65–89) | 96 (84–112) | 0.000 | |
| RBANS.L (scores, mean ± SD) | 60 (54–83.5) | 92 (87–96) | 0.000 | |
| RBANS.A (scores, mean ± SD) | 60 (53–79) | 100 (85–112) | 0.000 | |
| RBANS.DM (scores, mean ± SD) | 44 (40–58) | 100 (88–106) | 0.000 | |
| FAQ (scores, mean ± SD) | 6 (2.5–12) | 0 (0–0) | 0.000 | |
| Analyte | Median (IQR) ng mg−1 Creatinine | p-value (Mann–Whitney Test) | |
|---|---|---|---|
| MCI-AD (n = 53) | Control (n = 27) | ||
| 3-I-Tyr | 2.08 (0.87–3.18) | 1.82 (1.01–2.59) | 0.412 |
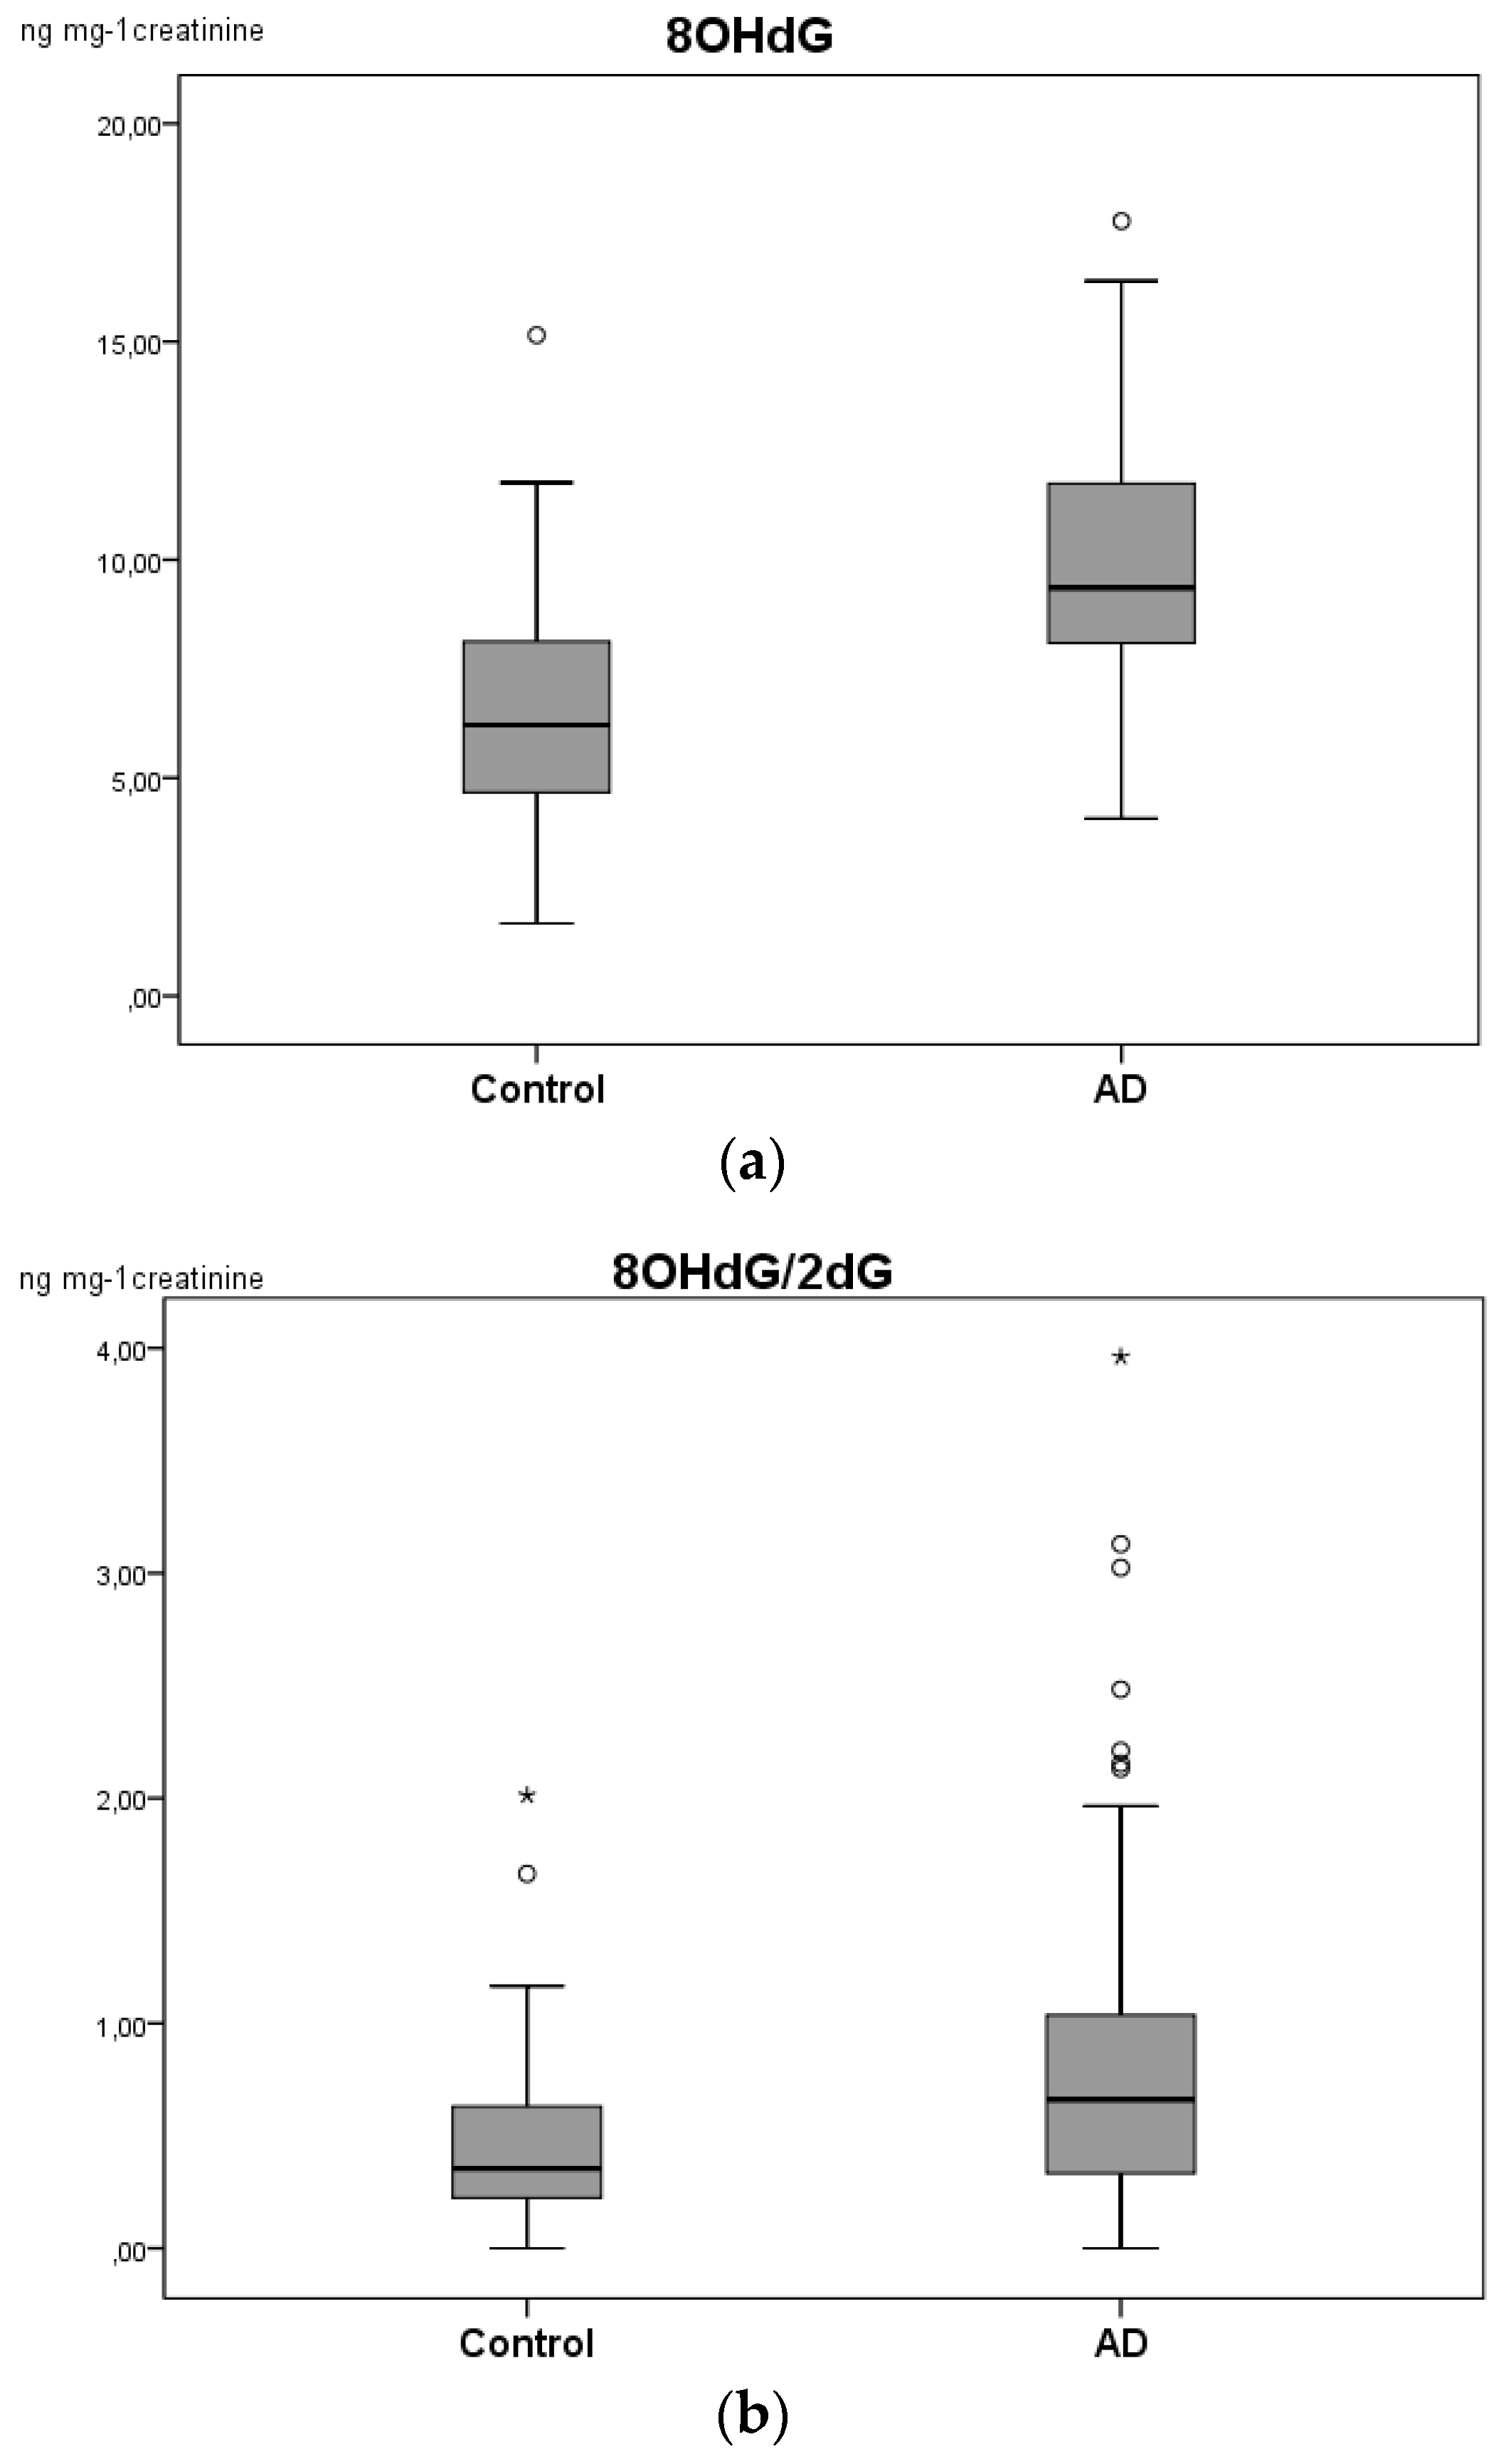
| 8-OHdG | 9.46 (8.09–12.02) | 6.21 (4.44–8.41) | 0.000 * |
| 2-dG | 14.84 (6.21–29.57) | 12.89 (5.26–22.07) | 0.479 |
| 3-NO2-Tyr | 36.89 (25.86–74.58) | 43.78 (24.87–63.00) | 0.835 |
| 3-Cl-Tyr | - | - | - |
| o-Tyr | - | - | - |
| m-Tyr | 4.54 (1.97–6.79) | 5.53 (2.68–8.06) | 0.593 |
| p-Tyr | 7441.69 (5318.80–12904.17) | 6574.32 (4755.32–11780.08) | 0.292 |
| Phe | 76349.94 (54047.28–121009.87) | 82324.57 (61530.76–95751.69) | 0.875 |
| mTyr/Phe a | 0.000057 (0.000027–0.000099) | 0.000059 (0.000030–0.000077) | 0.725 |
| oTyr/Phe a | - | - | - |
| 3-NO2-Tyr/ pTyr a | 0.0050 (0.0037–0.0069) | 0.0050 (0.0038–0.0087) | 0.593 |
| 3-Cl-Tyr/ pTyr a | - | - | - |
| 8-OHdG/ 2-dG a | 0.6963 (0.3347–1.0796) | 0.3811 (0.2883–0.7072) | 0.019 * |
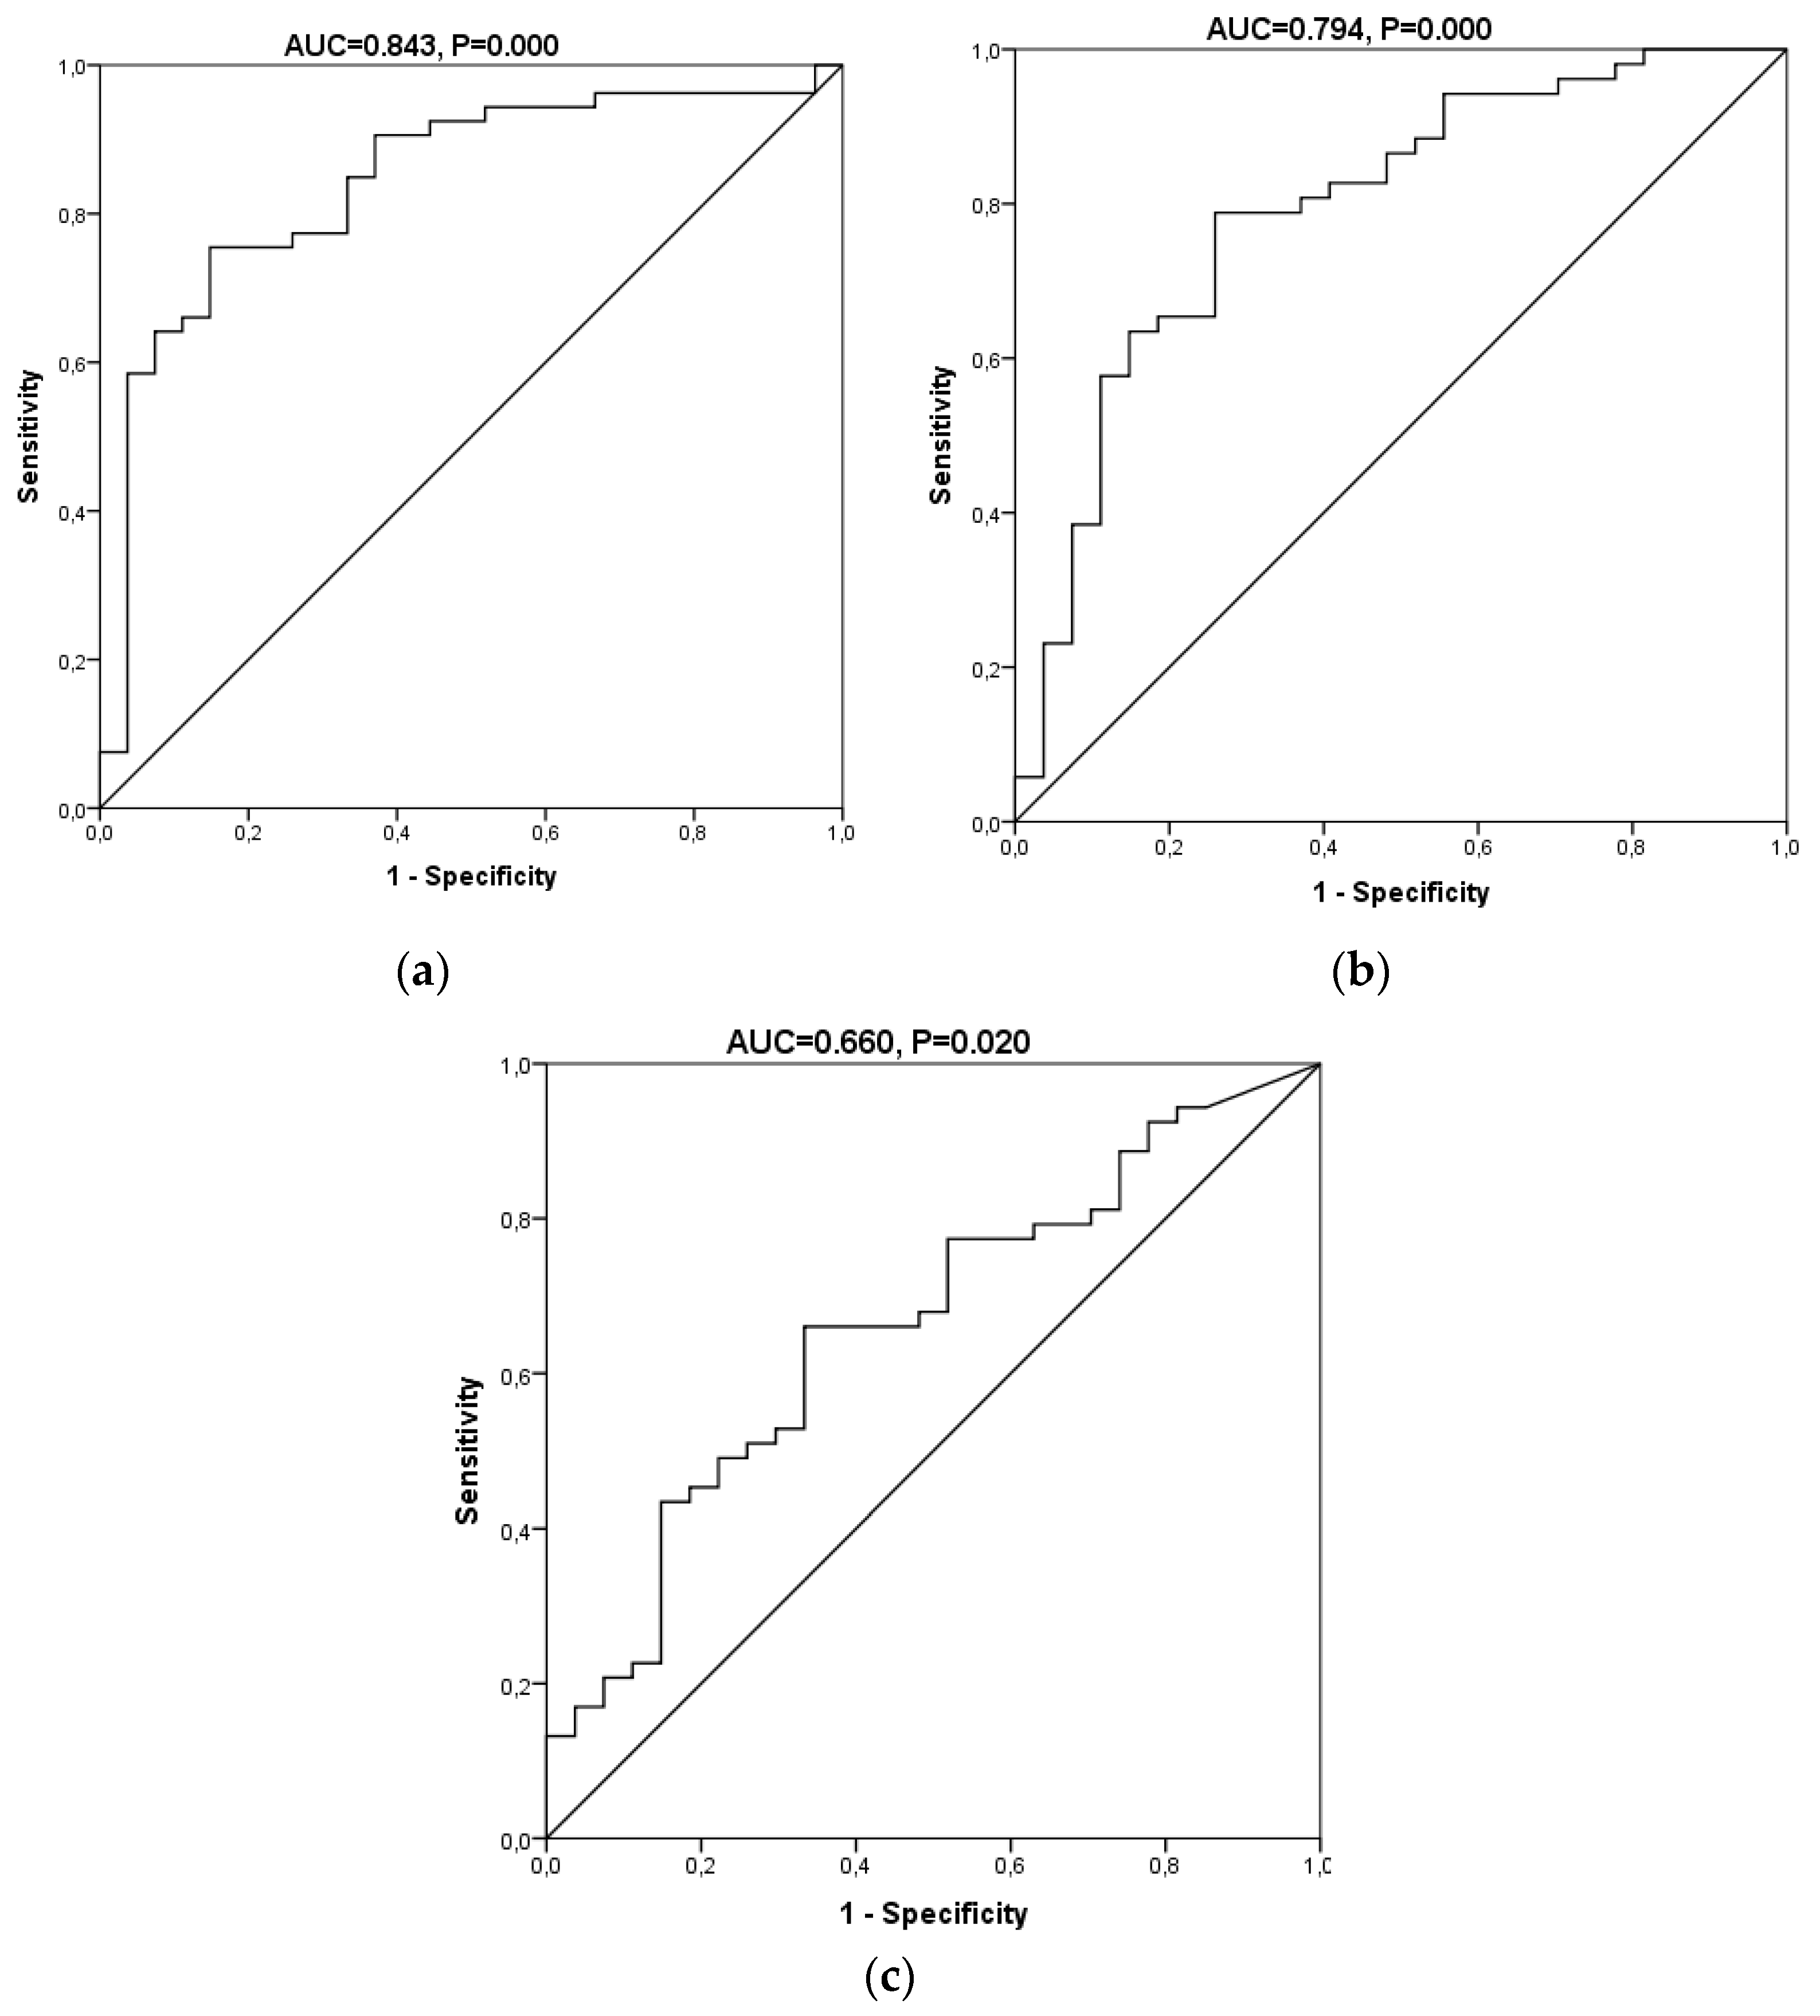
| Indexes | Biomarkers Panel | 8-OHdG | 8-OHdG/2-dG |
|---|---|---|---|
| AUC (95% CI) | 0.843 (0.750–0.936) | 0.794 (0.687–0.902) | 0.66 (0.536–0.785) |
| Sensitivity (%, 95% CI) | 78.4 (65.4–87.5) | 77.4 (64.5–86.5) | 66.0 (52.6–77.3) |
| Specificity (%, 95% CI) | 85.2 (67.5–94.1) | 74.1 (55.3–86.8) | 66.7 (47.8–81.4) |
| PPV (%, 95% CI) | 90.9 (78.8–96.4) | 85.4 (72.8–92.8) | 79.5 (65.5–88.8) |
| NPV (%, 95% CI) | 67.6 (50.8–80.9) | 62.5 (45.3–77.1) | 50.0 (34.5–65.5) |
| LR+ (95% CI) | 5.29 (2.12–13.23) | 2.98 (1.55–5.74) | 1.98 (1.12–3.49) |
| LR− (95% CI) | 0.25 (0.15–0.43) | 0.31 (0.18–0.53) | 0.51 (0.33–0.78) |
| DOR (95% CI) | 20.91 (5.97–73.28) | 9.76 (3.33–28.59) | 3.89 (1.46–10.38) |
© 2019 by the authors. Licensee MDPI, Basel, Switzerland. This article is an open access article distributed under the terms and conditions of the Creative Commons Attribution (CC BY) license (http://creativecommons.org/licenses/by/4.0/).
Share and Cite
Peña-Bautista, C.; Tirle, T.; López-Nogueroles, M.; Vento, M.; Baquero, M.; Cháfer-Pericás, C. Oxidative Damage of DNA as Early Marker of Alzheimer’s Disease. Int. J. Mol. Sci. 2019, 20, 6136. https://0-doi-org.brum.beds.ac.uk/10.3390/ijms20246136
Peña-Bautista C, Tirle T, López-Nogueroles M, Vento M, Baquero M, Cháfer-Pericás C. Oxidative Damage of DNA as Early Marker of Alzheimer’s Disease. International Journal of Molecular Sciences. 2019; 20(24):6136. https://0-doi-org.brum.beds.ac.uk/10.3390/ijms20246136
Chicago/Turabian StylePeña-Bautista, Carmen, Tania Tirle, Marina López-Nogueroles, Máximo Vento, Miguel Baquero, and Consuelo Cháfer-Pericás. 2019. "Oxidative Damage of DNA as Early Marker of Alzheimer’s Disease" International Journal of Molecular Sciences 20, no. 24: 6136. https://0-doi-org.brum.beds.ac.uk/10.3390/ijms20246136