Pharmacological Inhibition of TFF3 Enhances Sensitivity of CMS4 Colorectal Carcinoma to 5-Fluorouracil through Inhibition of p44/42 MAPK

 ,
,  ,
,  and
and 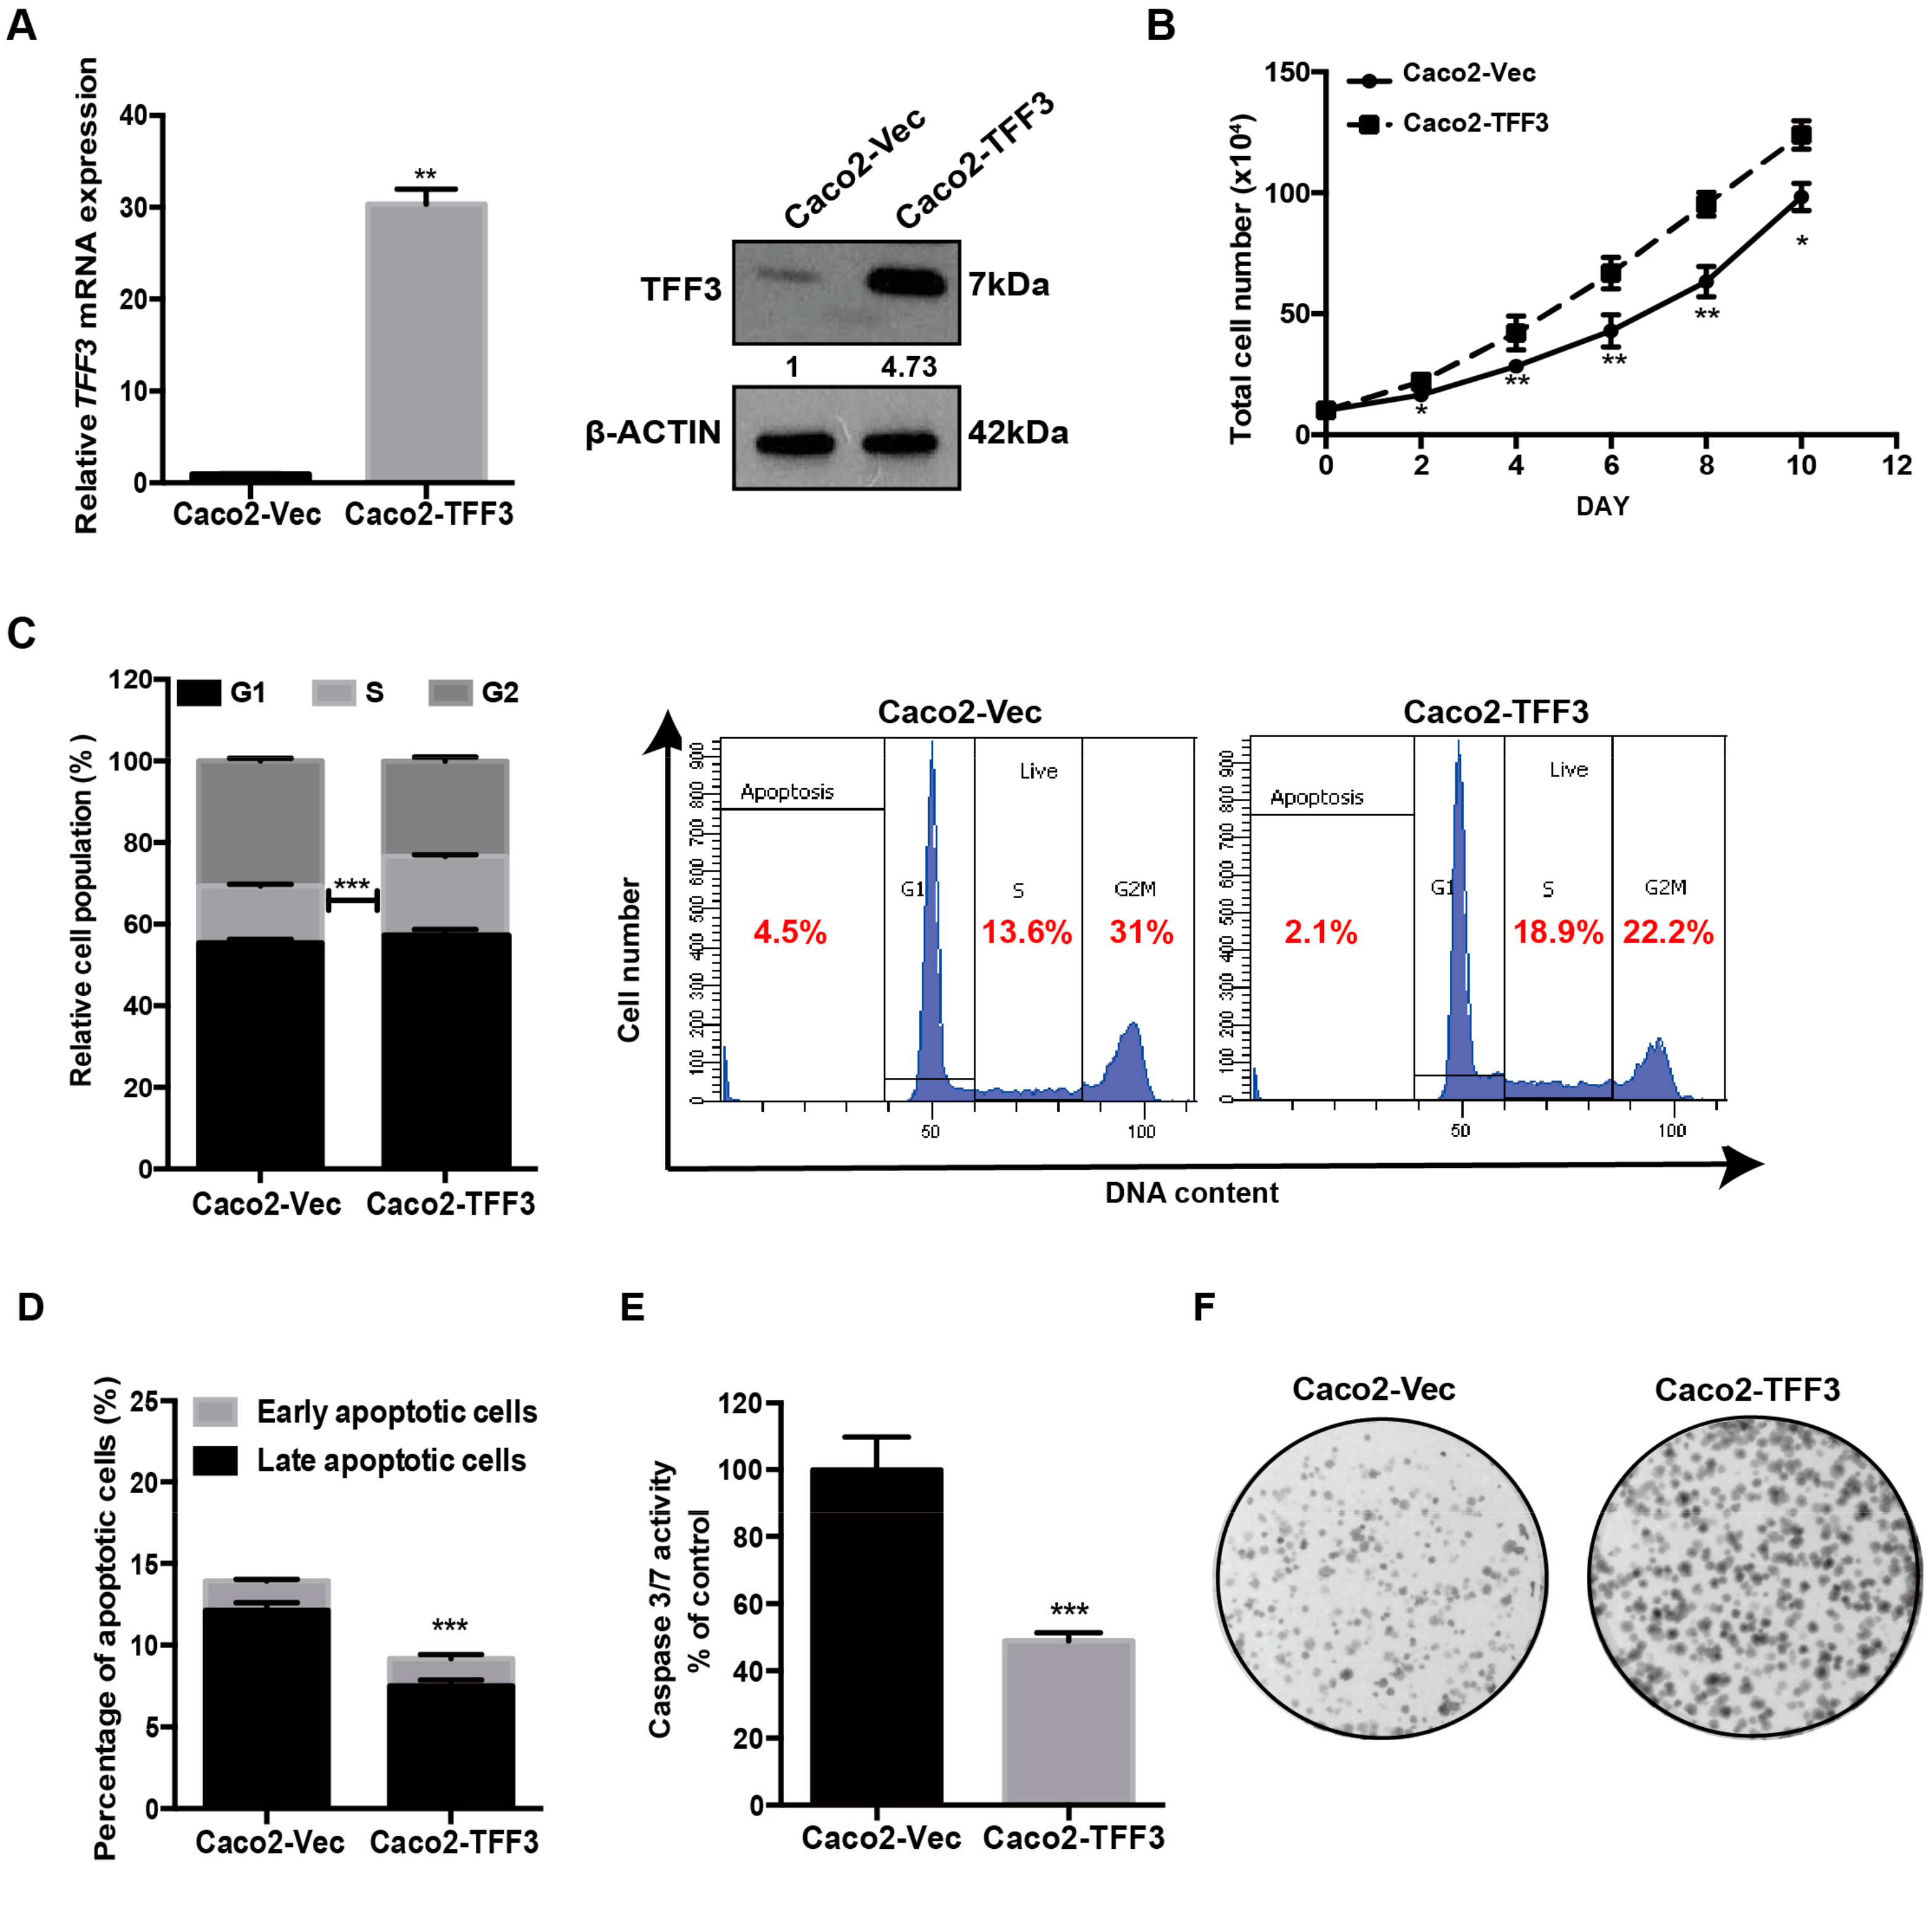
Abstract
:1. Introduction
2. Results
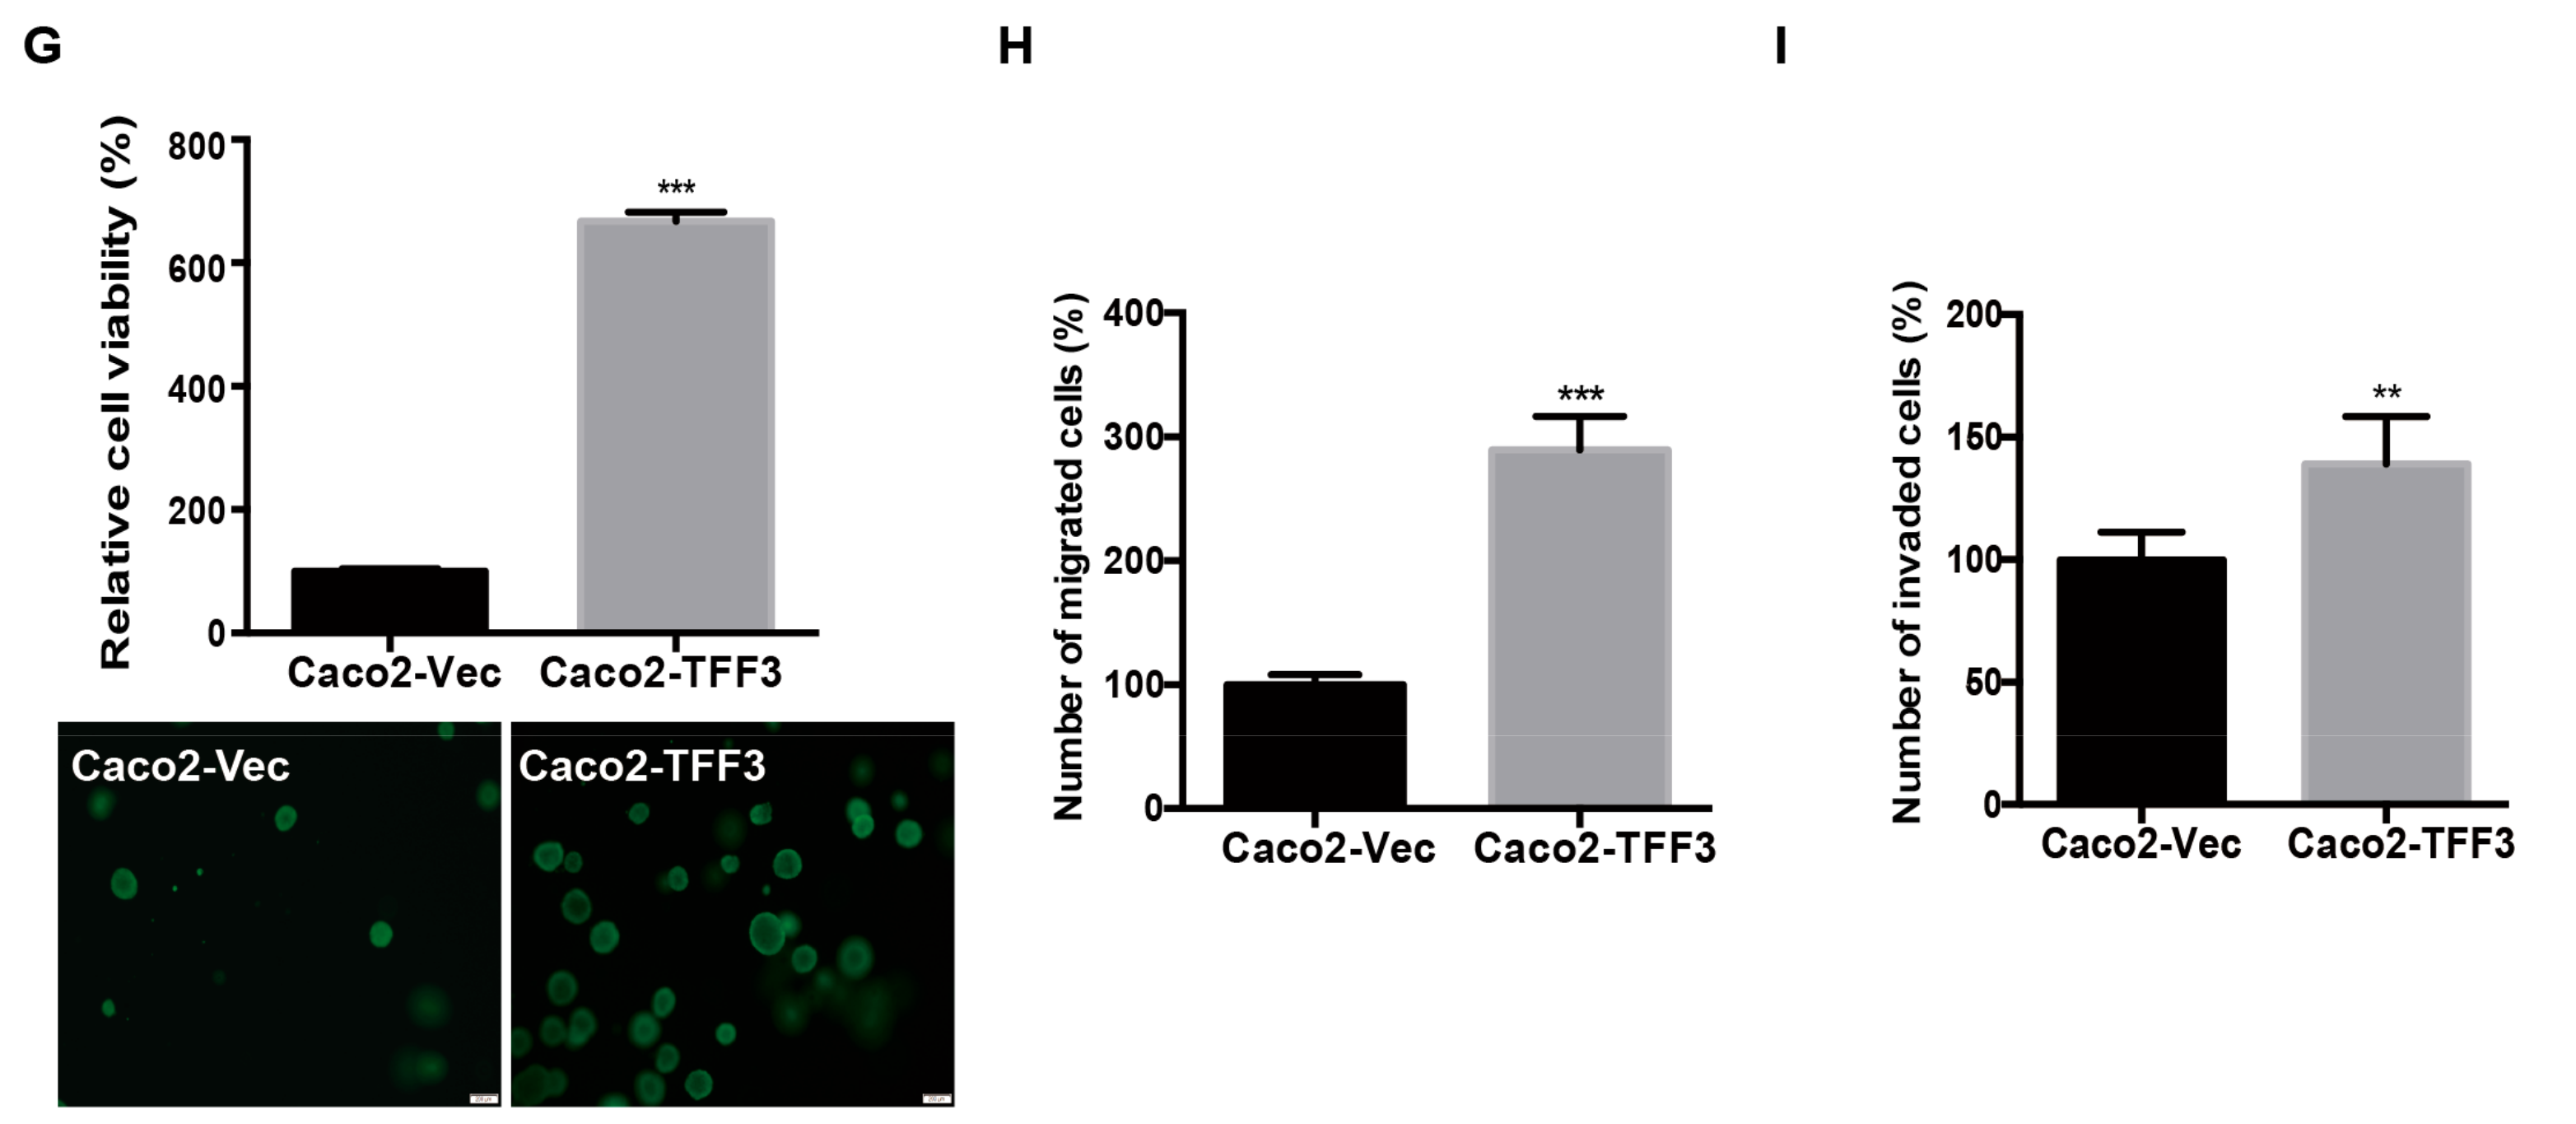
2.1. Forced Expression of TFF3 Promotes Oncogenic Behaviour of CMS4 CRC Cells in Vitro
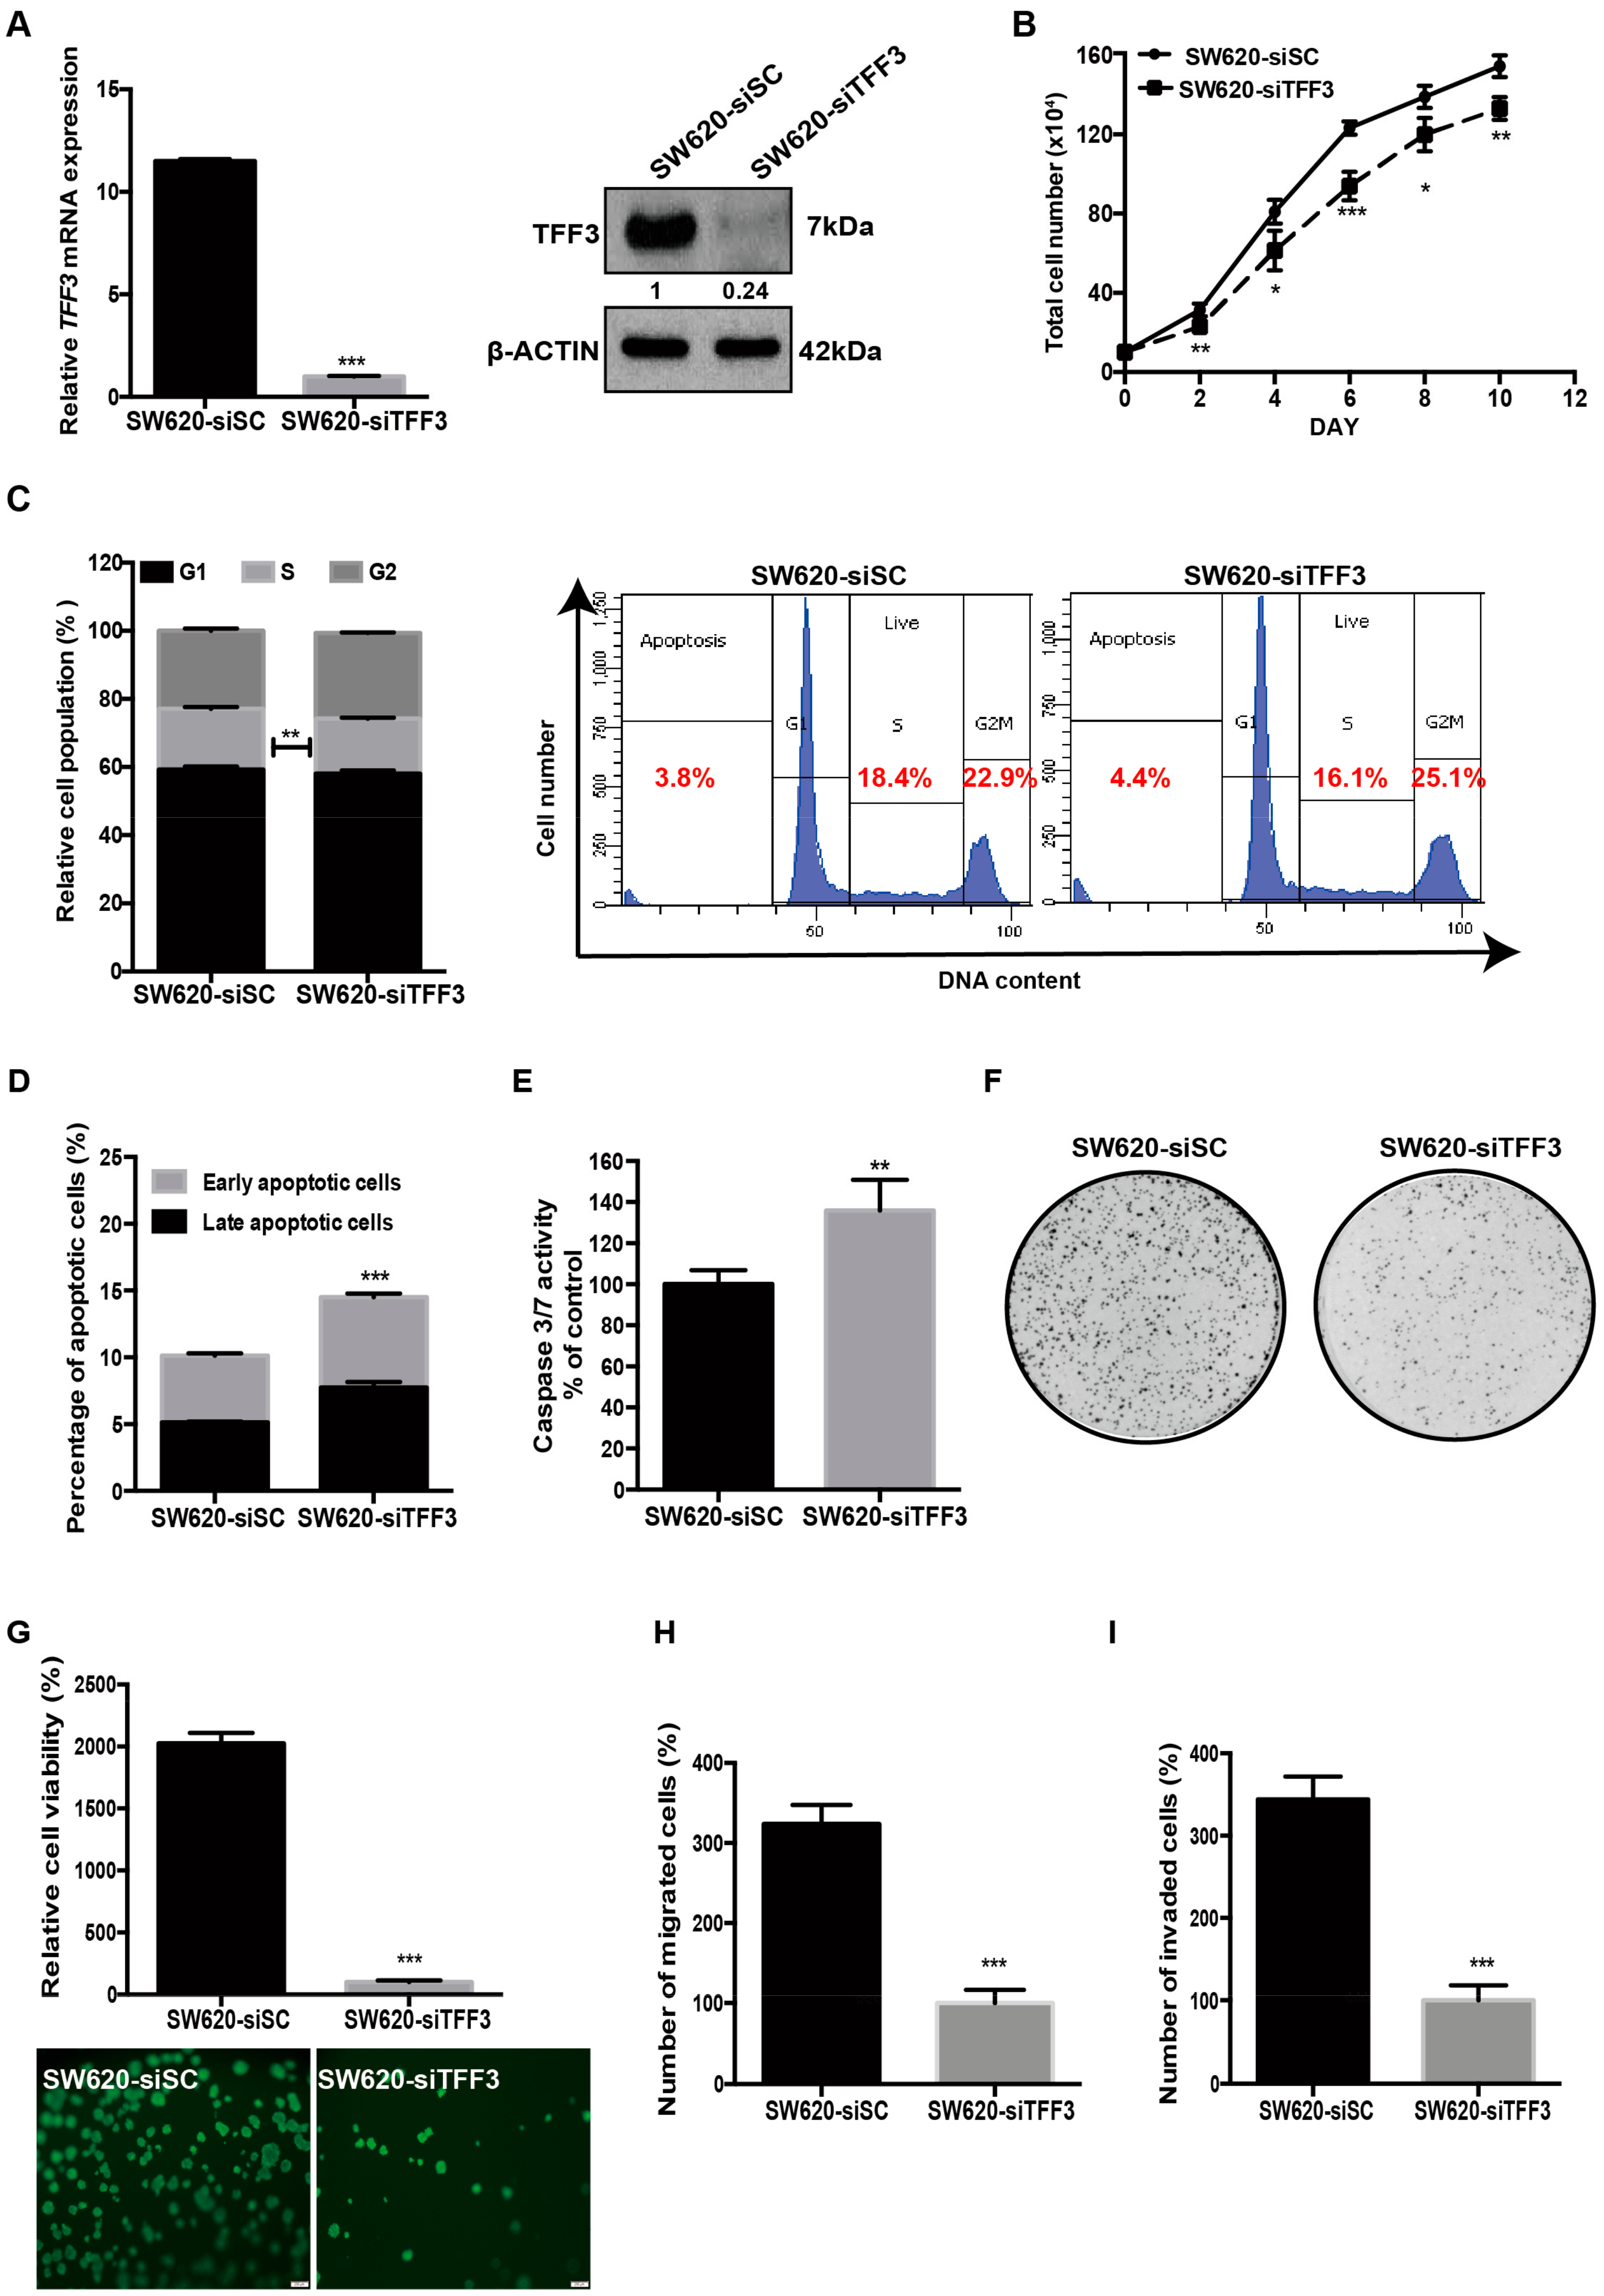
2.2. Depleted Expression of TFF3 Decreases Oncogenic Behaviour of CMS4 CRC Cells in Vitro
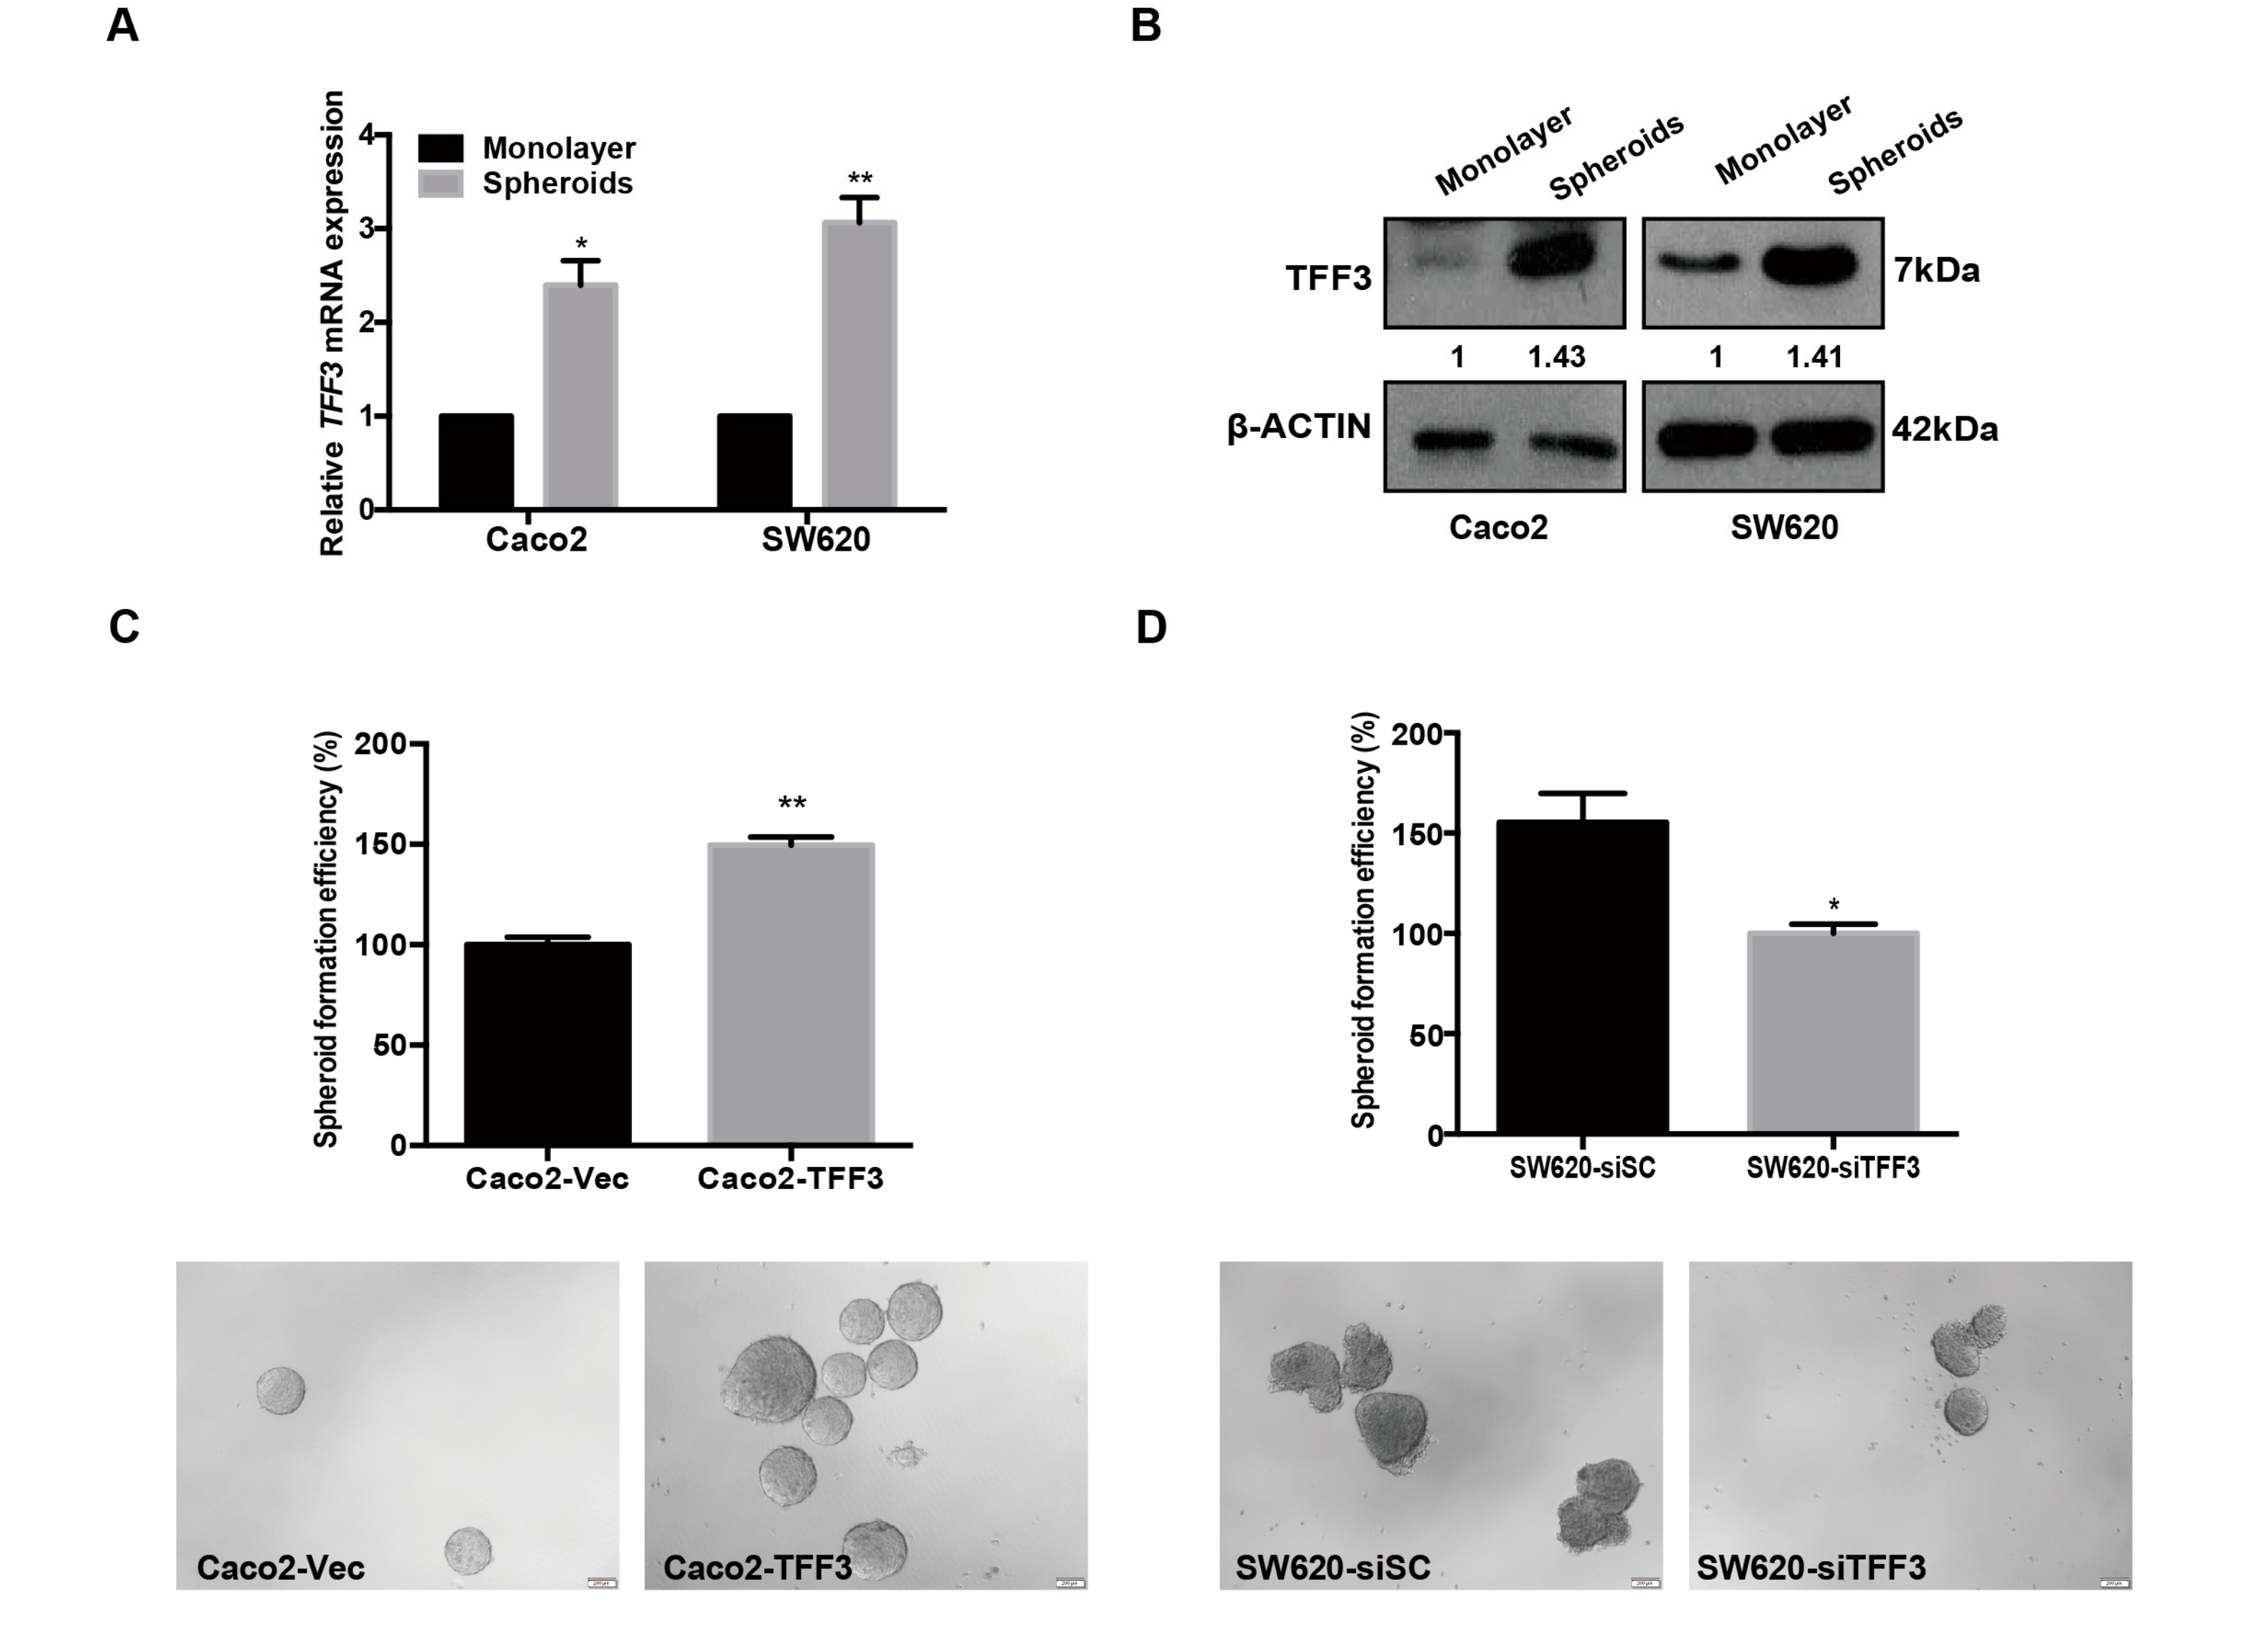
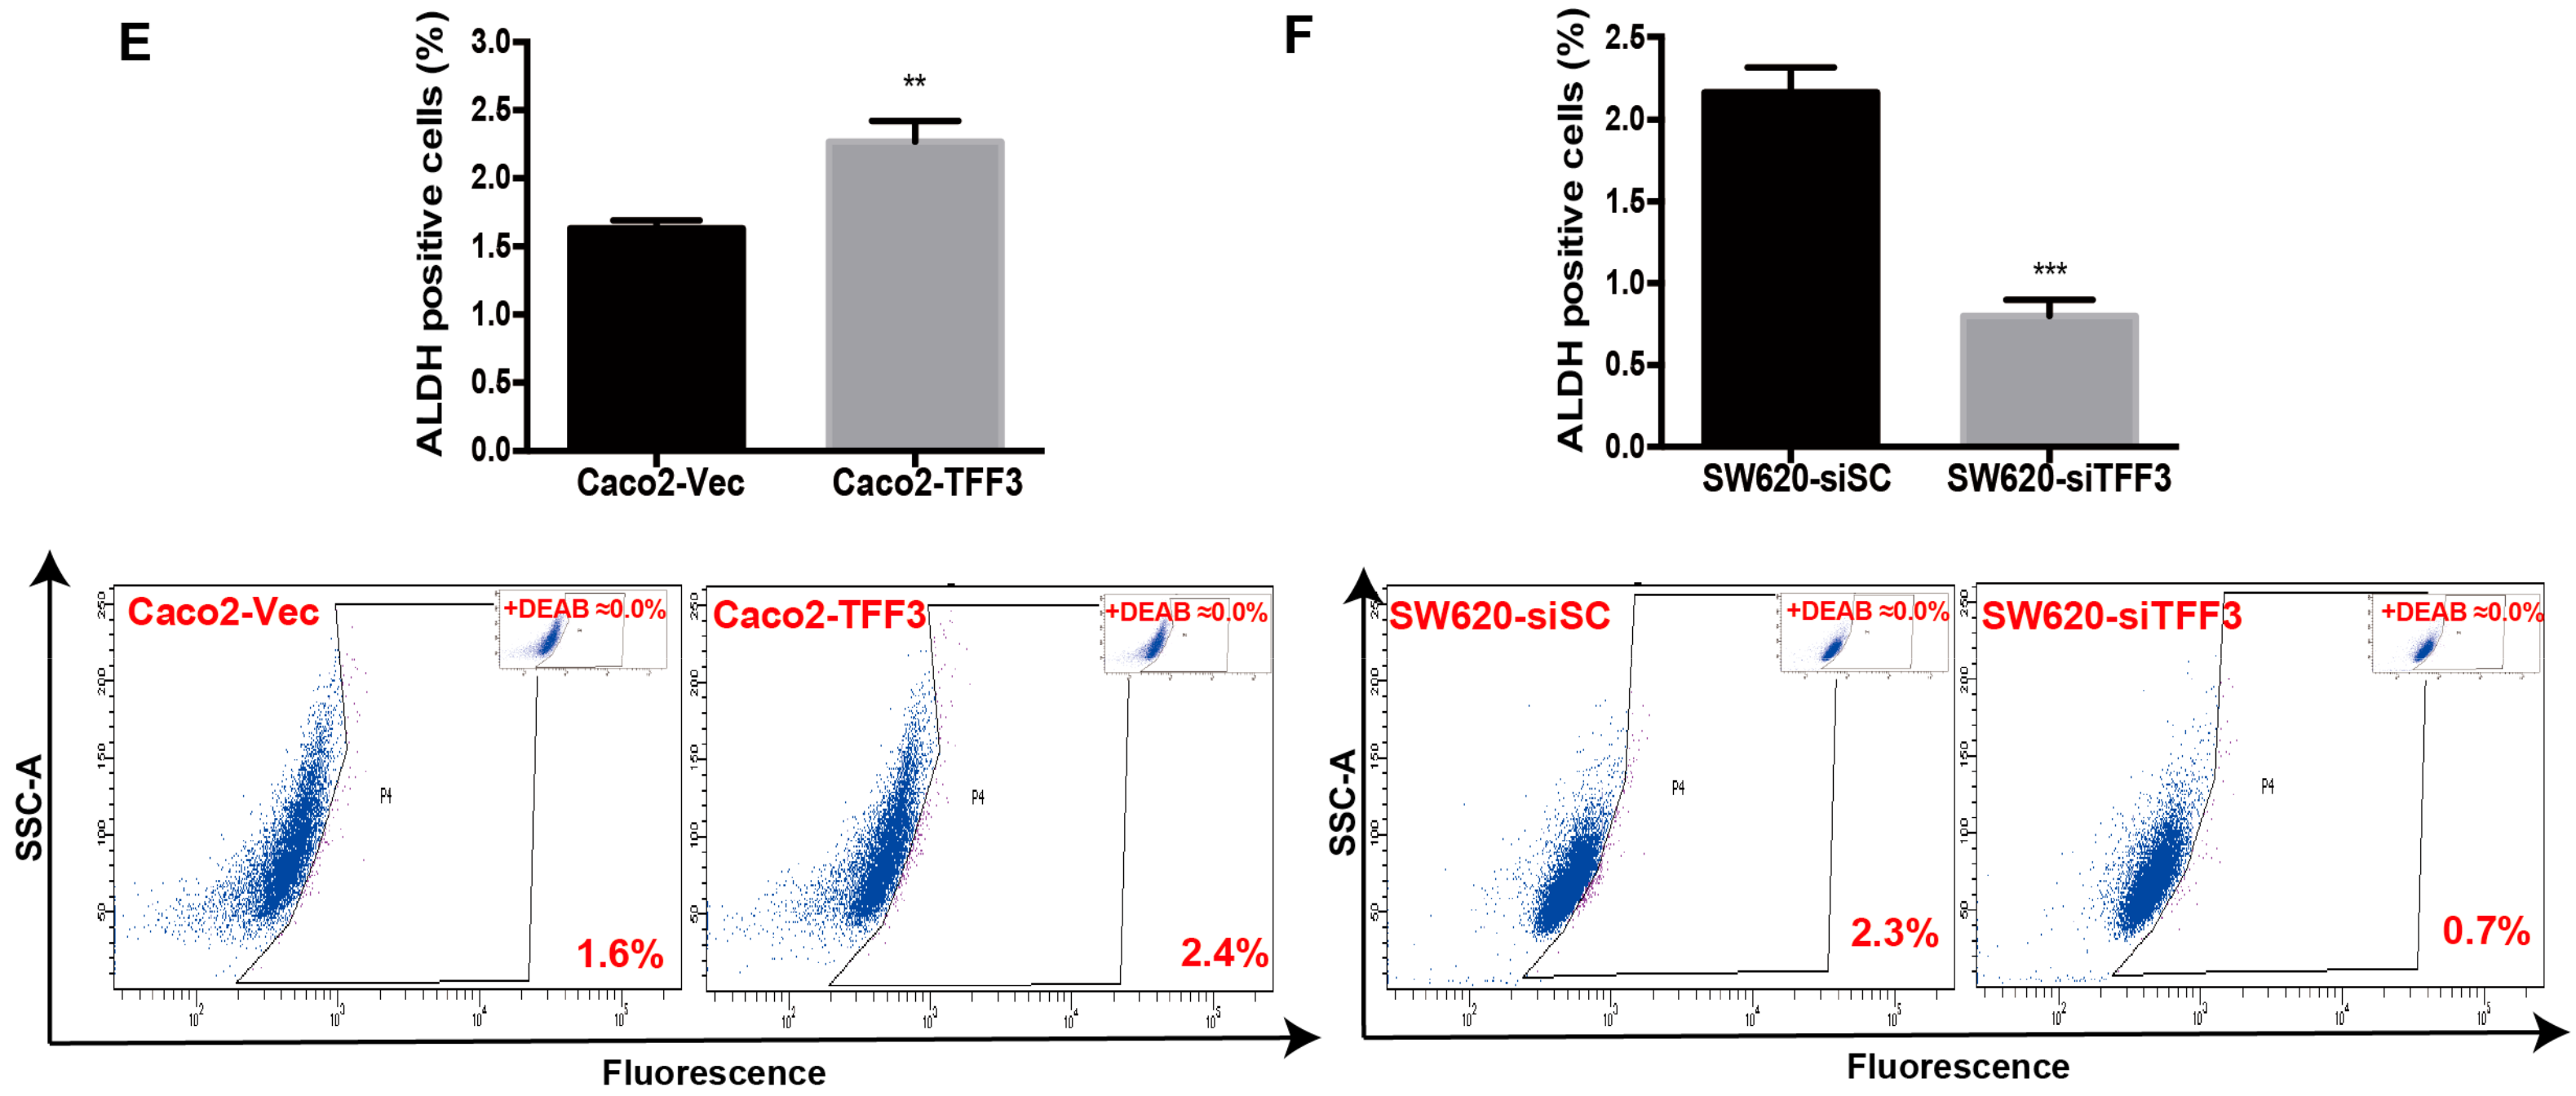
2.3. TFF3 Promotes CSC-Like Properties in CMS4 CRC Cells
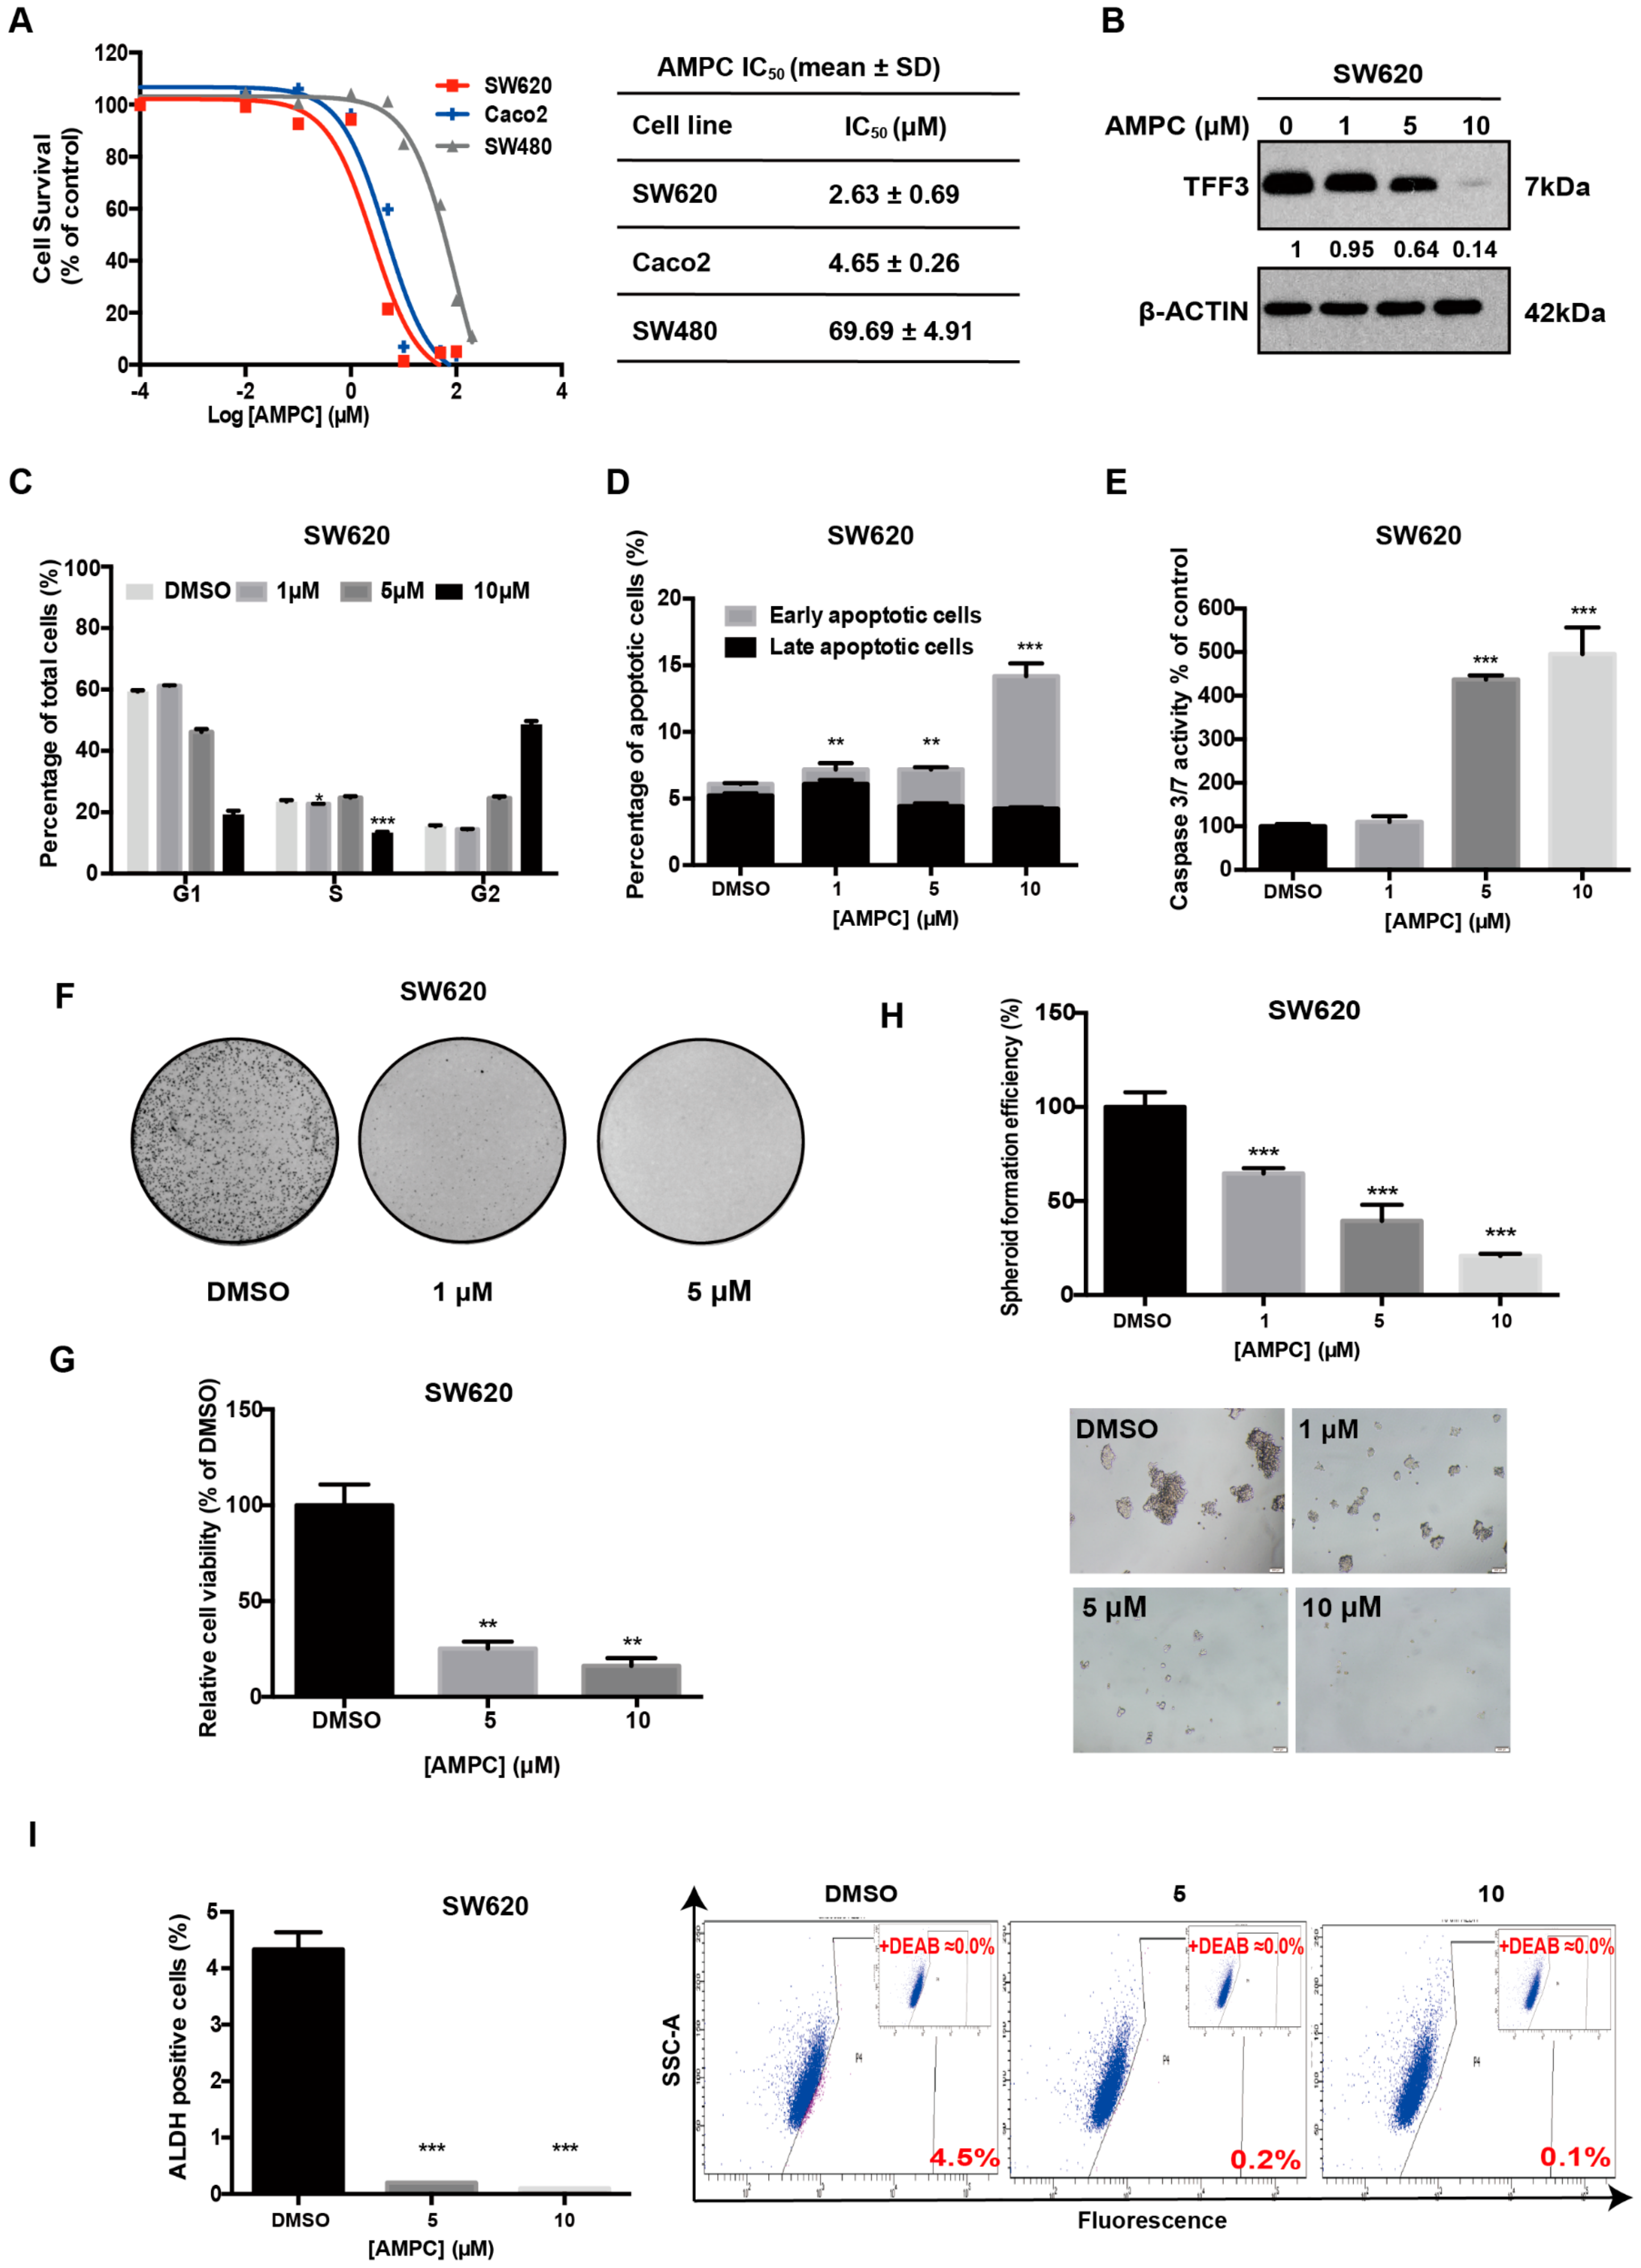
2.4. Pharmacological Inhibition of TFF3 Decreases Oncogenicity of CMS4 CRC Cells
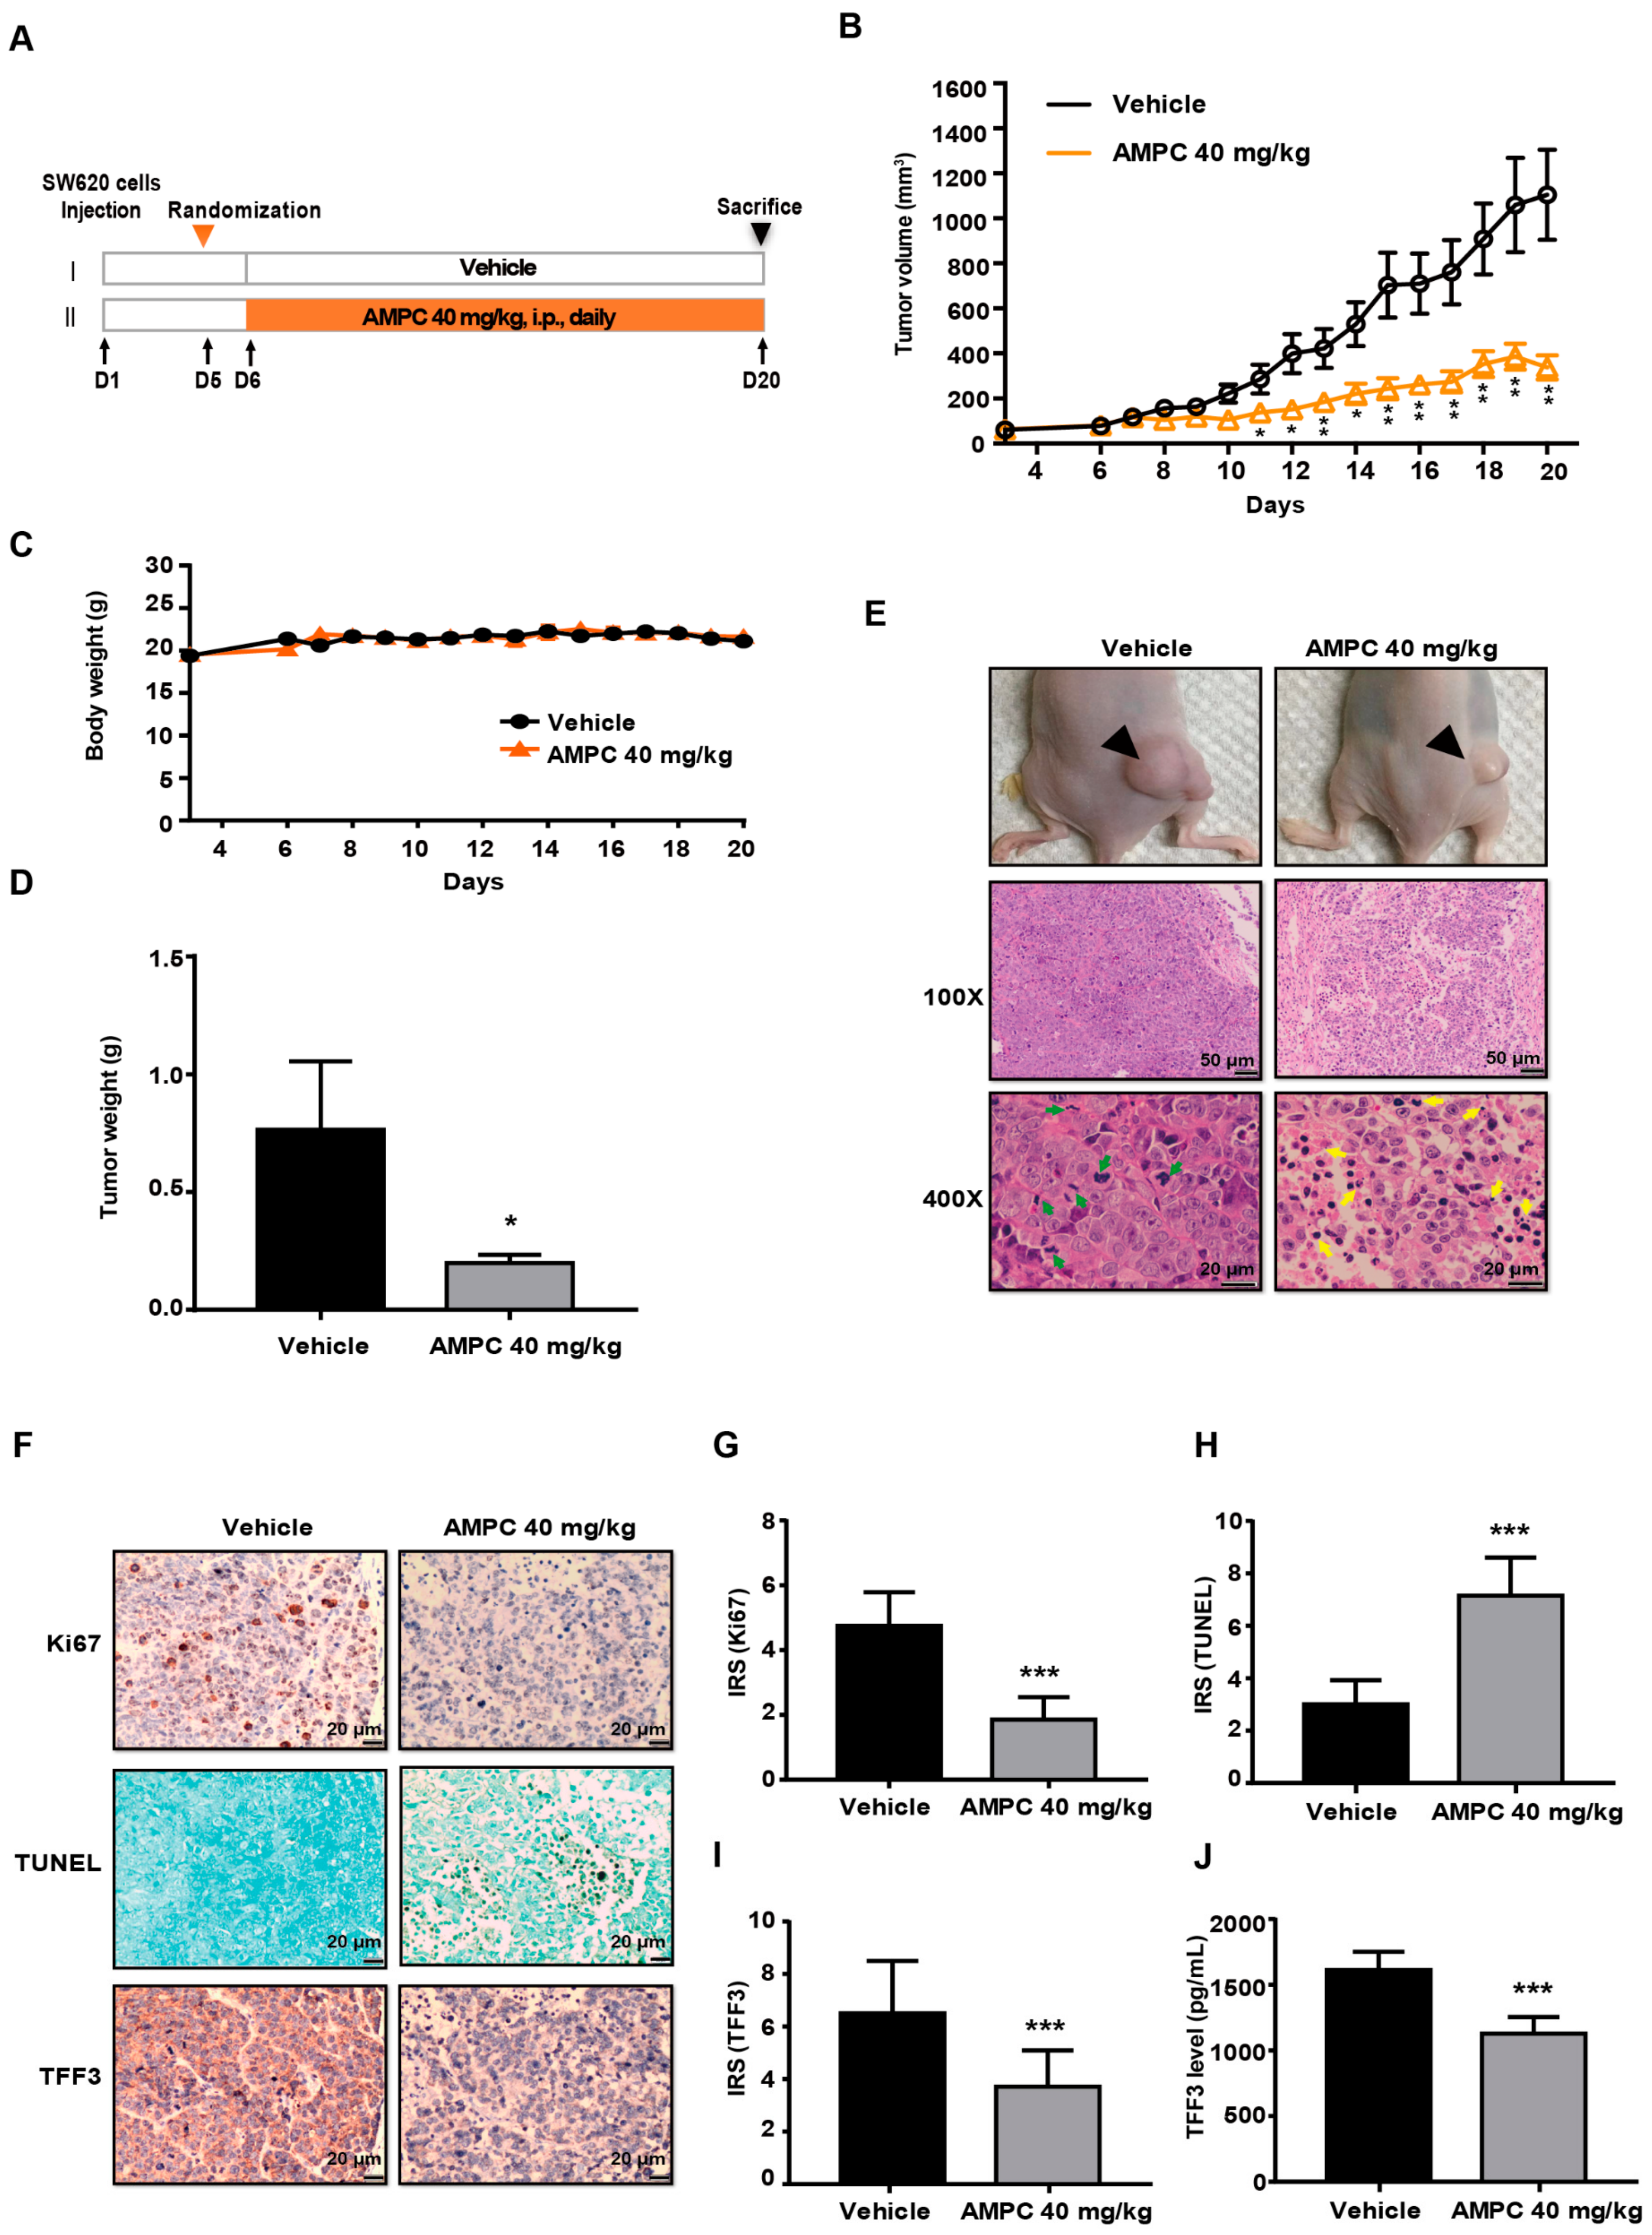
2.5. AMPC Suppresses SW620 Tumour Growth in a Mouse Xenograft Model
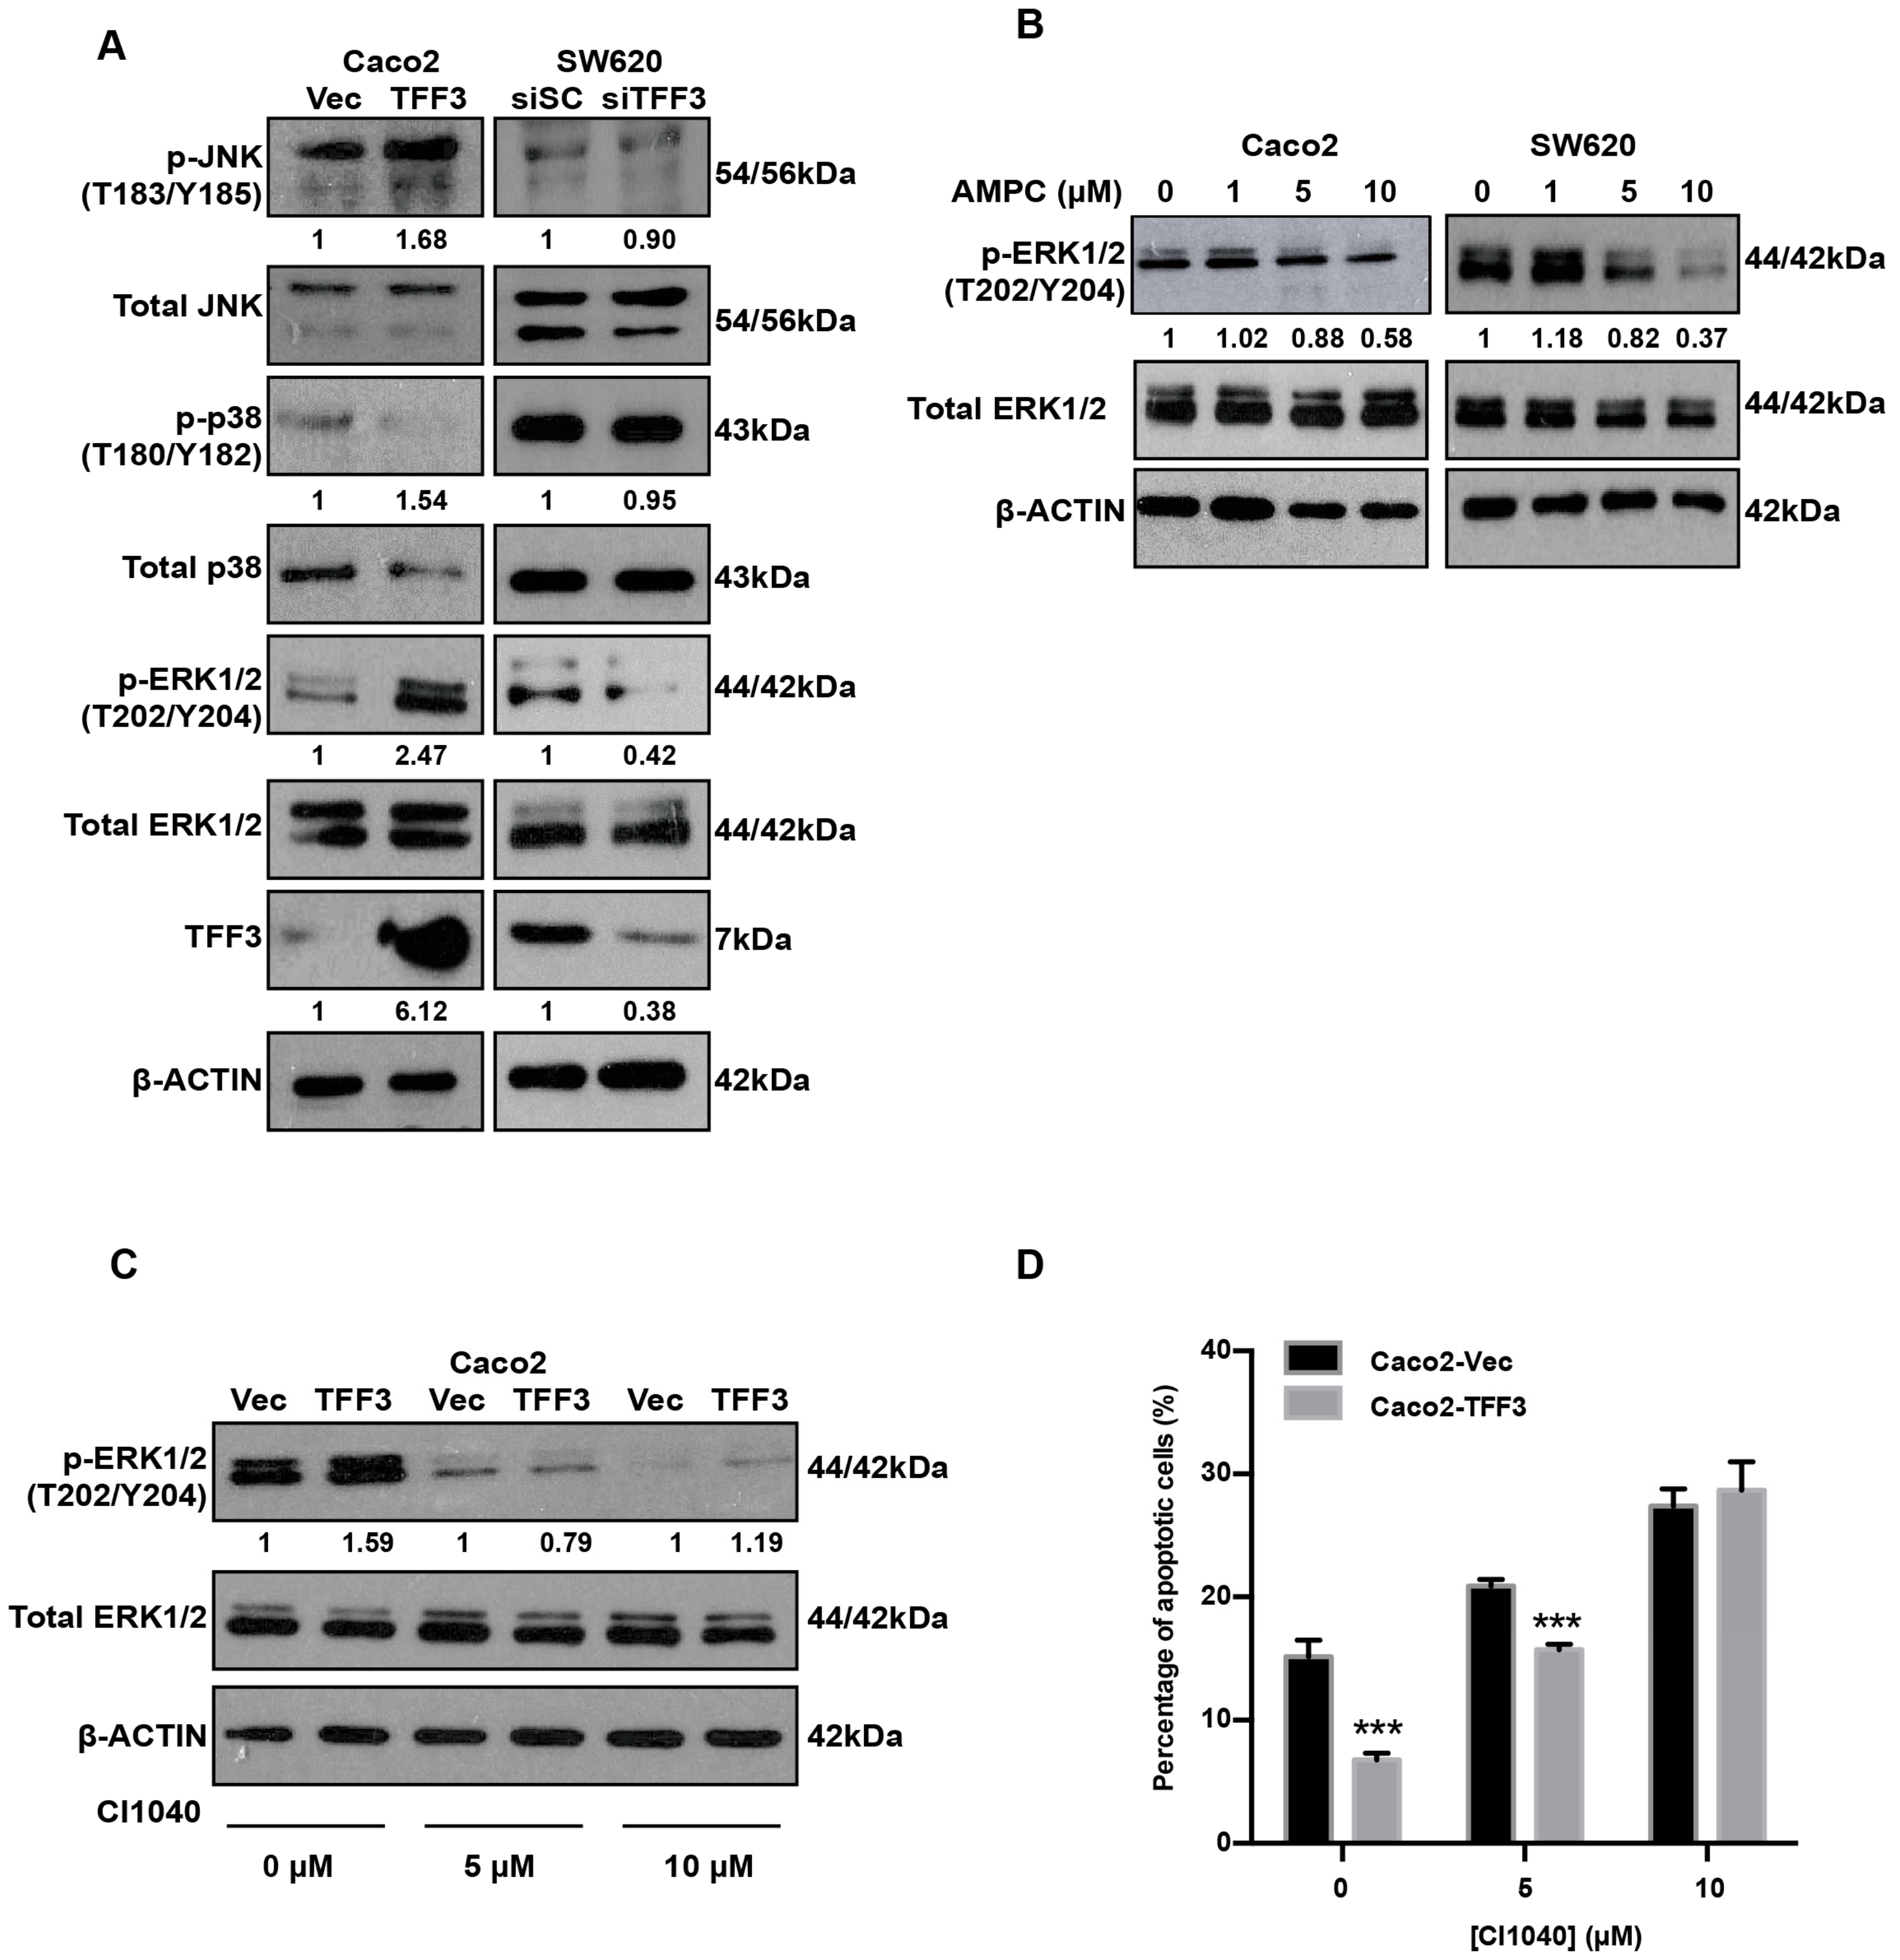
2.6. TFF3 Activates the p44/42 MAPK (ERK1/2) Pathway in CMS4 CRC Cells
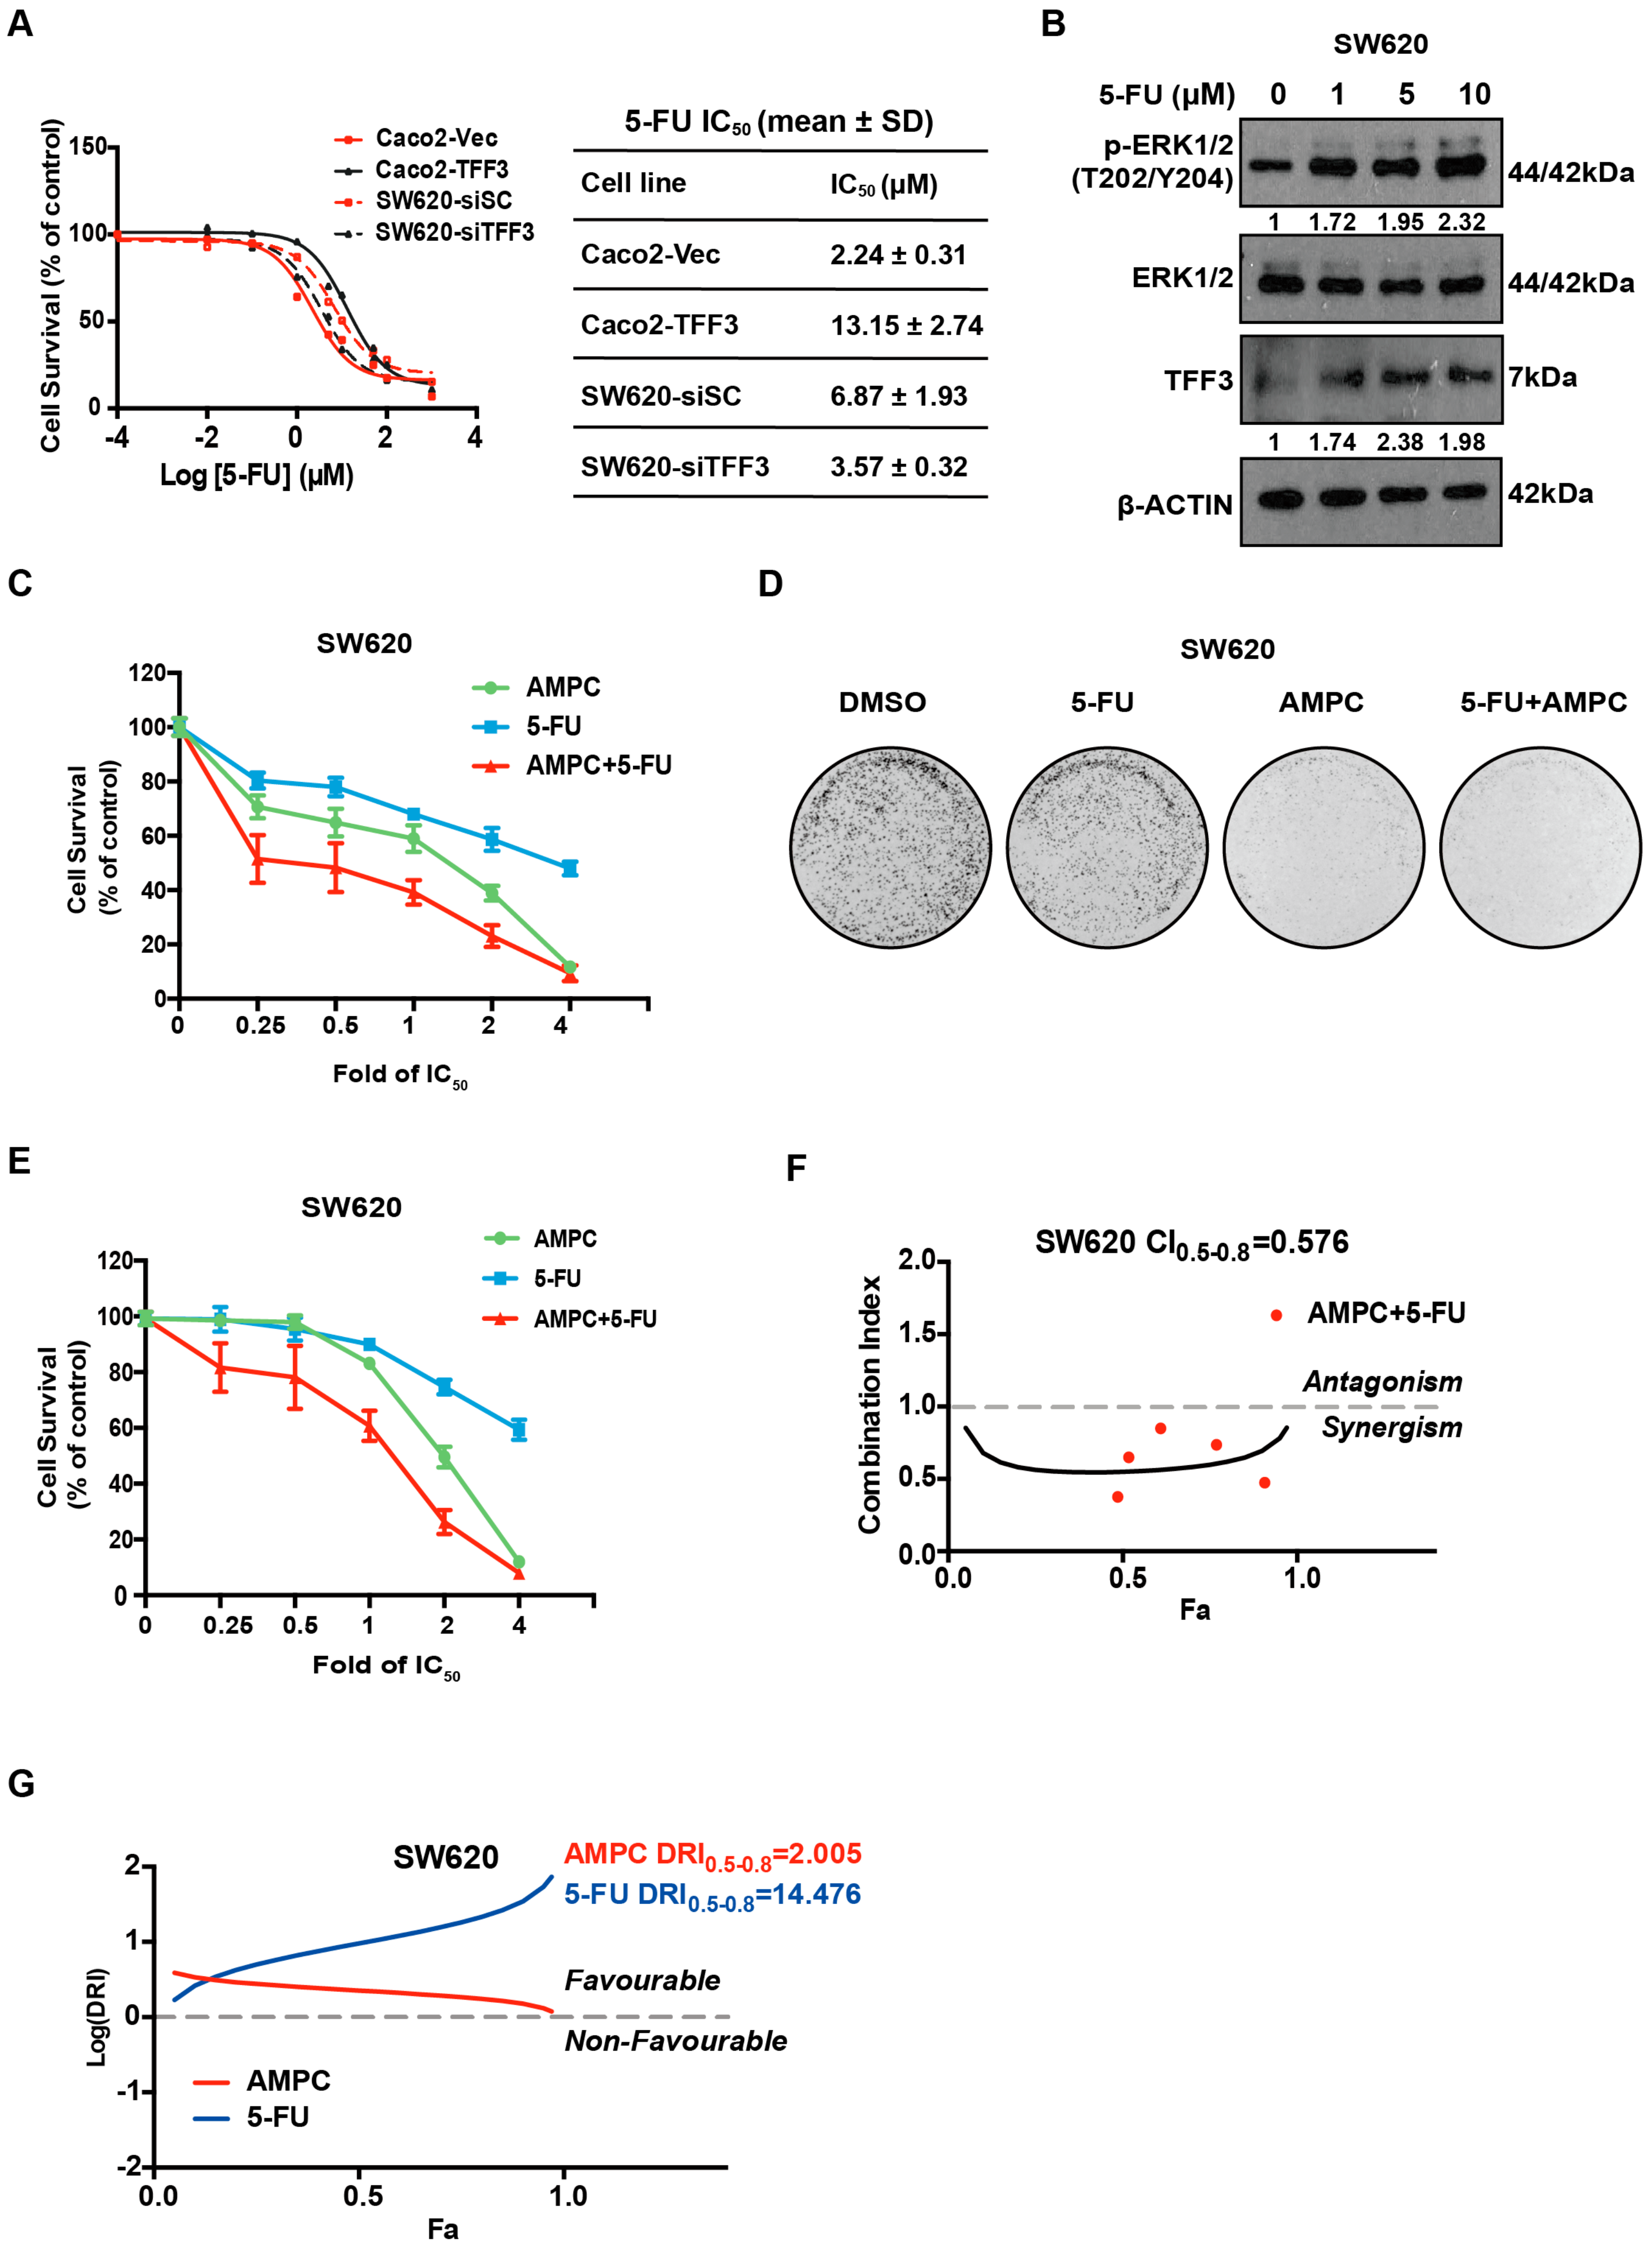
2.7. TFF3 Decreases 5-FU Sensitivity and 5-FU Combines with AMPC in a Synergistic Manner in CMS4 CRC Cells
3. Discussion
4. Materials and Methods
4.1. Cell Line Maintenance and Cell Transfection
4.2. Three-Dimensional Matrigel® Growth Culture
4.3. Annexin V and Propidium Iodide Assay
4.4. Cell Cycle Assay
4.5. Caspase-3/7 Activity Assay
4.6. Foci Formation Assay
4.7. Migration and Invasion Assay
4.8. Colonosphere Formation
4.9. ALDEFLUOR Assay
4.10. Polymerase Chain Reaction (PCR) and Western Blot Analysis
4.11. Animal Care
4.12. Subcutaneous SW620 Xenograft Tumour Model
4.13. Measurement of TFF3 Levels
4.14. Statistical Analysis
5. Conclusions
6. Patents
Supplementary Materials
Author Contributions
Funding
Conflicts of Interest
References
- Manfredi, S.; Lepage, C.; Hatem, C.; Coatmeur, O.; Faivre, J.; Bouvier, A.M. Epidemiology and management of liver metastases from colorectal cancer. Ann. Surg. 2006, 244, 254. [Google Scholar] [CrossRef] [PubMed]
- Nordlinger, B.; Van Cutsem, E.; Rougier, P.; Köhne, C.H.; Ychou, M.; Sobrero, A.; Adam, R.; Arvidsson, D.; Carrato, A.; Georgoulias, V.; et al. Does chemotherapy prior to liver resection increase the potential for cure in patients with metastatic colorectal cancer? A report from the European Colorectal Metastases Treatment Group. Eur. J. Cancer 2007, 43, 2037–2045. [Google Scholar] [CrossRef]
- Pal, R.; Wei, N.; Song, N.; Wu, S.; Kim, R.S.; Wang, Y.; Gavin, P.G.; Lucas, P.C.; Srinivasan, A.; Allegra, C.J.; et al. Molecular subtypes of colorectal cancer in pre-clinical models show differential response to targeted therapies: Treatment implications beyond KRAS mutations. PLoS ONE 2018, 13, e0200836. [Google Scholar] [CrossRef] [PubMed] [Green Version]
- Guinney, J.; Dienstmann, R.; Wang, X.; de Reyniès, A.; Schlicker, A.; Soneson, C.; Marisa, L.; Roepman, P.; Nyamundanda, G.; Angelino, P.; et al. The consensus molecular subtypes of colorectal cancer. Nat. Med. 2015, 21, 1350. [Google Scholar] [CrossRef] [PubMed]
- Müller, M.F.; Ibrahim, A.E.; Arends, M.J. Molecular pathological classification of colorectal cancer. Virchows Arch. 2016, 469, 125–134. [Google Scholar] [CrossRef] [Green Version]
- Song, N.; Pogue-Geile, K.L.; Gavin, P.G.; Yothers, G.; Kim, S.R.; Johnson, N.L.; Lipchik, C.; Allegra, C.J.; Petrelli, N.J.; O’Connell, M.J.; et al. Clinical outcome from oxaliplatin treatment in stage II/III colon cancer according to intrinsic subtypes: Secondary analysis of NSABP C-07/NRG oncology randomized clinical trial. JAMA Oncol. 2016, 2, 1162–1169. [Google Scholar] [CrossRef]
- Del Rio, M.; Mollevi, C.; Bibeau, F.; Vie, N.; Selves, J.; Emile, J.F.; Roger, P.; Gongora, C.; Robert, J.; Tubiana-Mathieu, N.; et al. Molecular subtypes of metastatic colorectal cancer are associated with patient response to irinotecan-based therapies. Eur. J. Cancer 2017, 76, 68–75. [Google Scholar] [CrossRef]
- Fessler, E.; Medema, J.P. Colorectal cancer subtypes: Developmental origin and microenvironmental regulation. Trends Cancer 2016, 2, 505–518. [Google Scholar] [CrossRef]
- Linnekamp, J.F.; Hooff, S.R.V.; Prasetyanti, P.R.; Kandimalla, R.; Buikhuisen, J.Y.; Fessler, E.; Ramesh, P.; Lee, K.A.S.T.; Bochove, G.G.W.; de Jong, J.H.; et al. Consensus molecular subtypes of colorectal cancer are recapitulated in in vitro and in vivo models. Cell Death Differ. 2018, 25, 616. [Google Scholar] [CrossRef]
- Williams, G.; Wright, N. Trefoil factor family domain peptides. Virchows Arch. 1997, 431, 299–304. [Google Scholar] [CrossRef]
- Thim, L. Trefoil peptides: From structure to function. Cell. Mol. Life Sci. 1997, 53, 888–903. [Google Scholar] [CrossRef] [PubMed]
- Aihara, E.; Engevik, K.A.; Montrose, M.H. Trefoil factor peptides and gastrointestinal function. Annu. Rev. Physiol. 2017, 79, 357–380. [Google Scholar] [CrossRef] [Green Version]
- Xue, H.; Lü, B.; Zhang, J.; Wu, M.; Huang, Q.; Wu, Q.; Sheng, H.; Wu, D.; Hu, J.; Lai, M. Identification of serum biomarkers for colorectal cancer metastasis using a differential secretome approach. J. Proteome Res. 2009, 9, 545–555. [Google Scholar] [CrossRef]
- Babyatsky, M.; Lin, J.; Yio, X.; Chen, A.; Zhang, J.Y.; Zheng, Y.; Twyman, C.; Bao, X.; Schwartz, M.; Thung, S.; et al. Trefoil factor-3 expression in human colon cancer liver metastasis. Clin. Exp. Metastasis 2009, 26, 143–151. [Google Scholar] [CrossRef] [PubMed]
- Thim, L.; May, F.E. Structure of mammalian trefoil factors and functional insights. Cell. Mol. Life Sci. 2005, 62, 2956–2973. [Google Scholar] [CrossRef] [PubMed]
- Albert, T.K.; Laubinger, W.; Müller, S.; Hanisch, F.G.; Kalinski, T.; Meyer, F.; Hoffmann, W. Human intestinal TFF3 forms disulfide-linked heteromers with the mucus-associated FCGBP protein and is released by hydrogen sulfide. J. Proteome Res. 2010, 9, 3108–3117. [Google Scholar] [CrossRef]
- Madsen, J.; Sorensen, G.L.; Nielsen, O.; Tornøe, I.; Thim, L.; Fenger, C.; Mollenhauer, J.; Holmskov, U. A variant form of the human deleted in malignant brain tumor 1 (DMBT1) gene shows increased expression in inflammatory bowel diseases and interacts with dimeric trefoil factor 3 (TFF3). PLoS ONE 2013, 8, e64441. [Google Scholar] [CrossRef] [Green Version]
- Poulsen, S.S.; Kissow, H.; Hare, K.; Hartmann, B.; Thim, L. Luminal and parenteral TFF2 and TFF3 dimer and monomer in two models of experimental colitis in the rat. Regul. Pept. 2005, 126, 163–171. [Google Scholar] [CrossRef]
- Lobie, P.E.; Pandey, V.; Kanchugarakoppal, S.R.; Basappa Chakrabhavi, D.M.; Rangappa, S. Compounds Useful in Inhibiting Human Trefoil Factor 3. Patent WO2018226155, 13 December 2018. [Google Scholar]
- Morito, K.; Nakamura, J.; Kitajima, Y.; Kai, K.; Tanaka, T.; Kubo, H.; Miyake, S.; Noshiro, H. The value of trefoil factor 3 expression in predicting the long-term outcome and early recurrence of colorectal cancer. Int. J. Oncol. 2015, 46, 563–568. [Google Scholar] [CrossRef]
- Casado, E.; Garcia, V.M.; Sánchez, J.J.; Gómez Del Pulgar, M.T.; Feliu, J.; Maurel, J.; Castelo, B.; Moreno Rubio, J.; López, R.A.; García-Cabezas, M.Á.; et al. Upregulation of trefoil factor 3 (TFF3) after rectal cancer chemoradiotherapy is an adverse prognostic factor and a potential therapeutic target. Int. J. Radiat. Oncol. Biol. Phys. 2012, 84, 1151–1158. [Google Scholar] [CrossRef]
- Kubens, B.; Zänker, K.S. Differences in the migration capacity of primary human colon carcinoma cells (SW480) and their lymph node metastatic derivatives (SW620). Cancer Lett. 1998, 131, 55–64. [Google Scholar] [CrossRef]
- Abdullah, L.N.; Chow, E.K.-H. Mechanisms of chemoresistance in cancer stem cells. Clin. Transl. Med. 2013, 2, 3. [Google Scholar] [CrossRef] [PubMed] [Green Version]
- Ahmed, N.; Abubaker, K.; Findlay, J.; Quinn, M. Epithelial mesenchymal transition and cancer stem cell-like phenotypes facilitate chemoresistance in recurrent ovarian cancer. Curr. Cancer Drug Targets 2010, 10, 268–278. [Google Scholar] [CrossRef] [PubMed]
- Shaheen, S.; Ahmed, M.; Lorenzi, F.; Nateri, A.S. Spheroid-formation (colonosphere) assay for in vitro assessment and expansion of stem cells in colon cancer. Stem Cell Rev. Rep. 2016, 12, 492–499. [Google Scholar] [CrossRef] [PubMed] [Green Version]
- Chong, Q.-Y.; You, M.L.; Pandey, V.; Banerjee, A.; Chen, Y.J.; Poh, H.M.; Zhang, M.; Ma, L.; Zhu, T.; Basappa, S.; et al. Release of HER2 repression of trefoil factor 3 (TFF3) expression mediates trastuzumab resistance in HER2+/ER+ mammary carcinoma. Oncotarget 2017, 8, 74188. [Google Scholar] [CrossRef] [PubMed] [Green Version]
- You, M.-L.; Chen, Y.J.; Chong, Q.Y.; Wu, M.M.; Pandey, V.; Chen, R.M.; Liu, L.; Ma, L.; Wu, Z.S.; Zhu, T.; et al. Trefoil factor 3 mediation of oncogenicity and chemoresistance in hepatocellular carcinoma is AKT-BCL-2 dependent. Oncotarget 2017, 8, 39323. [Google Scholar] [CrossRef]
- Douville, J.; Beaulieu, R.; Balicki, D. ALDH1 as a functional marker of cancer stem and progenitor cells. Stem Cells Dev. 2009, 18, 17–26. [Google Scholar] [CrossRef]
- Kannan, N.; Kang, J.; Kong, X.; Tang, J.; Perry, J.K.; Mohankumar, K.M.; Miller, L.D.; Liu, E.T.; Mertani, H.C.; Zhu, T.; et al. Trefoil factor 3 is oncogenic and mediates anti-estrogen resistance in human mammary carcinoma. Neoplasia 2010, 12, 1041–1053. [Google Scholar] [CrossRef] [Green Version]
- Kinoshita, K.; Taupin, D.R.; Itoh, H.; Podolsky, D.K. Distinct pathways of cell migration and antiapoptotic response to epithelial injury: Structure-function analysis of human intestinal trefoil factor. Mol. Cell. Biol. 2000, 20, 4680–4690. [Google Scholar] [CrossRef] [Green Version]
- Hammond, W.A.; Swaika, A.; Mody, K. Pharmacologic resistance in colorectal cancer: A review. Ther. Adv. Med. Oncol. 2016, 8, 57–84. [Google Scholar] [CrossRef] [Green Version]
- Lu, Y.-X.; Chen, D.L.; Wang, D.S.; Chen, L.Z.; Mo, H.Y.; Sheng, H.; Bai, L.; Wu, Q.N.; Yu, H.E.; Xie, D.; et al. Melatonin enhances sensitivity to fluorouracil in oesophageal squamous cell carcinoma through inhibition of Erk and Akt pathway. Cell Death Dis. 2016, 7, e2432. [Google Scholar] [CrossRef] [PubMed] [Green Version]
- Zanardi, E.; Bregni, G.; De Braud, F.; Di Cosimo, S. Better together: Targeted combination therapies in breast cancer. In Seminars in Oncology; Elsevier: Amsterdam, The Netherlands, 2015. [Google Scholar]
- Mohelnikova-Duchonova, B.; Melichar, B.; Soucek, P. FOLFOX/FOLFIRI pharmacogenetics: The call for a personalized approach in colorectal cancer therapy. World J. Gastroenterol. 2014, 20, 10316. [Google Scholar] [CrossRef] [PubMed]
- Seeber, A.; Gastl, G. Targeted Therapy of Colorectal Cancer. Oncol. Res. Treat. 2016, 39, 796–802. [Google Scholar] [CrossRef] [PubMed]
- Misale, S.; Di Nicolantonio, F.; Sartore-Bianchi, A.; Siena, S.; Bardelli, A. Resistance to anti-EGFR therapy in colorectal cancer: From heterogeneity to convergent evolution. Cancer Discov. 2014, 4, 1269–1280. [Google Scholar] [CrossRef] [Green Version]
- Bae, J.M.; Kim, J.H.; Kang, G.H. Molecular subtypes of colorectal cancer and their clinicopathologic features, with an emphasis on the serrated neoplasia pathway. Arch. Pathol. Lab. Med. 2016, 140, 406–412. [Google Scholar] [CrossRef] [PubMed] [Green Version]
- Thanki, K.; Nicholls, M.E.; Gajjar, A.; Senagore, A.J.; Qiu, S.; Szabo, C.; Hellmich, M.R.; Chao, C. Consensus Molecular Subtypes of Colorectal Cancer and their Clinical Implications. Int. Biol. Biomed. J. 2017, 3, 105–111. [Google Scholar] [PubMed]
- Yio, X.; Zhang, J.Y.; Babyatsky, M.; Chen, A.; Lin, J.; Fan, Q.X.; Werther, J.L.; Itzkowitz, S. Trefoil factor family-3 is associated with aggressive behavior of colon cancer cells. Clin. Exp. Metastasis 2005, 22, 157–165. [Google Scholar] [CrossRef]
- Vocka, M.; Langer, D.; Petrtyl, J.; Vockova, P.; Hanus, T.; Kalousova, M.; Zima, T.; Petruzelka, L. Trefoil factor family (TFF) proteins as potential serum biomarkers in patients with metastatic colorectal cancer. Neoplasma 2015, 62, 470–477. [Google Scholar] [CrossRef] [Green Version]
- Huang, Y.-G.; Li, Y.F.; Wang, L.P.; Zhang, Y. Aberrant expression of trefoil factor 3 is associated with colorectal carcinoma metastasis. J. Cancer Res. Ther. 2013, 9, 376. [Google Scholar] [CrossRef]
- John, R.; El-Rouby, N.M.; Tomasetto, C.; Rio, M.C.; Karam, S.M. Expression of TFF3 during multistep colon carcinogenesis. Histol. Histopathol. 2007, 22, 743–752. [Google Scholar]
- Uchino, H.; Kataoka, H.; Itoh, H.; Hamasuna, R.; Koono, M. Overexpression of intestinal trefoil factor in human colon carcinoma cells reduces cellular growth in vitro and in vivo. Gastroenterology 2000, 118, 60–69. [Google Scholar] [CrossRef]
- Uchino, H.; Kataoka, H.; Itoh, H.; Koono, M. Expression of intestinal trefoil factor mRNA is downregulated during progression of colorectal carcinomas. J. Clin. Pathol. 1997, 50, 932–934. [Google Scholar] [CrossRef] [PubMed]
- Perera, O.; Evans, A.; Pertziger, M.; MacDonald, C.; Chen, H.; Liu, D.X.; Lobie, P.E.; Perry, J.K. Trefoil factor 3 (TFF3) enhances the oncogenic characteristics of prostate carcinoma cells and reduces sensitivity to ionising radiation. Cancer Lett. 2015, 361, 104–111. [Google Scholar] [CrossRef]
- Shi, H.-S.; Zhu, W.L.; Liu, J.F.; Luo, Y.X.; Si, J.J.; Wang, S.J.; Xue, Y.X.; Ding, Z.B.; Shi, J.; Lu, L. PI3K/Akt signaling pathway in the basolateral amygdala mediates the rapid antidepressant-like effects of trefoil factor 3. Neuropsychopharmacology 2012, 37, 2671. [Google Scholar] [CrossRef] [PubMed]
- Baus-Loncar, M.; Giraud, A.S. Multiple regulatory pathways for trefoil factor (TFF) genes. Cell. Mol. Life Sci. 2005, 62, 2921–2931. [Google Scholar] [CrossRef] [PubMed]
- Pandey, V.; Wu, Z.S.; Zhang, M.; Li, R.; Zhang, J.; Zhu, T.; Lobie, P.E. Trefoil factor 3 promotes metastatic seeding and predicts poor survival outcome of patients with mammary carcinoma. Breast Cancer Res. 2014, 16, 429. [Google Scholar] [CrossRef] [Green Version]
- Keerthy, H.K.; Garg, M.; Mohan, C.D.; Madan, V.; Kanojia, D.; Shobith, R.; Nanjundaswamy, S.; Mason, D.J.; Bender, A.; Basappa; et al. Synthesis and characterization of novel 2-amino-chromene-nitriles that target Bcl-2 in acute myeloid leukemia cell lines. PLoS ONE 2014, 9, e107118. [Google Scholar] [CrossRef] [Green Version]
- Pandey, V.; Perry, J.K.; Mohankumar, K.M.; Kong, X.J.; Liu, S.M.; Wu, Z.S.; Mitchell, M.D.; Zhu, T.; Lobie, P.E. Autocrine human growth hormone stimulates oncogenicity of endometrial carcinoma cells. Endocrinology 2008, 149, 3909–3919. [Google Scholar] [CrossRef] [Green Version]


© 2019 by the authors. Licensee MDPI, Basel, Switzerland. This article is an open access article distributed under the terms and conditions of the Creative Commons Attribution (CC BY) license (http://creativecommons.org/licenses/by/4.0/).
Share and Cite
Chen, R.-M.; Chiou, Y.-S.; Chong, Q.-Y.; Poh, H.-M.; Tan, T.-Z.; Zhang, M.-Y.; Ma, L.; Zhu, T.; Pandey, V.; Basappa; et al. Pharmacological Inhibition of TFF3 Enhances Sensitivity of CMS4 Colorectal Carcinoma to 5-Fluorouracil through Inhibition of p44/42 MAPK. Int. J. Mol. Sci. 2019, 20, 6215. https://0-doi-org.brum.beds.ac.uk/10.3390/ijms20246215
Chen R-M, Chiou Y-S, Chong Q-Y, Poh H-M, Tan T-Z, Zhang M-Y, Ma L, Zhu T, Pandey V, Basappa, et al. Pharmacological Inhibition of TFF3 Enhances Sensitivity of CMS4 Colorectal Carcinoma to 5-Fluorouracil through Inhibition of p44/42 MAPK. International Journal of Molecular Sciences. 2019; 20(24):6215. https://0-doi-org.brum.beds.ac.uk/10.3390/ijms20246215
Chicago/Turabian StyleChen, Ru-Mei, Yi-Shiou Chiou, Qing-Yun Chong, Han-Ming Poh, Tuan-Zea Tan, Meng-Yi Zhang, Lan Ma, Tao Zhu, Vijay Pandey, Basappa, and et al. 2019. "Pharmacological Inhibition of TFF3 Enhances Sensitivity of CMS4 Colorectal Carcinoma to 5-Fluorouracil through Inhibition of p44/42 MAPK" International Journal of Molecular Sciences 20, no. 24: 6215. https://0-doi-org.brum.beds.ac.uk/10.3390/ijms20246215