Figure 1.
Schematic drawing of the intron-exon structure of TERF1 genomic locus. Not drawn to scale. E1–E11 represent the exons, including exon 9 (red) which is found in the new isoform, described in this manuscript. E9 and E7 (green) are absent in the PIN2 splice variant while TERF1 lacks E9 only. The colored arrows indicate the location of the primer (blue, forward primer and red, reverse primer) which were used to amplify the three TERF1 splice variants in a single PCR reaction (hmsFor and hmsRev, respectively).
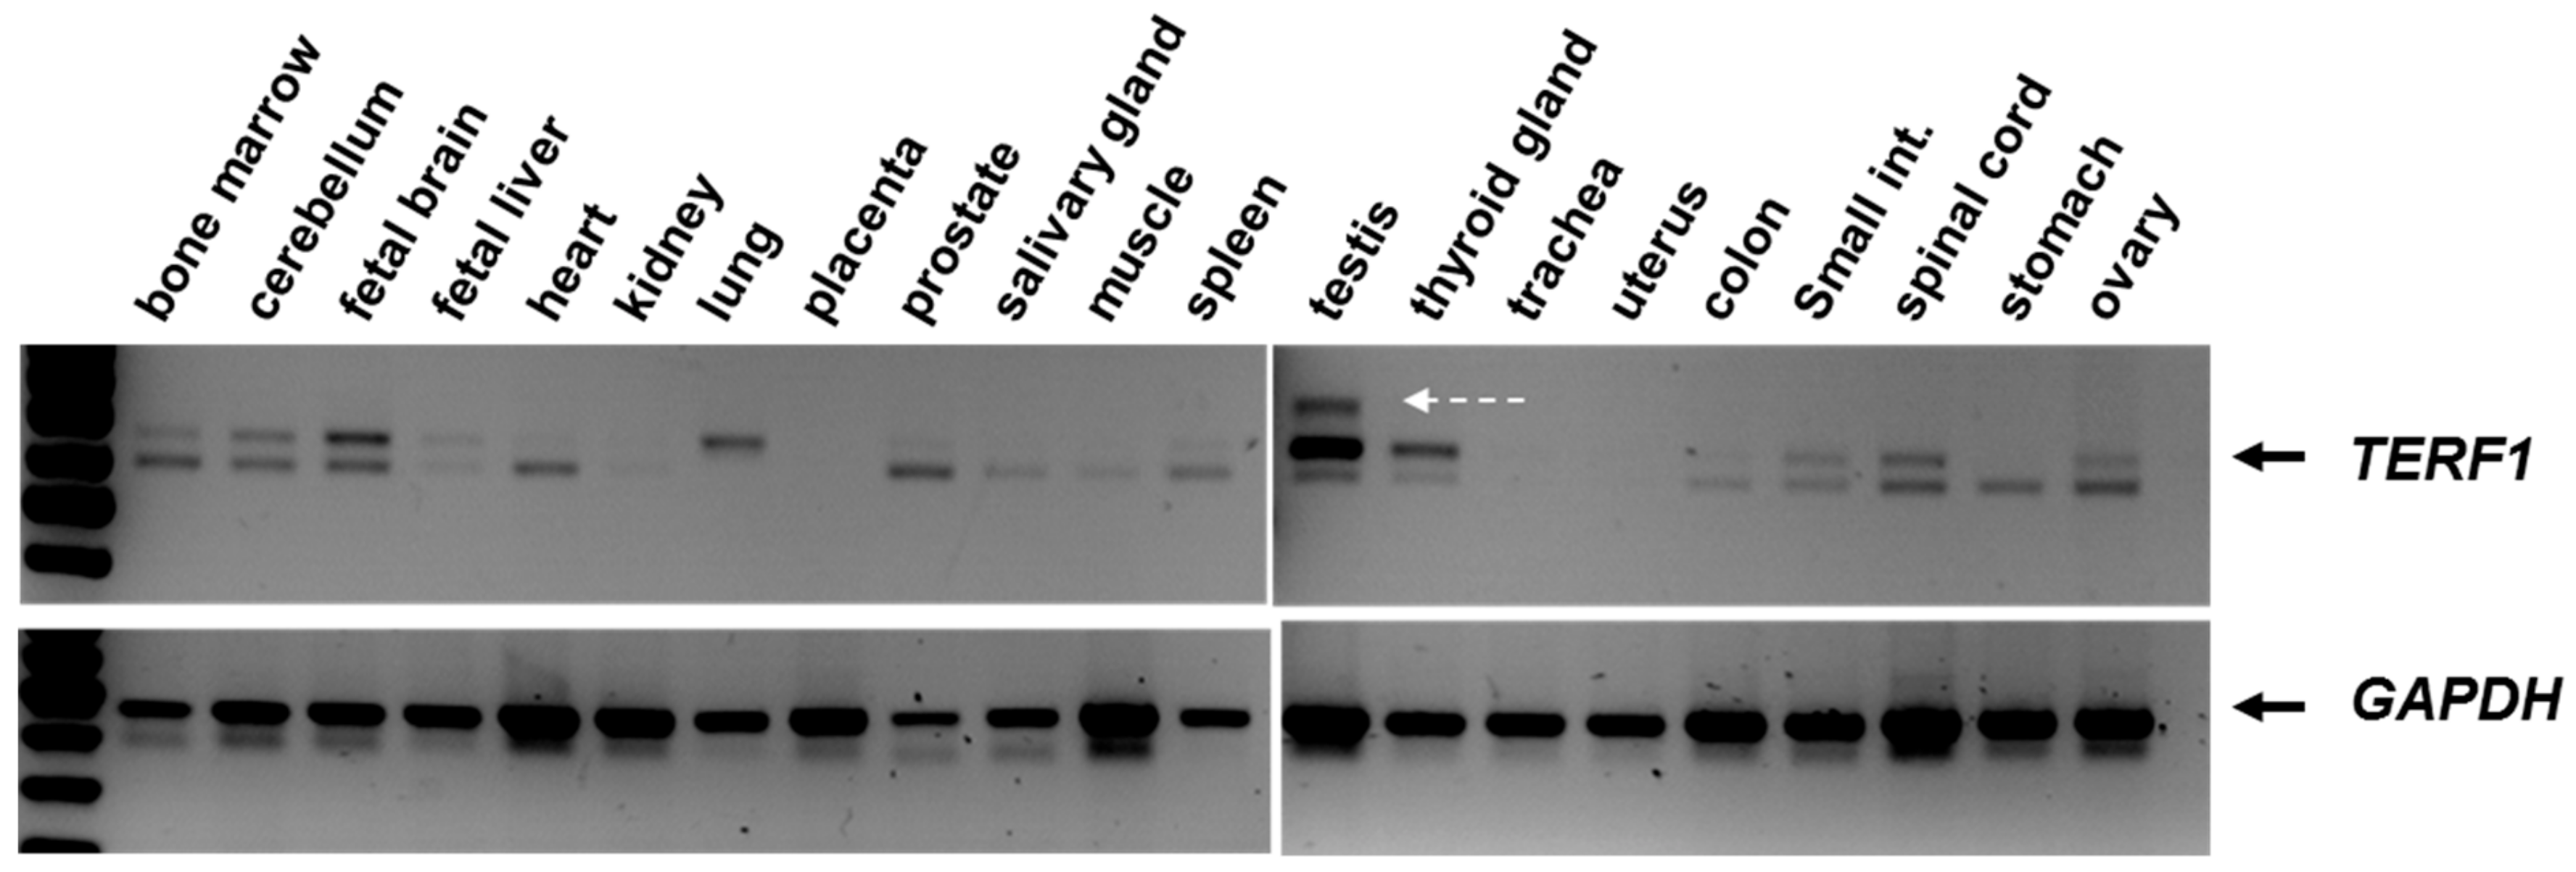
Figure 2.
Semi-quantitative PCR analysis showing the
TERF1 splice variants (top) and
GAPDH products (bottom). White arrow indicates the additional PCR product in the testis sample. PCR reaction was performed using the primer pair indicated in
Figure 1. Of note, we observed variations in TERF1 and PIN2 splice variants among the tissues (e.g., absence of TERF1 in the stomach or absence of PIN2 in the lung tissue). Please also note that
TERF1/PIN2 mRNAs are not visible in the presented figure due to low signal intensity, although both splice variants are expressed in these tissues.
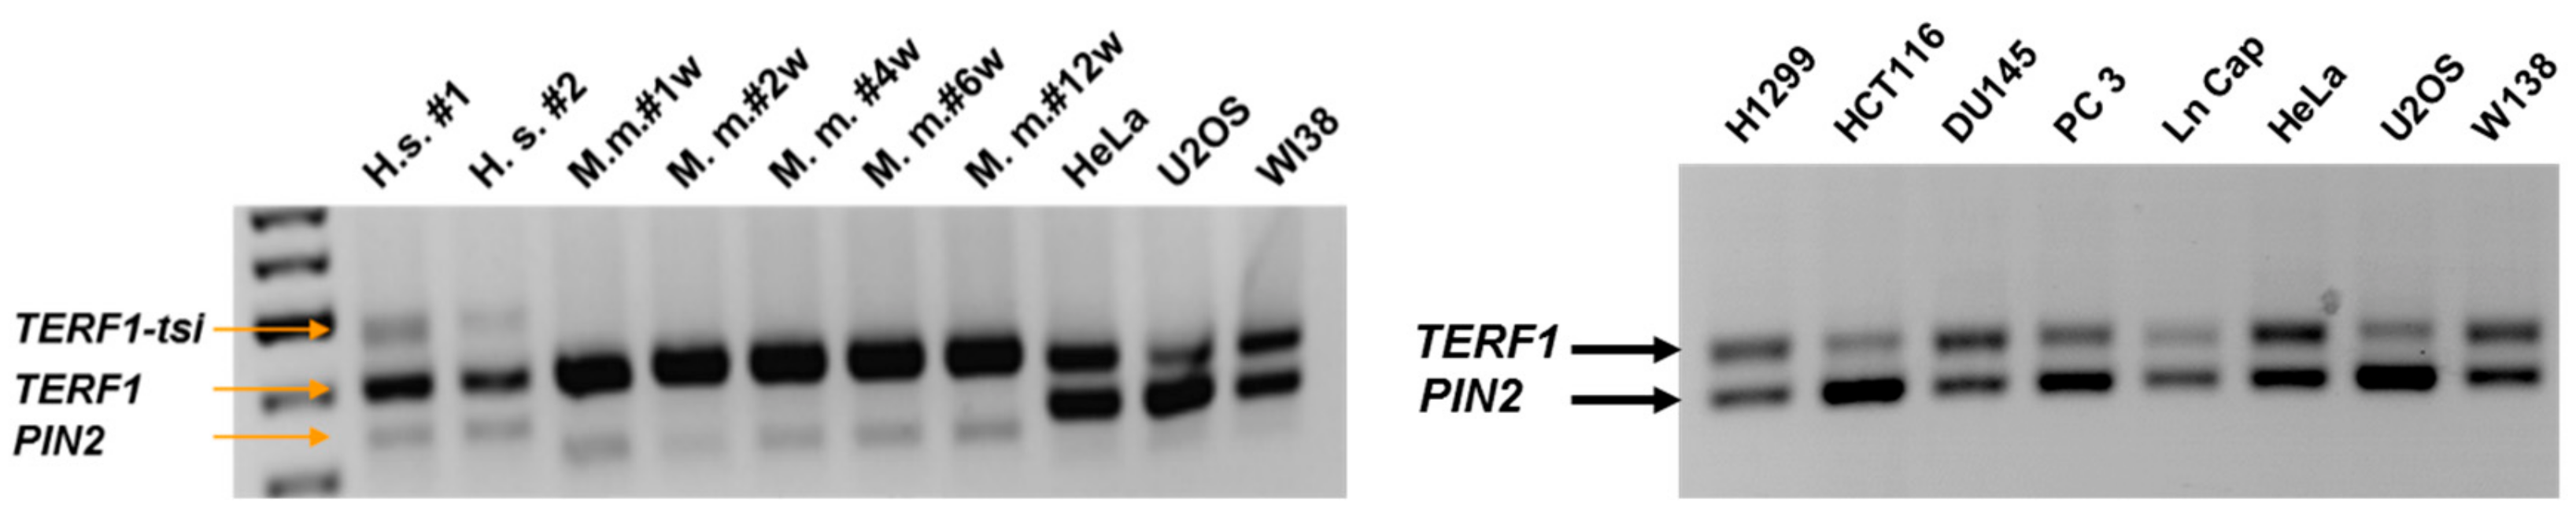
Figure 3.
Semi-quantitative PCR showing expression of the
TERF1 splice variants in human and mouse testes and human cell lines. PCR reaction was performed using the primer pair indicated in
Figure 1. Of note, we observed higher
PIN2 mRNA levels in the human cell lines in comparison to
TERF1, while
TERF1-tsi was not detectable in these cell lines. Also, note that the mouse
Pin2 is shorter compared to human
PIN2. (Left) Human testis samples (H.s. #1 and H.s. #2), testis samples from mice (1, 2, 4, 6, and 12 weeks post-partum) and human cell lines are indicated. (Right) An independent RT-PCR reaction was performed using total RNA from indicated human cancer cell lines and the human primary cell strain WI38.
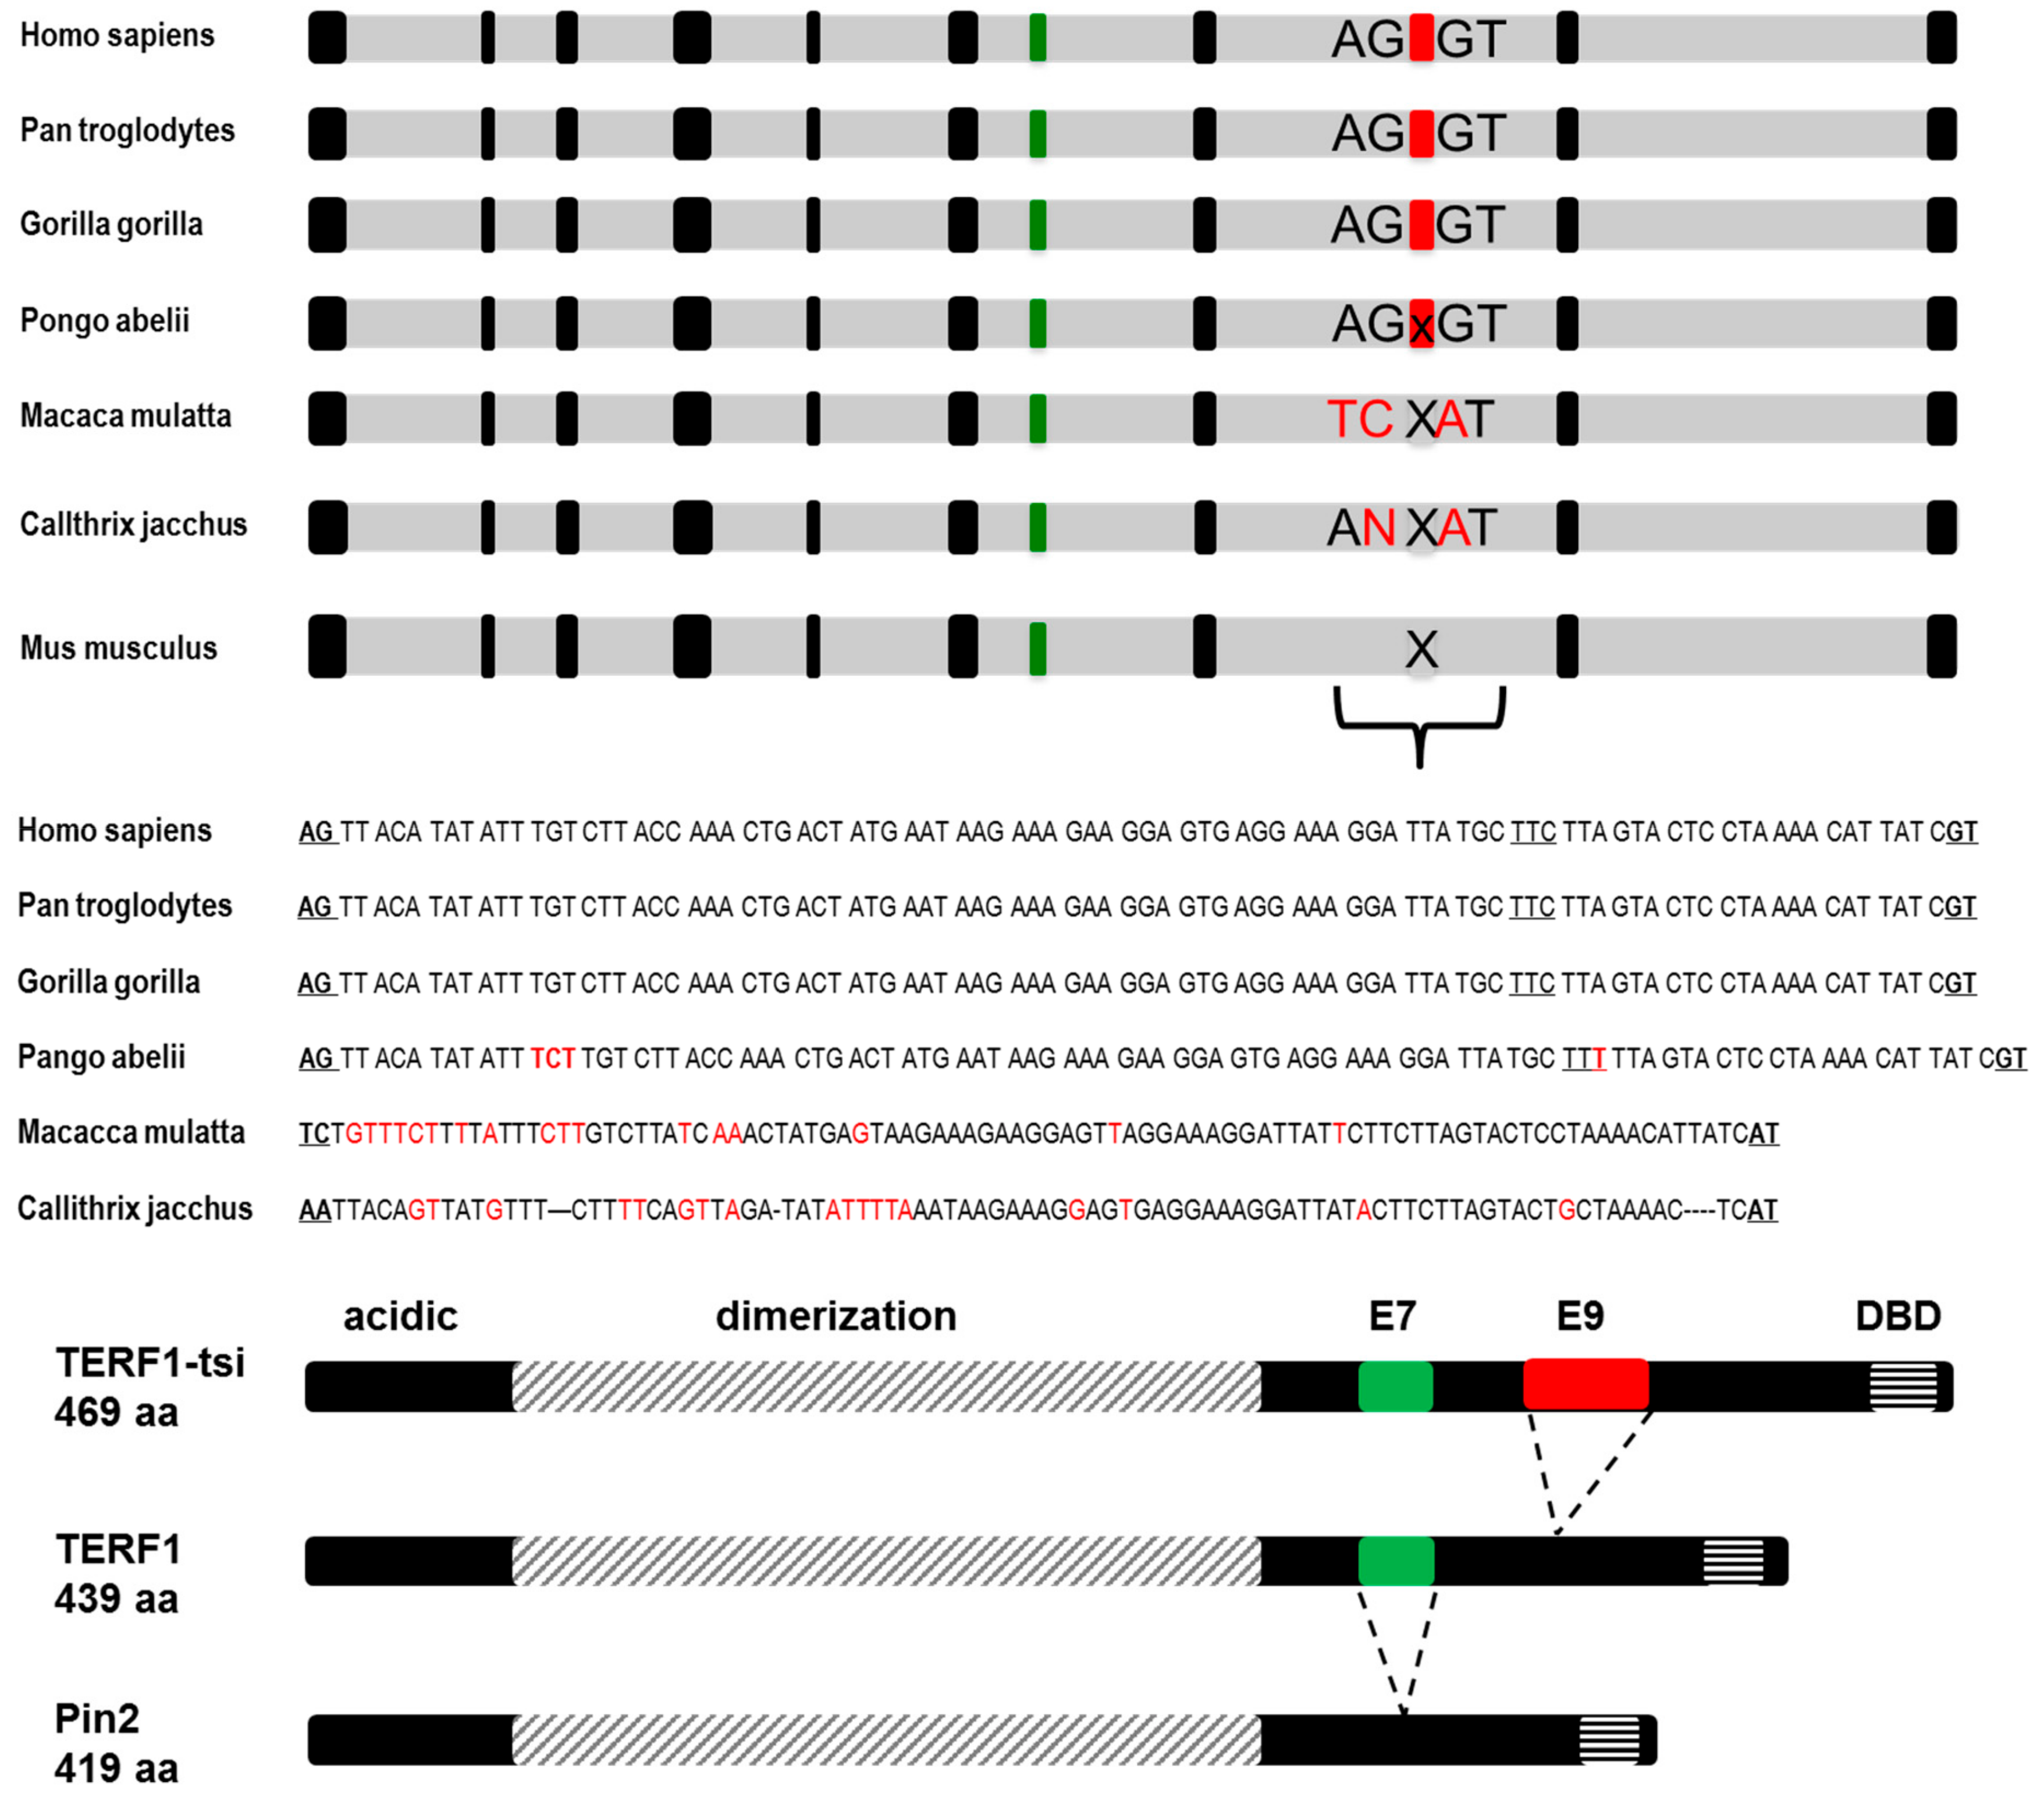
Figure 4.
TERF1-tsi encompasses an evolutionarily conserved novel exon, exon 9. (Top) Schematic drawing of the intron-exon structure of TERF1 genomic locus. Not drawn to scale. Exons 7 (green) and 9 (red) are color-indicated by the red rectangle. The lower-case x in the red rectangle (P. abelii) indicates high sequence similarity to human exon 9 whereas the upper-case X indicates strong sequence variation in this region. (Middle) Exon 9 and conserved AG-GT intron-exon junction target sequences of human, chimpanzee, gorilla, orang-utan are indicated in bold and underlined, along with the corresponding genomic regions of macaca and callithrix. Sequences varying from the conserved exon sequences are shown in red color. Of note, P.a. (orang utan) exon 9 has an additional triplet and thus an additional amino acid while keeping the reading frame. Moreover, there is a difference at the third Wobble position (C in human, chimpanzee, and gorilla versus T in orang utan) in the underlined triplet (red color) without a consequence of amino acid change (shown in red). The triplets encoding the amino acids are indicated. Please note that the first two and the last nucleotides of exon 9 are aligned to be in frame with TERF1 amino acid sequence. (Bottom) Drawing indicating the conserved domains of TERF1 splice variants. The N-terminal acidic domain, the dimerization domain, and the DNA-binding domain (DBD) are shown. In addition, exon 7 (E7), which is missing in PIN2, and exon 9 (E9), which is only present in TERF1-tsi, are indicated by a green or a red rectangle, respectively.
![Ijms 21 00085 g004]()
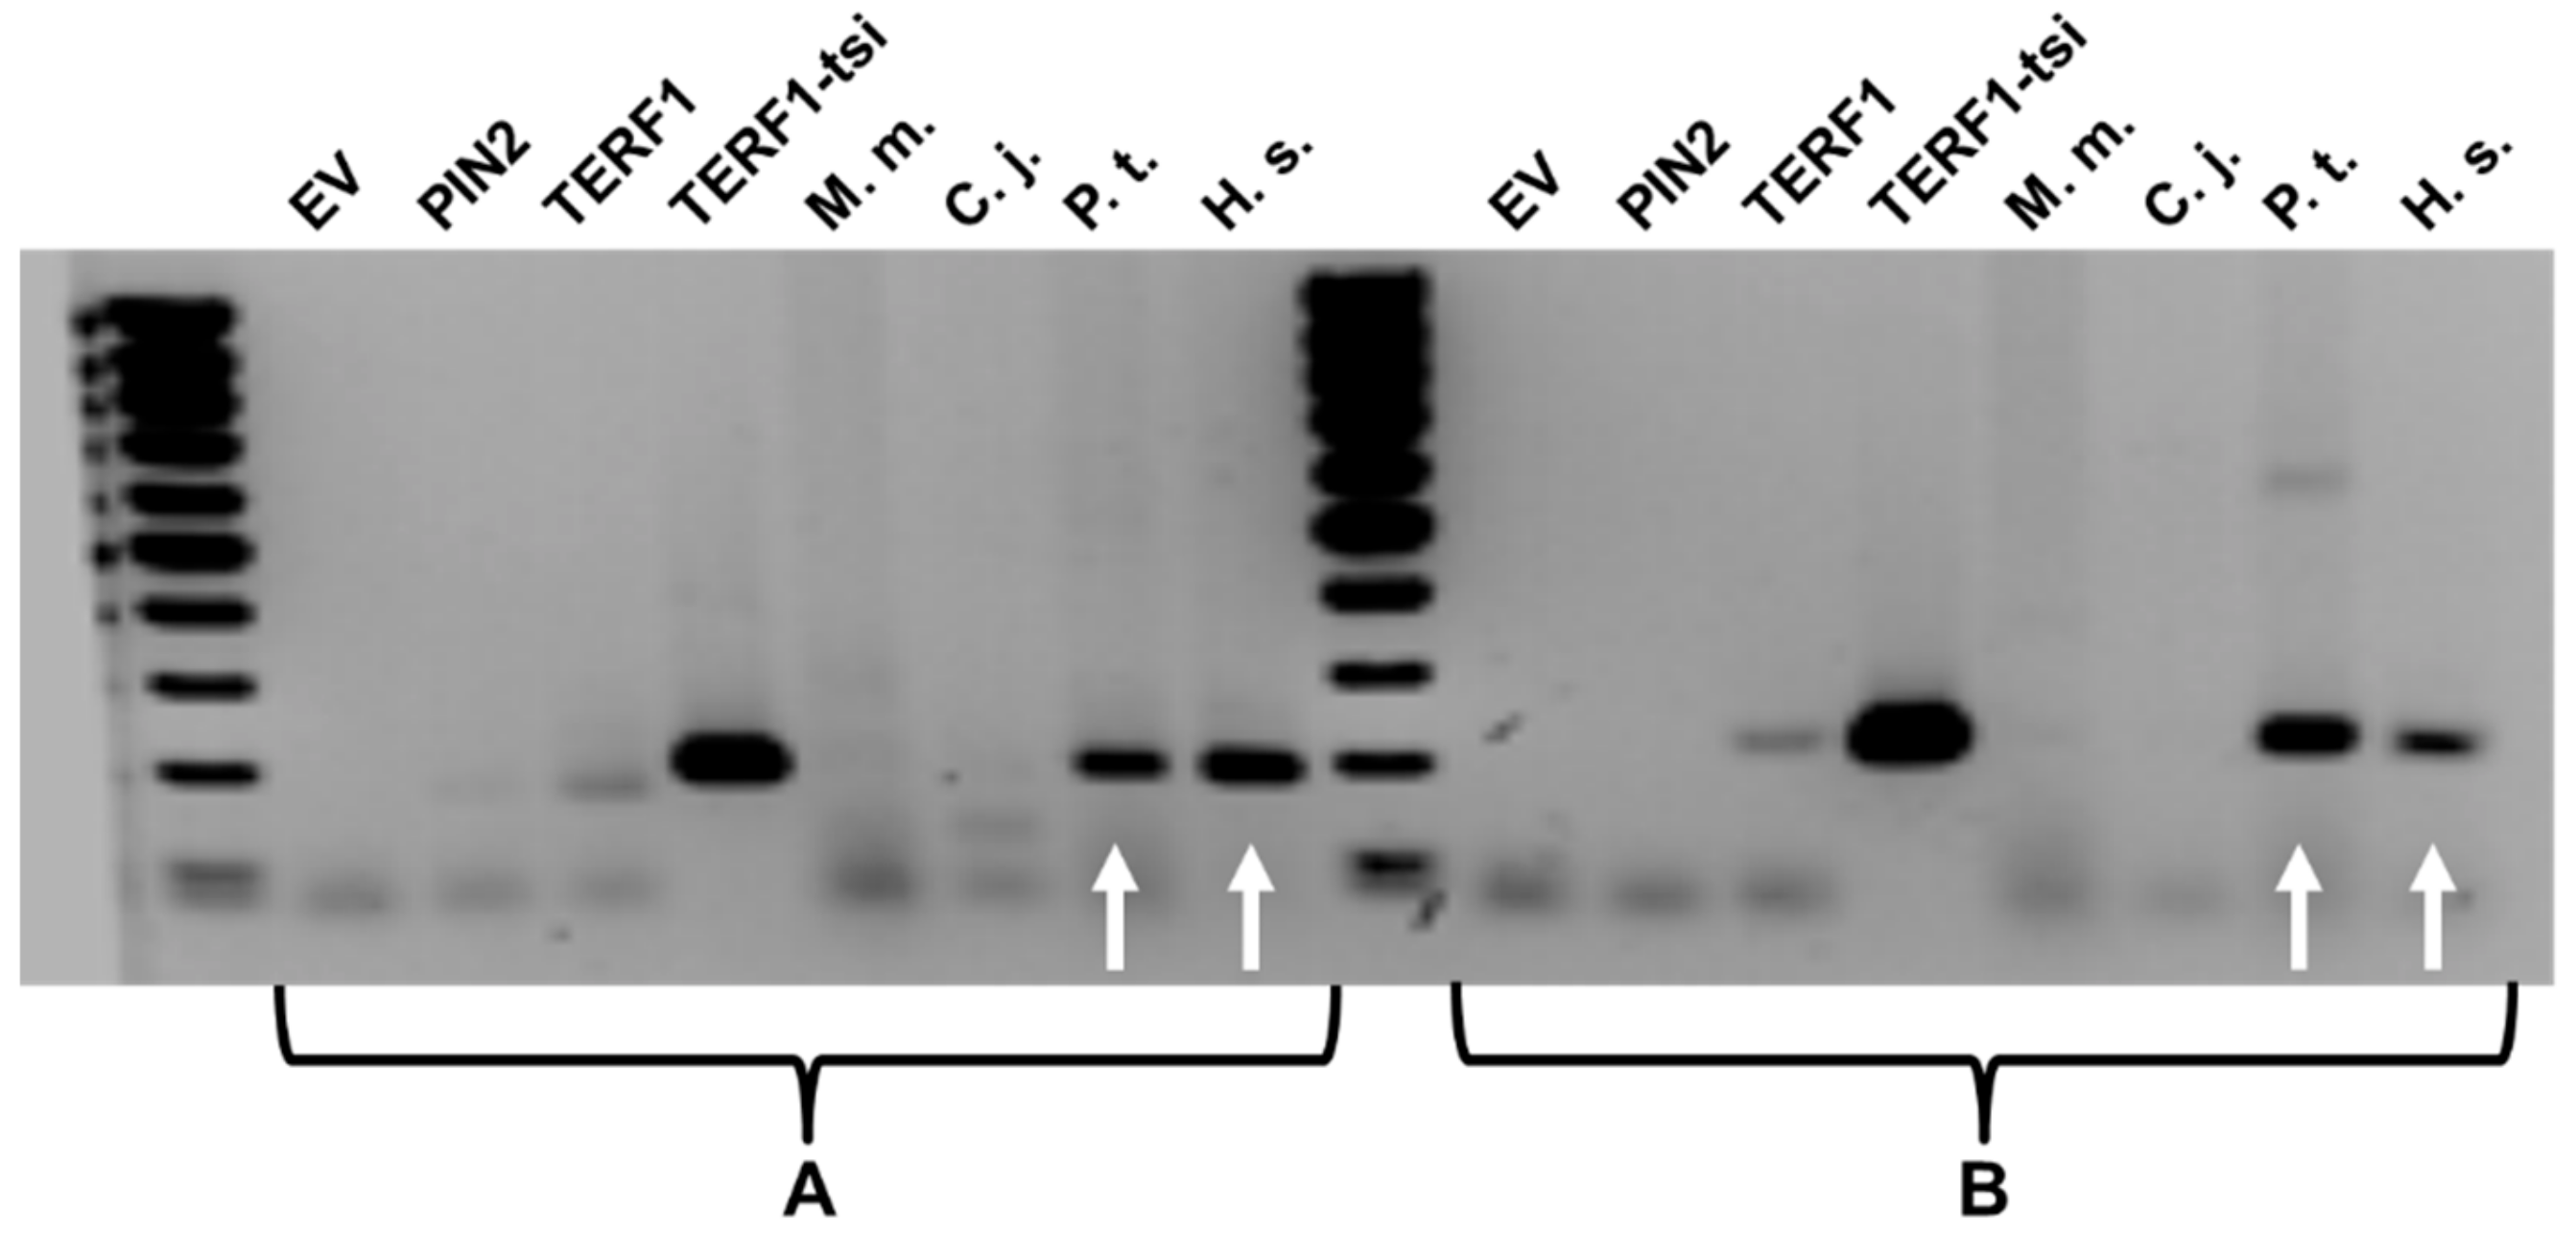
Figure 5.
TERF1-tsi expression is observed in human and chimpanzee testis samples. Results from the semi-quantitative PCR showing the TERF1-tsi expression in testis samples from M. musculus (M.m.), C. jacchus (C.j.), P. troglodyetes (P.t.) and H. sapiens (H.s.). Please note that testis samples were not available from G. gorilla and P. abelii. PCR reaction was performed using two different TERF1-tsi specific primer pairs, primer pair A (left) and primer pair B (right), respectively. Plasmid DNA with cloned PIN2, TERF1, or TERF-tsi cDNA as well as empty vector (EV), were used to control the specificity of the primer. Due to high plasmid DNA concentrations used for the positive control PCR reactions, weak, non-specific PCR products were also visible with the TERF1 cDNA. White arrows indicate TERF1-tsi expression in human (H.s.) and chimpanzee (P.t) testis samples.
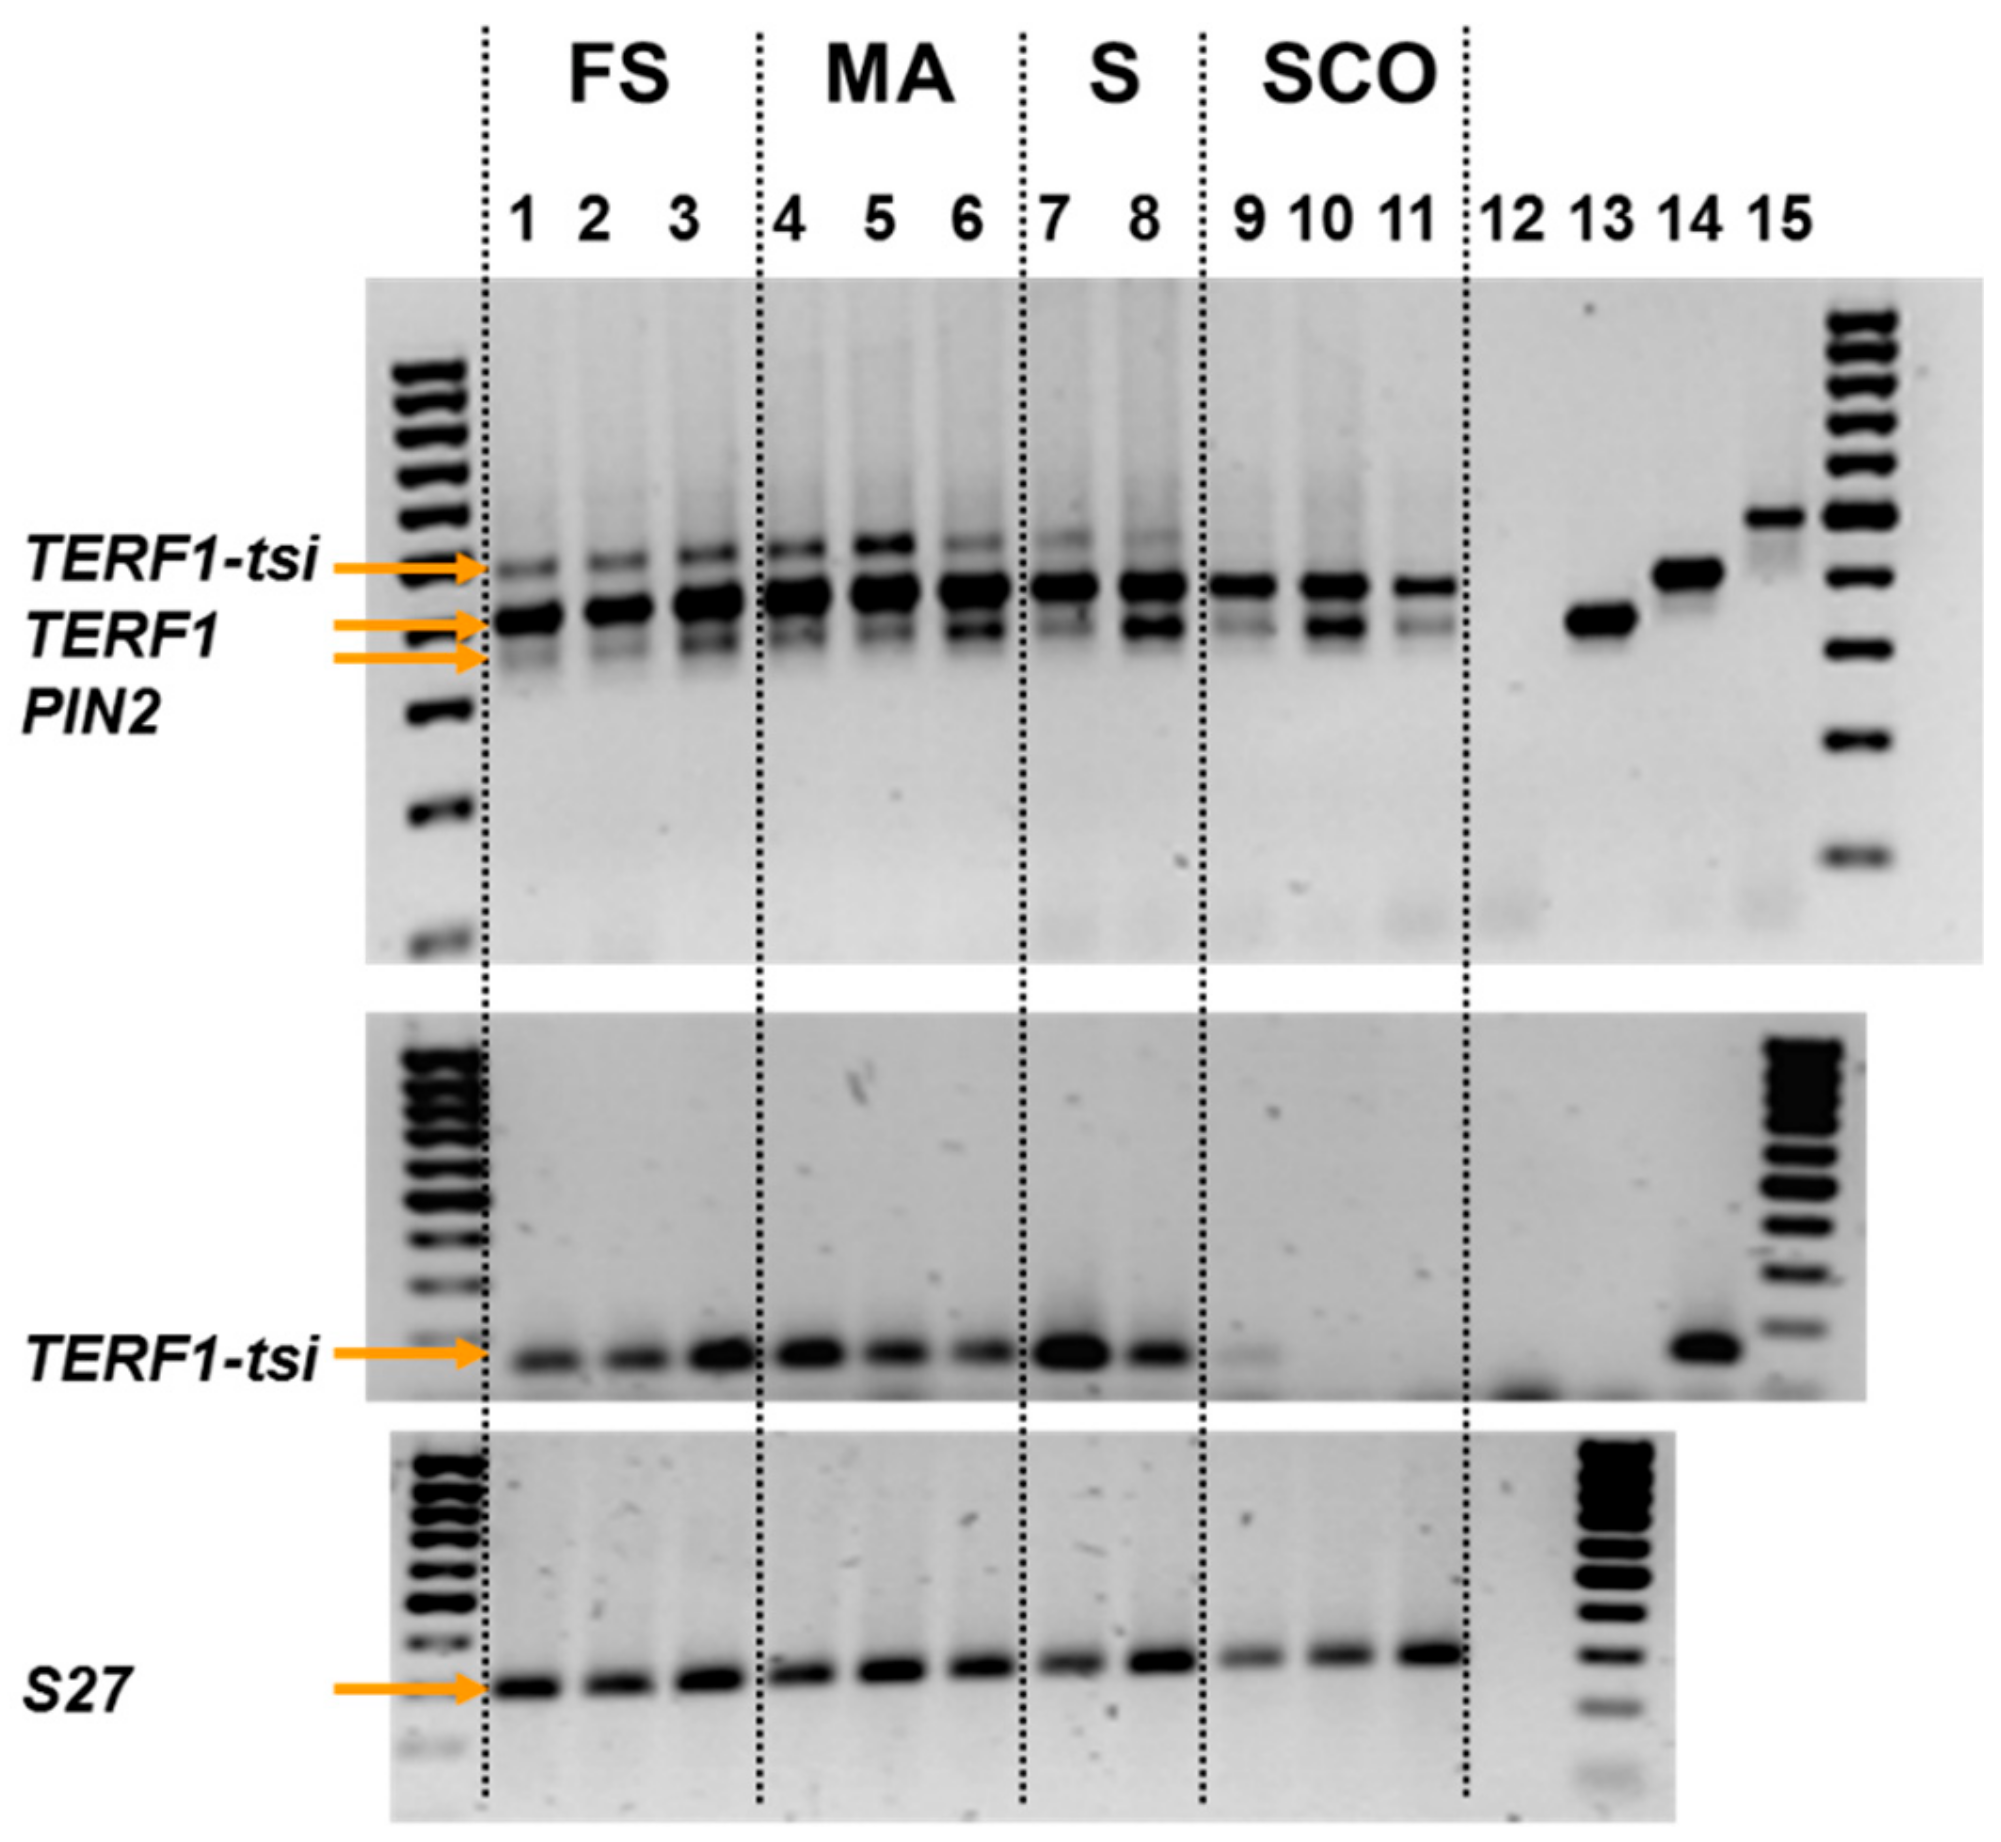
Figure 6.
TERF1-tsi expression in pathological human testis samples. Semi-quantitative PCR. RNA was isolated from the indicated samples (FS: full spermatogenesis; MA: meiotic arrest; S: spermatogonia only; SCO: Sertoli cells only) and RT-PCR was performed. Plasmid DNA with cloned PIN2, TERF1, or TERF-tsi cDNA, as well as an empty vector, were used to control the specificity of the primer. Numbers 12–15 indicate vector controls (12: empty vector; 13: PIN2-vector; 14: TERF1 vector; and 15: TERF1-tsi vector). PCR reaction was performed using a pan-TERF1 primer (top) or a TERF1-tsi specific primer. Please note that the PIN2 and TERF1 vector controls were left out here. Numbers 12–14 indicate controls (12: H2O; 13: empty vector; 14: TERF1-tsi vector) (middle). Expression of the ribosomal gene S27 was used as a control (bottom). Please note that all vector controls were left out here. Number 12 indicates H2O control.
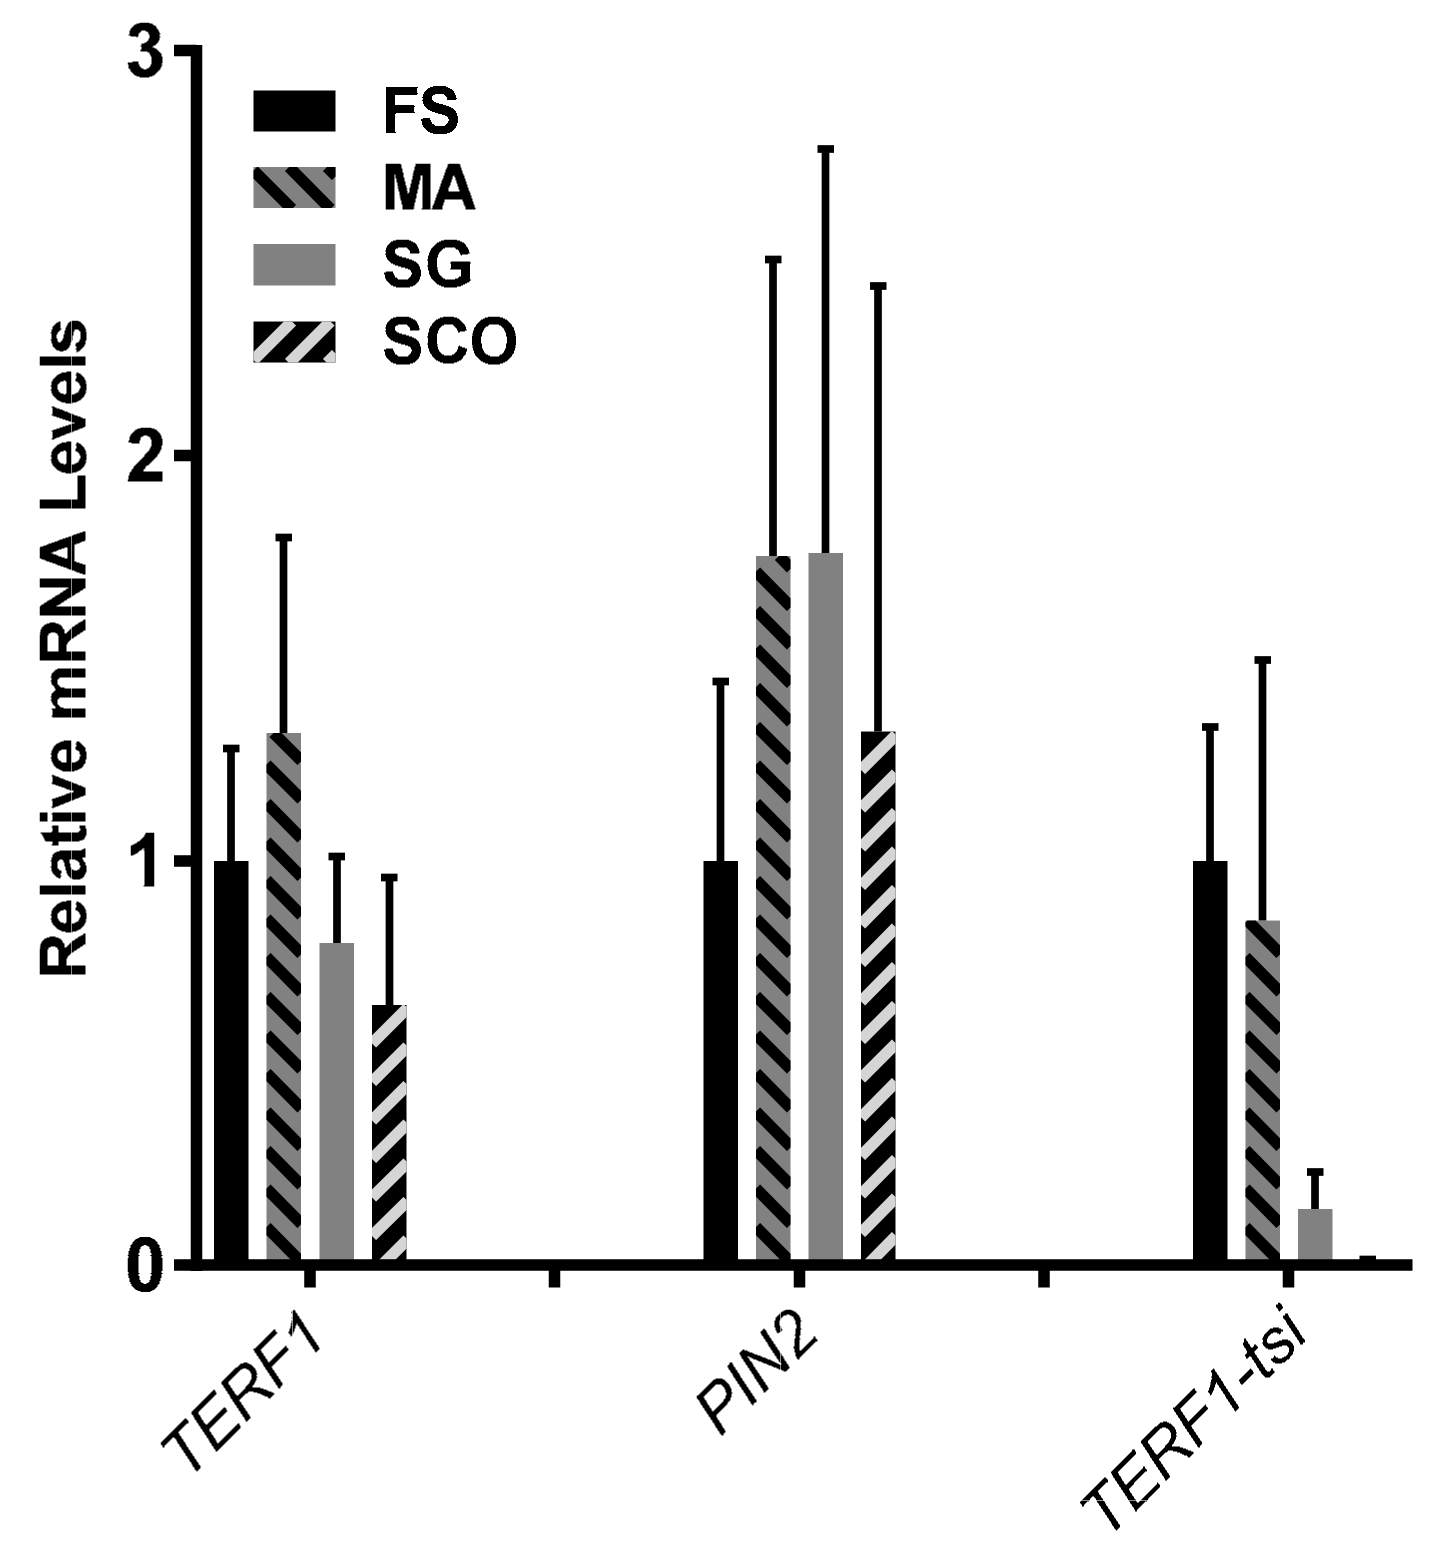
Figure 7.
TERF1-tsi expression in pathological human testis samples. Real-time quantitative RT-PCR. RT-qPCR with isoform-specific primer pairs indicate the absence of TERF1-tsi in Sertoli cells. The same samples as in
Figure 6 were analyzed in this experiment. Please note the absence of TERF1-tsi in the SCO samples. Also interesting is the relatively low expression of TERF1-tsi in SG samples. Real-time RT-PCR were mean values from two independent experiments with three technical replicates each. Error bars show mean of standard deviation (SD).
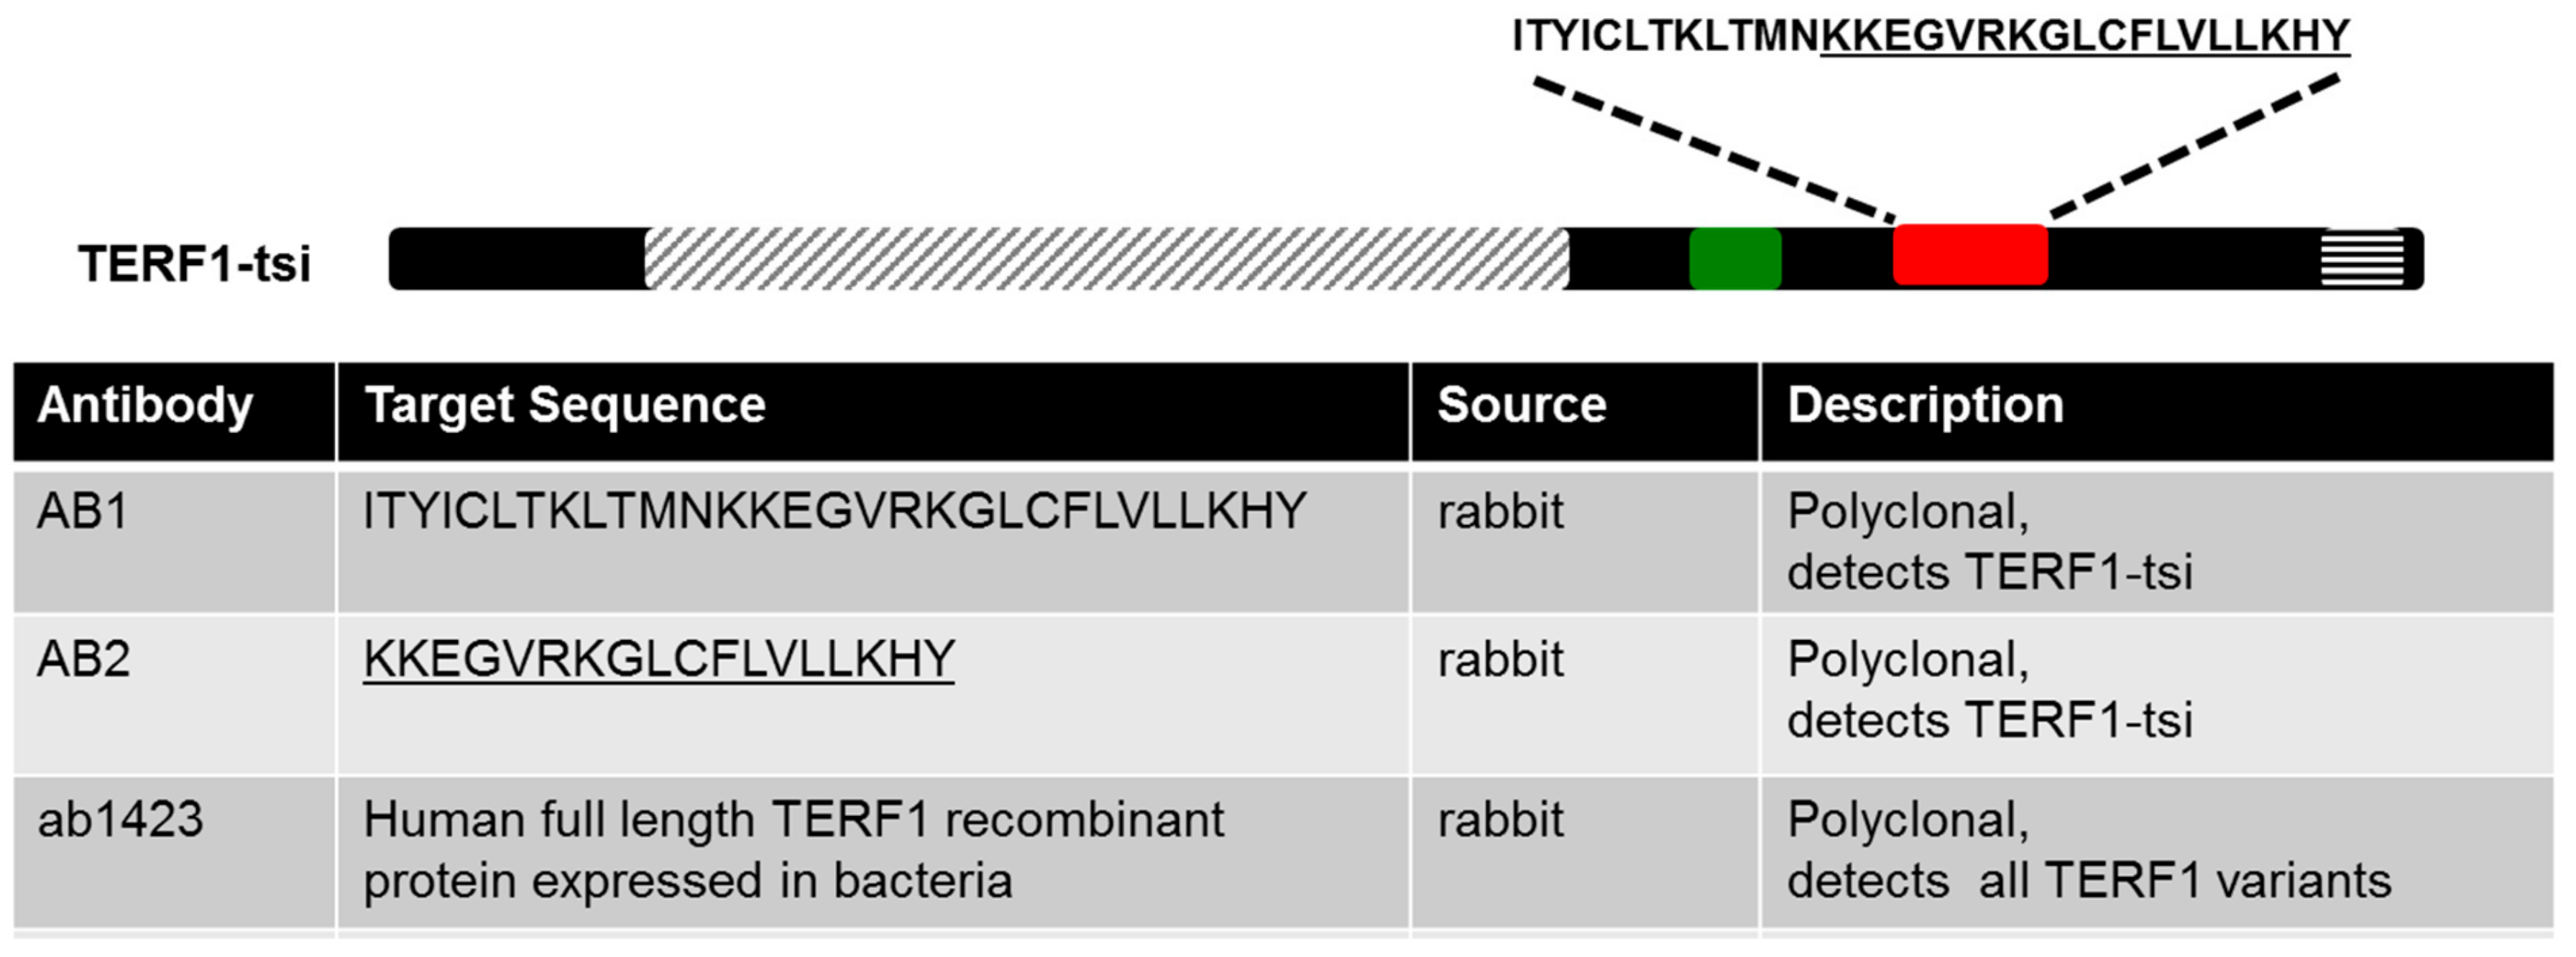
Figure 8.
Anti-TERF1 antibodies used in this study. AB1 was raised against the full exon 9, and AB2 was raised against the underlined amino acids in exon 9 (red box). Ab1423 was purchased from Abcam. Green box indicates exon 7.
Figure 8.
Anti-TERF1 antibodies used in this study. AB1 was raised against the full exon 9, and AB2 was raised against the underlined amino acids in exon 9 (red box). Ab1423 was purchased from Abcam. Green box indicates exon 7.
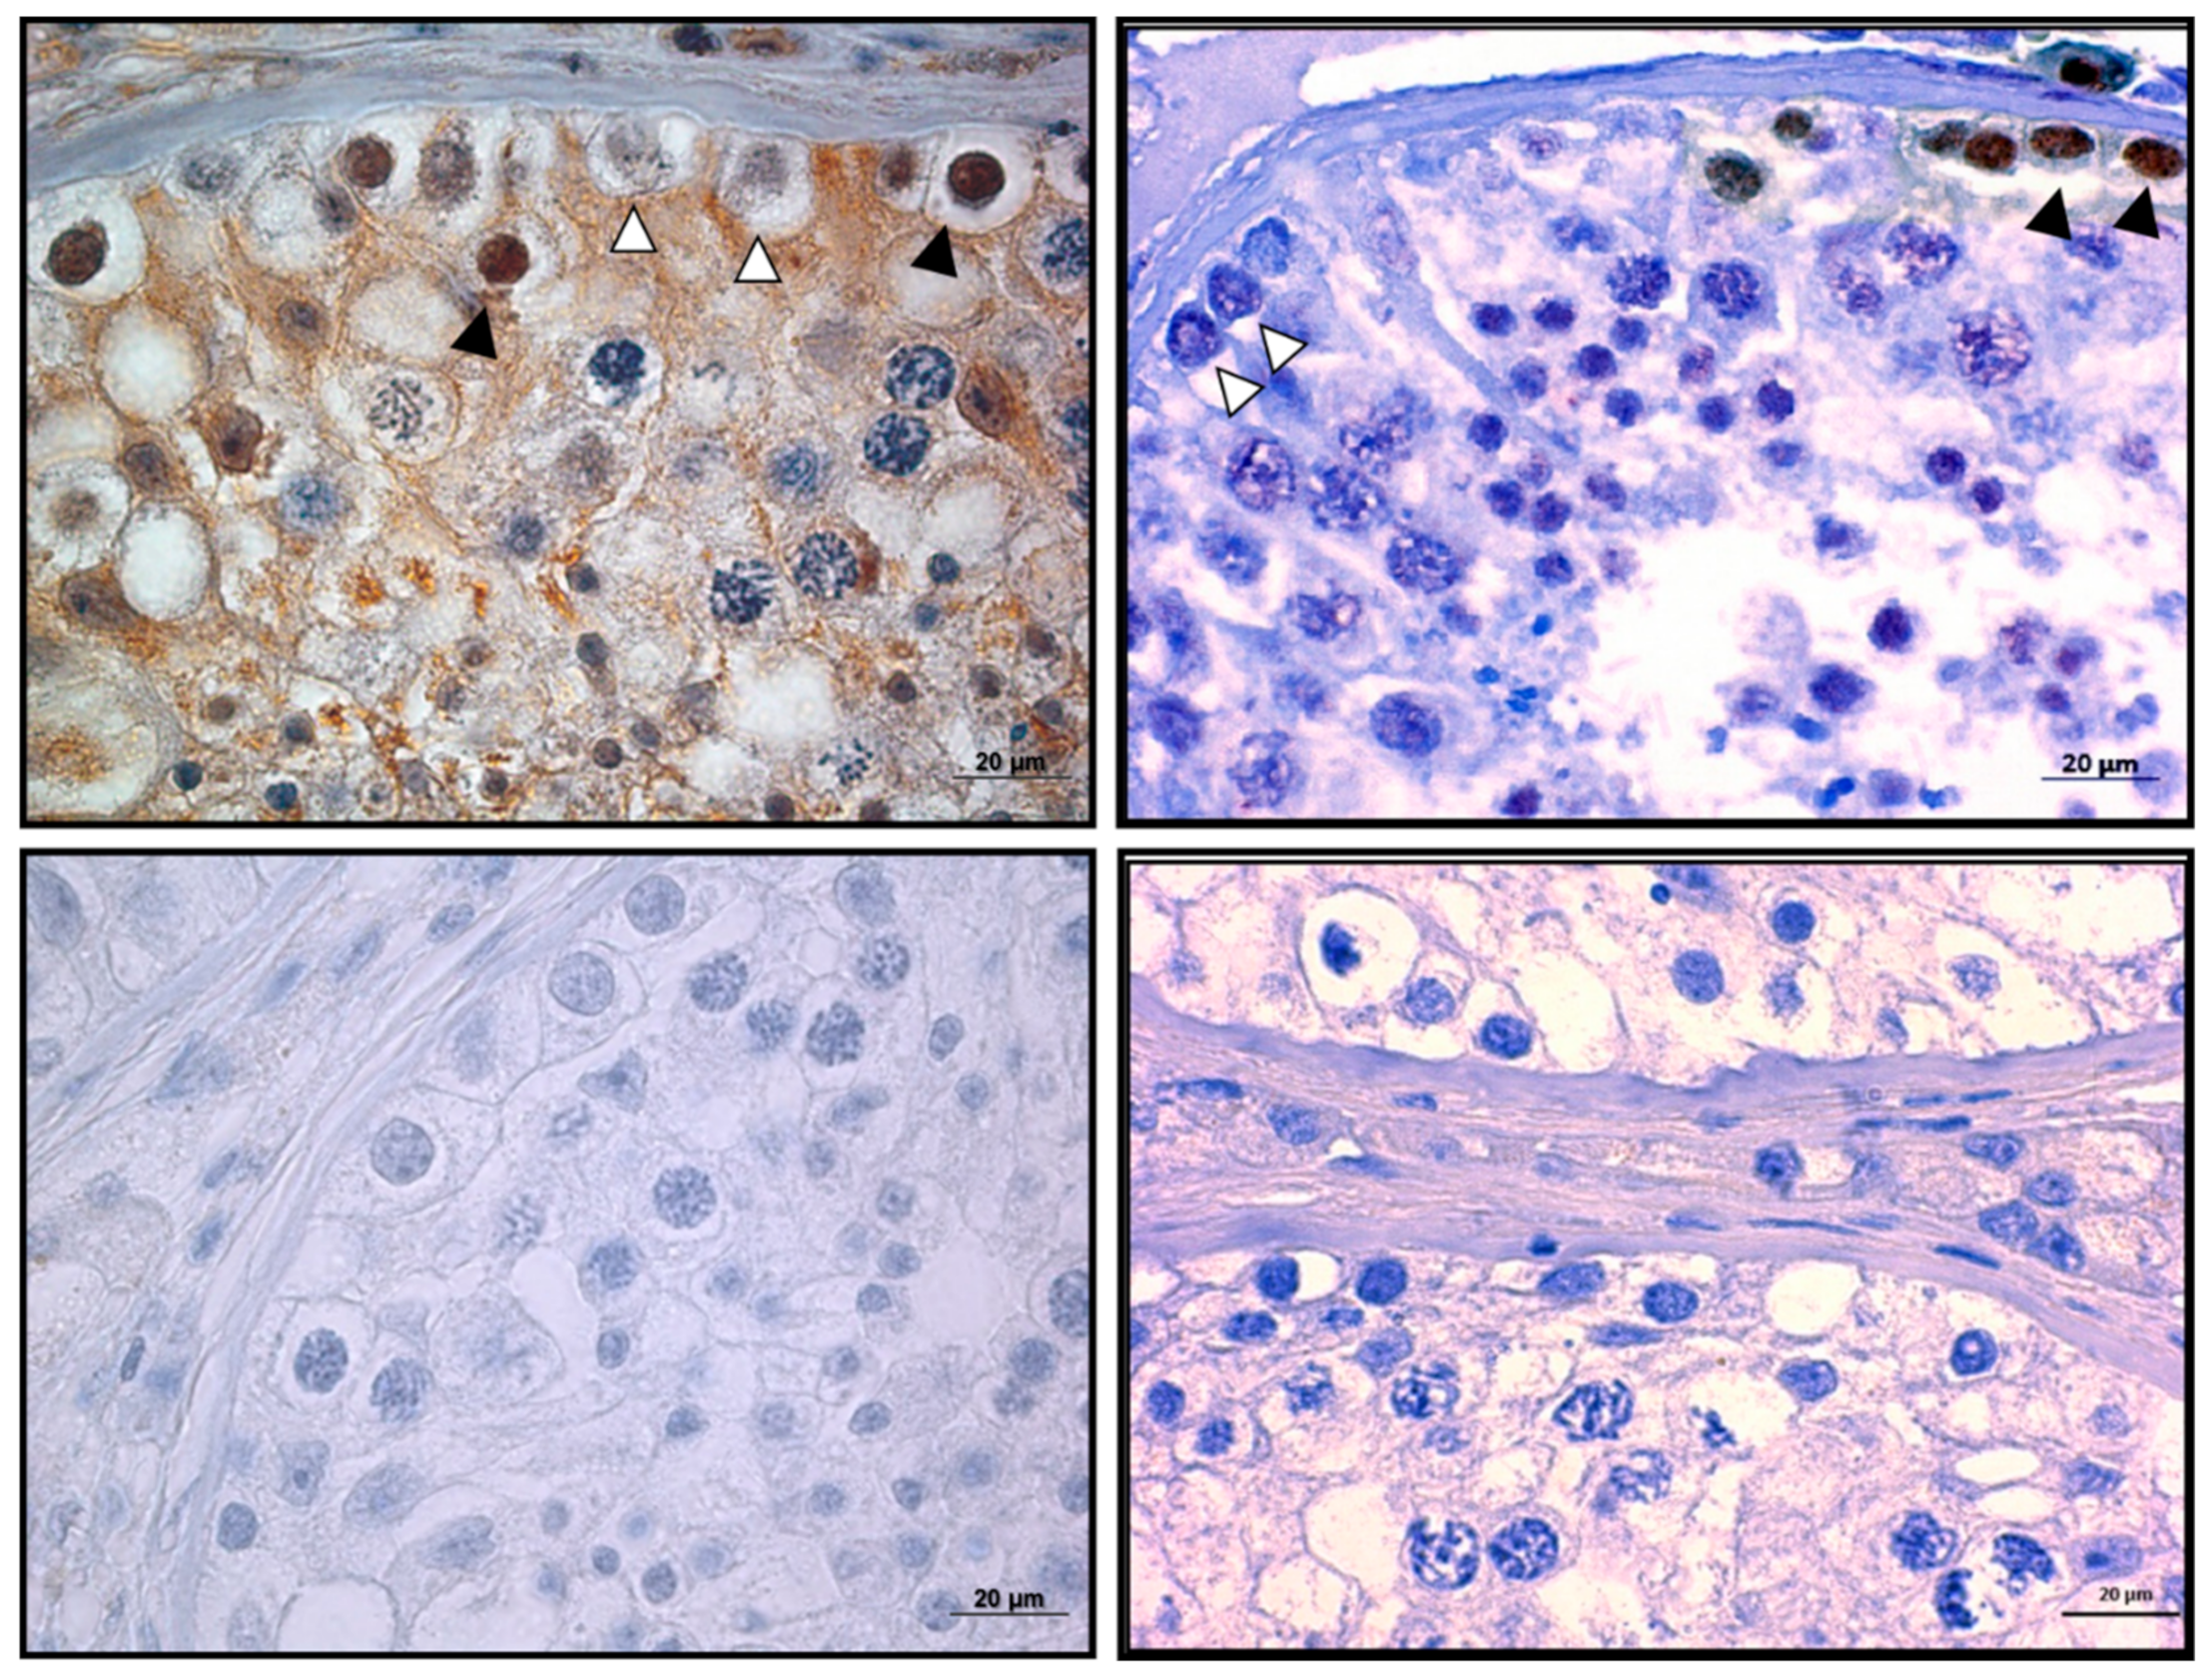
Figure 9.
Immunohistochemical detection of TERF1-tsi in a human testis section with a specific TERF1-tsi antibody, AB2 (1:400). Representative image of testis showing a single seminiferous tubule, Leydig (interstitial) cells, and surrounding muscle cells is shown. AB2 showed strong positive staining (likely TERF1-tsi), specifically localized in spermatogonia, as shown in the top images (black arrowheads). Of note, some of the spermatogonia again did not show any staining (white arrowheads with black border). Importantly, no staining was observed with AB2 on mouse testis (
Supplementary Figure S2), supporting the specificity of the AB2 antibody for human TERF1-tsi. This section was counterstained with hematoxylin. The images were captured at 200×. Scale bars (20 µm) are indicated.
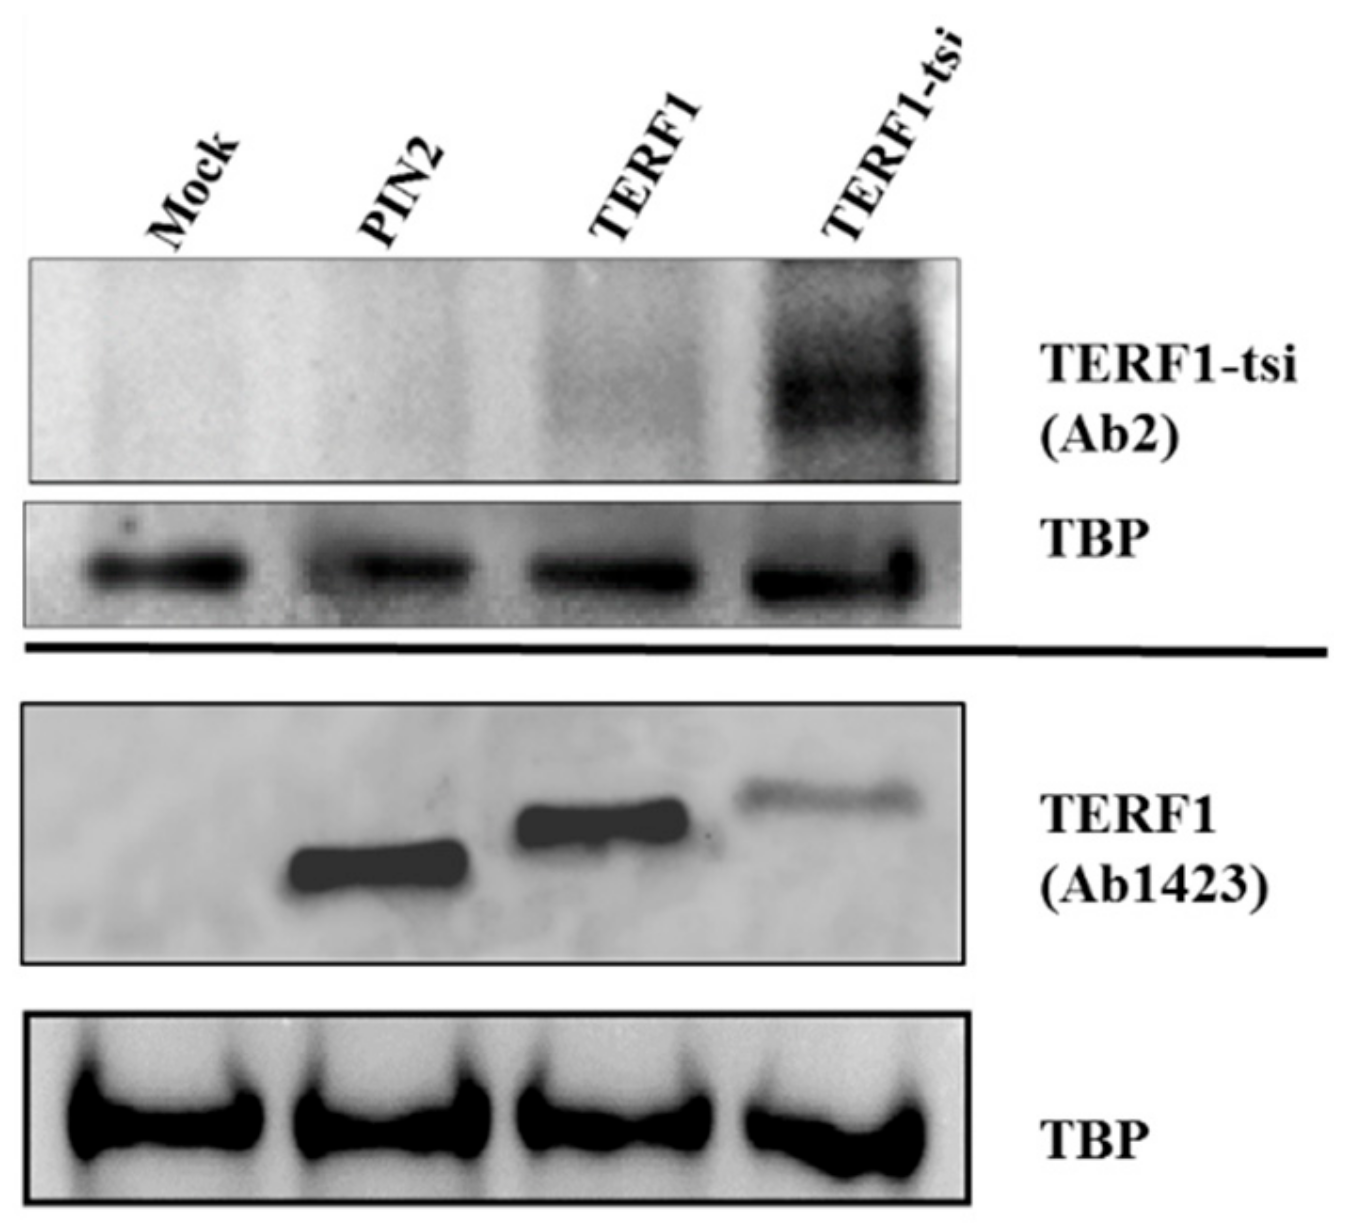
Figure 10.
Western blot showing the specificity of AB2. HEK cells transfected with empty vector or with vectors expressing the indicated TERF1 variants and nuclear extracts were prepared. AB2 shows a strong TERF1-tsi signal in the respective nuclear extracts, though a weak background signal is also visible in TERF1 transfected cells. Independent immunoblot with the pan-TERF1 antibody ab1423 and the same nuclear extracts prove the expression of the transfected TERF1 variants. TBP was used as a loading control. Of note, despite the exact DNA amounts were used for transfection, TERF1-tsi protein levels were consistently low, potentially indicating post-transcriptional regulatory mechanisms to keep low TERF1-tsi levels. This was not due to promoter activity or DNA quality, as we observed this phenomenon consistently with two other vector systems (compare to
Figure 5G and see discussion).
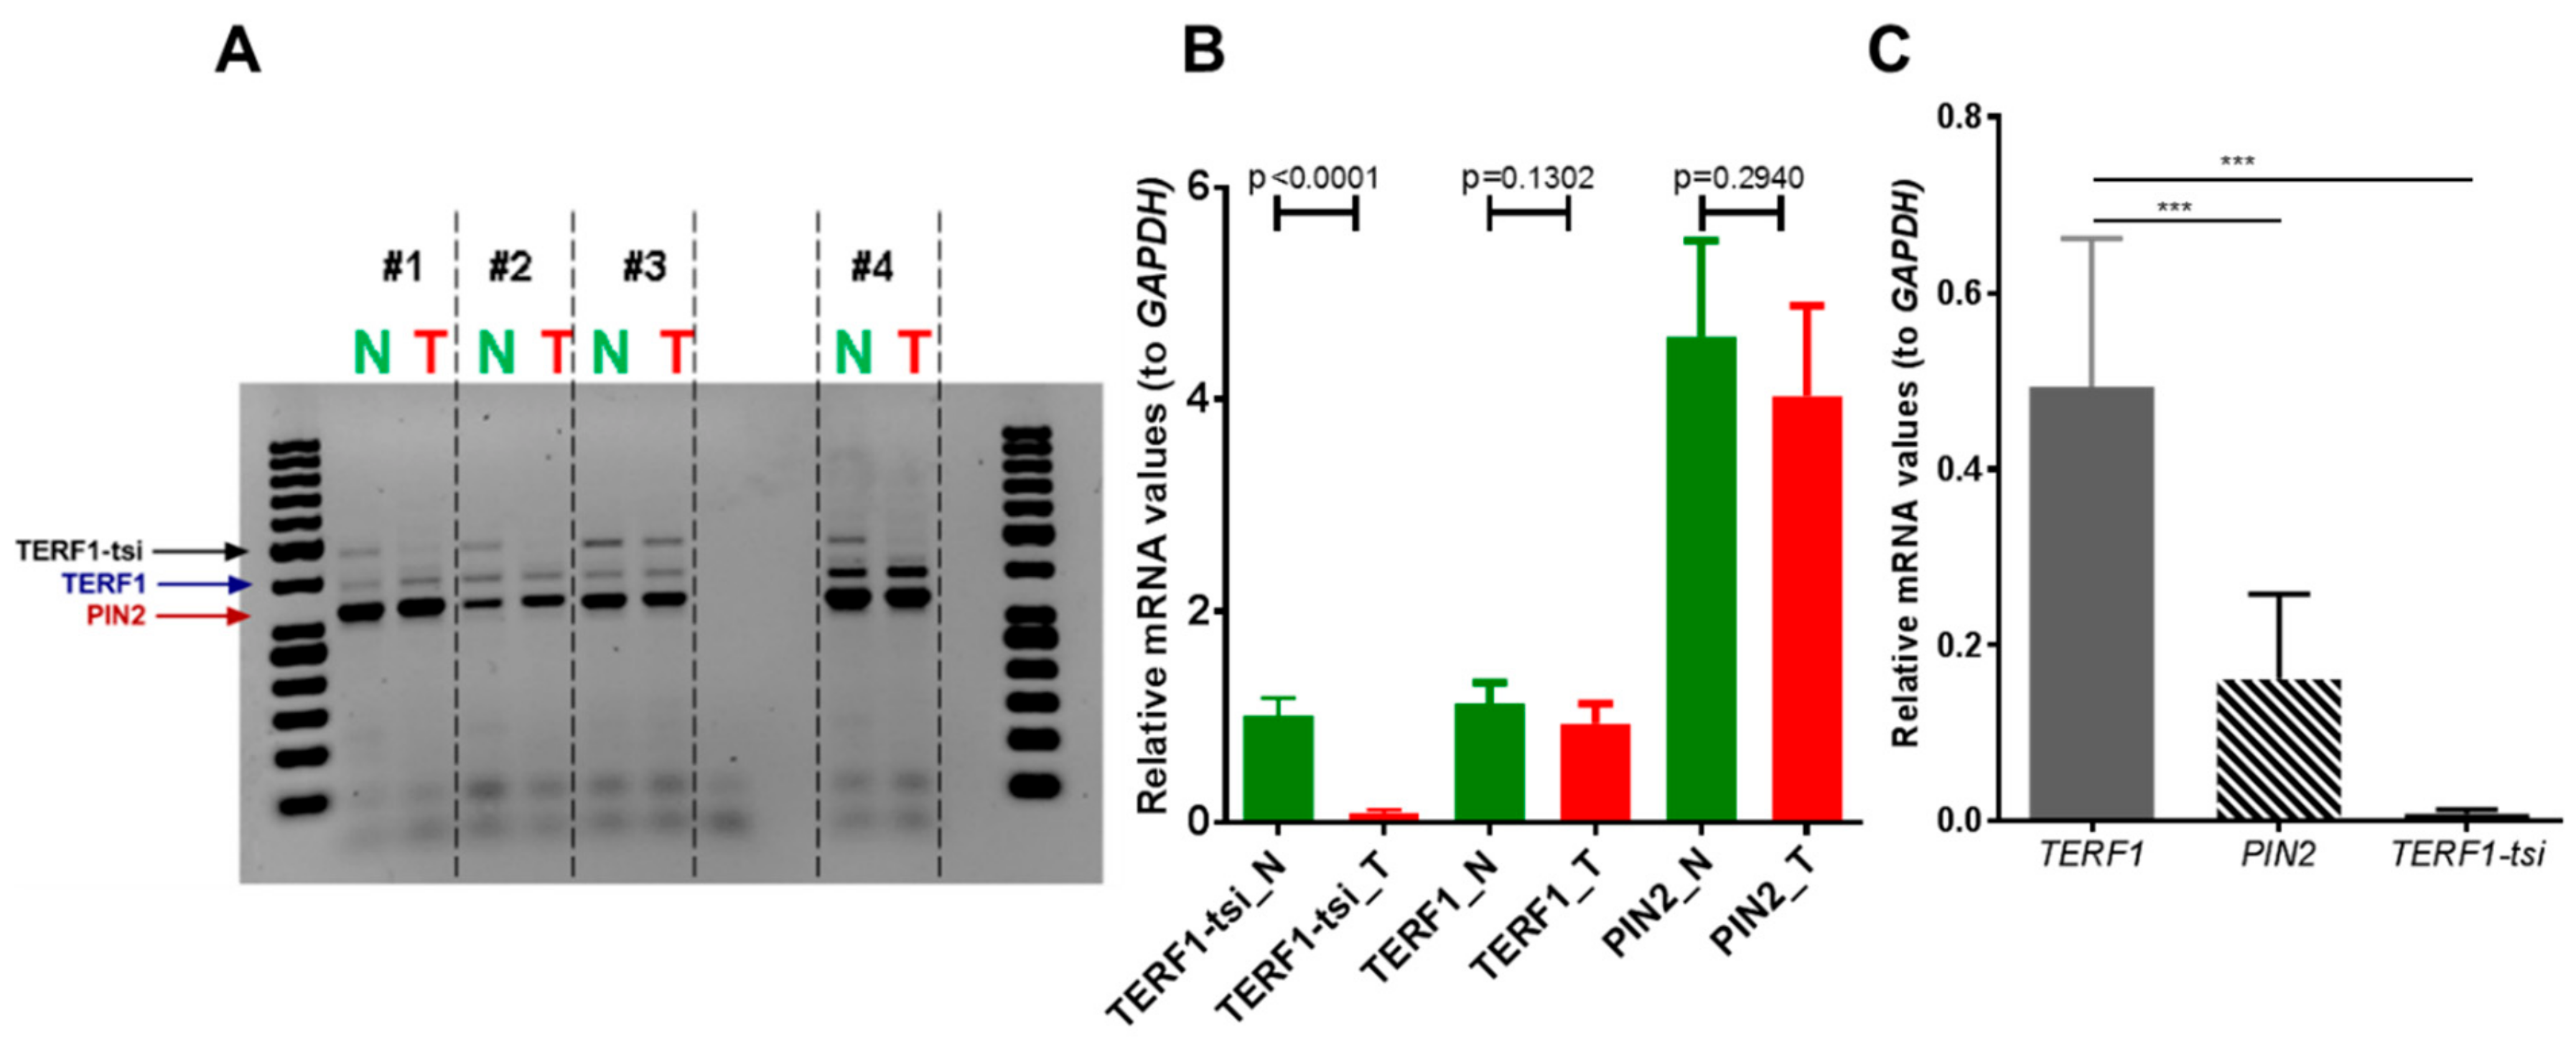
Figure 11.
TRF1-tsi expression is absent in human seminomas and the TCam-2 seminoma cell line. (
A) Semi-quantitative RT-PCR and (
B) real-time quantitative RT-PCR showing specific downregulation of
TERF1-tsi mRNA levels in testis tumors or (
C) in TCam-2 cell line. In (A), pan-TERF1 primer pairs were used, whereas isoform-specific primer pairs were used in (B) and (C). Please note that RNA for normal (N) and tumor (T) samples #1, #2, and #3 were purchased commercially (see
Section 4: Materials and Methods) while #4 was prepared from a patient at Ulm University Hospital. Of note, while tumors #1 and #2 were seminoma samples, #3 was defined as intratubular germ cell neoplasia. Matched N/T samples #4 were also embedded and analyzed by immunohistochemistry in the subsequent experiments (e.g.,
Figure 12). Real-time RT-PCR were mean values from two independent experiments with three technical replicates each (n = 4). Error bars show the mean of SD.
p-Values were calculated by unpaired
t-test with Welch’s correction. *** indicates
p = 0,0005.
![Ijms 21 00085 g011]()
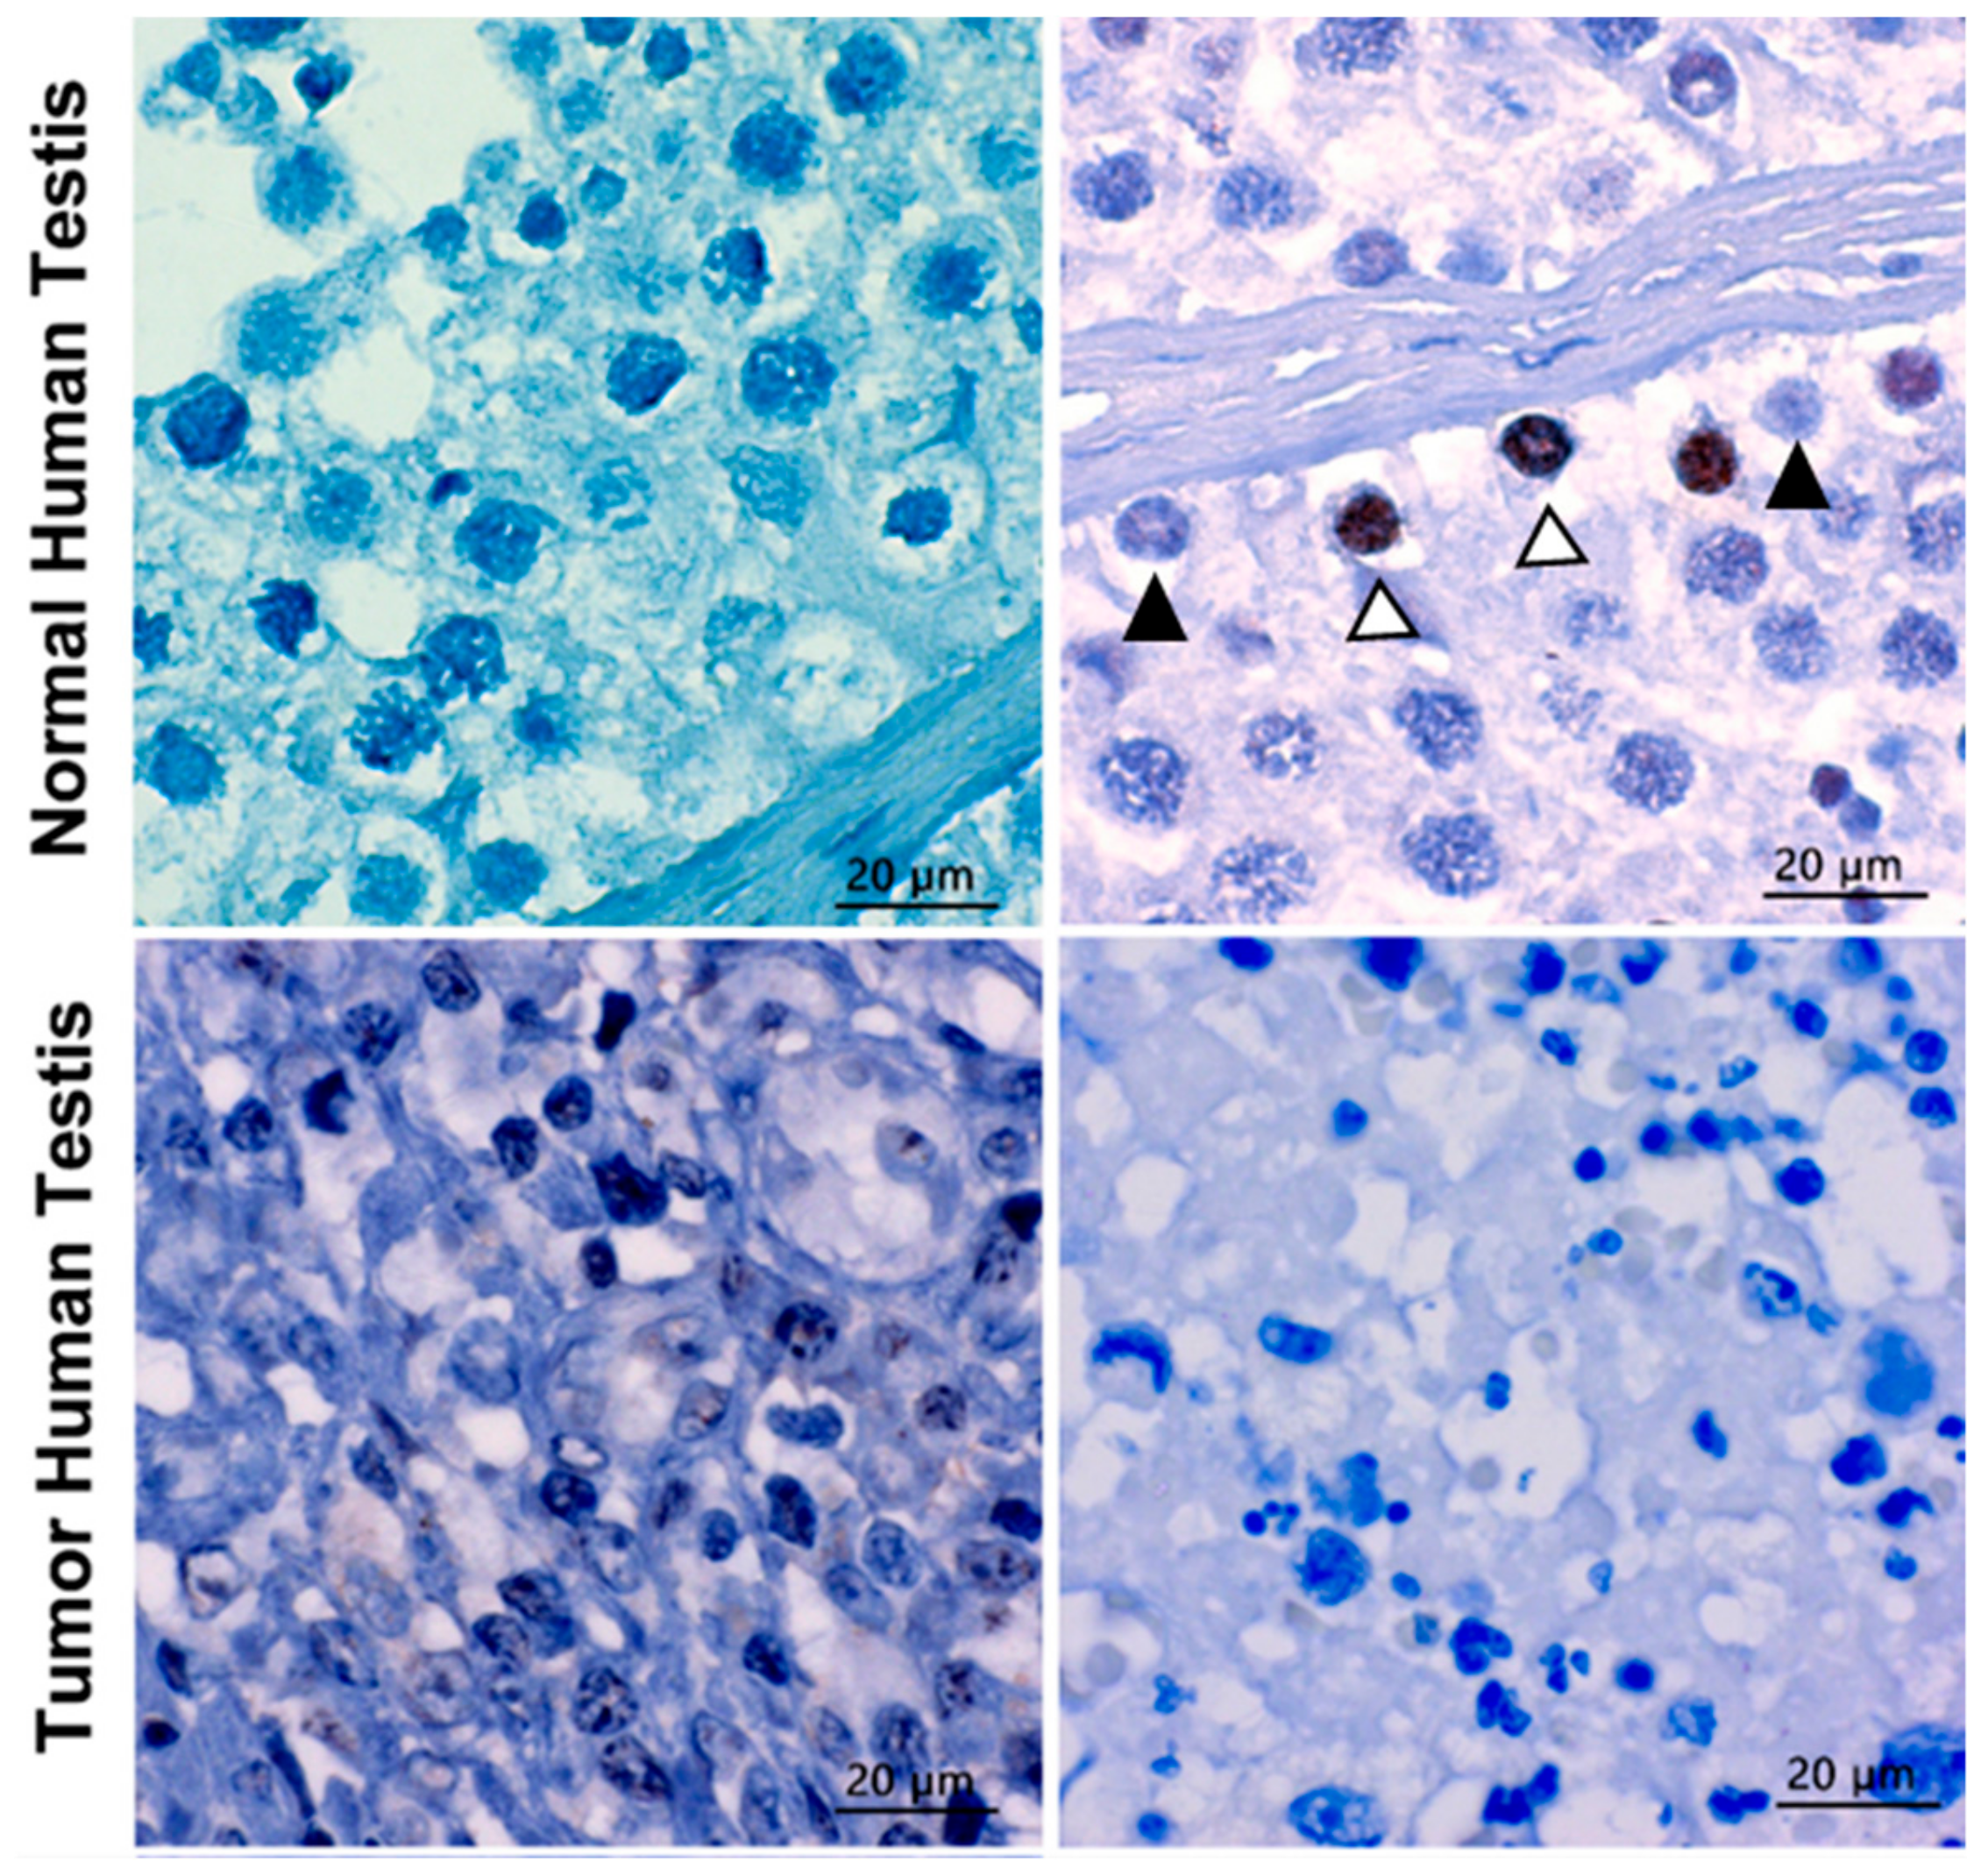
Figure 12.
TERF1-tsi protein is downregulated in human seminoma sample. (Left) Top and bottom left figures demonstrate the IHC analysis of negative controls (only secondary antibody) of normal and tumor testis, respectively, showing no background staining. (Right) The upper figure depicts the IHC analysis of TERF1-tsi in normal human testis with AB2 showing positive staining (TERF1-tsi) in a subset of spermatogonia (white arrowheads with black border). Of note, some of the spermatogonia did not show any staining (black arrowhead). In contrast, the bottom right figure demonstrates the lack of TERF1-tsi in tumor testis tissue with AB2, confirming the previous mRNA expression results (3A, #4 normal and tumor samples). All sections were counterstained with hematoxylin comparing and captured at 630×. The bar indicates 20 µm.
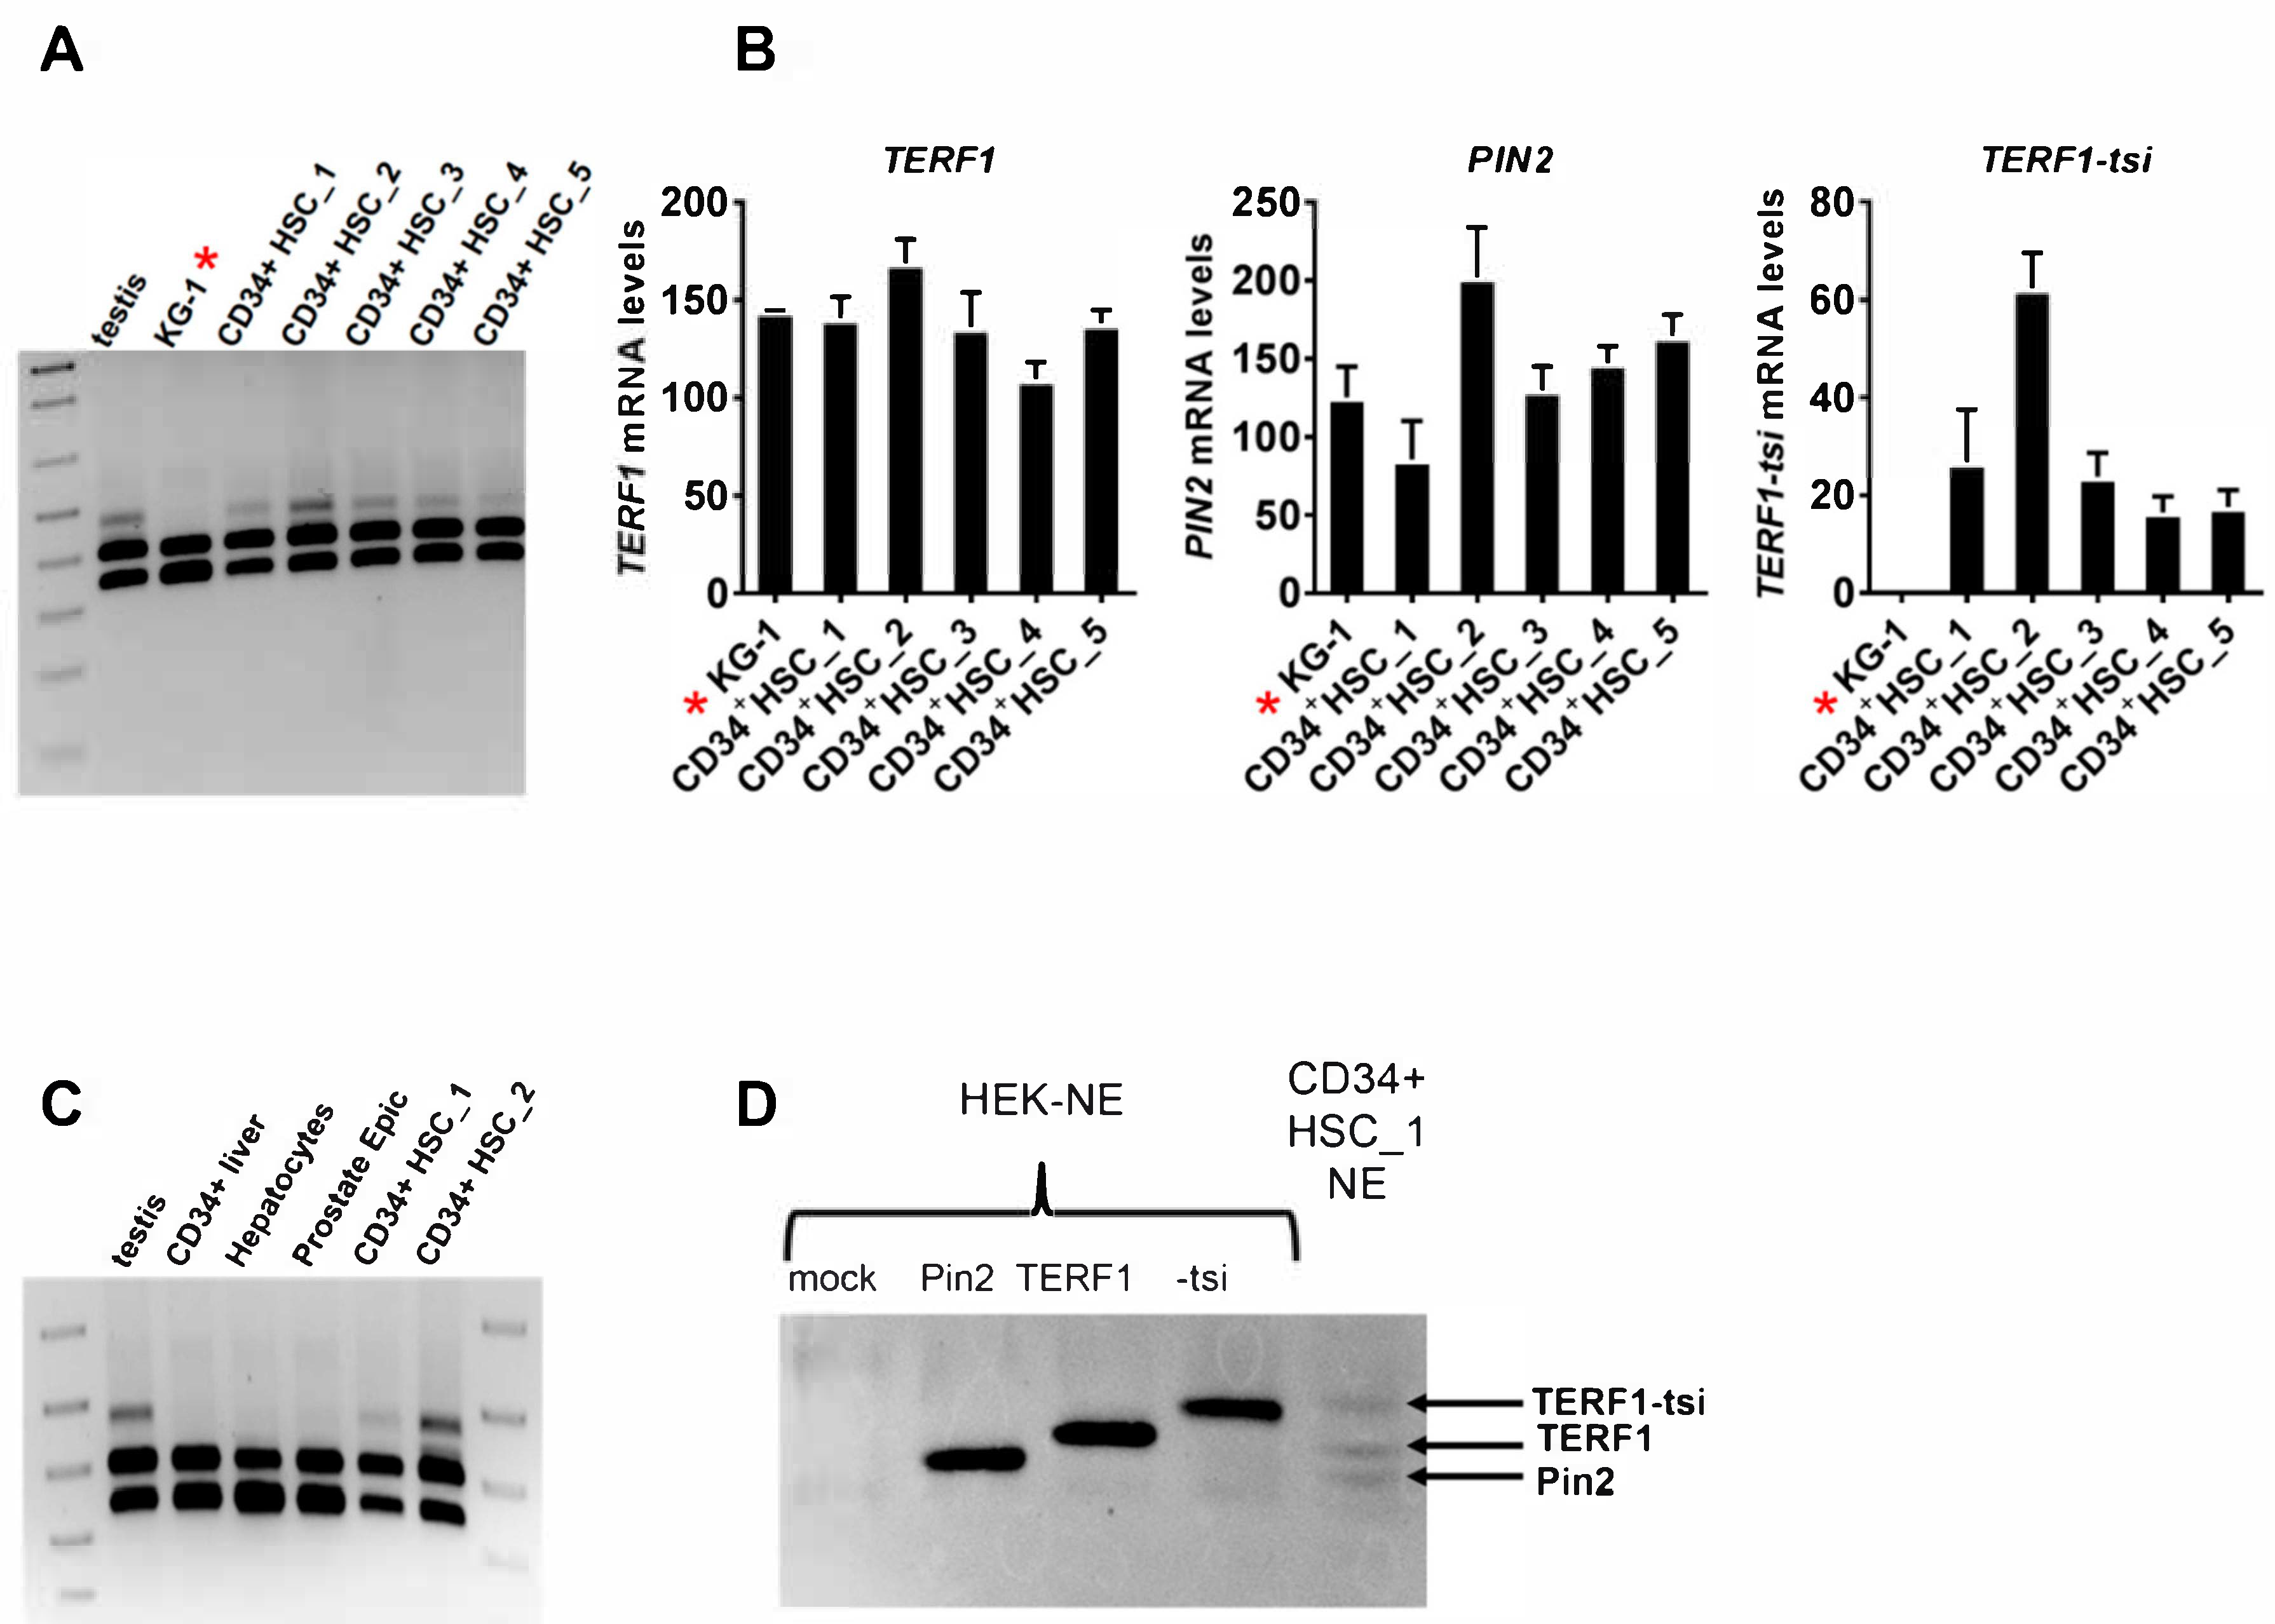
Figure 13.
TERF1-tsi expression is detectable in CD34+ human hematopoietic stem cells (CD34+ HSCs). (
A) Expression of TERF1 isoforms was determined in CD34+ HSCs from five different donors (1 to 5, respectively), along with the testis as a positive control and the KG1 cell line. Semi-quantitative RT-PCR with the pan-
TERF1 primer pair, which amplify all three
TERF1 isoforms,
TERF1,
PIN2, and
TERF1-tsi.
* is solely to highlight the KG-1 cell line. (
B) Real-time quantitative RT-PCR with KG1 cell line and the CD34+ HSCs as in
Figure 13A. Isoform-specific primer pairs were used for the qPCR. Real-time RT-qPCR were mean values from two independent experiments with three technical replicates each. Error bars show the mean of SD. (
C) Semi-quantitative RT-PCR to determine the expression in human CD34+ liver cells, human primary hepatocytes, and human primary prostate epithelial cells with the pan-
TERF1 primer pair, which amplify all three
TERF1 isoforms,
TERF1,
PIN2, and
TERF1-tsi. The testis sample and the indicated human CD34+ HSC samples were included as positive controls. (
D) Western blot with nuclear extracts prepared from CD34+ HSCs_1 (sample number 1). Nuclear extracts from untransfected and TERF1 isoform transfected HEK cells were used as controls. The indicated protein bands run at the same size as the transfected TERF1 variants. Please note that due to the expected low amounts of TERF1 proteins, CD34+ HSC_1-NE was loaded in excess (60 µg nuclear extract versus 3µg HEK-NE).
![Ijms 21 00085 g013]()
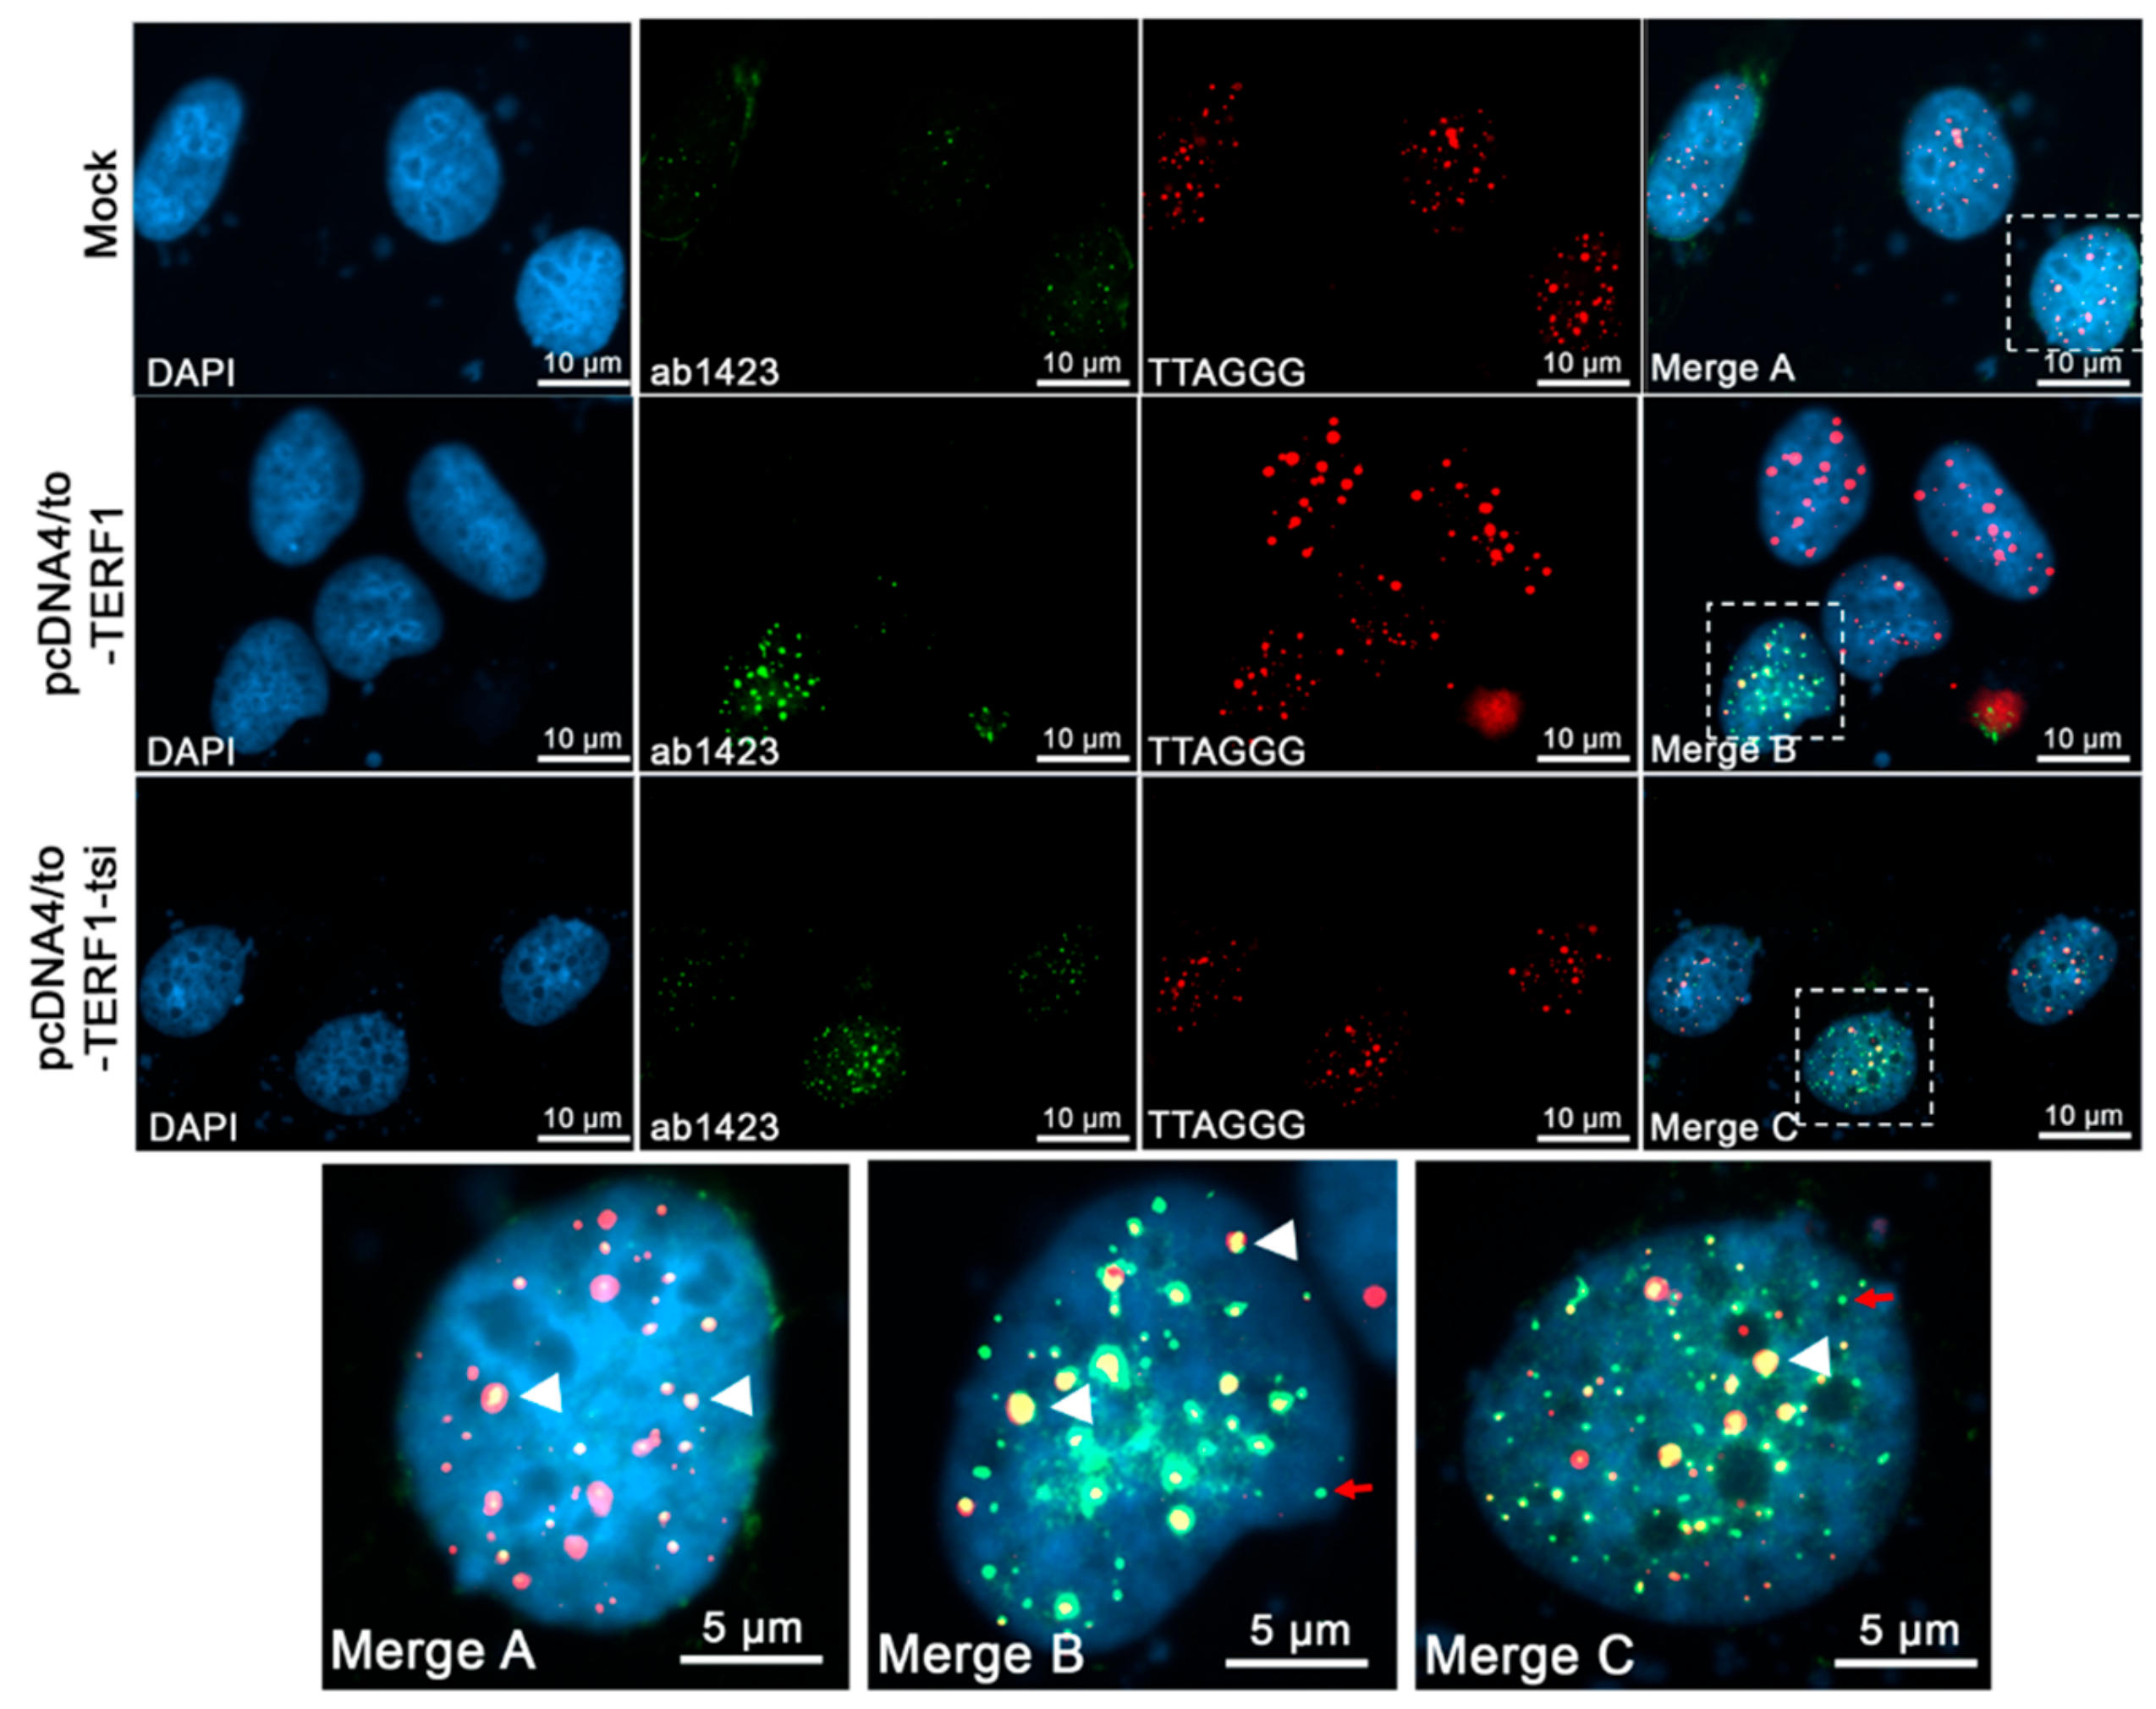
Figure 14.
Immunofluorescence telomere-FISH staining to detect endogenous and ectopic TERF1 isoforms/telomere co-localization with a pan-TERF1 antibody, ab1423 (1:300). From left to right, (first column) nuclei were counterstained with the blue fluorescent DNA dye, DAPI. (Second column) ab1423 staining in mock and transfected cells showing signals correspond to either endogenous TERF1/PIN2 in parental (mock-transfected) U2OS cells or ectopic TERF1 and TERF1-tsi (untagged TERF1 or TERF1-tsi in pCDNA-4TO vector) in transfected U2OS cells, respectively. (Third column). Cy3-conjugated telomere-specific peptide-nucleic-acid (PNA) probe, red fluorescence revealing telomeres signals in parental and transfected U2OS cells. (Fourth column and bottom row) Merged images of DAPI, ab1423 staining, and telomere PNA-FISH signals. The selected nuclei (fourth coloumn) were enlarged (bottom row) for better visualization. The endogenous TERF1/PIN2 and ectopic TERF1 and TERF1-tsi revealed co-localization with the telomeric probe in parental and transfected U2OS cells (white arrowheads). Interestingly, subset of ectopic TERF1 and TERF1-tsi signals showed no co-localization with telomeres (red arrows). All images were captured with ApoTome at 630×. Scale bars (5 µm or 10 µm) are indicated.
![Ijms 21 00085 g014]()
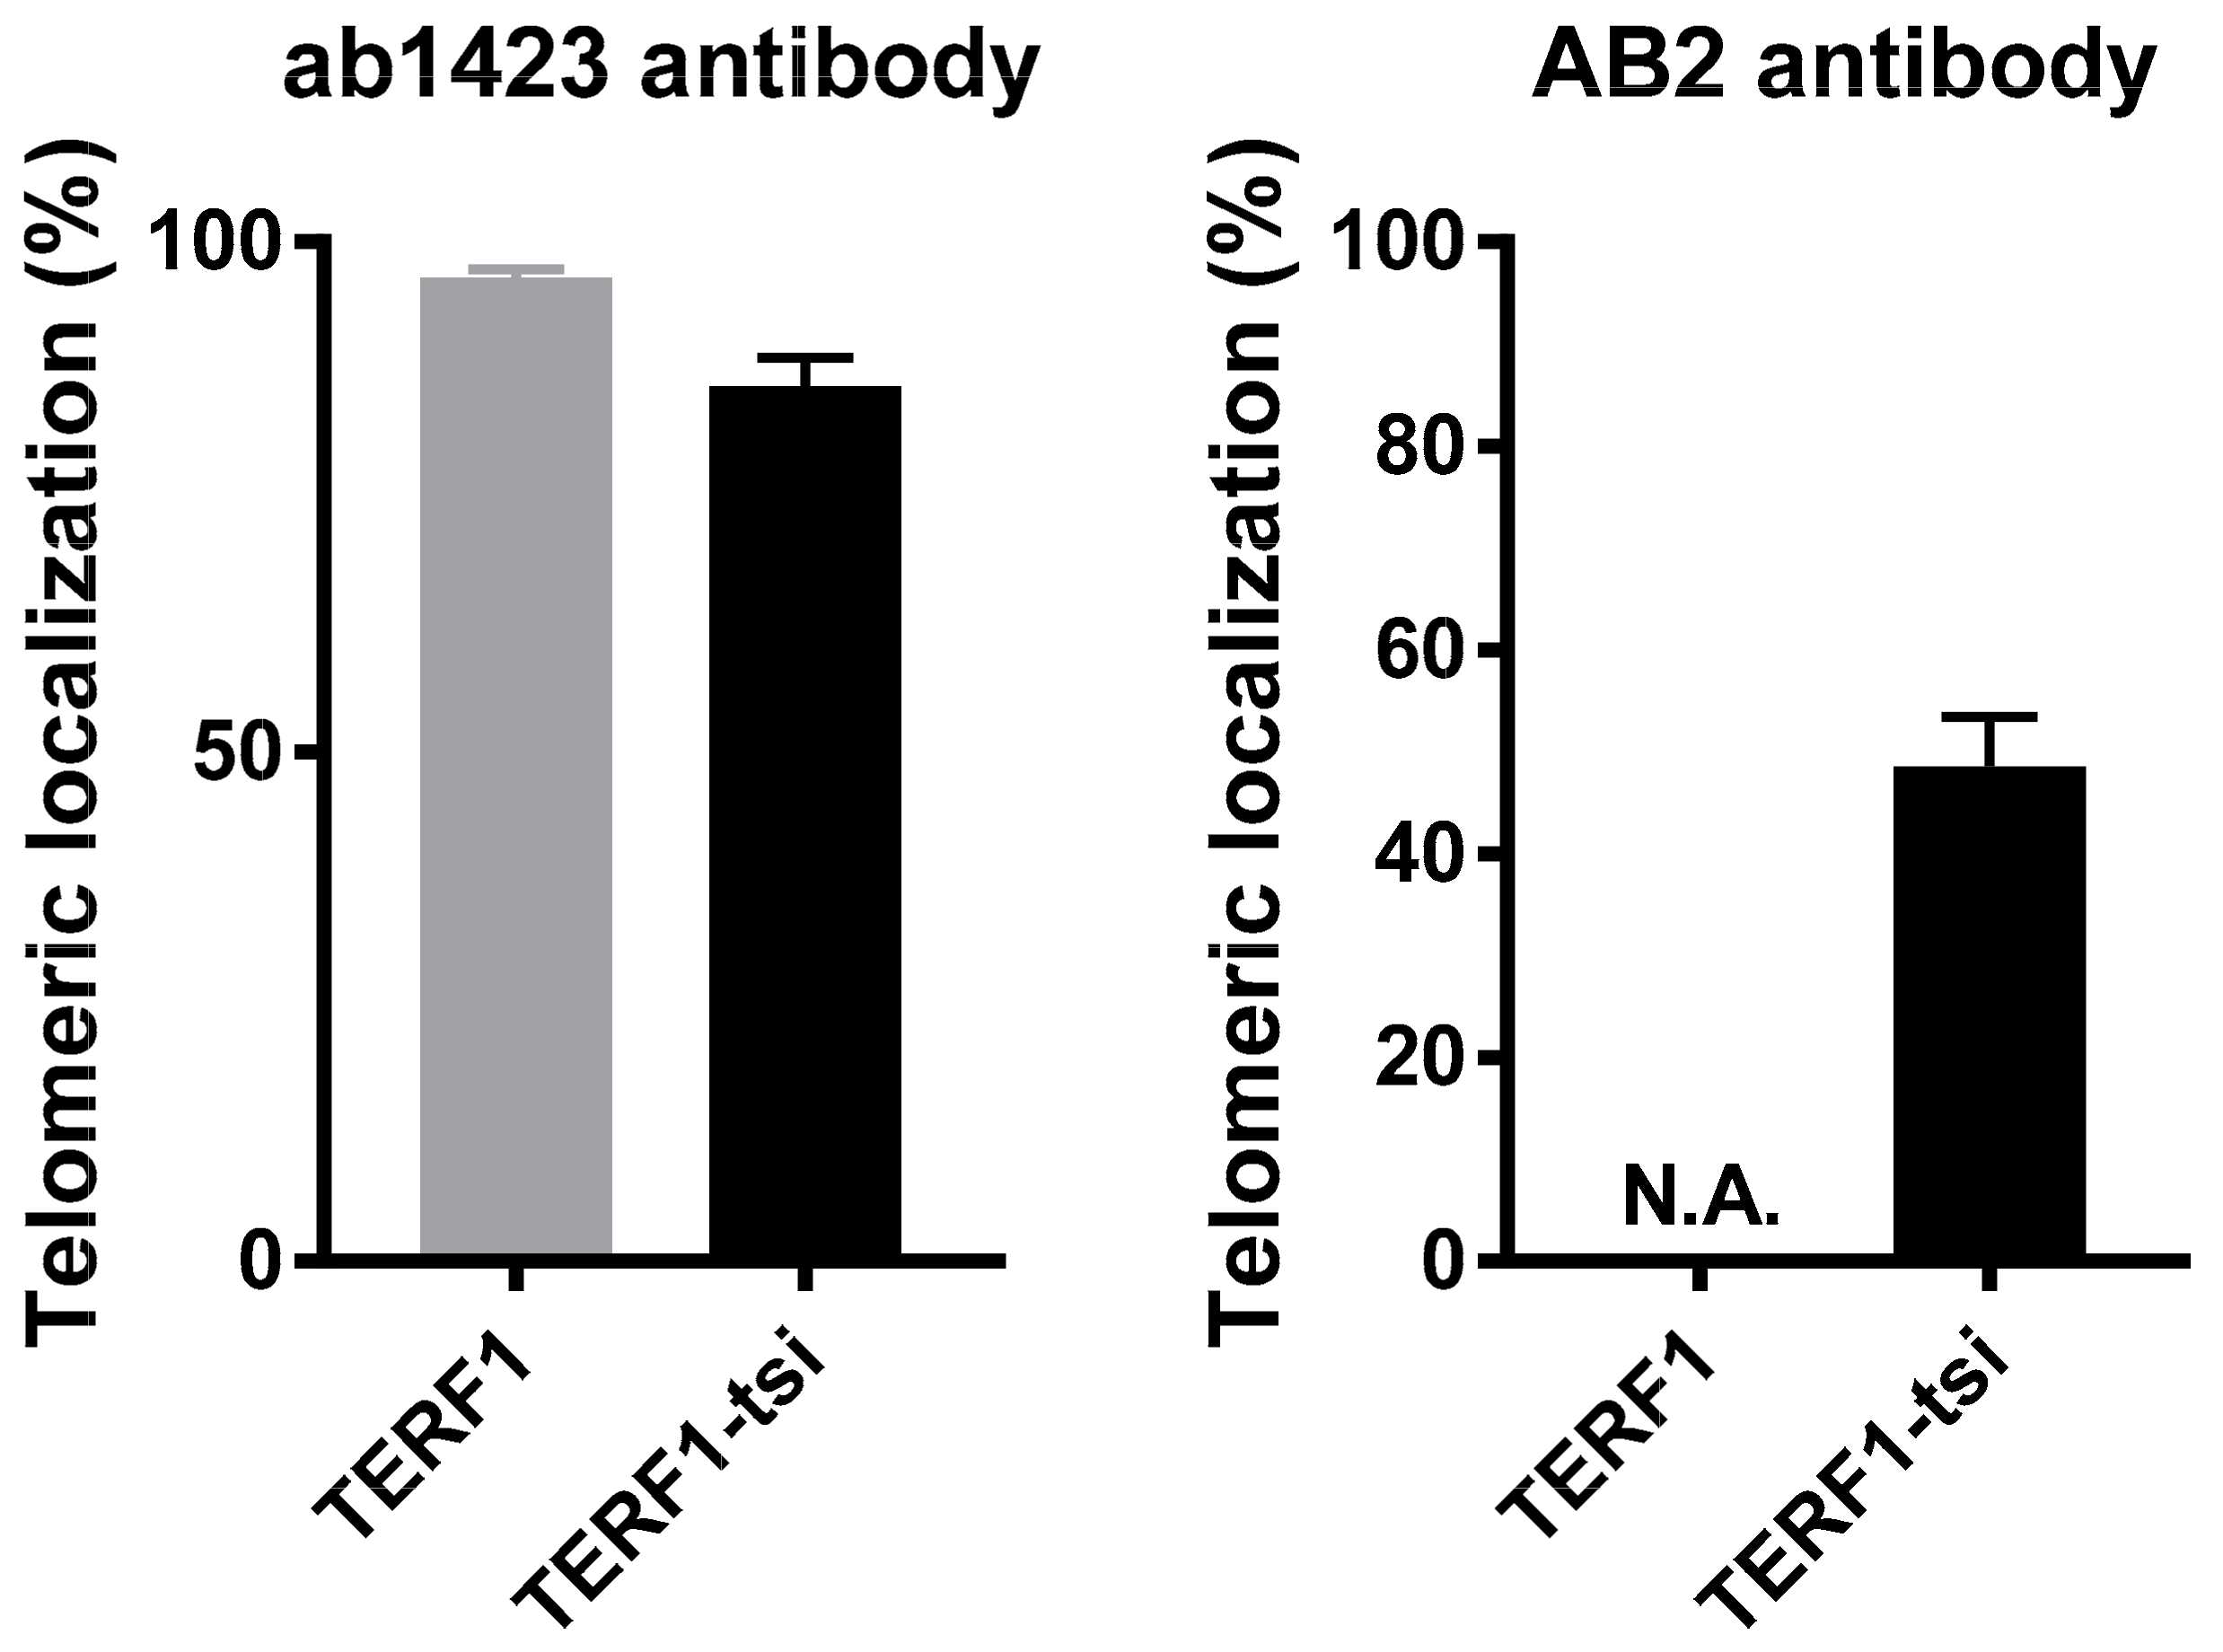
Figure 15.
Quantification of telomeric localization of TERF1 and TERF1-tsi. (Left) Quantification of telomeric TERF1 or TERF1-tsi signals detected by the panTERF1 antibody ab1423 and the telomeric FISH. Colocalization of TERF1 or TERF1-tsi with telomeric DNA was evaluated in at least 20 nuclei in each independent repeat experiment. The values indicate percent co-localization of TERF1 or TERF1-tsi with the telomeric DNA signal. (Right) Quantification of telomeric TERF1-tsi signals detected by the TERF1-tsi specific antibody AB2 and the telomeric FISH. Colocalization of TERF1-tsi with telomeric DNA was evaluated in at least 20 nuclei each in 4 independent repeat experiments. The values indicate percent co-localization of TERF1-tsi with the telomeric DNA. N.A. (not applicable): AB2 did not show unspecific cross-reaction with TERF1.
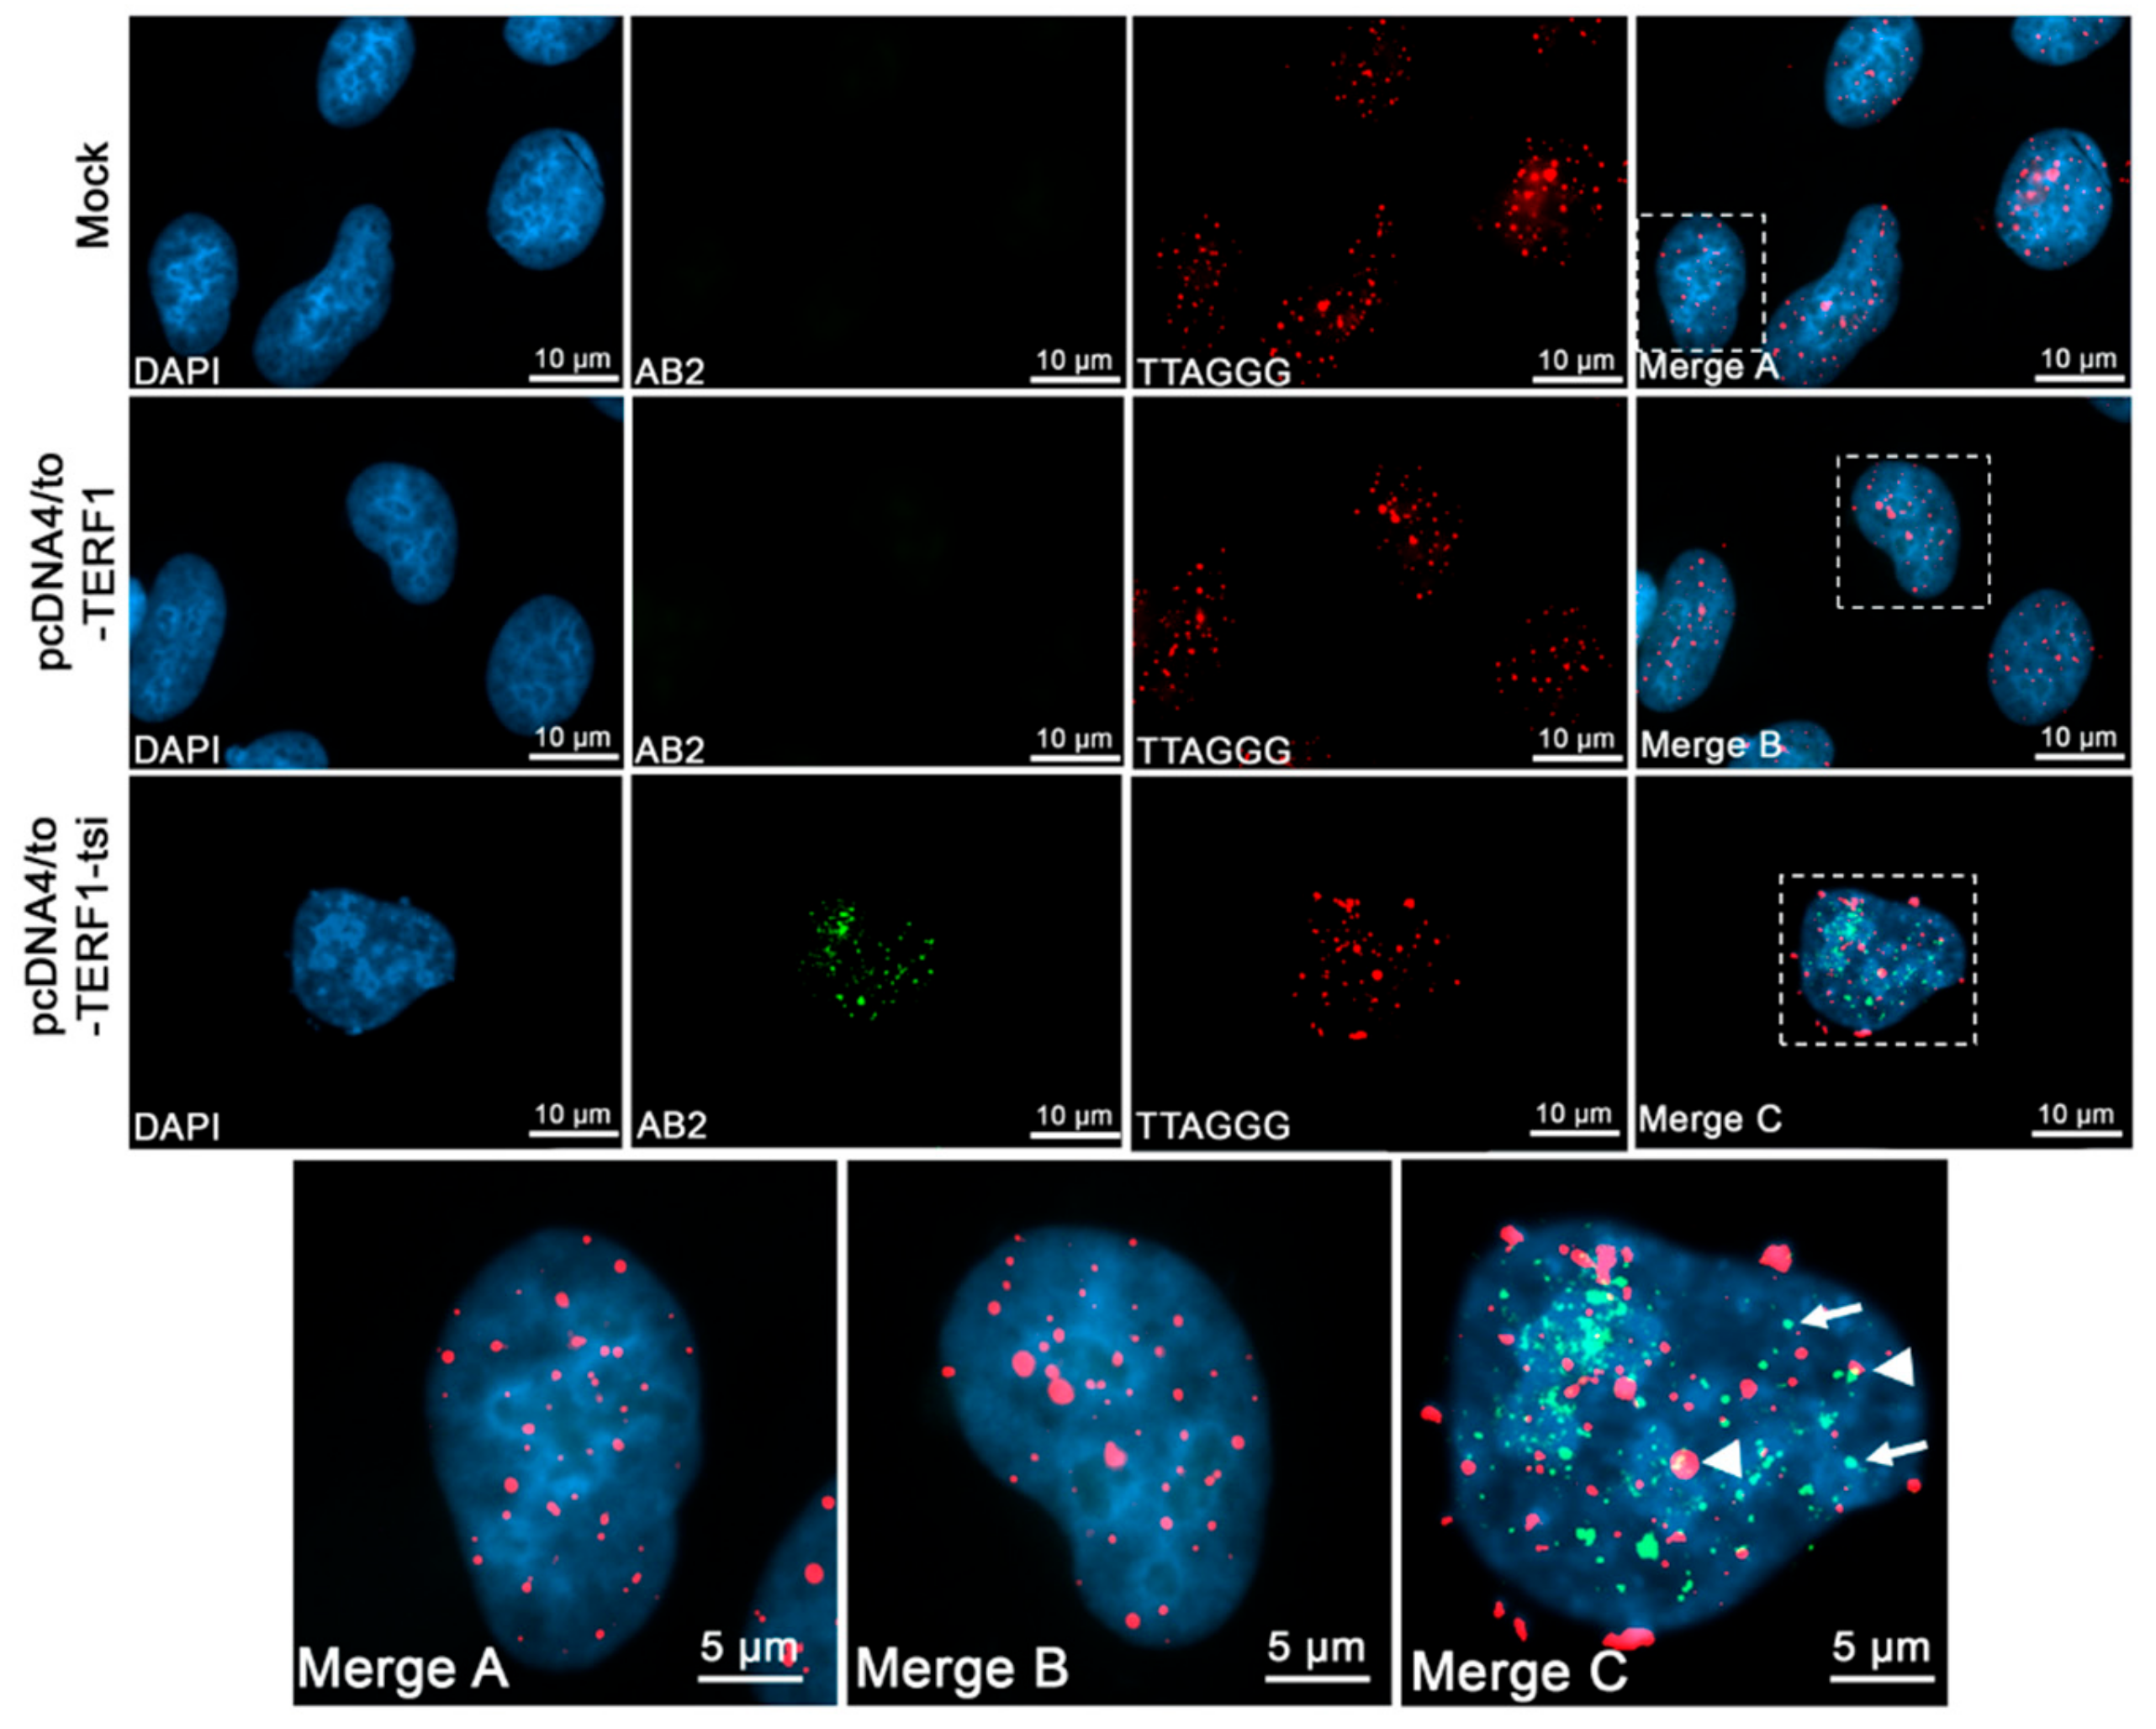
Figure 16.
Immunofluorescence telomere-FISH staining to detect the telomeric localisation of ectopic TERF1-tsi in pcDNA4/to-TERF1-tsi transfected U2OS cells with TERF1-tsi specific antibody AB2 (1:100). Secondary antibody Alexa488 (1:2000). From left to right, (first column) nuclei were counterstained with the blue fluorescent DNA dye, DAPI. (Second column) AB2 staining in mock and transfected cells showing ectopic TERF1-tsi specific signals (bottom) in transfected U2OS cells. (Third column). Cy3-conjugated telomere-specific peptide-nucleic-acid (PNA) probe, red fluorescence revealing telomeres signals in parental and transfected U2OS cells. (Fourth column and bottom row) Merged images (DAPI, AB2 staining, and telomere PNA-FISH) of single nuclei of mock (merge A), TERF1 (merge B), and TERF1-tsi (merge C)-transfected cells. AB2 antibody detects TERF1-tsi (second column, lower lane) but not endogenous or ectopic TERF1/PIN2 (second column, top or middle lane) confirming that AB2 has no cross-reactivity with endogenous TERF1/PIN2 and ectopic TERF1. Importantly, AB2 staining of TERF1-tsi revealed partial co-localization with the telomeric probe (merge C; white arrowheads) while a subset of TERF1-tsi did not show telomeric colocalization (white arrows). All images were captured with ApoTome at 630x. Selected nuclei were enlarged for better visualization of the signals. Scale bars (5 µm or 10 µm) are indicated.
![Ijms 21 00085 g016]()
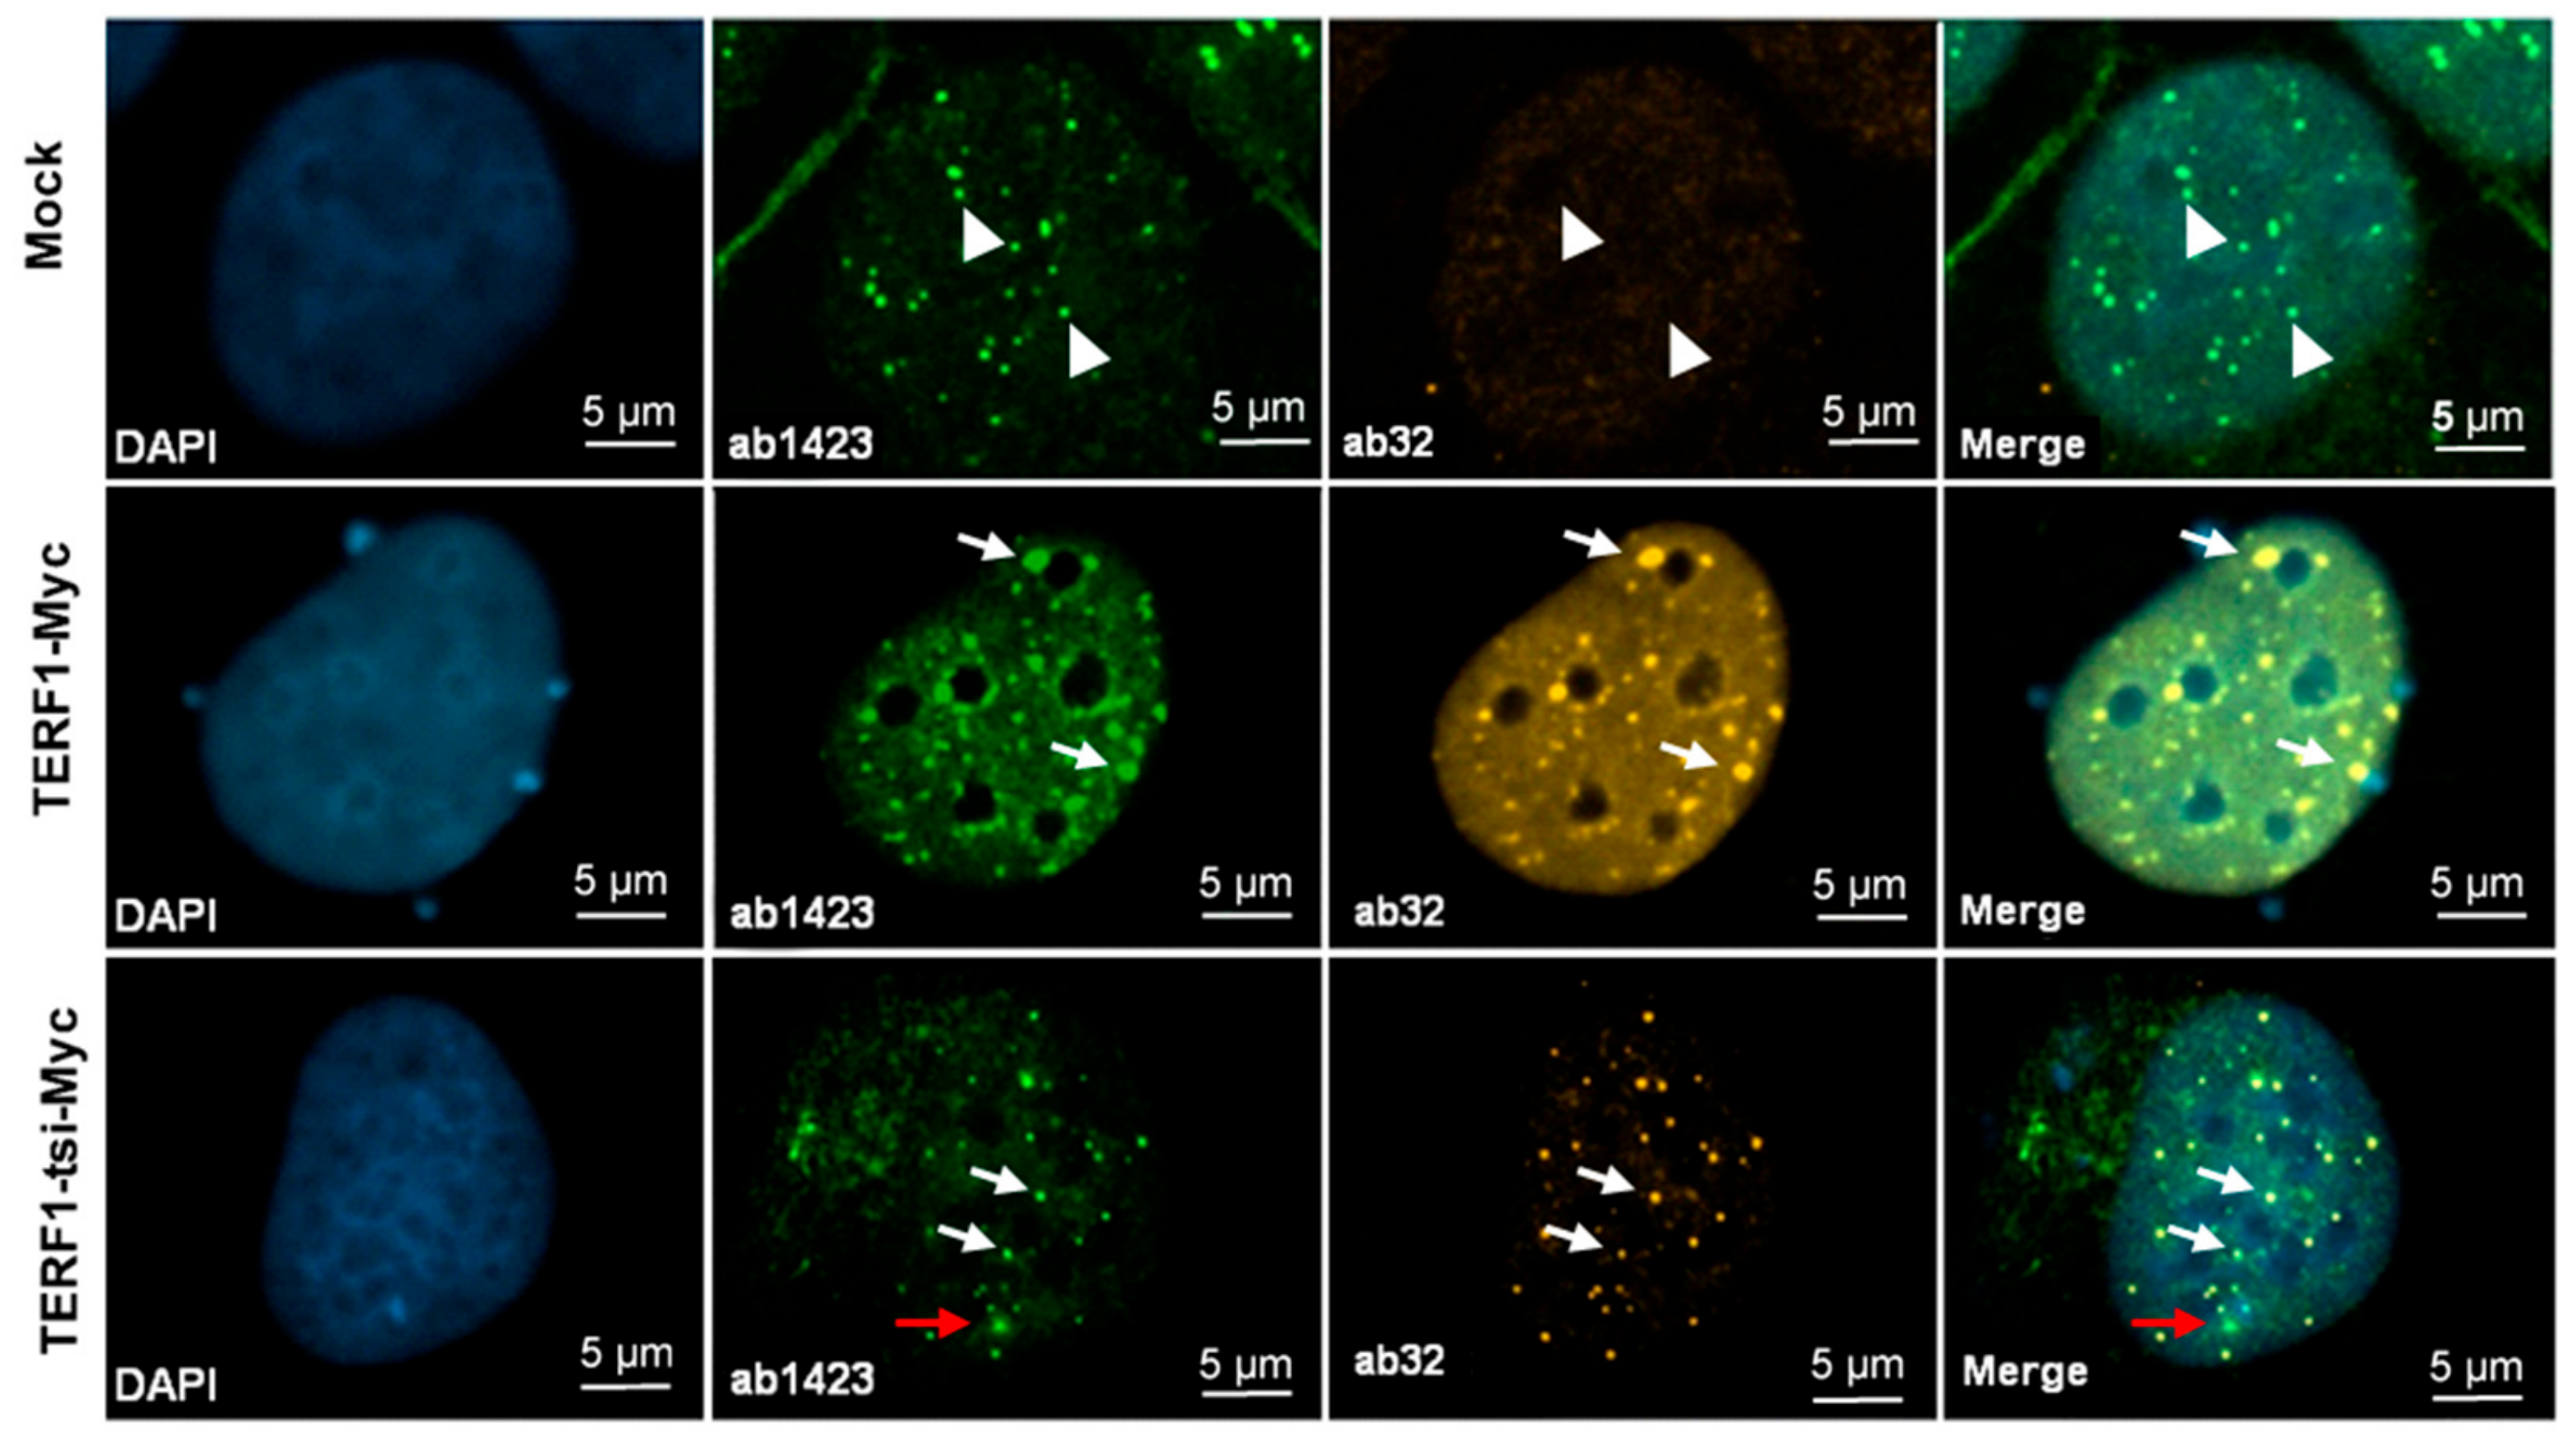
Figure 17.
Detection of endogenous TERF1/PIN2 and ectopic Myc-tagged-TERF1 and-TERF1-tsi by immunofluorescence. From left to right, (first column) nuclei were counterstained with the blue fluorescent DNA dye, DAPI. (Second column) ab1423 staining of mock and transfected cells showing positive signals in all cells. (Third column) ab32 staining of mock and transfected cells showing positive Myc-tag signals in transfected cells. (Fourth column) Merged images of DAPI, ab1423, and ab32. The top row shows only positive, endogenous nuclear TERF1/PIN2 with ab1423 (white arrowheads) but no cross-reactivity with the anti-Myc antibody. In the middle row, endogenous TERF1/PIN2 and Myc-TERF1 signals show complete co-localization with ab1423/ab32 antibodies (white arrowheads). Similarly, bottom rows show overlapping ab1423/ab32 signals which correspond to the ectopic Myc-tagged TERF1-tsi in the indicated Myc-TERF1-tsi transfected cells. These overlapped signals discriminate the ectopic Myc-tagged TERF1-tsi from endogenous TERF1/PIN2. Here, few TERF1/PIN2 signals without TERF1-tsi can be observed (red arrow). The images were captured at 630x. The bar indicates 5µm. Secondary antibodies Alexa488 (1:2000) for ab1423, and Cy3 (1:1000) for ab32.
![Ijms 21 00085 g017]()
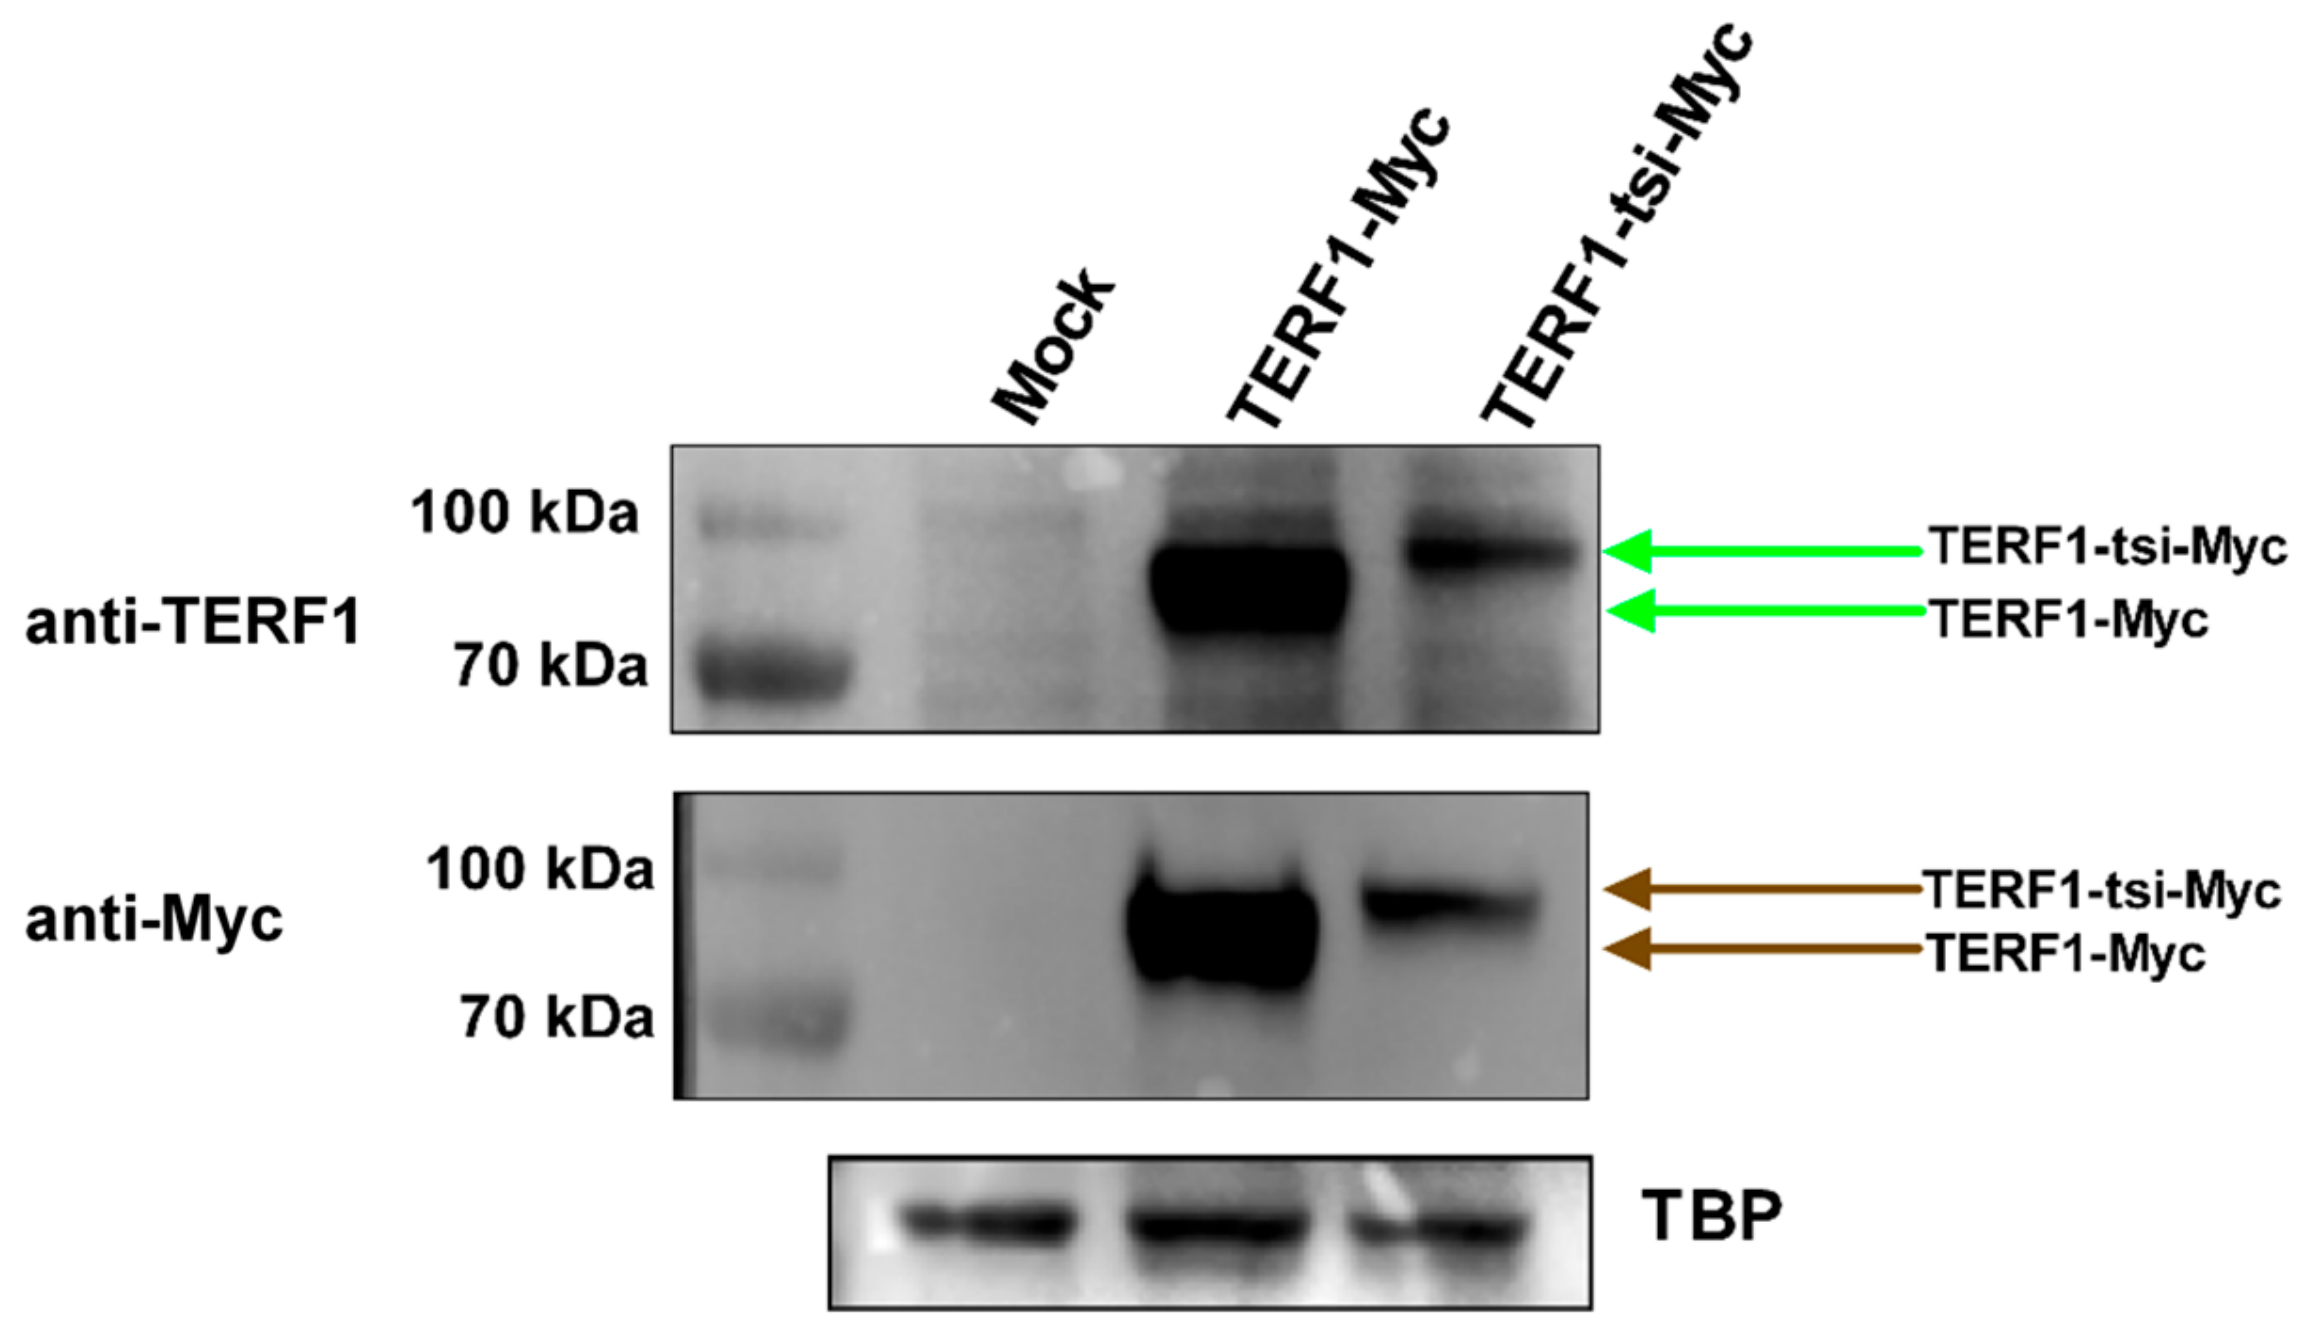
Figure 18.
Detection of ectopic Myc-tagged-TERF1 and -TERF1-tsi in nuclear lysates of transfected U2OS cells. (Top) Immunoblot with a pan-TERF1 antibody ab1423 (1:300). Due to the Myc epitope fusion (6x-Myc), the Myc-TERF1 and Myc-TERF1-tsi signals appear at ~90 kDa. Due to strong ectopic expression of the respective TERF1 variants, the endogenous TERF1/PIN2 are not clearly visible (Middle) Immunoblot with Myc-tag antibody ab32 (1:500) showing specific signals at ~90 kDa. (Bottom) Loading control using an antibody against TATA-binding protein (TBP). Of note, despite equal loading, immunoblot results with both antibodies repeatedly confirmed that the ectopic TERF1-tsi was less abundant than TERF1, indicating a post-translational regulation of the protein stability.
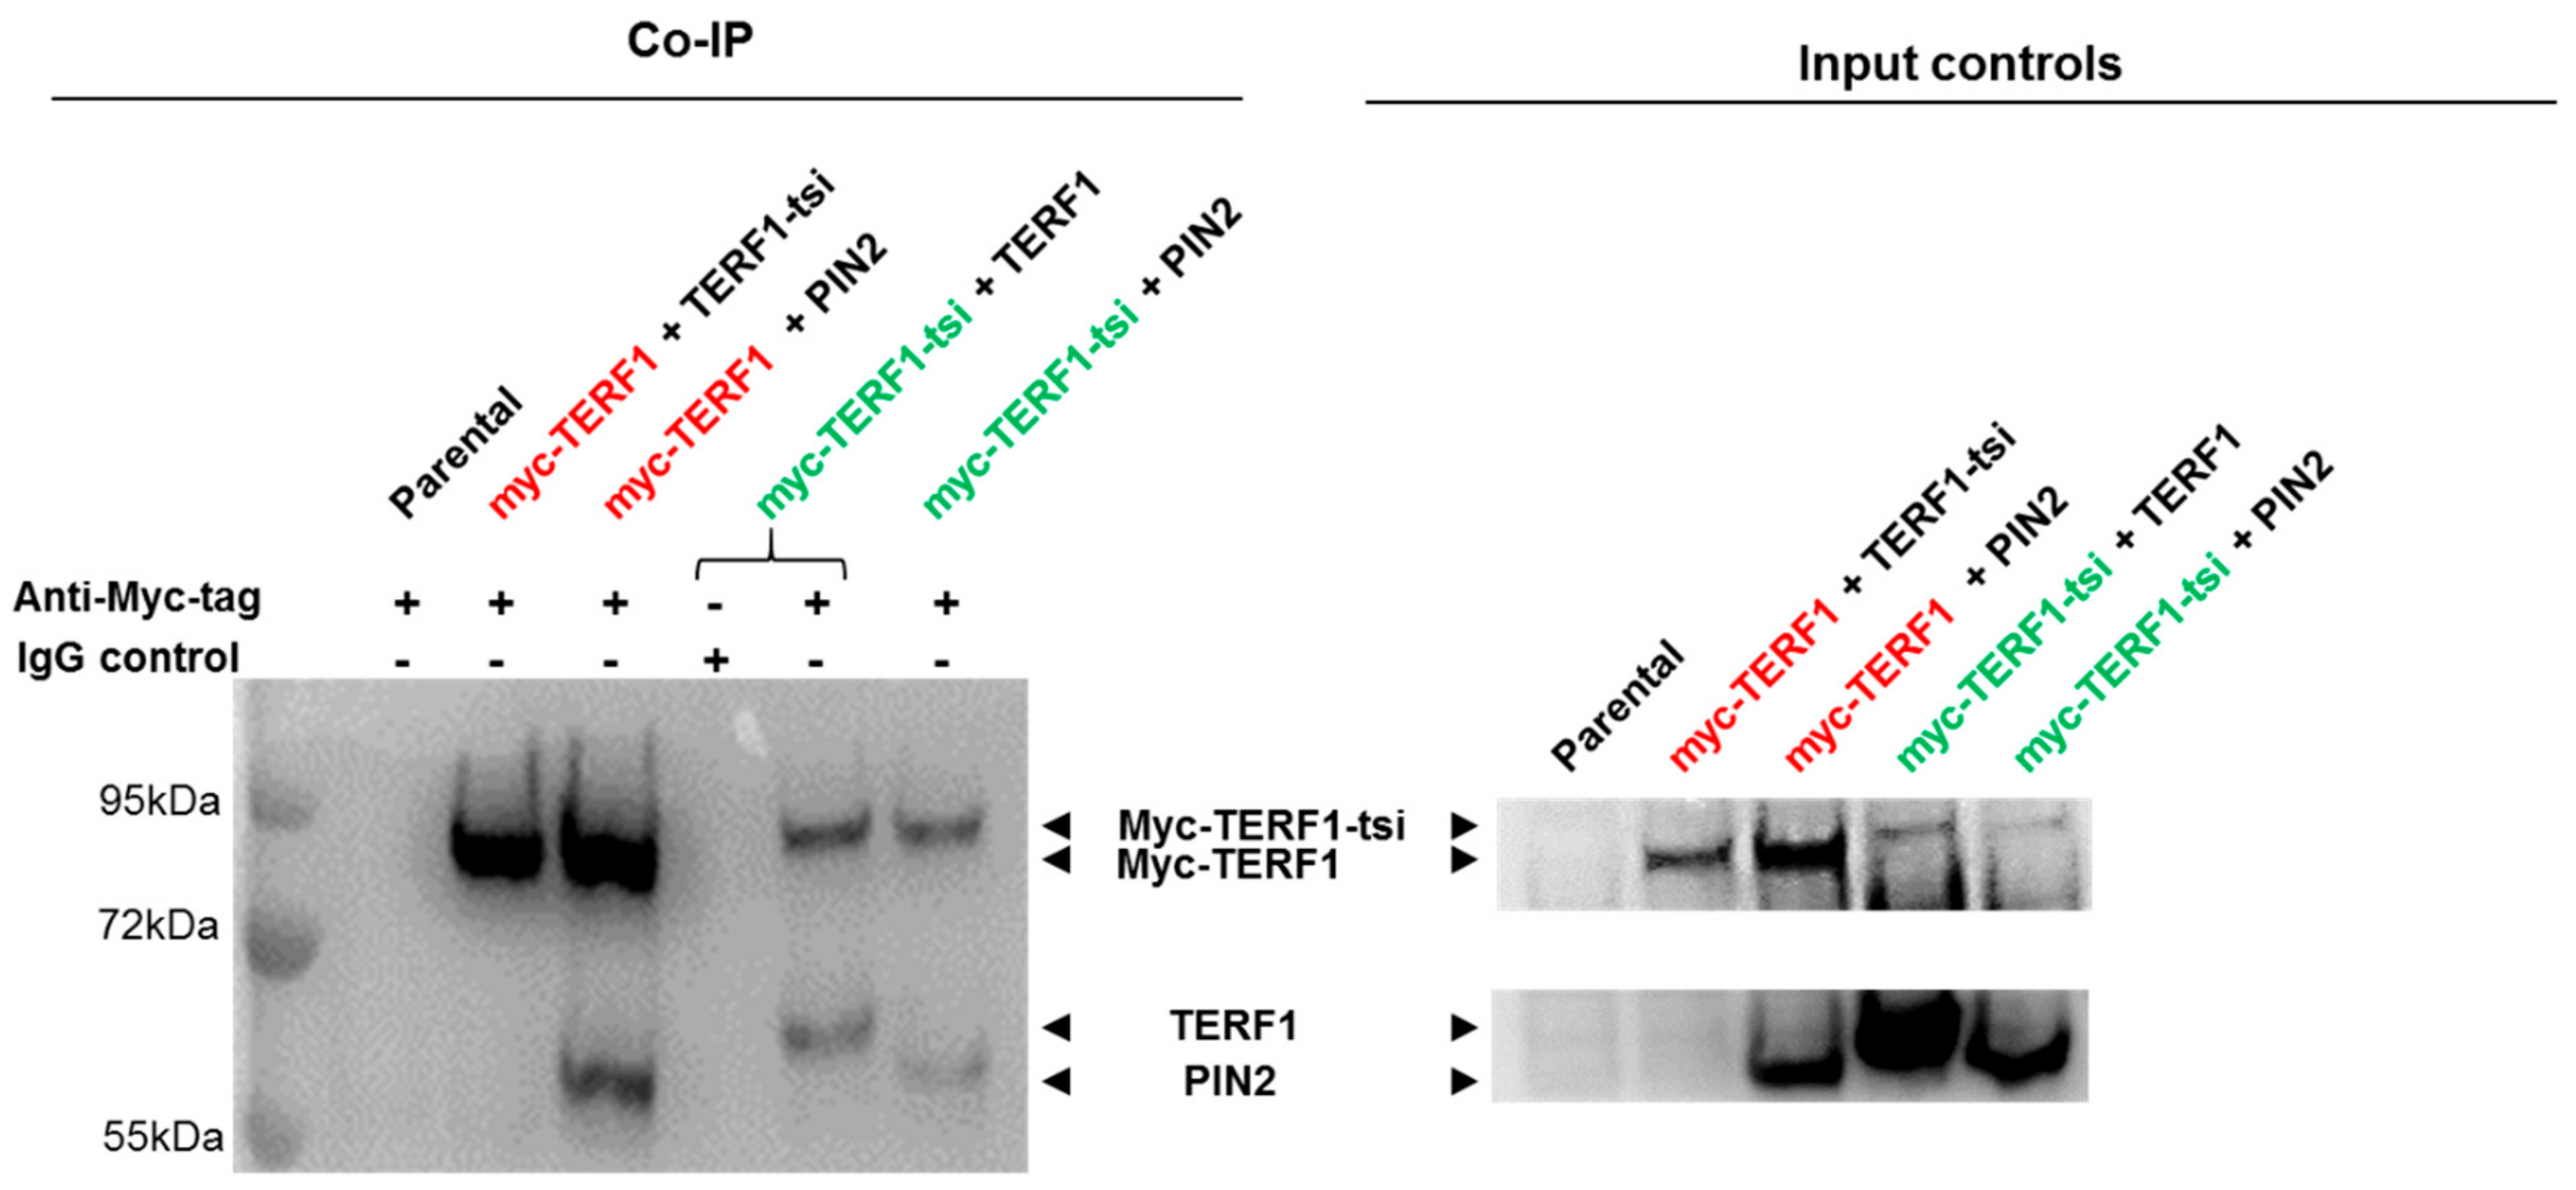
Figure 19.
Potential interaction of endogenous or ectopically co-expressed Myc-tagged or untagged TERF1 isoforms was determined co-immunoprecipitation (Co-IP) experiments. The use of anti-Myc- tag antibody or the IgG control for the IP is indicated by “+” or “-“, respectively. Nuclear lysates from parental and transfected HEK cells were used for the Co-IP (left) and input samples (right). The anti-Myc antibody ab32 or the the IgG control were used for the IP. The indicated proteins were detected by Western blot using panTERF1 antibody ab10579. Please note that two areas of the same membrane are divided into upper and lower parts of the figures for better visualization (top: myc-tagged isoforms, ~90 kDa; and bottom: untagged isoforms, ~60 kDa). The combinations of transfected vectors (either Myc-tagged or untagged) are indicated above the blots. Myc-tagged constructs are indicated by red an green font and untagged constructs are indicated by black font. Exposure time for immunoblot: 2 seconds.
![Ijms 21 00085 g019]()

 ,
, 


