Article

Genome-Wide Identification and Characterization of the Mitochondrial Transcription Termination Factors (mTERFs) in Capsicum annuum L.

1
Longping Branch, Graduate School of Hunan University, Changsha 410125, China
2
Hunan Vegetable Research Institute, Changsha 410125, China
3
College of Horticulture and Landscape, Hunan Agricultural University, Changsha 410125, China
*
Authors to whom correspondence should be addressed.
Int. J. Mol. Sci. 2020, 21(1), 269; https://0-doi-org.brum.beds.ac.uk/10.3390/ijms21010269
Submission received: 21 October 2019 / Revised: 26 December 2019 / Accepted: 28 December 2019 / Published: 31 December 2019
(This article belongs to the Section Molecular Plant Sciences)

Abstract

:
Mitochondrial transcription termination factors (mTERFs) regulate the expression of mitochondrial genes and are closely related to the function of the mitochondrion and chloroplast. In this study, the mTERF gene family in capsicum (Capsicum annuum L.) was identified and characterized through genomic and bioinformatic analyses. Capsicum was found to possess at least 35 mTERF genes (CamTERFs), which were divided into eight major groups following phylogenetic analysis. Analysis of CamTERF promoters revealed the presence of many cis-elements related to the regulation of cellular respiration and photosynthesis. In addition, CamTERF promoters contained cis-elements related to phytohormone regulation and stress responses. Differentially expressed genes in different tissues and developmental phases were identified using RNA-seq data, which revealed that CamTERFs exhibit various expression and co-expression patterns. Gene ontology (GO) annotations associated CamTERFs primarily with mitochondrion and chloroplast function and composition. These results contribute towards understanding the role of mTERFs in capsicum growth, development, and stress responses. Moreover, our data assist in the identification of CamTERFs with important functions, which opens avenues for future studies.

1. Introduction

Most of the genes within mitochondria and chloroplasts have been lost or transferred to the nucleus during the evolution of bacterial progenitors of different plant species; however, many important genes remain in mitochondrion and chloroplast genomes to coordinate processes such as gene expression, photosynthesis, and the electron transport chain [1,2]. Although mitochondrion and chloroplast genes retain the characteristics of prokaryotic expression, they have expanded and evolved with nuclear genes in plants, resulting in molecular mechanisms of transcription and replication that are more complicated than those of their progenitors [3]. Mitochondrial transcription termination factor (mTERF) proteins belong to a protein superfamily characterized by an mTERF motif (a leucine zipper consisting of 30 leucine residues). mTERFs are encoded by nuclear genes, which target the mitochondria following translation [4]. mTERFs are involved in the regulation of mitochondrial DNA replication as well as gene transcription and translation through their binding to mitochondrial nucleic acid [5].
mTERFs were first characterized in animal mitochondria and denoted transcription termination factors. mTERFs are grouped into four subfamilies, with different subfamilies having different biological functions according to the number and location of mTERF motifs [5,6]. In metazoans, mTERFs are important transcription termination factors [7,8]. In mice, mTERF3 and mTERF4 are required for embryogenesis—mTERF3 binds to the promoter region of mitochondrial DNA, initiating negative transcription regulation [9], whereas mTERF4 controls the biogenesis and activity of mitochondrial ribosomes by recruiting rRNA large subunit methyltransferase [10]. In humans, mTERF3 and mTERF4 function through binding RNA. In addition, in vitro experiments showed that mitochondrial DNA mediates the interactions between different mTERF proteins, indicating that mTERF functions are differentiated by the mitochondrial DNA properties of different organisms [11].
In plants, the expression of mitochondrial genes is essential for plant development, photosynthesis, and cellular respiration. Mitochondrial gene expression requires the specific binding of various nuclear-encoded proteins to mitochondrial DNA (mtDNA) to facilitate RNA transcription, splicing, modification, and regulation of the translation process. MOCs are the mTERF-like proteins of Chlamydomonas reinhardtii. MOCs comprise six subfamilies, namely MOC1–6, which have a similar function to that of SOLDAT10 in Arabidopsis (Arabidopsis thaliana) [12]. Past research reported that MOC1 function was related to hydrogen generation during the photoreaction process [13], and MOC1 loss-of-function renders Chlamydomonas sensitive to strong light, destroys the stability of the mitochondrial respiratory chain complex, and also results in the termination of mtDNA transcription [14].
Compared with bryophytes or algae, there is a greater abundance of mTERF genes in angiosperm genomes, which encode proteins localized to mitochondria or chloroplasts that function in plant development and stress resistance [15]. Queries of PlnTFDB, a transcription factor database (http://plntfdb.bio.uni-potsdam.de/v3.0/) [16], shows that Arabidopsis has 35 mTERFs [17], rice (Oryza sativa subsp. Japonica) has 30 mTERFs, and maize (Zea mays) has 31 mTERFs [18].
Research on the function of mTERFs and their mechanisms is currently limited. Several studies on mTERFs in Arabidopsis were reported. mTERF1/2/5/6/8/9/10/11/12 were shown to localize to chloroplasts, with mTERF6 also targeting the mitochondria [17,19]. soldat10/flu double mutant seedlings affected in mTERF1 in the flu mutant background did not display the lethal 1O2 generation upon a dark-to-light shift (typical of the flu mutation because of disrupted chloroplast homeostasis), indicating a role for mTERF1 in plastid signaling and chloroplast biogenesis [12]. The cotyledons, leaves, stems, and bracts of the mTERF5 deletion mutant mda1 are lighter in color, and mda1 plants are more tolerant of osmotic stress and less ABA(Abscisic acid) sensitive [20]. PED191 (mTERF6) functions in the development of leaf color, with early chloroplast development blocked in the corresponding mutant, resulting in albino seedlings or lethality [21]. Past research has shown that the nuclear-encoded mTERF6 protein binds to an RNA sequence located in the tRNA for Ile(GAU), and a relative deficit in mature chloroplast ribosomal RNAs in mterf6 mutants leads to a reduction in the number of functional ribosomes, thus compromising chloroplast protein synthesis and consequently perturbing chloroplast development and plant growth [22]. Recently, it was shown that mTERF6 directly associates with the 3′-end sequence of the rpoA polycistron in vitro and in vivo, and that the lack of mTERF6 promotes read-through transcription at this site, thus further demonstrating the essential role of mTERF6 in chloroplast gene expression and development [23]. Through characterization of the mterf6-5 mutant, it was found that the corresponding mutation enhanced the leaf phenotype of the asymmetric leaf mutant as1-1, causing leaves to appear radial, and led to lethality in the early stage of vegetative development, revealing a further role for mTERF6 in leaf patterning and highlighting the importance of mTERFs in plant development [24]. PTAC15 (mTERF8) was purified from an Arabidopsis transcriptionally active plastid chromosome complex and proposed to take part in the transcriptional regulation of chloroplast DNA [25]. Recent RNA blot analysis showed that a larger transcript derived from the psbEFLJ polycistron accumulates in the mterf8 mutant than that observed in the wild type, and electrophoresis mobility shift assays, chloroplast chromatin immunoprecipitation, and transcriptional analysis using the in vitro T7 RNA polymerase system showed that mTERF8 specifically binds to the 3′terminal region of psbJ, suggesting that mTERF8 is specifically involved in the transcription termination of the chloroplast gene psbJ [26]. In Arabidopsis, RUG2/BSM (mTERF4) is localized to chloroplasts and mitochondria, and its loss of function leads to dysplasia of chloroplasts and mitochondria, homozygous embryonic developmental stagnation, as well as altered gene expression in chloroplasts, mitochondria, and the nucleus, suggesting that it may be a key factor meditating communication between chloroplasts/mitochondria and the nucleus [27]. In maize, Zm-mTERF4 coimmunoprecipitates with many chloroplast introns and the splicing of some of these introns is disrupted even in hypomorphic Zm-mterf4 mutants. Furthermore, the splicing of two transfer RNAs (trnI-GAU and trnA-UGC) and one ribosomal protein messenger RNA (rpl2) is particularly sensitive to the loss of Zm-mTERF4, accounting for the loss of plastid ribosomes in Zm-mterf4 mutants. These findings extend the known functional repertoire of the mTERF family to include group-II intron splicing and suggest that a conserved role for mTERFs in chloroplast RNA splicing underlies the physiological defects associated with mutations in RUG2/BSM, the Zm-mTERF4 ortholog in Arabidopsis [28]. An analysis of the effects of mTERF9 mutation revealed functions for mTERF9 in ABA-, salt-, and osmotic-stress responses [29]. mTERF11 over-expression plants displayed enhanced salt tolerance when grown on MS media with added NaCl [19]. Moreover, the over-expression of mTERF10 promoted seed germination and seedling growth on NaCl-containing MS media with added ABA, indicating that mTERF10 may play a role in ABA-mediated salt tolerance [19].
The above-mentioned studies indicate that the majority of chloroplast-associated mTERFs regulate the function of chloroplasts by regulating the expression of chloroplast and nuclear genes, which in turn affects leaf morphology and color and some abiotic-stress responses. Moreover, mTERF15 and mTERF18 are specifically localized to mitochondria [30]. The mTERF18 mutant (shot1) is characterized by dark green leaves, low ROS accumulation, high heat resistance, and the upregulation of both respiratory electron transport chain-related and various stress-response genes [31]. mTERF15 functions in the plant growth cycle [30]. Mitochondria-associated mTERFs may play roles in the stability of mitochondrial gene expression and mitochondrial function.
The capsicum (Capsicum annuum L.) complete genome sequence [32,33] has laid the foundation for further study of the functions of capsicum genes and the relationships between them. However, characterization of the capsicum mTERF (CamTERF) family has not been reported yet. Here, we identified CamTERFs through bioinformatic analysis, then characterized their basic properties, chromosomal locations, tandem repeats, evolutionary relationships, and promoter cis-elements, as well as their tissue, organ, fruit-development, and abiotic-stress expression patterns. This study aimed to provide a foundation for the understanding of CamTERF functions in normal plant developmental processes and under osmotic stress.

2. Results

2.1. Basic Characterization of CamTERFs and Comparison between Available Capsicum Genome Databases

Based on bioinformatic methods, a total of 35 and 34 CamTERFs were identified in the Zunla-1 and CM334 genome databases, respectively. These candidates were further refined through SMART conserved motif and iTAK transcription factor identification. The two groups of candidate CamTERFs were subjected to a blastp alignment in order to identify those homologous genes whose shared sequence identity was more than 95%.
The 35 Zunla-1 CamTERFs were categorized by their chromosomal locations, and denoted CamTERF1–35. These Zunla-1 CamTERFs were primarily used for the remainder of the analyses in this study. The longest CamTERF was CamTERF29, comprising 1971 amino acid residues, whereas the shortest CamTERF was CamTERF20, comprising only 327 residues (Table 1). In addition, no homologous gene in the CM334 group was identified for CamTERF20. The isoelectric points of CamTERFs ranged from 6.1 (CamTERF28) to 10.02 (CamTERF22 and CamTERF27), and their molecular masses ranged from 12.4 KD (CamTERF20) to 67.82 KD (CamTERF10).
Considering the incompleteness of the capsicum genome, those genes whose chromosomal information was unclear were denoted as “00g”. There were 34 homologous gene pairs identified between Zunla-1 and CM334, of which 19 pairs exhibited the same chromosomal annotation information. Ten genes (CamTERF5, CamTERF15, CamTERF16, CamTERF17, CamTERF18, CamTERF21, CamTERF24, CamTERF25, CamTERF29, and CamTERF33) that had chromosomal records in the Zunla-1 genome had no annotation in the CM334 genome; seven of these genes were located on Chr4 according to the Zunla-1 genome. Two genes (CamTERF2 and CamTERF3) that had chromosomal information in the CM334 genome had no chromosomal annotation in the Zunla-1 genome. Three genes (CamTERF19, CamTERF23, and CamTERF34) were annotated as localized on different chromosomes in either genome database. These results indicate that both the Zunla-1 and CM334 databases cannot provide complete capsicum genome annotation information. For CamTERFs, the most remarkable difference was observed on chromosome 4. Further studies on CamTERFs would contribute to improved annotation of the two genome databases.

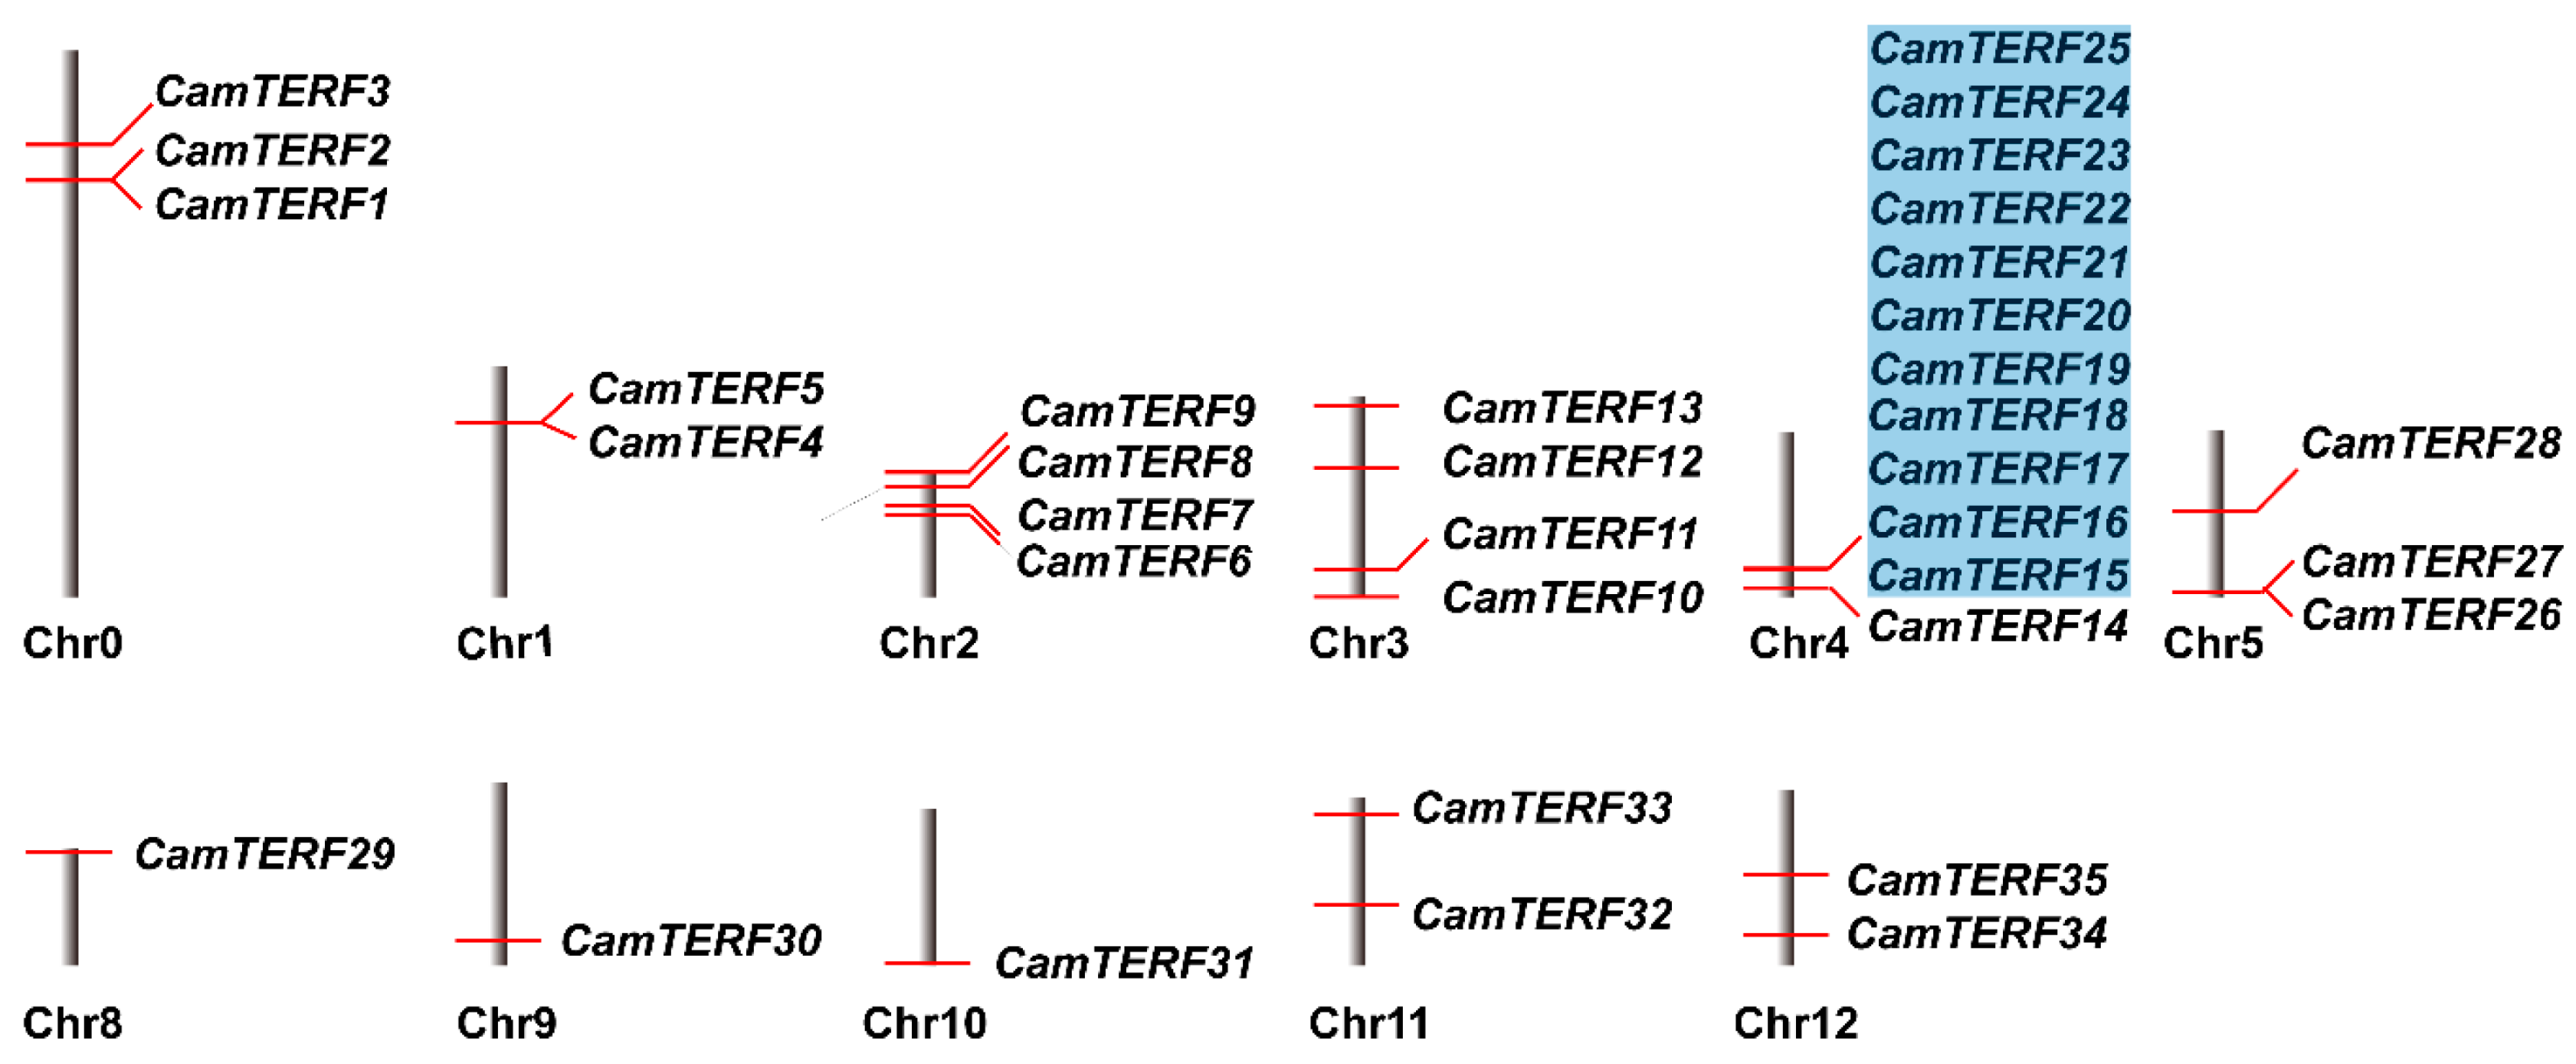
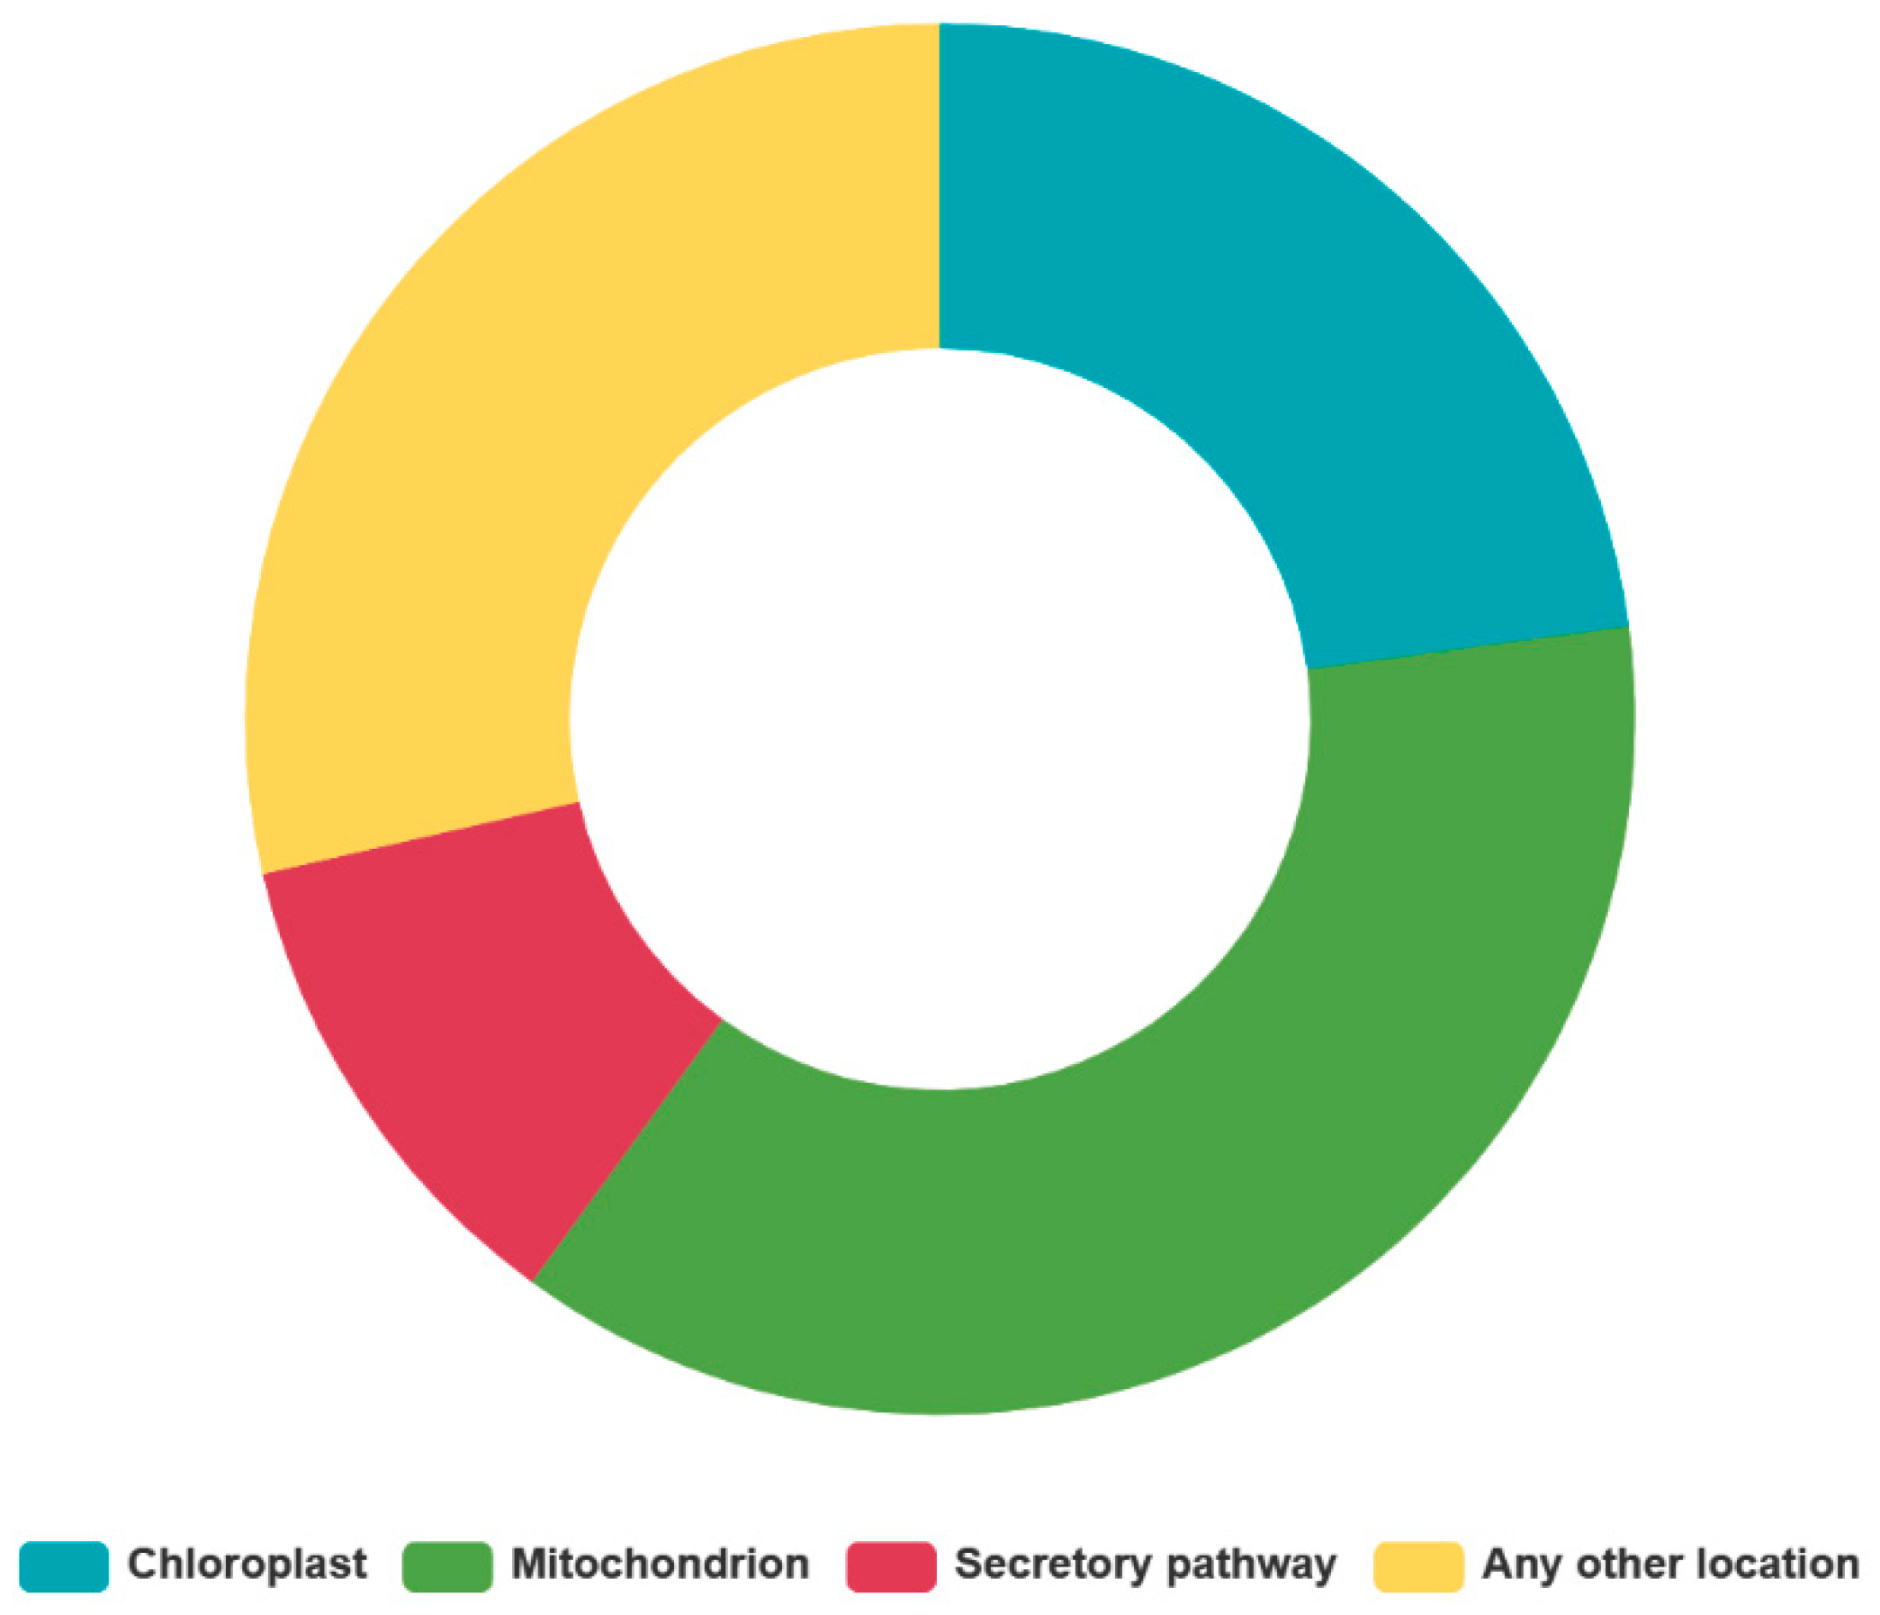
2.2. Analysis of CamTERFs Chromosomal Location and Subcellular Localization

Figure 1 depicts the distribution of the 35 CamTERFs across the ten capsicum chromosomes. Those genes whose chromosomal location was unavailable are denoted here as Chr0. Analysis of the chromosomal location of CamTERFs illustrated that there are no CamTERFs on Chr6 and Chr7, and that Chr4 contained the most CamTERFs (12 genes). Among these 12 CamTERFs, 11 are tandem repeat genes that are symmetrically distributed at the front end of chromosome 4, with a length of 36.52–37.05 Mb. Chr2, Chr3, and Chr5 were found to contain three to four CamTERFs, whereas Chr1, Chr8, Chr9, Chr10, and Chr11 contain only one to two CamTERFs. In general, CamTERFs showed a cluster phenomenon in specific segments of chromosome 4, whereas they were relatively scattered across the other chromosomes. This arrangement may be related to the tandem repeat event on Chr4. Table 2 and Figure 2 describe how most CamTERFs were found to be localized in mitochondria or chloroplasts, thus leading to the presumption that the functions of CamTERFs are related to these organelles. Cellular localization prediction based on protein sequence indicated that there are 14 CamTERFs not associated with either chloroplasts or mitochondria. These proteins are of interest and further experimental verification is needed to determine their cellular localization as part of the continual functional research of CamTERFs.

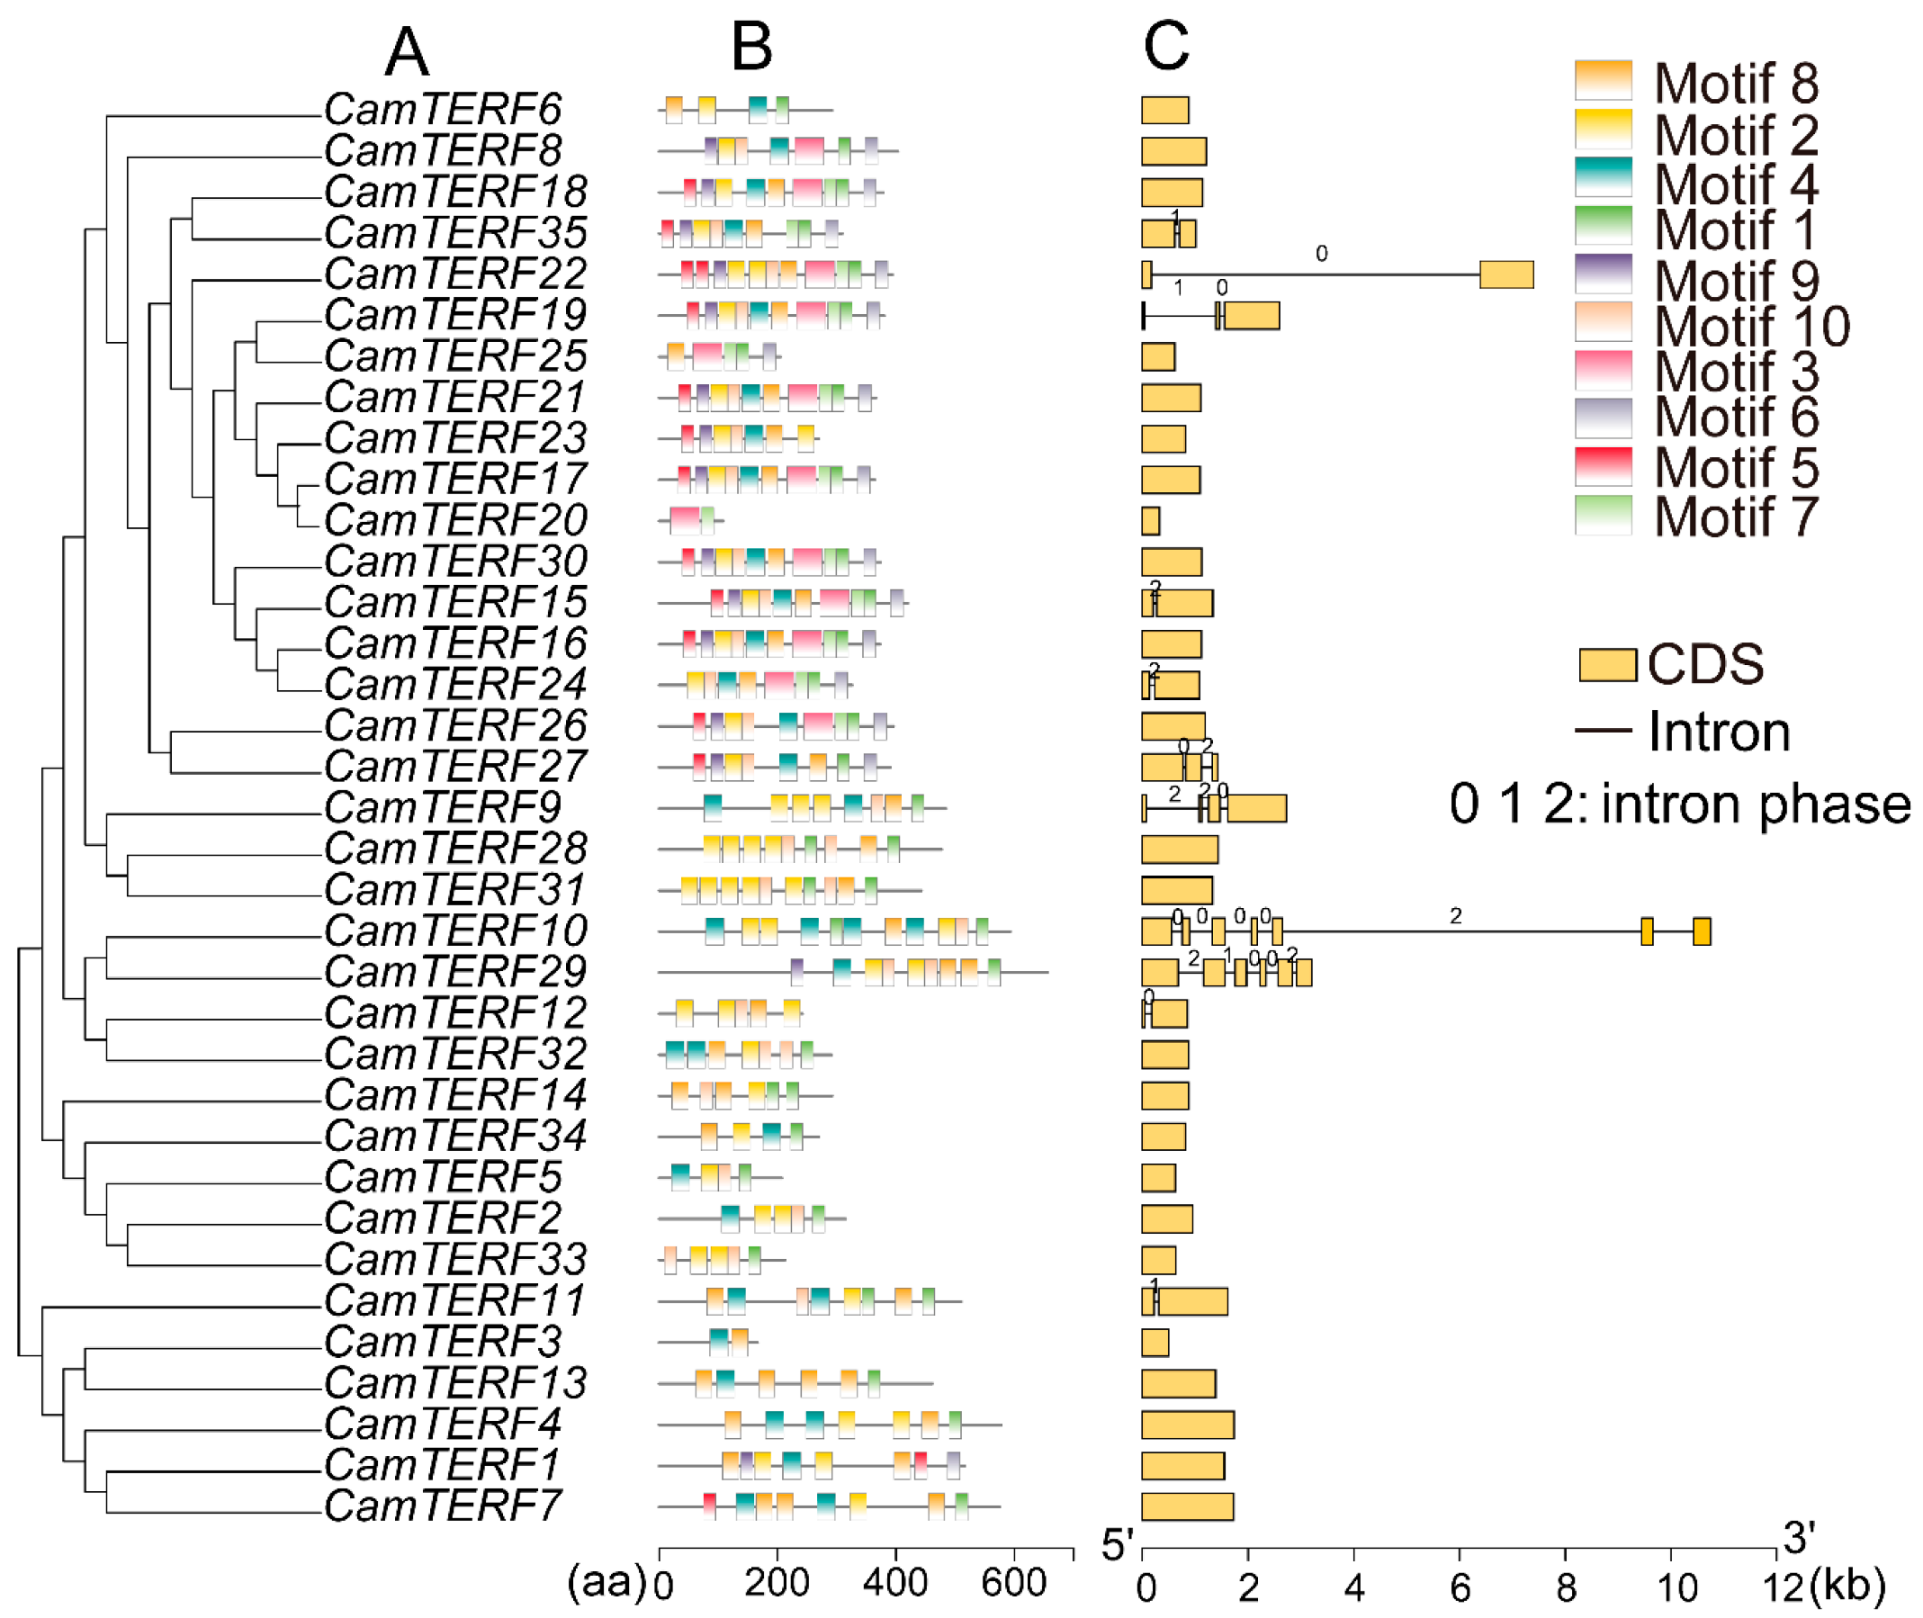
2.3. Phylogenetic Relationships, Gene Structures, and Motifs of CamTERFs

Figure 3 depicts the structure of each CamTERF, including the number of introns and exons and intron phase, which may be related to evolution and gene function. Intron phase among CamTERFs was found to vary from phase 0 to phase 2. For phase 0 introns, the exons connected on both sides can be rearranged and connected without limits. Results of the gene structure analysis showed that 24 CamTERFs (68.6% of the entire group of 35 CamTERFs) have no introns, 6 CamTERFs (17.1%) have only one intron, and 5 CamTERFs (14.3%) have more than one intron. CamTERF10 was found to have six introns, which represents the greatest number of introns among all CamTERFs. In addition, five of the introns in CamTERF10 are phase 0. Furthermore, ten conserved motifs in CamTERFs were predicted using the MEME(Multiple Em for Motif Elicitation) website, which were found to consist of 21–50 amino acids (sequences are shown in Table 3).

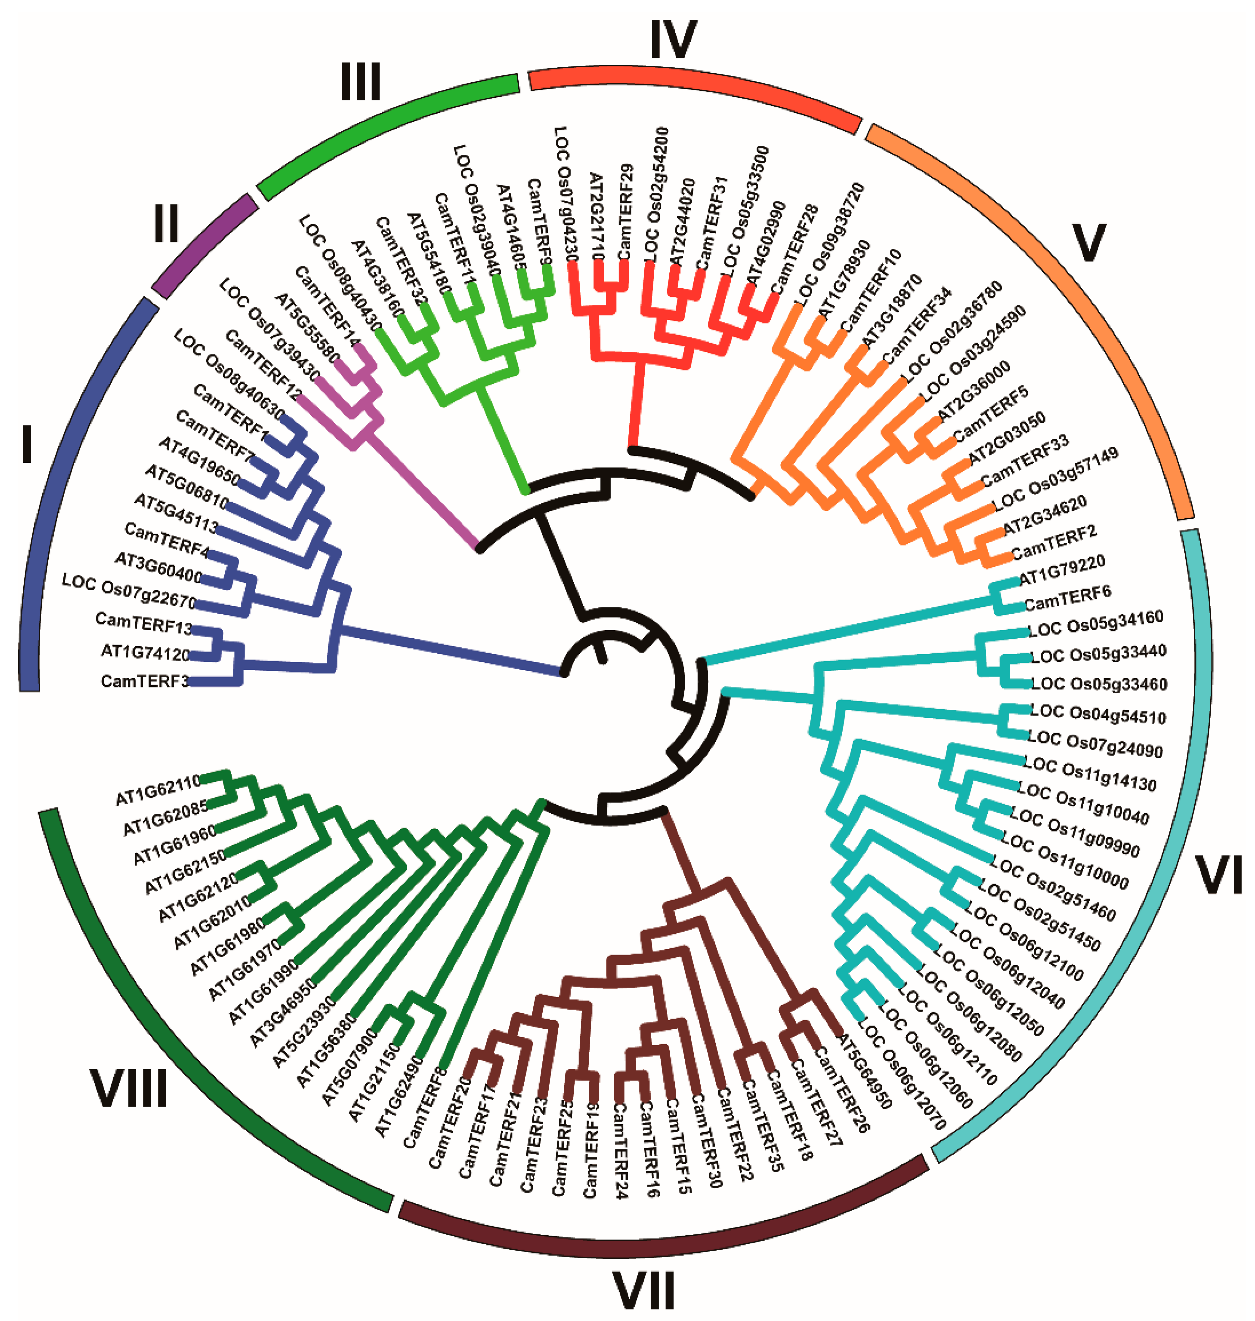
2.4. Homologous Relationships among mTERFs of Capsicum, Rice, and Arabidopsis

In order to better understand the homologous evolutionary relationship among mTERFs of capsicum and the model species rice and Arabidopsis, the phylogenetic relationships between mTERFs of capsicum, Arabidopsis, and rice were analyzed by generating a phylogenetic tree constructed using the adjacency algorithm (NJ). The resulting phylogenetic tree consists of 30 mTERF sequences from rice, 34 mTERF sequences from Arabidopsis, and 35 mTERF sequences from capsicum, as shown in Figure 4. According to the gene family classification of Arabidopsis [17] and the mTERF phylogenetic tree, mTERFs of the three analyzed species were classified into eight groups. Group VI and VIII contained the least members, with only one CamTERF included in each. Group VII had the largest number of members, including 15 CamTERFs. Furthermore, group II had two CamTERFs, groups III and IV had three CamTERFs, and groups I and V had five CamTERFs.
Phylogenetic analysis showed that groups VI, VII, and VIII were mainly enriched in the mTERFs of rice, capsicum, and Arabidopsis, respectively. The remaining mTERFs of the three species were distributed fairly evenly among groups I to V. These results suggest that groups VI, VII, and VIII represent specific gene clusters of rice, capsicum, and Arabidopsis, respectively, which were formed during evolution of the mTERF family.

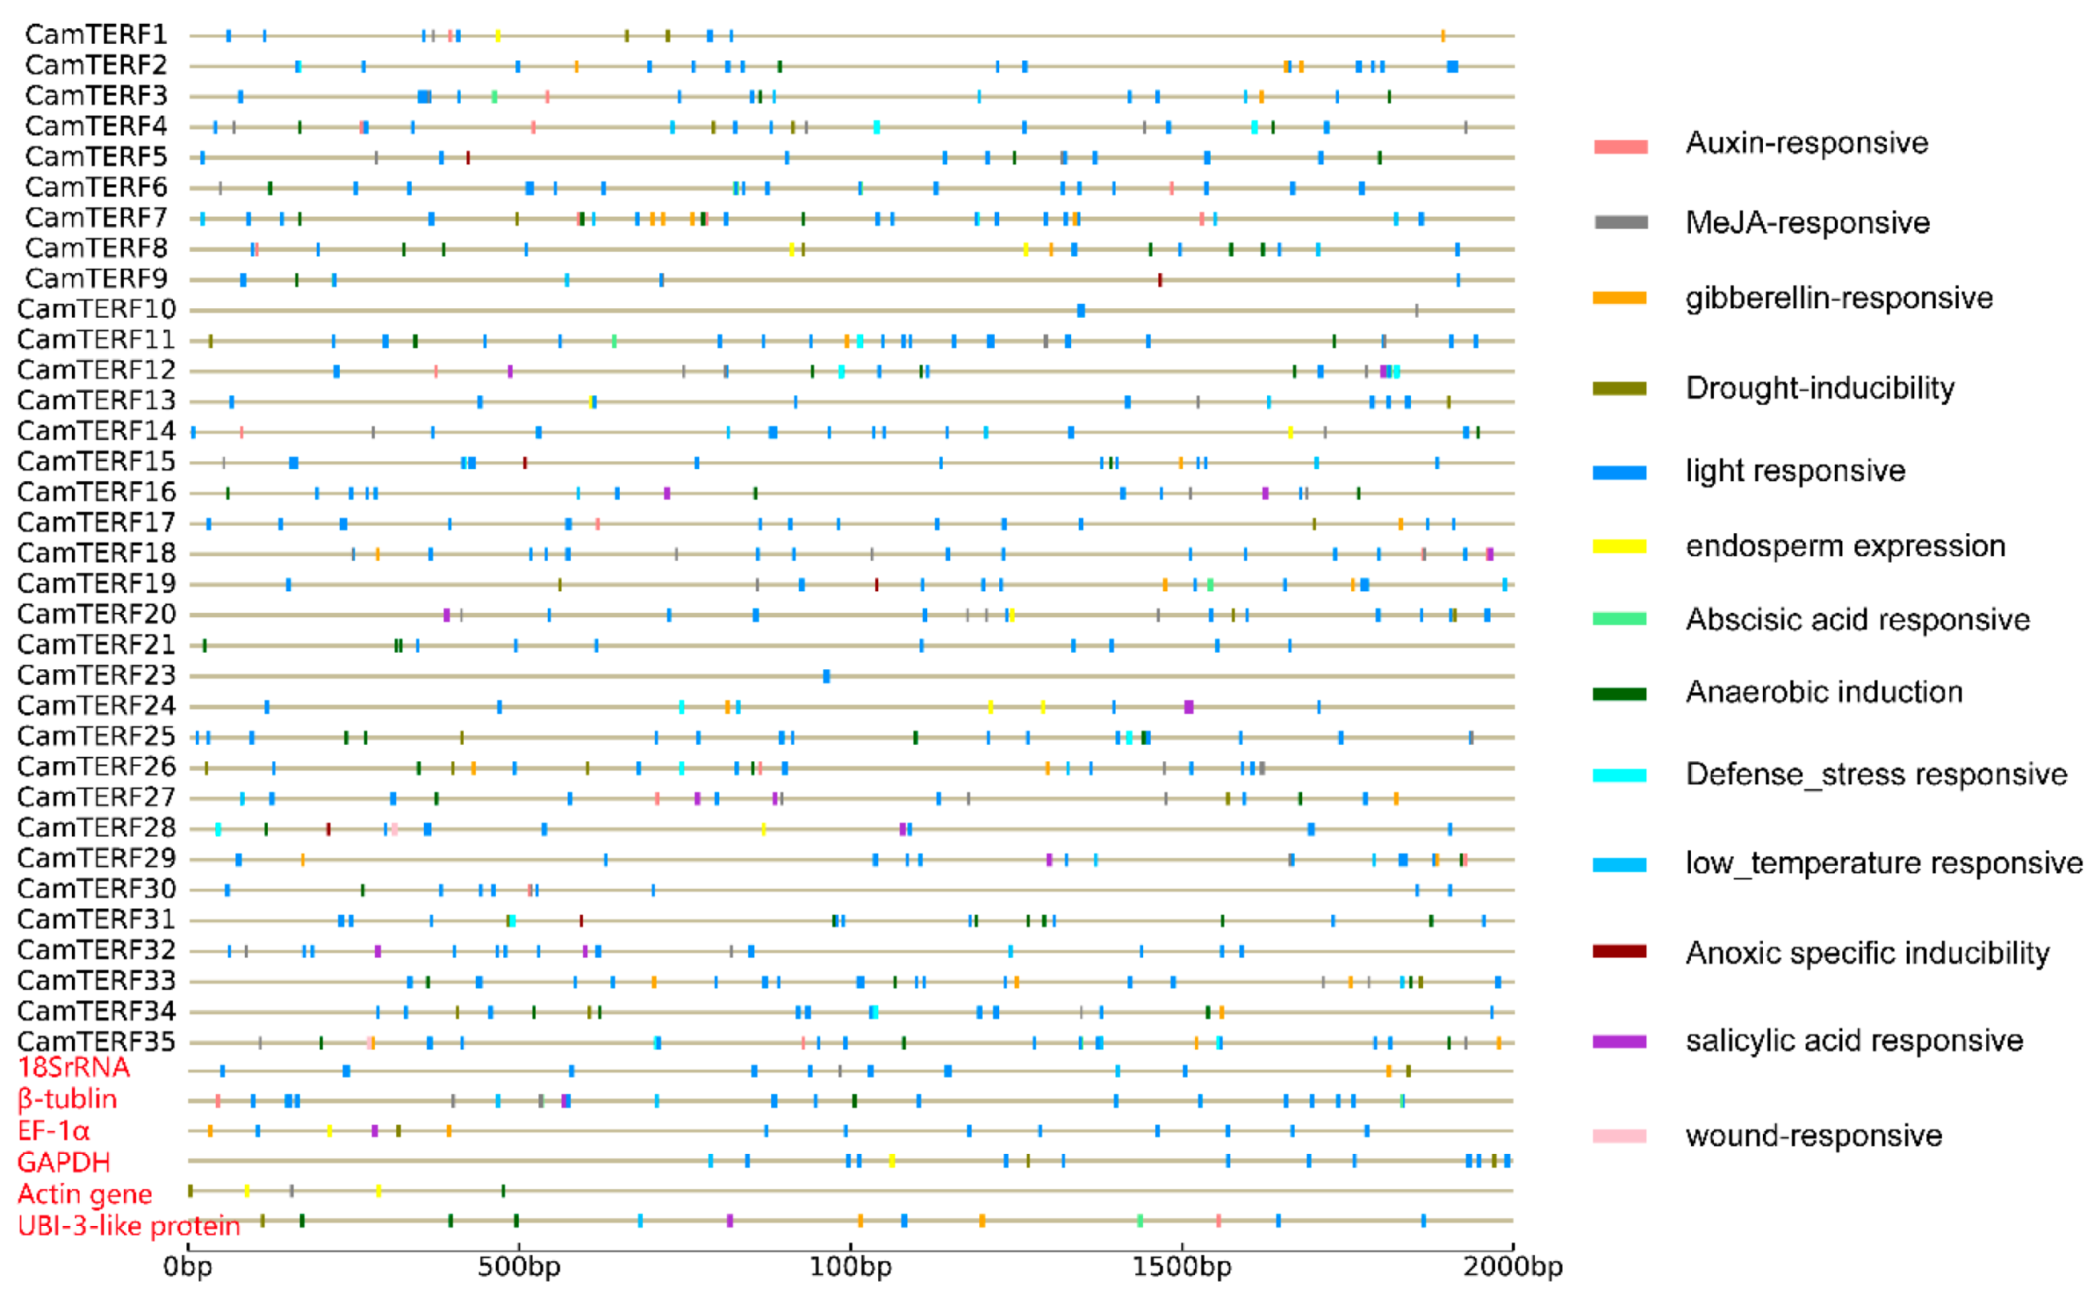
2.5. Analysis of CamTERF Promoter cis-Elements

To further investigate the potential regulatory mechanisms of CamTERFs in chloroplast and mitochondrion functions and abiotic-stress responses, the 2 kb sequence upstream of the translation initiation site of each CamTERF was tested using the PlantCARE tool, and also six housekeeping genes were chosen in pepper [34]—specific information about those genes are shown in Table S1. Potential CamTERF cis-elements were obtained, as shown in Figure 5, and the housekeeping genes information are in red. The CamTERFs promoter sequences were found to contain many abiotic stress-related elements, such as light-responsive elements, many hormone regulation-related cis-elements, such as those responsive to auxin, MeJA(Methyl Jasmonate), gibberellin, abscisic acid, anoxic conditions, and salicylic acid, as well as many osmotic stress-related cis-elements, such as those responsive to low temperature and drought. Among the six housekeeping genes, 18SrRNA, β-tublin, EF-1a, and GAPDH have many light responsive elements, however Actin gene and UBI-3-like protein contain less. Compared with six housekeeping genes, CamTERF2,6,7,11,14 are more light-responsive and CamTERF7 is more gibberellin-responsive.

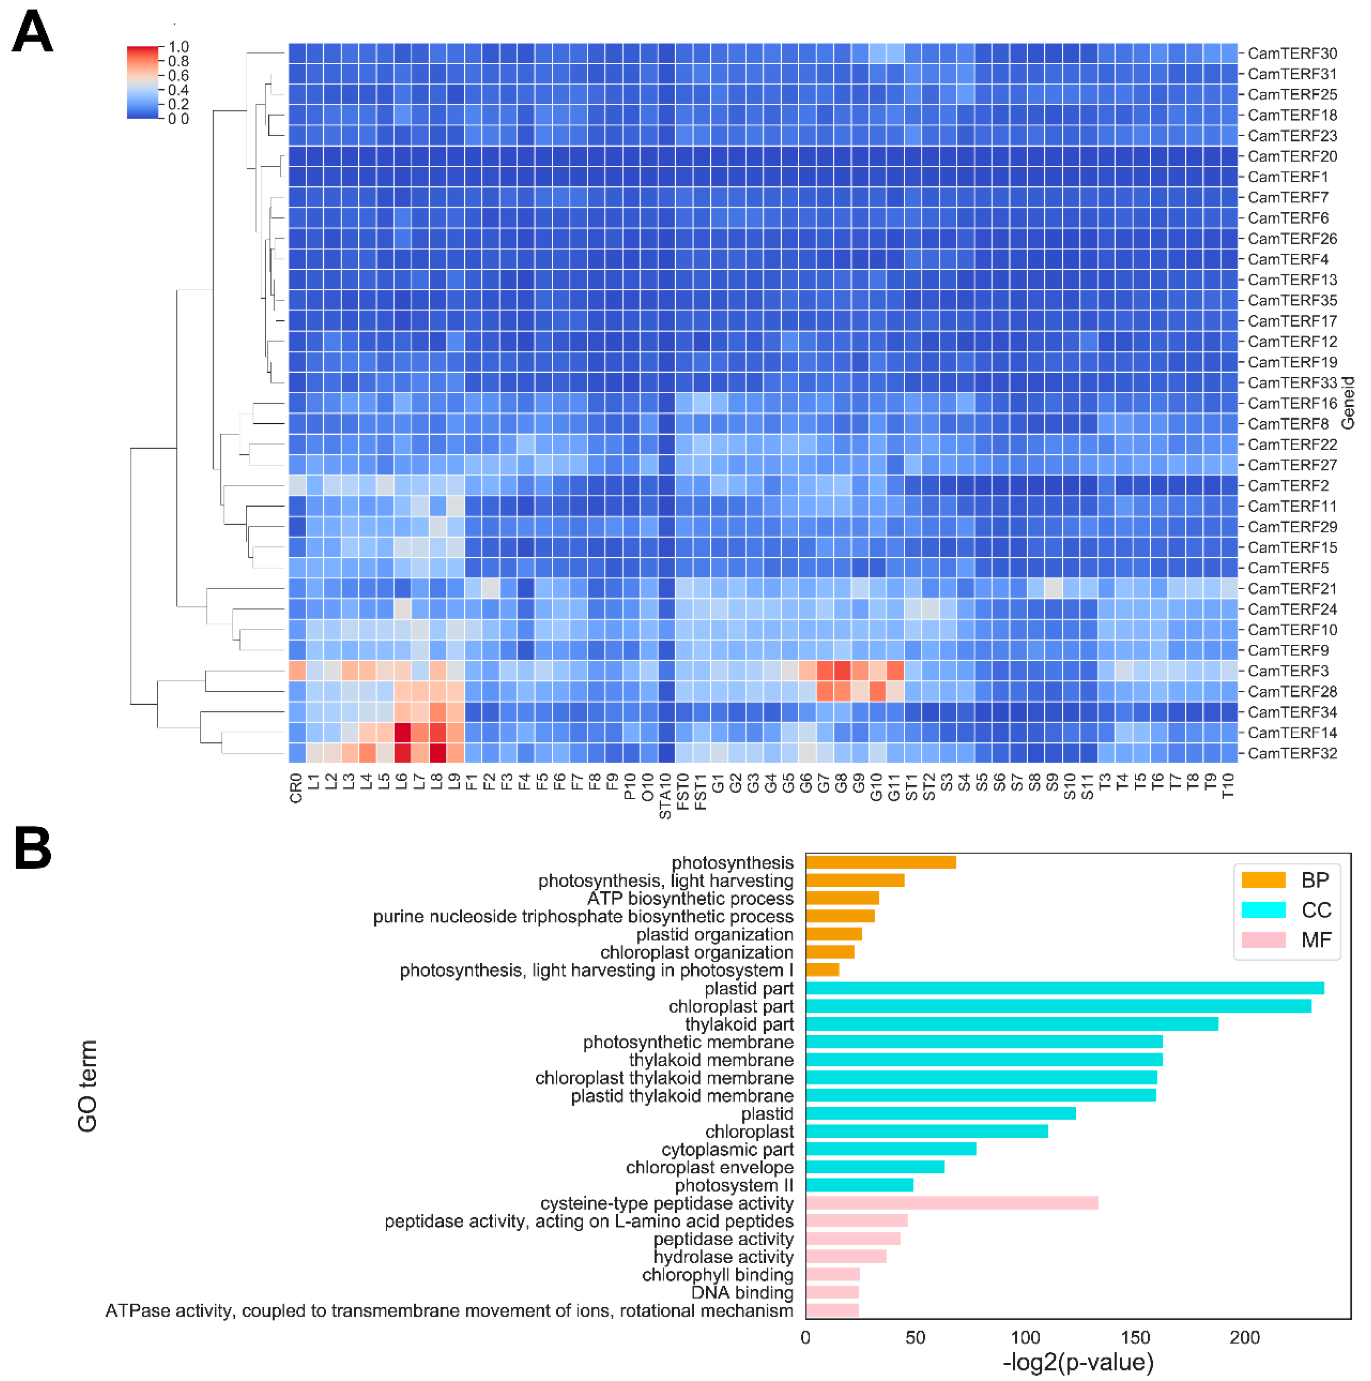
2.6. Analysis of CamTERFs Expression Patterns and GO Enrichment Analysis of CamTERFs Co-Expressing Genes

A rich set of tissue expression data was obtained by RNA-seq analysis using different tissues in different developmental phases alongside the CamTERFs RNA-seq FPKM (Fragments Per Kilobase Million) data list detailed in Table S2 and the sample data list detailed in Table S3. The expression patterns of CamTERFs in different tissues were illustrated with a heat map (Figure 6A). The horizontal axis shows the names of different tissues in different developmental phases and treatment conditions. Except for CamTERF1 and CamTERF20, expression of the majority of CamTERFs was detected in at least one tissue type. CamTERF3, CamTERF28, CamTERF34, CamTERF14, and CamTERF32 were found to be expressed in all tissues. These genes displayed their highest expression level in leaves and peels, lowest expression level in seeds, and a moderate expression level in other tissues. Moreover, these five genes exhibited significant differential expression over the nine developmental phases of leaf tissue. With progressing leaf development, the expression levels of these five genes first increased and then decreased, suggesting that they function in the regulation of leaf development.
GO (Gene ontology) enrichment analysis was used to understand the function of individual and co-expressed CamTERFs. As depicted in Figure 6B, the resulting associated terms were classified into biological process (BP), molecular function (MF), and cellular component (CC). Highly-enriched GO terms included photosynthesis (GO:0015979), photosynthesis, light harvesting (GO:0009765), and ATP biosynthetic process’ (GO:0006754) in the BP category; plastid part (GO:0044435), chloroplast part (GO:0044434), and photosynthetic membrane (GO:0034357) in the CC category; and cysteine-type peptidase activity (GO:0008234), peptidase activity, acting on l-amino acid peptides (GO:0070011), and peptidase activity (GO:0008233) in the MF category. The co-expressed CamTERFs were associated with 222 GO terms, as listed in Table S4.

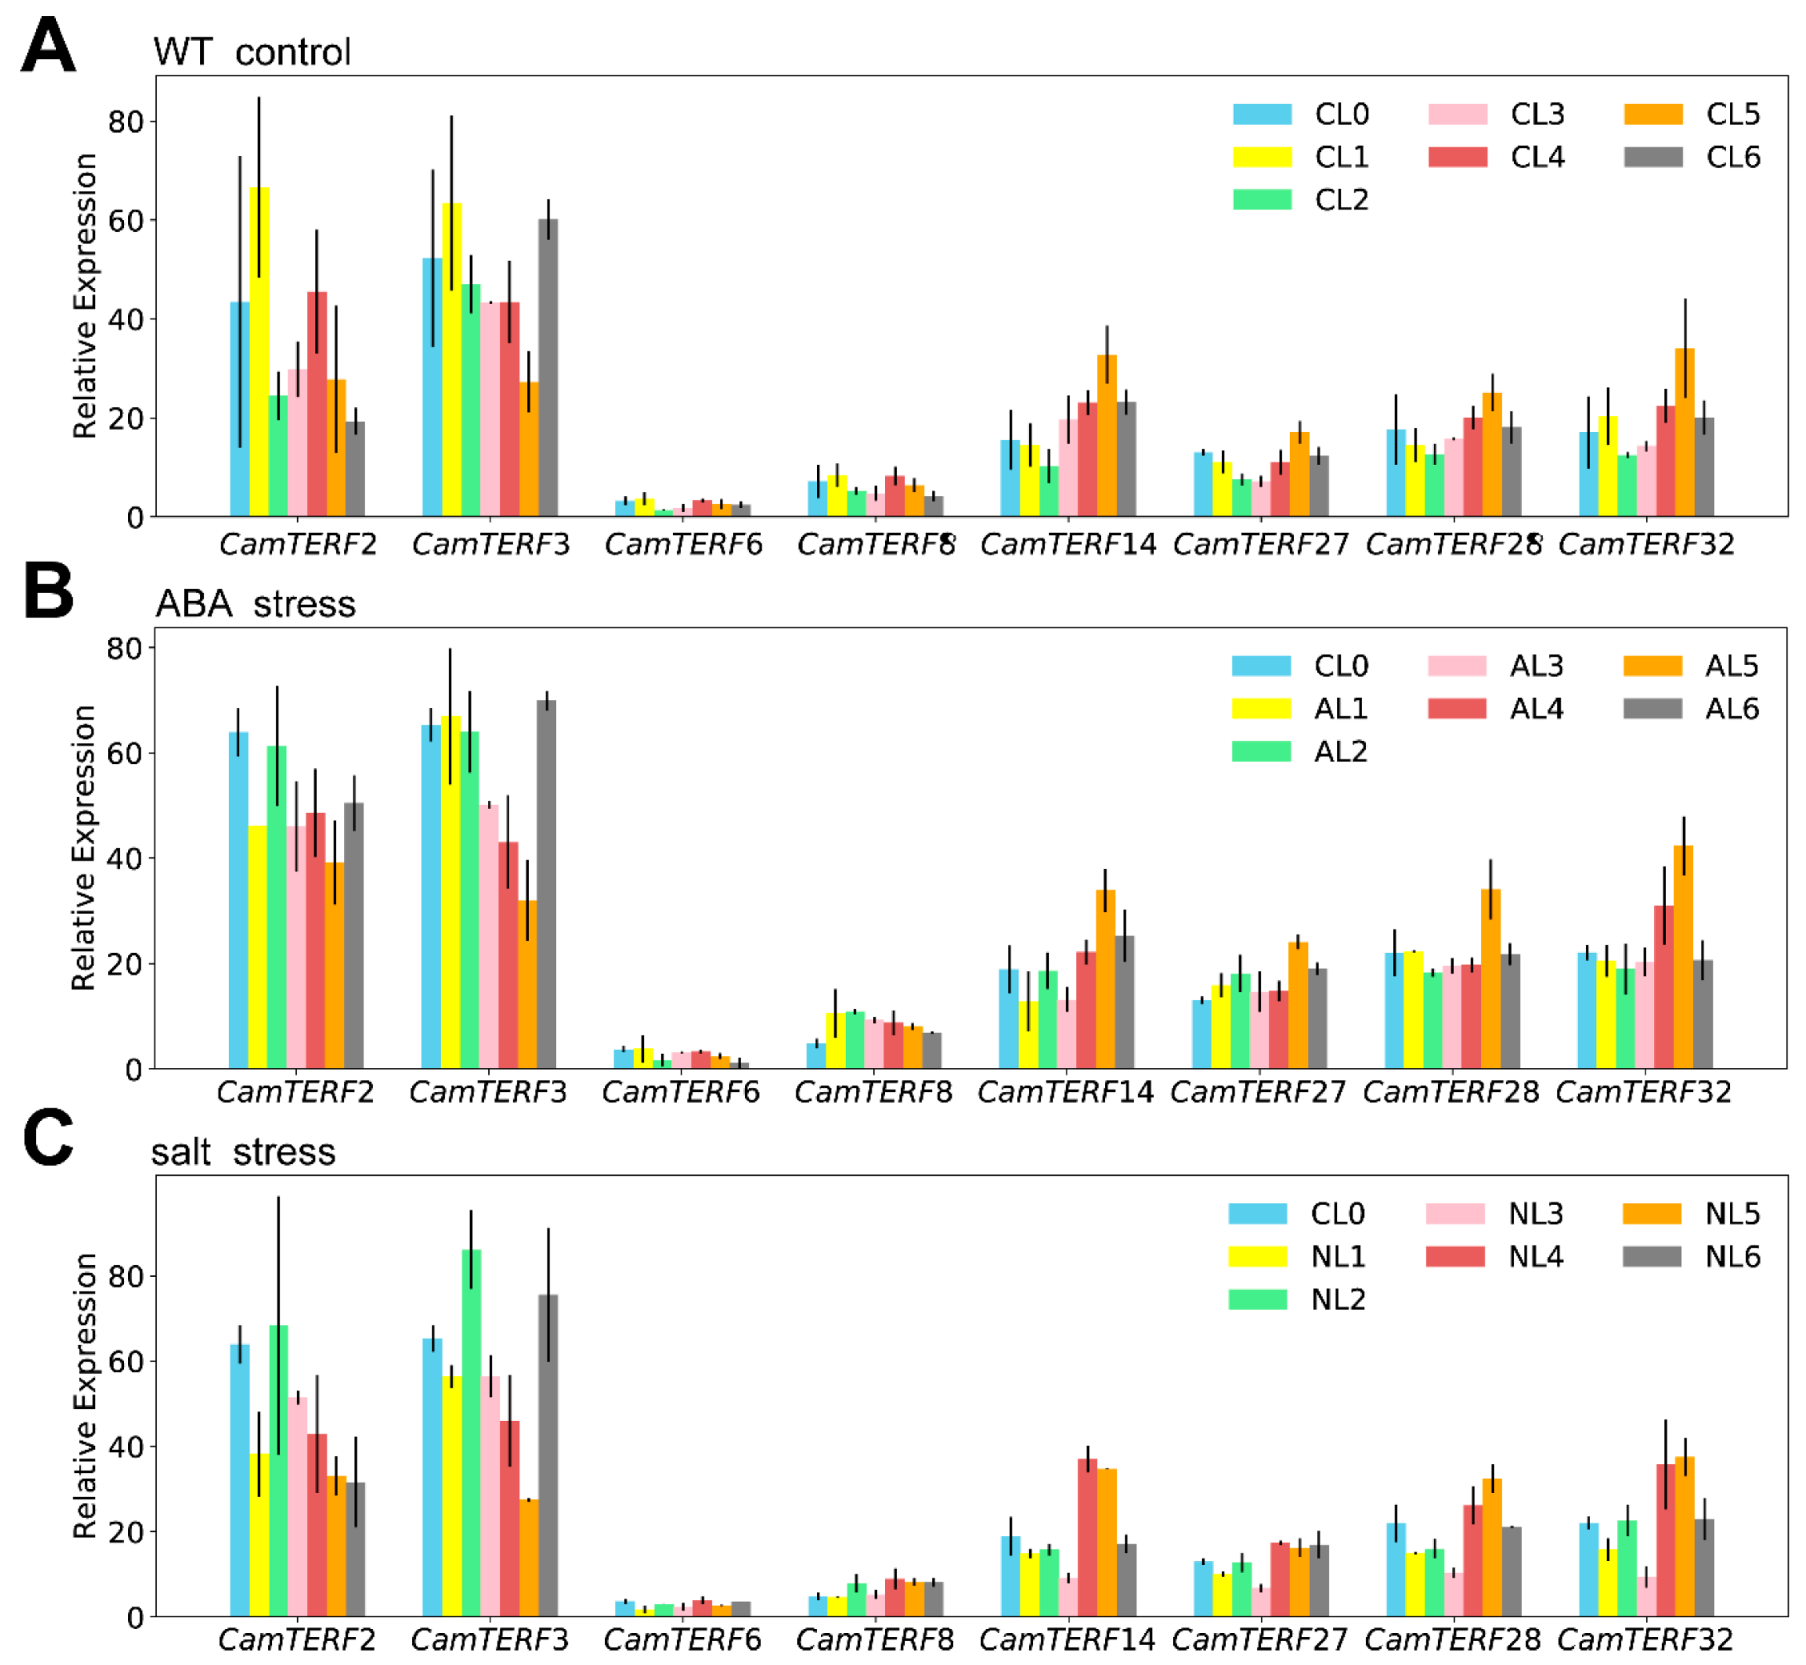
2.7. Analysis of the Expression of CamTERFs under Salt Stress and ABA Treatment

To further explore the expression changes of CamTERFs under abiotic stresses such as salt and ABA treatment, several candidate genes were first selected for analysis. According to the phylogenetic tree (Figure 4), mTERFs of capsicum, rice, and Arabidopsis were classified into eight subclasses. A representative CamTERF was selected from each of these eight subclasses. Experimental leaf samples were collected from plants treated with NaCl or ABA and relative gene expression levels of the eight candidate genes were determined by RT-qPCR (Reverse transcription quantitative PCR) (Figure 7). Samples used the untreated leaf at each timepoint as control to eliminate the effects of circadian rhythm on gene expression changes.
The relative expression of CamTERF2 decreased after 1 h of ABA and salt treatment compared with untreated (Figure 7A), and then increased with some fluctuation in expression level. The expression of CamTERF3 showed a similar trend to that of CamTERF2 at the early stage of treatment; the relative expression levels of CamTERF14, CamTERF27, CamTERF28, and CamTERF32 increased after 1–12 h of ABA treatment, followed by decreased expression by 24 h after treatment, they showed a similar trend to the untreated control group. The relative expression levels of CamTERF6 and CamTERF8 changed only slightly, without drastic fluctuation. These two genes also exhibited low expression levels in different tissues (Figure 6A), suggesting that ABA treatment has little impact on CamTERF6 and CamTERF8. The expression levels of the eight candidate genes in those plants treated with NaCl exhibited similar patterns to those in ABA-treated plants.

3. Discussion

Whole-genome sequencing of capsicum was completed in 2014 [32,33]. However, annotation of the capsicum genome has been difficult because it contains many repeat sequences. Thus far, the annotation file for capsicum remains not comprehensive. According to the published data, 34,903 genes of the CM334 capsicum genome have been annotated, and 9938 of these have not been localized to any particular chromosome; CamTERFs falling into this category were denoted here as Chr00. CM334 is a native cultivar of Mexico and Zunla is a cultivar of Guizhou, China. Both cultivars belong to Capsicum annuum; however, there are some geographical and environmental differences between habitats of Capsicum annuum, so genomic differences between different cultivars are normal. A comparison of the CM334 and Zunla-1 capsicum genomes has the potential to improve current annotation information.
In this study, 35 and 34 CamTERFs were separately identified in the Zunla-1 and CM334 capsicum genomes, respectively, based on bioinformatics methods. The homologous genes in these two genomes were identified through BLASTP (Basic Local Alignment Search Tool Protein) alignment. Among the 34 pairs of homologous genes, CamTERF4 is located on Chr1, CamTERF6/7/8/9 are located on Chr2, CamTERF10/11/12/13 are located on Chr3, CamTERF14/22 are located on Chr4, CamTERF26/27/28 are located on Chr5, and CamTERF35 is located on Chr12. CamTERF2/3 (Capana00g003424 and Capana00g003479) were assigned ‘00g’ in the Zunla-1 genome, whereas their homologs in the CM334 genome (CA01g01340 and CA04g12790) are located on Chr1 and Chr4, respectively. Thus, the CM334 annotation would help to improve the Zunla-1 genome. In addition, those genes with no chromosomal location specified in the CM334 genome, namely CA00g83430, CA00g83420, CA00g83410, CA00g83400, and CA00g85840, were annotated as located on Chr4 in the Zunla-1 genome. These two genomes can therefore complement each other. Furthermore, the chromosomal location map showed that CamTERFs are distributed unevenly on Chr10 and no CamTERFs are present on Chr6 and Chr7. Twelve CamTERFs located at the front of Chr4 form a gene cluster, where a tandem repeat has been detected through blast analysis.
In order to study the gene evolution and transcriptional features of CamTERFs, we analyzed their gene structures in detail, specifically the number and distribution of introns and exons. The structure of CamTERFs is simple, with 0–6 introns. Genes within the same subclass have similar structures and predicted motifs. These results indicate that the gene structure of CamTERFs is highly conserved.
To study the evolutionary relationships between mTERFs of capsicum, rice, and Arabidopsis, a phylogenetic tree was constructed through cluster analysis. By combining this phylogenetic tree with mTERFs classification in rice and Arabidopsis, mTERFs among the compared species were divided into eight subclasses. As a result of highly conserved features, those mTERFs within the same subclass showed similar functions. The functions of many mTERFs in Arabidopsis have been verified. For example, mTERF5/9/10/11 play roles in the resistance to salt and osmotic stress, and mTERF5/9/10 also function in ABA regulation [19,20]. mTERF1/6 are involved in chloroplast biogenesis and regulate leaf color [12,21], which are processes dependent on their chloroplast localization. mTERF15/18 are located in the mitochondria [30]. The shot1 mutant phenotype, caused by mTERF18 loss-of-function, is characterized by a dark green leaf color, decreased ROS accumulation, high heat resistance, and the upregulation of many mitochondrial respiratory electron transport chain-related and various stress-response genes [31]. mTERF15 is involved in the plant growth cycle [30]. Finally, mitochondria-associated mTERFs may be closely related to the stability of mitochondrial gene expression or mitochondrial function.
Promoter analysis of CamTERFs identified cis-elements in CamTERF2,6,7,11,14, suggesting that the expression of CamTERFs might be regulated upon external stimuli, such as light. However, as the promoter analysis is based on prediction, it requires further experimental verification. Functional studies of mTERFs in Arabidopsis could provide the possibility for the characterization of CamTERFs, but the functions of CamTERFs homologs needs further experimental verification.
CamTERFs expression patterns in 11 different plant tissues, including roots, leaves, flowers, fruits, seeds, petals, ovary, anther, and placenta, were investigated (Figure 6A). This analysis showed that the expression of CamTERFs is tissue-specific during plant development. CamTERFs exhibit the highest expression in leaves and peels, in which CamTERF3/28/34/14/32 are expressed relatively higher and present remarkable tissue-specific expression differences. By contrast, CamTERF1 and CamTERF20 have almost no detectable expression in different tissues and organs.
In GO enrichment analysis, terms associated with co-expressed genes were highly enriched for plastid part (GO:0044435) and chloroplast part (GO:0044434) in the CC category (Figure 6B). A large number of co-expressed genes were classified into mitochondria- and chloroplast-related biological processes, such as photosynthesis (GO:0015979), photosynthesis, light harvesting (GO:0009765), and ATP biosynthetic process (GO:0006754). Combined with the identified CamTERFs promoter cis-elements, GO analysis results suggest that CamTERFs are closely tied to plant respiration and photosynthetic processes, in which chloroplasts and mitochondria participate. In agreement, a recent study in Arabidopsis has shown that mTERF5 acts as a transcriptional pausing factor to positively regulate the transcription of chloroplast psbEFLJ [35].
Plant mTERFs can regulate the expression of stress resistance-related genes and result in improved plant stress resistance, as has been demonstrated for the regulation of ABA signaling and salt tolerance [19,20]. In this study, RT-qPCR analysis showed that the expression of some CamTERFs was considerably upregulated under ABA and salt stress. Of note, CamTERF2 and CamTERF3 exhibited altered expression patterns following ABA and NaCl treatment; their expression levels increased initially, then decreased, and then increased again during late stages of the time course following experimental treatment. CamTERF2 shares high sequence similarity with its homolog mTERF10 in Arabidopsis (E: 10−100). Past research suggested that mTERF10 participates in plant salt resistance through an ABA-meditated mechanism [19] and CamTERF3 shares high sequence similarity with its homolog mTERF12 in Arabidopsis (E: 3 × 10−52). mTERF10/11/12 in Arabidopsis thaliana belong to the same subclass and are mitochondria-related nuclear genes that encode chloroplast proteins. It has been reported that mTERF10/11 are involved in salt-stress responses in Arabidopsis; however, no evidence supports a similar role for mTERF12 [19]. For CamTERF2 and CamTERF3 in capsicum, we observed that their expression levels are relatively active and responsive to ABA and salt stress, but further investigation is necessary to prove that they participate in ABA- and salt-stress responses in capsicum.

4. Materials and Methods

4.1. Capsicum mTERF Family Identification

Capsicum annuum L. protein data at the whole-genome level were downloaded from two databases, pepper CM334 (http://peppergenome.snu.ac.kr/download.php) and Zunla-1 (ftp://ftp.ncbi.nlm.nih.gov/genomes/refseq/plant/Capsicum_annuum/latest_assembly_versions/GCF_000710875.1_Pepper_Zunla_1_Ref_v1.0). Protein sequences of the mTERF family of Arabidopsis (Arabidopsis thaliana) were obtained from the Arabidopsis genome database (https://www.arabidopsis.org/), which were used as query sequences to be aligned with the two pepper protein files. Thirty candidate CamTERF family members were identified in CM334 and 32 candidates were identified in Zunla-1.
Next, the Pfam ID of mTERF (PF02536) [17,36] was retrieved from the Pfam website (http://pfam.janelia.org/) [37]. In Pfam, the file named mTERF.hmm was downloaded, which contained the conserved domain information of the mTERF family. Similar domains between the two capsicum datasets were matched by using hmmer software’s hidden Markov algorithm [38] with a parameter of e-value ≤ 1 × 10⁻⁵. As a result, 34 candidate CamTERFs were identified in CM334 and 35 candidates were identified in Zunla-1.
The candidate members of the CamTERF family obtained from the two databases were used as inputs in SMART analysis (http://smart.embl-heidelberg.de/#opennewwindow) [39] to identify whether they possessed the conserved mTERF domain. The database of iTAK (http://itak.feilab.net/cgi-bin/itak/index.cgi) defined the transcription factor (TF) family and relative rules. By identifying the TFs [16,40,41,42] through hmmscan, true CamTERF members were finally obtained.

4.2. Basic Characterization and Homology of CamTERFs

Biochemical properties of CamTERFs, such as isoelectric point, molecular weight, and length, were analyzed using the online tool ExPASy (http://web.expasy.org/protparam/) [43]. CamTERF sequences obtained from the CM334 database were aligned with the sequences from Zunla-1 database, after which the most similar CamTERFs between these two databases were set aside.

4.3. Analysis of Chromosomal Location and Subcellular Localization

Python script was used to extract the position and length information of each gene from the gff and fasta files of the CamTERFs, and also extract the position and length of the CamTERFs on each chromosome. CamTERFs chromosomal positioning was visualized using python packages, i.e., pandas, numpy, and matplotlib, alongside the indication of tandem repeat genes. The subcellular localizations of CamTERFs were predicted using CamTERF protein sequences in the TargetP-2.0 Server (http://www.cbs.dtu.dk/services/TargetP). TargetP 2.0 is a novel state-of-the-art method used to identify N-terminal sorting signals, which direct proteins to the secretory pathway, mitochondria, and chloroplasts or other plastids. This method works by examining the strongest signals from the attention layer in the network and identifying whether the second residue in the protein, that is, the one following the initial methionine, has a strong influence on the classification [44].

4.4. Analysis of Gene Structure, Phylogeny, and Conserved Motifs

The online website MEME (http://meme-suite.org/) was used to predict the conserved motifs within CamTERFs. Based on protein evolution tree files and annotation files, the evolutionary relationships, gene structures, and predicted motifs of CamTERFs were illustrated using TBtools [45].

4.5. Analysis of Homologous Evolutionary Relationships between mTERFs of Rice, Arabidopsis, and Capsicum

Multiple sequence alignment of capsicum, rice (Oryza sativa), and Arabidopsis mTERFs was conducted using MUSCLE (Multiple Protein Sequence Alignment) under Linux. Contiguous algorithm was used to build phylogenetic tree files through treebest software [46] and a phylogenetic tree was illustrated by using the online tool iTOL (Interactive Tree Of Life; https://itol.embl.de/) [39].

4.6. Analysis of Cis-Regulatory Elements in CamTERFs

For CamTERFs, the nucleotide sequences 2 kb upstream of the translation start site of each gene were uploaded into the PlantCARE tool (http://bioinformatics.psb.ugent.be/webtools/plantcare/html/) [47]. Then, the cis-elements within each promoter sequence were predicted, which were used to identify the regulatory elements that related to CamTERFs. Results were visualized by the python matplotlib package.

4.7. Analysis of CamTERFs Expression and GO Enrichment for CamTERF Co-Expressing Members

A capsicum variety named 6421, which was identified in our lab, was used in this research (this line was supplied by the Vegetable Research Institute of Hunan Academy of Agricultural Sciences). Tissues representing 11 plant organs, including leaves, flowers, peels, placenta, seeds, and roots, were sampled during different developmental phases. Then, these samples were analyzed by RNA-Seq. The RNA-Seq data were visualized on the PepperHub [48]. Gene expression data in different tissue and during different phases were analyzed by using HISAT2, featureCounts [49,50,51]. The FPKM value was calculated and normalized by using the MAX/MIN method. Cluster analysis was performed by the UPGMA (unweighted pair-group method with arithmetic means) method and visualized with heat map, which was generated with Python. Expression data were used to identify CamTERF co-expression genes, which were then analyzed with goatools [52], which is a python package for GO enrichment analysis.

4.8. ABA and Salt-Stress Treatment

A high-generation inbred line of capsicum, 6421, was used for ABA treatment experiments. After germination, the experimental plants were planted in trays and cultured with nutrient fluid in a climate-controlled chamber under a photoperiod of 16 h light/8 h dark and a day/night temperature of 27/18 °C. Considering the effects of circadian rhythm on gene expression, we did the untreated capsicum 6421 for experiments.
When there were four to six euphylla, ABA solution (30 μmol·L−1) was sprayed onto the whole plant. Leaf tissue was sampled at seven timepoints—0, 1, 1.5, 3, 6, 12, and 24 h after ABA treatment. Plants that were not treated with ABA, including seven timepoints, were used as control for eliminating the effects of light conditions. Three biological replicates, comprised of seven plants each, were included for each sampling time point. Next, samples were wrapped in aluminum foil and placed immediately into liquid nitrogen, then stored at −80 °C until further use. Salt stress experiments were conducted similar to the ABA treatment process, except that NaCl solution (200 mmol·L−1) solution was sprayed onto plants.

4.9. cDNA Generation and the Quantitative/Real-Time PCR Analysis

Total RNA was isolated from the four to six euphylla stages of capsicum 6421 using the RNAiso Plus reagent (TaKaRa, Dalian, China) and then treated with RNase-free DNase I (Promega). Subsequently, 0.5 μg RNA was used for first-strand cDNA synthesis using a HiScript II 1st Strand cDNA Synthesis kit (Vazyme, Nanjing, China) according to the manufacturer’s instructions. qPCR was performed using LightCycler 96 (Roche, Basel, Switzerland) with the SYBR Green Premix Ex Taq™ II quantitative PCR system (TaKaRa), and the primers of eight subclasses of genes are listed in Table S5. At least three biological replicates were included. Briefly, after an initial denaturation step at 95 °C for 10 min, the amplifications were carried out with 40 cycles at a melting temperature of 95 °C for 15 s and an annealing temperature of 60 °C for 30 s. The ΔCt method was used to calculate the relative expression levels of CamTERFs [53,54]. ΔCt = [Gene expression − mean (Actin expression)]/3.

5. Conclusions

This study analyzed capsicum mTERFs on a genome-wide level and identified 35 CamTERFs. Then, based on bioinformatic and RT-qPCR analyses, we characterized CamTERF gene structures, chromosomal locations, motif prediction, phylogeny, promoter cis-elements, and gene expression patterns in different tissues and in response to different abiotic treatments. A number of candidate CamTERFs were identified that may play important roles in ABA- and NaCl-stress responses. This research provides comprehensive information characterizing CamTERFs, which can help to identify CamTERFs functions.

Supplementary Materials

Supplementary materials can be found at https://0-www-mdpi-com.brum.beds.ac.uk/1422-0067/21/1/269/s1.

Author Contributions

Conceptualization, L.X. and T.Y.; Data curation, B.T.; Funding acquisition, F.L. and X.Z.; Investigation, L.X., T.Y., J.L. and H.Y.; Resources, J.L. and X.C.; Visualization, B.T.; Writing—original draft, B.T.; Writing—review and editing, B.T. and F.L. All authors have read and agreed to the published version of the manuscript.

Funding

This work was supported by The National Key Research and Development Program of China (2019YFD1000300) and National Natural Science Foundation of China (U19A2028).

Conflicts of Interest

The authors declare no conflict of interest.

Abbreviations

mTERFsMitochondrial transcription ter
CamTERFsCapsicum annuum Mitochondr
FPKMFragments Per Kilobase Million
GOGene Ontology
MeJAMethyl Jasmonate
BPBiological Process
MFMolecular Function
CCCellular Component
RNA-SeqRNA sequencing;
mtDNAMitochondrial DNA
ABAAbscisic acid
RT-qPCRReverse transcription quantitative PCR

References

  1. Gray, M.W.; Burger, G.; Lang, B.F. Mitochondrial evolution. Science 1999, 283, 1476–1481. [Google Scholar] [CrossRef] [Green Version]
  2. Lang, B.F.; Gray, M.W.; Burger, G. Mitochondrial genome evolution and the origin of eukaryotes. Annu. Rev. Genet. 1999, 33, 351–397. [Google Scholar] [CrossRef] [PubMed]
  3. Liere, K.; Weihe, A.; Börner, T. The transcription machineries of plant mitochondria and chloroplasts: Composition, function, and regulation. J. Plant Physiol. 2011, 168, 1345–1360. [Google Scholar] [CrossRef] [PubMed]
  4. Fernandez-Silva, P.; Martinez-Azorin, F.; Micol, V.; Attardi, G. The human mitochondrial transcription termination factor (mTERF) is a multizipper protein but binds to DNA as a monomer, with evidence pointing to intramolecular leucine zipper interactions. EMBO J. 1997, 16, 1066–1079. [Google Scholar] [CrossRef] [PubMed] [Green Version]
  5. Roberti, M.; Polosa, P.L.; Bruni, F.; Manzari, C.; Deceglie, S.; Gadaleta, M.N.; Cantatore, P. The MTERF family proteins: Mitochondrial transcription regulators and beyond. Biochim. Et Biophys. Acta (BBA) Bioenerg. 2009, 1787, 303–311. [Google Scholar] [CrossRef] [Green Version]
  6. Linder, T.; Park, C.B.; Asin-Cayuela, J.; Pellegrini, M.; Larsson, N.G.; Falkenberg, M.; Gustafsson, C.M. A family of putative transcription termination factors shared amongst metazoans and plants. Curr. Genet. 2005, 48, 265–269. [Google Scholar] [CrossRef]
  7. Kruse, B.; Narasimhan, N.; Attardi, G. Termination of transcription in human mitochondria: Identification and purification of a DNA binding protein factor that promotes termination. Cell 1989, 58, 391–397. [Google Scholar] [CrossRef]
  8. Asin-Cayuela, J.; Schwend, T.; Farge, G.; Gustafsson, C.M. The human mitochondrial transcription termination factor (mTERF) is fully active in vitro in the non-phosphorylated form. J. Biol. Chem. 2005, 280, 25499–25505. [Google Scholar] [CrossRef] [Green Version]
  9. Park, C.B.; Asin-Cayuela, J.; Cámara, Y.; Shi, Y.; Pellegrini, M.; Gaspari, M.; Falkenberg, M. MTERF3 is a negative regulator of mammalian mtDNA transcription. Cell 2007, 130, 273–285. [Google Scholar] [CrossRef] [Green Version]
  10. Cámara, Y.; Asin-Cayuela, J.; Park, C.B.; Metodiev, M.D.; Shi, Y.; Ruzzenente, B.; Franz, T. MTERF4 regulates translation by targeting the methyltransferase NSUN4 to the mammalian mitochondrial ribosome. Cell Metab. 2011, 13, 527–539. [Google Scholar] [CrossRef] [Green Version]
  11. Wenz, T.; Luca, C.; Torraco, A.; Moraes, C.T. RETRACTED: mTERF2 Regulates Oxidative Phosphorylation by Modulating mtDNA Transcription; Elsevier: Amsterdam, The Netherlands, 2009. [Google Scholar]
  12. Meskauskiene, R.; Würsch, M.; Laloi, C.; Vidi, P.A.; Coll, N.S.; Kessler, F.; Apel, K. A mutation in the Arabidopsis mTERF-related plastid protein SOLDAT10 activates retrograde signaling and suppresses 1O2-induced cell death. Plant J. 2009, 60, 399–410. [Google Scholar] [CrossRef] [Green Version]
  13. Nguyen, A.V.; Toepel, J.; Burgess, S.; Uhmeyer, A.; Blifernez, O.; Doebbe, A.; Kruse, O. Time-course global expression profiles of Chlamydomonas reinhardtii during photo-biological H2 production. PLoS ONE 2011, 6, e29364. [Google Scholar] [CrossRef] [Green Version]
  14. Wobbe, L.; Nixon, P.J. The mTERF protein MOC1 terminates mitochondrial DNA transcription in the unicellular green alga Chlamydomonas reinhardtii. Nucleic Acids Res. 2013, 41, 6553–6567. [Google Scholar] [CrossRef]
  15. Babiychuk, E.; Vandepoele, K.; Wissing, J.; Garcia-Diaz, M.; De Rycke, R.; Akbari, H.; Van Montagu, M.C. Plastid gene expression and plant development require a plastidic protein of the mitochondrial transcription termination factor family. Proc. Natl. Acad. Sci. USA 2011, 108, 6674–6679. [Google Scholar] [CrossRef] [Green Version]
  16. Pérez-Rodríguez, P.; Riano-Pachon, D.M.; Corrêa, L.G.G.; Rensing, S.A.; Kersten, B.; Mueller-Roeber, B. PlnTFDB: Updated content and new features of the plant transcription factor database. Nucleic Acids Res. 2009, 38 (Suppl. 1), D822–D827. [Google Scholar]
  17. Kleine, T. Arabidopsis thaliana mTERF proteins: Evolution and functional classification. Front. Plant Sci. 2012, 3, 233. [Google Scholar] [CrossRef] [Green Version]
  18. Zhao, Y.; Cai, M.; Zhang, X.; Li, Y.; Zhang, J.; Zhao, H.; Qiu, F. Genome-wide identification, evolution and expression analysis of mTERF gene family in maize. PLoS ONE 2014, 9, e94126. [Google Scholar] [CrossRef] [Green Version]
  19. Xu, D.; Leister, D.; Kleine, T. Arabidopsis thaliana mTERF10 and mTERF11, but not mTERF12, are involved in the response to salt stress. Front. Plant Sci. 2017, 8, 1213. [Google Scholar] [CrossRef] [Green Version]
  20. Robles, P.; Micol, J.L.; Quesada, V. Arabidopsis MDA1, a nuclear-encoded protein, functions in chloroplast development and abiotic stress responses. PLoS ONE 2012, 7, e42924. [Google Scholar] [CrossRef]
  21. Huang, S.Y.; Qiu, S.J.; Chen, J.Y.; Chen, J.P.; Li, X.Y.; Li, L. Advances of mTERF Protein Family. Life Sci. Res. 2016, 20, 455–459. [Google Scholar]
  22. Romani, I.; Manavski, N.; Morosetti, A.; Tadini, L.; Maier, S.; Kühn, K.; Kleine, T. A member of the arabidopsis mitochondrial transcription termination factor family is required for maturation of chloroplast transfer RNAIle (GAU). Plant Physiol. 2015, 169, 627–646. [Google Scholar] [CrossRef] [Green Version]
  23. Robles, P.; Núñez-Delegido, E.; Ferrández-Ayela, A.; Sarmiento-Mañús, R.; Micol, J.L.; Quesada, V. Arabidopsis mTERF6 is required for leaf patterning. Plant Sci. 2018, 266, 117–129. [Google Scholar] [CrossRef]
  24. Zhang, Y.; Cui, Y.L.; Zhang, X.L.; Yu, Q.B.; Wang, X.; Yuan, X.B.; Yang, Z.N. A nuclear-encoded protein, mTERF6, mediates transcription termination of rpoA polycistron for plastid-encoded RNA polymerase-dependent chloroplast gene expression and chloroplast development. Sci. Rep. 2018, 8, 11929. [Google Scholar] [CrossRef]
  25. Pfalz, J.; Liere, K.; Kandlbinder, A.; Dietz, K.J.; Oelmüller, R. pTAC2,-6, and-12 are components of the transcriptionally active plastid chromosome that are required for plastid gene expression. Plant Cell 2006, 18, 176–197. [Google Scholar] [CrossRef] [Green Version]
  26. Xiong, H.B.; Wang, J.; Huang, C.; Rochaix, J.D.; Lin, F.M.; Zhang, J.X.; Yang, Z.N. mTERF8, a Member of the Mitochondrial Transcription Termination Factor Family, is Involved in the Transcription Termination of Chloroplast Gene psbJ1. Plant Physiol. 2020. [Google Scholar] [CrossRef] [Green Version]
  27. Quesada, V.; Sarmiento-Mañús, R.; González-Bayón, R.; Hricová, A.; Pérez-Marcos, R.; Graciá-Martínez, E.; Micol, J.L. Arabidopsis RUGOSA2 encodes an mTERF family member required for mitochondrion, chloroplast and leaf development. Plant J. 2011, 68, 738–753. [Google Scholar] [CrossRef]
  28. Hammani, K.; Barkan, A. An mTERF domain protein functions in group II intron splicing in maize chloroplasts. Nucleic Acids Res. 2014, 42, 5033–5042. [Google Scholar] [CrossRef] [Green Version]
  29. Robles, P.; Micol, J.L.; Quesada, V. Mutations in the plant-conserved MTERF9 alter chloroplast gene expression, development and tolerance to abiotic stress in Arabidopsis thaliana. Physiol. Plant. 2015, 154, 297–313. [Google Scholar] [CrossRef]
  30. Hsu, Y.W.; Wang, H.J.; Hsieh, M.H.; Hsieh, H.L.; Jauh, G.Y. Arabidopsis mTERF15 is required for mitochondrial nad2 intron 3 splicing and functional complex I activity. PLoS ONE 2014, 9, e112360. [Google Scholar] [CrossRef] [Green Version]
  31. Kim, M.; Lee, U.; Small, I.; des Francs-Small, C.C.; Vierling, E. Mutations in an Arabidopsis mitochondrial transcription termination factor–related protein enhance thermotolerance in the absence of the major molecular chaperone HSP101. Plant Cell 2012, 24, 3349–3365. [Google Scholar] [CrossRef] [Green Version]
  32. Kim, S.; Park, M.; Yeom, S.I.; Kim, Y.M.; Lee, J.M.; Lee, H.A.; Jung, K. Genome sequence of the hot pepper provides insights into the evolution of pungency in Capsicum species. Nat. Genet. 2014, 46, 270. [Google Scholar] [CrossRef] [PubMed]
  33. Qin, C.; Yu, C.; Shen, Y.; Fang, X.; Chen, L.; Min, J.; Yang, Y. Whole-genome sequencing of cultivated and wild peppers provides insights into Capsicum domestication and specialization. Proc. Natl. Acad. Sci. USA 2014, 111, 5135–5140. [Google Scholar] [CrossRef] [PubMed] [Green Version]
  34. Cheng, Y.; Pang, X.; Wan, H.; Ahammed, G.J.; Yu, J.; Yao, Z.; Yang, Y. Identification of optimal reference genes for normalization of qPCR analysis during pepper fruit development. Front. Plant Sci. 2017, 8, 1128. [Google Scholar] [CrossRef] [PubMed] [Green Version]
  35. Ding, S.; Zhang, Y.; Hu, Z.; Huang, X.; Zhang, B.; Lu, Q.; Lu, C. mTERF5 Acts as a Transcriptional Pausing Factor to Positively Regulate Transcription of Chloroplast psbEFLJ. Mol. Plant 2019. [Google Scholar] [CrossRef]
  36. Xu, Q.; Dunbrack, R.L., Jr. Assignment of protein sequences to existing domain and family classification systems: Pfam and the PDB. Bioinformatics 2012, 28, 2763–2772. [Google Scholar] [CrossRef]
  37. Finn, R.D.; Bateman, A.; Clements, J.; Coggill, P.; Eberhardt, R.Y.; Eddy, S.R.; Sonnhammer, E.L. Pfam: The protein families database. Nucleic Acids Res. 2013, 42, D222–D230. [Google Scholar] [CrossRef] [Green Version]
  38. Finn, R.D.; Clements, J.; Eddy, S.R. HMMER web server: Interactive sequence similarity searching. Nucleic Acids Res. 2011, 39 (Suppl. 2), W29–W37. [Google Scholar] [CrossRef] [Green Version]
  39. Letunic, I.; Bork, P. Interactive tree of life (iTOL) v3: An online tool for the display and annotation of phylogenetic and other trees. Nucleic Acids Res. 2016, 44, W242–W245. [Google Scholar] [CrossRef]
  40. Zheng, Y.; Jiao, C.; Sun, H.; Rosli, H.G.; Pombo, M.A.; Zhang, P.; Zhao, P.X. iTAK: A program for genome-wide prediction and classification of plant transcription factors, transcriptional regulators, and protein kinases. Mol. Plant 2016, 9, 1667–1670. [Google Scholar] [CrossRef] [Green Version]
  41. Jin, J.; Zhang, H.; Kong, L.; Gao, G.; Luo, J. PlantTFDB 3.0: A portal for the functional and evolutionary study of plant transcription factors. Nucleic Acids Res. 2013, 42, D1182–D1187. [Google Scholar] [CrossRef] [Green Version]
  42. Dai, X.; Sinharoy, S.; Udvardi, M.; Zhao, P.X. PlantTFcat: An online plant transcription factor and transcriptional regulator categorization and analysis tool. BMC Bioinform. 2013, 14, 321. [Google Scholar] [CrossRef] [PubMed] [Green Version]
  43. Artimo, P.; Jonnalagedda, M.; Arnold, K.; Baratin, D.; Csardi, G.; De Castro, E.; Grosdidier, A. ExPASy: SIB bioinformatics resource portal. Nucleic Acids Res. 2012, 40, W597–W603. [Google Scholar] [CrossRef] [PubMed]
  44. Armenteros, J.J.A.; Salvatore, M.; Emanuelsson, O.; Winther, O.; Von Heijne, G.; Elofsson, A.; Nielsen, H. Detecting sequence signals in targeting peptides using deep learning. Life Sci. Alliance 2019, 2, e201900429. [Google Scholar] [CrossRef] [PubMed] [Green Version]
  45. Chen, C.; Xia, R.; Chen, H.; He, Y. TBtools, a Toolkit for Biologists integrating various biological data handling tools with a user-friendly interface. bioRxiv 2018, 289660. [Google Scholar] [CrossRef]
  46. Edgar, R.C. MUSCLE: Multiple sequence alignment with high accuracy and high throughput. Nucleic Acids Res. 2004, 32, 1792–1797. [Google Scholar] [CrossRef] [PubMed] [Green Version]
  47. Lescot, M.; Déhais, P.; Thijs, G.; Marchal, K.; Moreau, Y.; Van de Peer, Y.; Rombauts, S. PlantCARE, a database of plant cis-acting regulatory elements and a portal to tools for in silico analysis of promoter sequences. Nucleic Acids Res. 2002, 30, 325–327. [Google Scholar] [CrossRef] [PubMed]
  48. Liu, F.; Yu, H.; Deng, Y.; Zheng, J.; Liu, M.; Ou, L.; He, S. PepperHub, an informatics hub for the chili pepper research community. Mol. Plant 2017, 10, 1129–1132. [Google Scholar] [CrossRef]
  49. Kim, D.; Langmead, B.; Salzberg, S.L. HISAT: A fast spliced aligner with low memory requirements. Nat. Methods 2015, 12, 357. [Google Scholar] [CrossRef] [Green Version]
  50. Pertea, M.; Kim, D.; Pertea, G.M.; Leek, J.T.; Salzberg, S.L. Transcript-level expression analysis of RNA-seq experimentswith HISAT, StringTie and Ballgown. Nat. Protoc. 2016, 11, 1650. [Google Scholar] [CrossRef]
  51. Liao, Y.; Smyth, G.K.; Shi, W. featureCounts: An efficient general purpose program for assigning sequence reads to genomic features. Bioinformatics 2013, 30, 923–930. [Google Scholar] [CrossRef] [Green Version]
  52. Klopfenstein, D.V.; Zhang, L.; Pedersen, B.S.; Ramírez, F.; Vesztrocy, A.W.; Naldi, A.; Dampier, W. GOATOOLS: A Python library for Gene Ontology analyses. Sci. Rep. 2018, 8, 10872. [Google Scholar] [CrossRef] [PubMed]
  53. Jiang, S.Y.; Bachmann, D.; La, H.; Ma, Z.; Venkatesh, P.N.; Ramamoorthy, R.; Ramachandran, S. Ds insertion mutagenesis as an efficient tool to produce diverse variations for rice breeding. Plant Mol. Biol. 2007, 65, 385–402. [Google Scholar] [CrossRef] [PubMed]
  54. Zhao, P.; Wang, D.; Wang, R.; Kong, N.; Zhang, C.; Yang, C.; Chen, Q. Genome-wide analysis of the potato Hsp20 gene family: Identification, genomic organization and expression profiles in response to heat stress. BMC Genom. 2018, 19, 61. [Google Scholar] [CrossRef] [PubMed]
Figure 1. Chromosomal location and gene duplication of capsicum mTERFs (CamTERFs). The tandem duplicated genes are marked by blue rectangles.
Ijms 21 00269 g001
Figure 2. CamTERFs protein predicted of the Subcellular localization.
Ijms 21 00269 g002
Figure 3. Phylogenetic relationship, conserved motif, and gene structure analysis of CamTERFs. (A) Phylogenetic tree of 35 CamTERFs. Depicted is an unrooted neighbor-joining phylogenetic tree; (B) Distributions of conserved motifs in CamTERFs. Ten putative motifs are indicated with different colored boxes. For details of motifs refer to Table 2; (C) Exon/intron organization in CamTERFs. Yellow boxes represent exons and black lines represent introns. The numbers 0, 1, and 2 represent the intron splicing phase. Exon length can be inferred by the scale at the bottom.
Ijms 21 00269 g003
Figure 4. Phylogenetic tree of mTERFs from Arabidopsis, rice, and capsicum. The phylogenetic tree was constructed using the NJ (neighbor-joining) method with 1000 bootstrap replications. The eight subfamilies are distinguished with different colors.
Ijms 21 00269 g004
Figure 5. Predicted cis-elements in CamTERFs promoters. Promoter sequences (−2000 bp of translation start site) of 35 CamTERFs (promoter sequence of CamTERF22 was omitted) and 6 housekeeping genes were analyzed by PlantCARE.
Ijms 21 00269 g005
Figure 6. (A) Expression profiles of CamTERFs in different tissues and organs. CR0: root control; L1–L9: Leaf from 0 DAG to 50 DAG; F1–F9: Flower from 0 DAG to 50 DAG; P10: Petal; O10: Ovary; STA10: Stamen; FST0 and FST1: Whole fruit from 3 DAP and 7 DAP; G1–G11: Pericarp from 10 DAP to 60 DAP; ST1 and ST2: Placenta and Seed from 10 DAP to 15 DAP; S3–S11: Seed from 20 DAP to 60 DAP; T3–T10: Placenta from 20 DAP to 60 DAP. DAG: Days after germination; DAP: Days after pollination; (B) Analysis of gene ontology (GO) enrichment for co-expressing CamTERFs. GO term categorization includes biological process (BP), cellular component (CC), and molecular function (MF).
Ijms 21 00269 g006
Figure 7. (A) Expression profiles of CamTERFs untreated following a 24 h time course; (B) expression profiles of CamTERFs under ABA (Abscisic acid) stress following a 24 h time course; (C) expression profiles of CamTERFs under salt stress and following a 24 h time course.
Ijms 21 00269 g007
Table 1. The basic information of the mitochondrial transcription termination factor (mTERF) gene family in capsicum. List of predicted genes and related information include gene name (Zunla_1), CM334 homologous gene and E-value, gene locus, molecular details.
GeneGene Accession No.CM334 HomelogE-ValueChrStartEndORF bpSize aaProtein Molecular Weight/KDPI
CamTERF1Capana00g003386CA00g839300Chr00544847272544848822155151659.529.24
CamTERF2Capana00g003424CA01g013400Chr0054533978454534073194831535.869.3
CamTERF3Capana00g003922CA04g127901.25 × 10−12Chr0059163747859163797850116619.337.6
CamTERF4Capana01g003479CA01g278500Chr01227806286227808022173757866.298.02
CamTERF5Capana01g003663CA00g071306.03 × 10−41Chr0123216433423216495762420724.259.13
CamTERF6Capana02g001023CA02g090800Chr0210722912710723000587929233.699.73
CamTERF7Capana02g001304CA02g002700Chr02119529666119531393172857565.458.98
CamTERF8Capana02g002368CA02g195200Chr02143793081143794292121240345.819.87
CamTERF9Capana02g003623CA02g306301.22 × 10−17Chr02163004467163007189145548454.969.2
CamTERF10Capana03g000004CA03g364504.29 × 10−69Chr0395975106725178259367.829.18
CamTERF11Capana03g001822CA03g212800Chr033637455636376173153351057.48.83
CamTERF12Capana03g003090CA03g119801.51 × 10−17Chr0316857464516857549772924228.269.22
CamTERF13Capana03g004299CA03g041100Chr03250309314250310699138646153.089.25
CamTERF14Capana04g000706CA04g175200Chr04121696931217057187929233.979.86
CamTERF15Capana04g001184CA00g834300Chr043652734936528682126342047.689.46
CamTERF16Capana04g001185CA00g834200Chr043655309536554216112237342.939.65
CamTERF17Capana04g001188CA00g834100Chr043658626036587354109536441.929.28
CamTERF18Capana04g001189CA00g834006.61 × 10−18Chr043666474436665883114037943.259.49
CamTERF19Capana04g001190CA01g179100Chr043667982936682422114338043.59.47
CamTERF20Capana04g001191Chr04366853953668572132710812.49.52
CamTERF21Capana04g001192CA00g858400Chr043671950736720607110136642.019.51
CamTERF22Capana04g001196CA04g149100Chr043683015636837562118539445.1710.02
CamTERF23Capana04g001201CA10g089000Chr04369527993695361181327030.419.42
CamTERF24Capana04g001203CA00g858200Chr043703236237033440981326389.64
CamTERF25Capana04g001204CA00g858301.02 × 10−15Chr04370469103704752761820523.639.52
CamTERF26Capana05g000328CA05g030107.52 × 10−78Chr0569059836907173119139645.169.67
CamTERF27Capana05g000329CA05g030200Chr0569084416909864117339044.7710.02
CamTERF28Capana05g001366CA05g095100Chr05112851518112852951143447753.956.1
CamTERF29Capana08g002535CA00g642900Chr08148385074148388277197165675.99.16
CamTERF30Capana09g000680CA09g079000Chr093264948232650606112537443.079.65
CamTERF31Capana10g000180CA10g011600Chr1034057653407096133244350.496.12
CamTERF32Capana11g000966CA11g108800Chr11790298027903067787629133.239.57
CamTERF33Capana11g001839CA00g741104.08 × 10−15Chr1119789086719789150563921224.488.93
CamTERF34Capana12g001016CA08g185500Chr12409614374096224981327031.429.1
CamTERF35Capana12g001548CA12g142506.69 × 10−15Chr1211967147611967248793030935.489.55
Table 2. Subcellular localization of CamTERFs. Listed are the predicted protein output scores for chloroplast transit peptide (C), mitochondrial targeting peptide (M), signal peptide (S), or any other location (-). Location (Loc) details the subcellular localization predicted based on the prediction scores and reliability class (RC, 1–5) indicates the strength of the prediction, with 1 indicating the strongest prediction. RC is a measure of the size of the difference (‘diff’) between the highest (winning) and the second highest output scores.
Protein IDChloroplast Transit PeptideMitochondrial Targeting PeptideSignal PeptideOther LocationLocRC
CamTERF10.0640.3390.1140.612_4
CamTERF20.8880.0470.0160.07C1
CamTERF30.0790.5360.060.568_5
CamTERF40.0620.8830.0080.21M2
CamTERF50.240.0490.0290.749_3
CamTERF60.0980.1270.1650.532_4
CamTERF70.8520.0210.0820.165C2
CamTERF80.0490.6810.0070.028M2
CamTERF90.0140.8230.0260.349M3
CamTERF100.8620.0670.010.138C2
CamTERF110.7330.0430.0210.102C2
CamTERF120.0180.5670.1250.16M3
CamTERF130.1780.3020.1080.04M5
CamTERF140.1060.270.0190.732_3
CamTERF150.1770.120.0540.147C5
CamTERF160.0820.8570.0060.031M2
CamTERF170.0090.1760.7630.07S3
CamTERF180.0140.7970.1630.042M2
CamTERF190.2610.6350.0210.098M4
CamTERF200.060.1640.1420.883_2
CamTERF210.0070.1940.850.058S2
CamTERF220.0860.7730.0080.082M2
CamTERF230.0050.4190.440.085S5
CamTERF240.2740.0780.0240.39_5
CamTERF250.6850.0390.1760.248C3
CamTERF260.0690.2840.0850.06M5
CamTERF270.1310.5980.0340.07M3
CamTERF280.2120.6590.0260.029M3
CamTERF290.6650.2680.010.103C4
CamTERF300.0090.5380.6110.025S5
CamTERF310.0290.5880.0640.492M5
CamTERF320.0710.3390.0120.707_4
CamTERF330.0340.1740.1090.785_2
CamTERF340.8150.0290.2030.017C2
CamTERF350.1390.0950.0530.679_3
Table 3. List of putative motifs in CamTERFs.
MotifWidthSequence
121YLVSHPALLMYSLEKRIKPRY
229PKLLFYDVEKTLKPKLZFLKELGLSGSDL
350VPPDSPMFLHGVQVLSSLKKSKLDRKJGIFKSFGWSDDDILTMFRKLPYC
431YLRSLGGSDEBVVKLJKRCPWLLSYSLEKTL
521YLINSLGFSKQEAJSASAKVT
622SESKFLEKYVLPYKDELPDLYE
721SEARIQTALTFFMKELGYKSA
828LLRNFGFSNDKIRKMVLRCPQLLTQNPE
921LVVNFFKQTGFBBTQIKKLVS
1021VKVIARDPKLLTRSLDTHJKP

