Article

C-Terminal Domain of the Human Zinc Transporter hZnT8 Is Structurally Indistinguishable from Its Disease Risk Variant (R325W)

1
Drug Discovery and Structural Biology group, Health Biotechnology Division, National Institute for Biotechnology and Genetic Engineering (NIBGE), Faisalabad 44000, Pakistan
2
Structural Biology Laboratory, Elettra-Sincrotrone Trieste, 34149 Trieste, Italy
3
Astbury Centre for Structural Molecular Biology and School of Molecular and Cellular Biology, Faculty of Biological Sciences, University of Leeds, Leeds LS2 9JT, UK
*
Authors to whom correspondence should be addressed.
Int. J. Mol. Sci. 2020, 21(3), 926; https://0-doi-org.brum.beds.ac.uk/10.3390/ijms21030926
Submission received: 10 December 2019 / Revised: 17 January 2020 / Accepted: 19 January 2020 / Published: 31 January 2020
(This article belongs to the Collection Feature Papers in Molecular Biophysics)

Abstract

:
The human zinc transporter 8 (hZnT8) plays important roles in the storage of insulin in the secretory vesicles of pancreatic β cells. hZnT8 consists of a transmembrane domain, with its N- and C-termini protruding into the cytoplasm. Interestingly, the exchange of arginine to tryptophan at position 325 in the C-terminal domain (CTD) increases the risk of developing type 2 diabetes mellitus (T2D). In the present study, the CTDs of hZnT8 (the wild-type (WT) and its disease risk variant (R325W)) were expressed, purified, and characterized in their native forms by biophysical techniques. The data reveal that the CTDs form tetramers which are stabilized by zinc binding, and exhibit negligible differences in their secondary structure content and zinc-binding affinities in solution. These findings provide the basis for conducting further structural studies aimed at unravelling the molecular mechanism underlying the increased susceptibility to develop T2D, which is modulated by the disease risk variant.

Graphical Abstract

1. Introduction

Zinc (Zn+2) plays important roles in cellular growth and differentiation [1,2,3,4]. A large number of cellular proteins bind Zn+2, and many others are involved in its transport [5,6]. In humans, cellular Zn+2 homeostasis is maintained by two families of Zn+2 transporters—the cation diffusion facilitator (CDF) family, also known as the SLC30 family, that controls the Zn+2 concentration in the extracellular matrix or intracellular vesicles, and the Zrt- and Irt-like proteins (ZIP) family, also known as the SLC39A family, that is implicated in controlling the intracellular Zn+2 uptake [6,7,8]. The CDF family consists of ten (10) Zn+2 transporters (ZnTs), named ZnT1 (or SLC30A1) to ZnT10 (or SLC30A10), which facilitate Zn+2 transport across cellular membranes [6,7,8]. ZnT and ZIP-family members play key roles in various biological functions, and an understanding of their importance in health and disease continues to increase as more information on disease-related mutations in the corresponding protein-encoding genes comes to light [9]. Variations in the amino acid sequence of ZnT and ZIP-family members are associated with various diseases such as type 1 diabetes mellitus (T1D), type 2 diabetes mellitus (T2D), Parkinsonism, hepatic cirrhosis, hypermanganesemia, dystonia, polycythemia, acrodermatitis enteropathica, and nonsymptomatic high myopia [9].
In humans, the human zinc transporter 8 (hZnT8) is implicated in decreasing the cytoplasmic Zn+2 level by exporting Zn+2 ions into insulin-containing secretory vesicles in pancreatic β cells [10,11]. Notably, hZnT8 is involved in the formation of water-insoluble insulin crystals, ultimately resulting in the storage of the hexameric insulin bound to two Zn+2 ions in pancreatic β cells [12,13]. Hence, hZnT8 has been regarded as a metal carrier during insulin maturation, storage, and secretion [10]. It has been shown that a nonsynonymous single nucleotide polymorphism (SNP), termed as rs13266634, in the gene (SLC30A8) encoding hZnT8 introduces a substitution (R325W) in the C-terminal domain (CTD) of hZnT8 (Figure 1), and genome-wide association studies (GWASs) reveal that the substitution R325W in the CTD of hZnT8 increases the risk of developing T2D [14]. However, the link between the rs13266634 polymorphism and the risk of susceptibility to T2D has not been identified in all of the human studies [15,16,17,18,19]. Interestingly, it has been shown that loss-of-function mutations in the gene encoding hZnT8 provide protection against the risk of T2D [20]. Such conflicting study results may be due to racial differences of the selected population, different criteria for sample selection, or alternative assay systems used for detection [15].
The CTD of hZnT8 plays important roles in protein–protein interactions and Zn+2 sensing [15,21,22,23,24]. Modeling studies based on bacterial homologues have predicted that the residue at position 325 in hZnT8 is shielded from the solvent by the CTD β strands, suggesting that the Zn+2 sensing capacity of the disease risk variant remains unaffected [25]. However, a recent study has shown that bacterial models are not suitable for explaining the structure and function of hZnT8 owing to their different physiological roles in bacterial cells [24]. As hZnT8 is a transmembrane protein, it is highly challenging to purify the protein in its native form for conducting functional studies [15]. Recently, a proteoliposome-based full-length hZnT8 was produced through a combined bioengineering and nanotechnology approach [26]. Hence, most of the studies have focused only on the soluble CTD instead of the full-length protein in order to investigate hZnT8 activity [15,24]. As protocols for the expression and purification of the hZnT8 CTDs in their native forms have not been reported so far, data on the biophysical characterization of the CTDs in their native forms are lacking in the literature. In this report, we present results obtained from the biophysical characterization of the native form of the hZnT8 CTD and its disease risk variant in solution. These proteins were expressed and purified using a modified strategy that resulted in better solubility of the CTDs, allowing us to characterize the CTDs in their native forms in solution. The data indicate that the CTDs form tetramers, and exhibit negligible differences in their secondary structure content and Zn+2-binding affinities. Thus, this study could provide the basis for conducting further structural investigations of hZnT8 in the future in order to unravel molecular mechanisms underlying the increased susceptibility to develop various diseases, which are modulated by disease risk variants. Moreover, the characterization of the native form of the CTDs in the current study clarifies that the R325W substitution is not much associated with T2D.

2. Results

2.1. The Maltose-Binding Protein (MBP) Tag Improves the Solubility of the CTDs

A significant amount (60 mg per 1 L culture of the cells) of soluble proteins was obtained from the expression of the His-MBP-TEV-fused CTDs in Escherichia coli BL21 DE3 (Figure S1, Supplementary Materials). Both proteins were successfully purified in their native forms using chromatographic techniques. As the His tag has affinity for divalent metal ions, and therefore may affect the Zn+2 binding analysis, the N-terminal tags were removed from the CTDs after the nickel-nitrilotriacetic acid (Ni-NTA) affinity chromatography (Figure S2, Supplementary Materials). The data presented here suggest that the introduction of the MBP tag between the His tag and the TEV site improves the solubility of the CTDs during expression and purification steps (Figures S1 and S2).

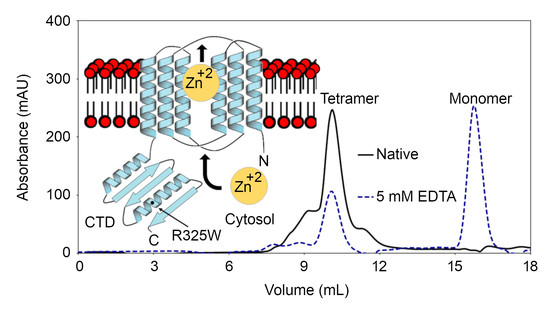
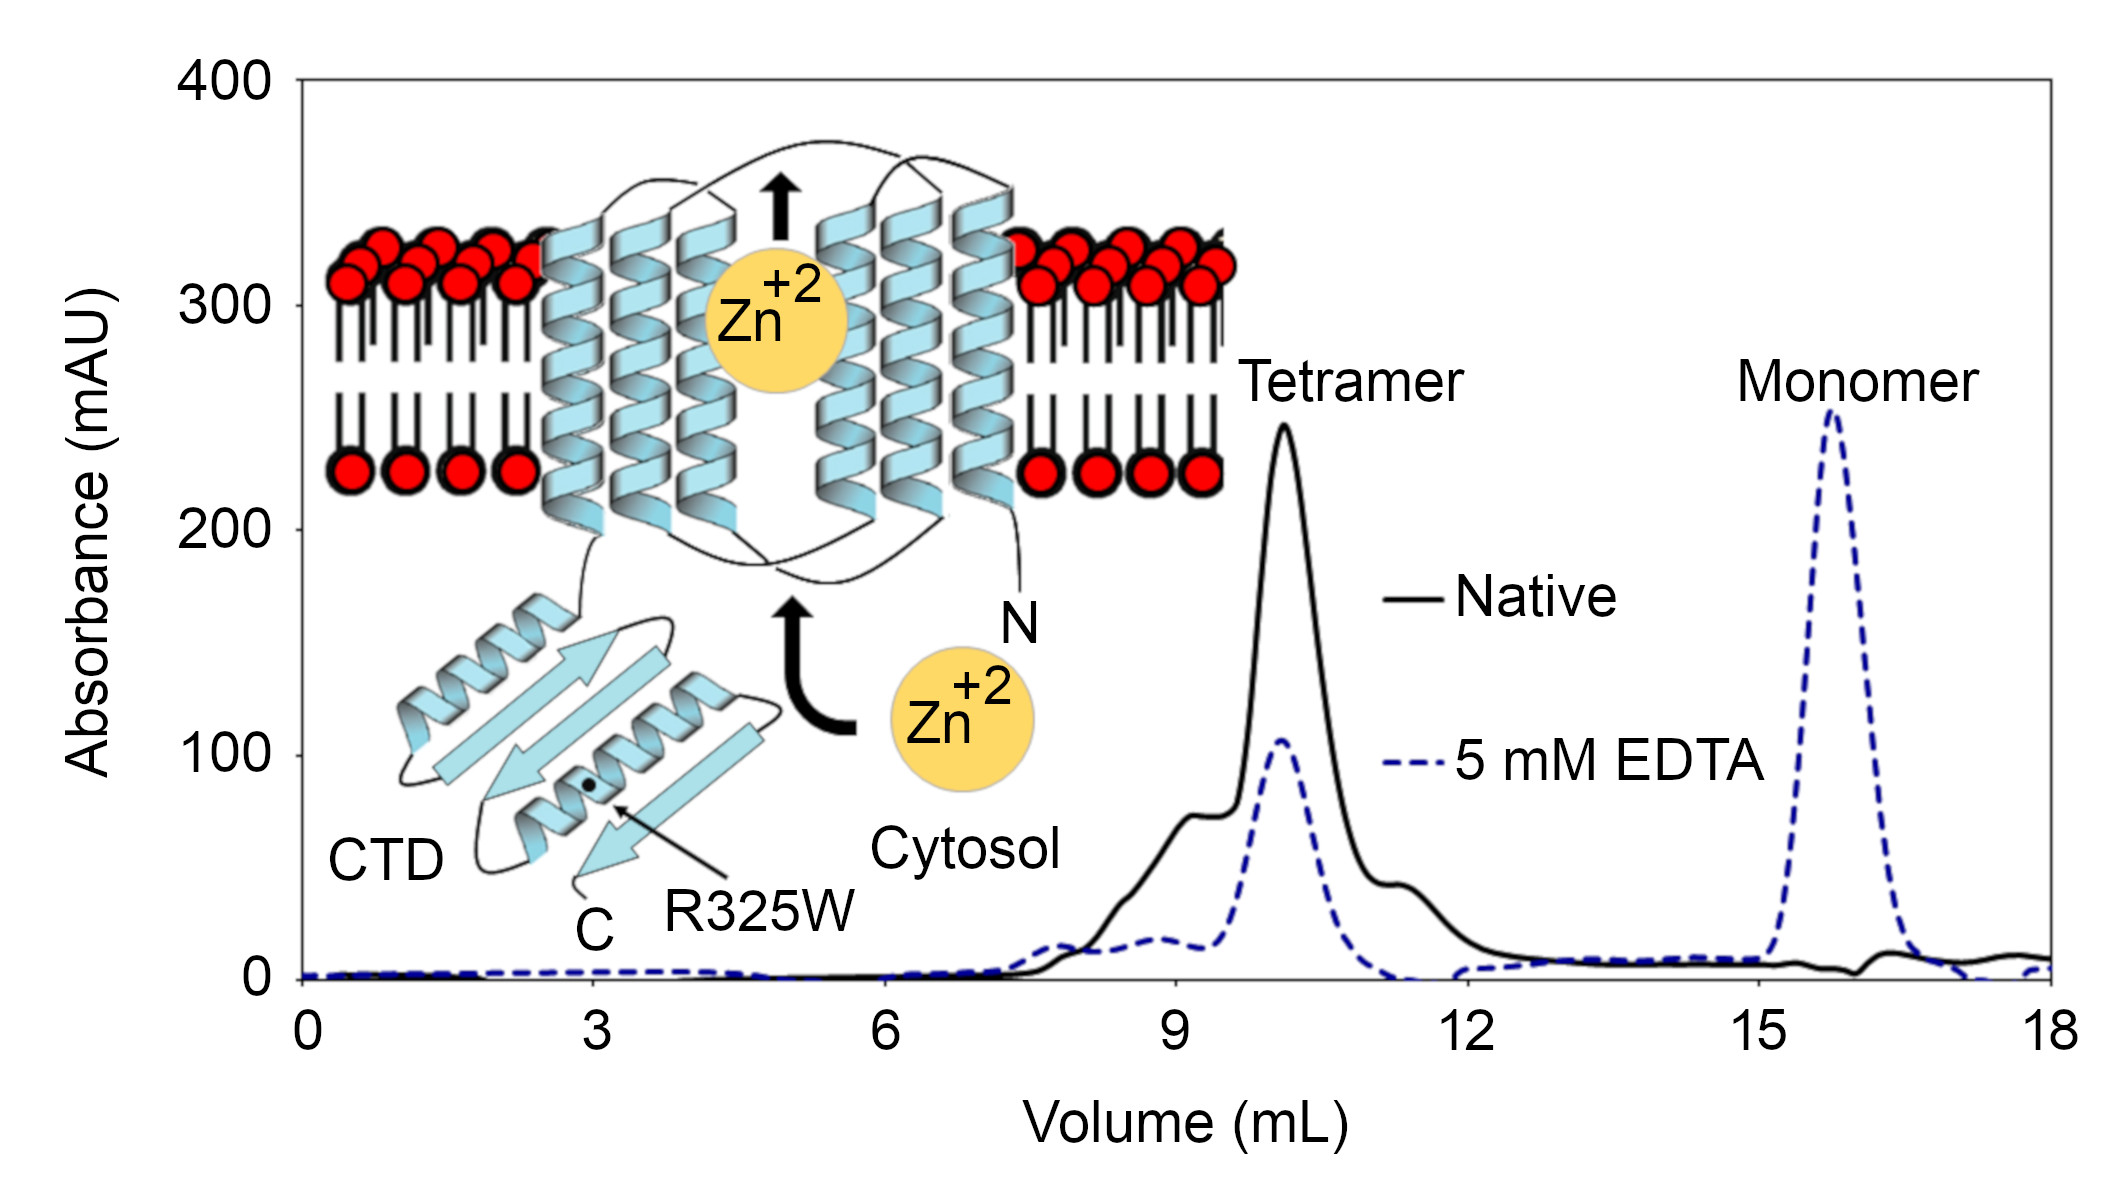
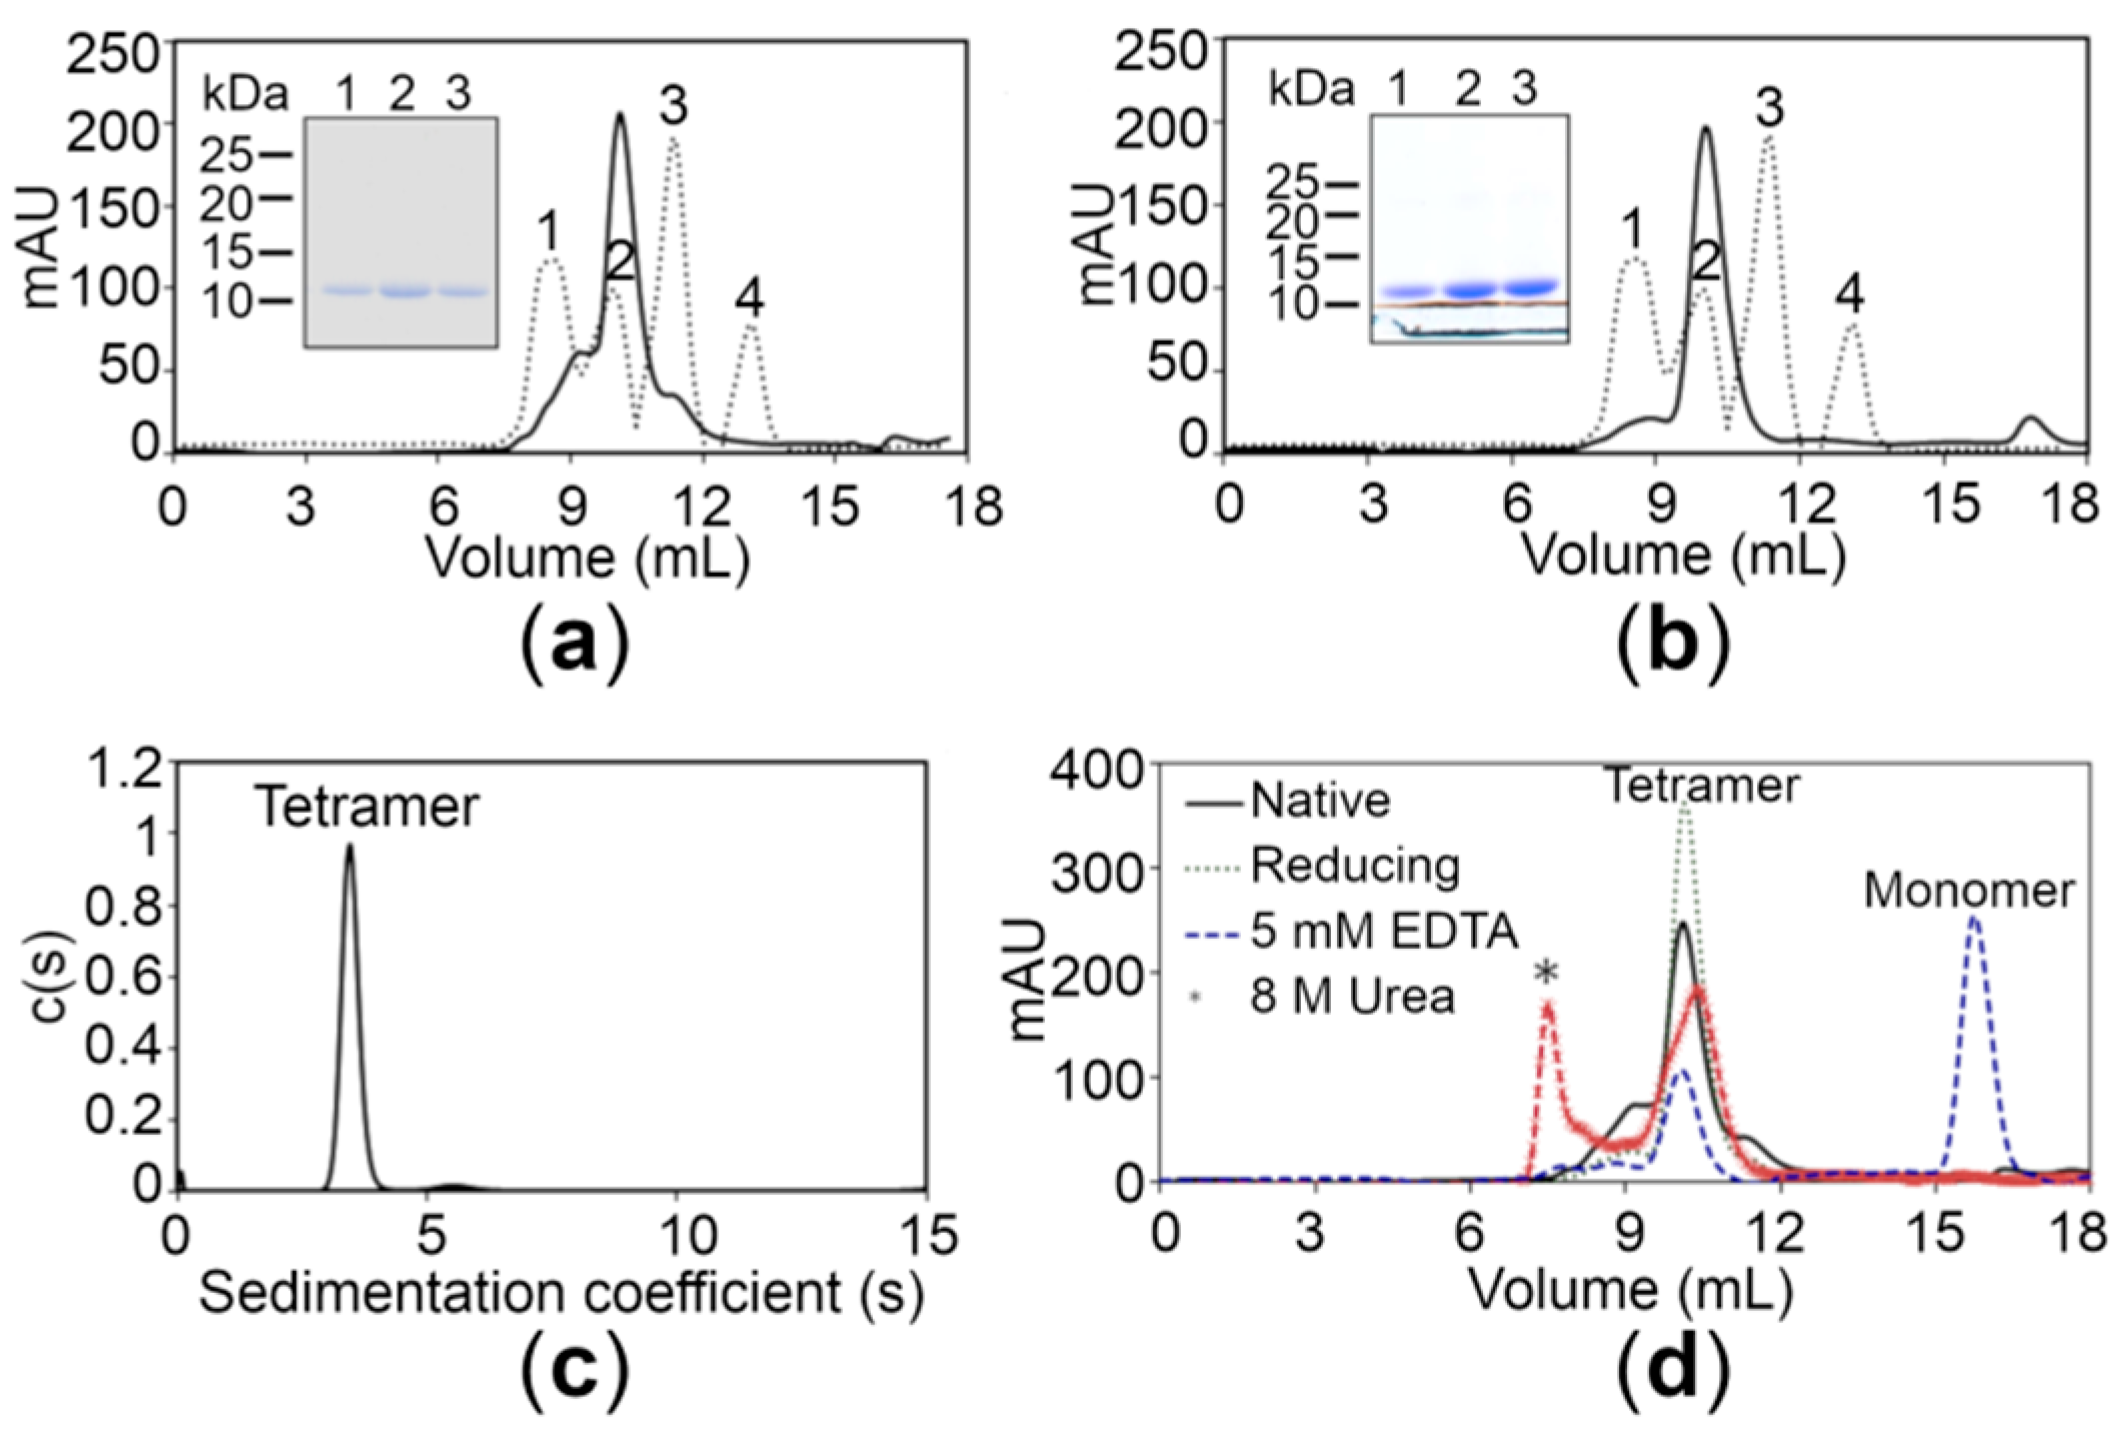
2.2. The CTDs Exist as Tetramers in Solution

Monodispersity analysis by negative-stain electron microscopy (EM) revealed that both proteins were devoid of any aggregates in solution (Figure S3, Supplementary Materials). In order to determine the oligomeric state, size-exclusion chromatography (SEC) of the wild-type (WT) CTD was performed under native conditions. The chromatogram of the WT CTD showed a major peak with a retention time corresponding to the apparent molecular mass of 40 kDa, suggesting that the protein exists as a tetramer in solution (Figure 2a). The latter findings were also supported by analytical ultracentrifugation using the sedimentation velocity method, revealing a major peak corresponding to the tetrameric form (39.6 kDa) for the WT CTD (Figure 2c). Moreover, the experimental molecular weight (MW) of the proteins was also confirmed using mass spectrometry, revealing that the MW of the WT CTD is 9.828 kDa (Figure S2). The SEC elution profile of the WT CTD under reducing conditions (3 mM beta-mercaptoethanol in 20 mM Tris-Cl, pH 7.5, 150 mM NaCl) was similar to that under native conditions, suggesting that the tetrameric state is not due to disulfide linkages (Figure 2d). Interestingly, the equilibrium shifted from the tetrameric state to the monomeric state in the presence of 5 mM ethylenediaminetetraacetic acid (EDTA) (Figure 2d), indicating that Zn+2 ions play an important role in stabilizing the tetrameric state of the CTD. This tetrameric state is also stable under denaturing conditions (8 M urea), although some aggregates are also formed (Figure 2d). Importantly, the CTD of the disease risk variant also exists in the tetrameric form similar to the WT CTD (Figure 2b), suggesting that the R325W substitution does not affect the oligomeric state of the CTD in solution.

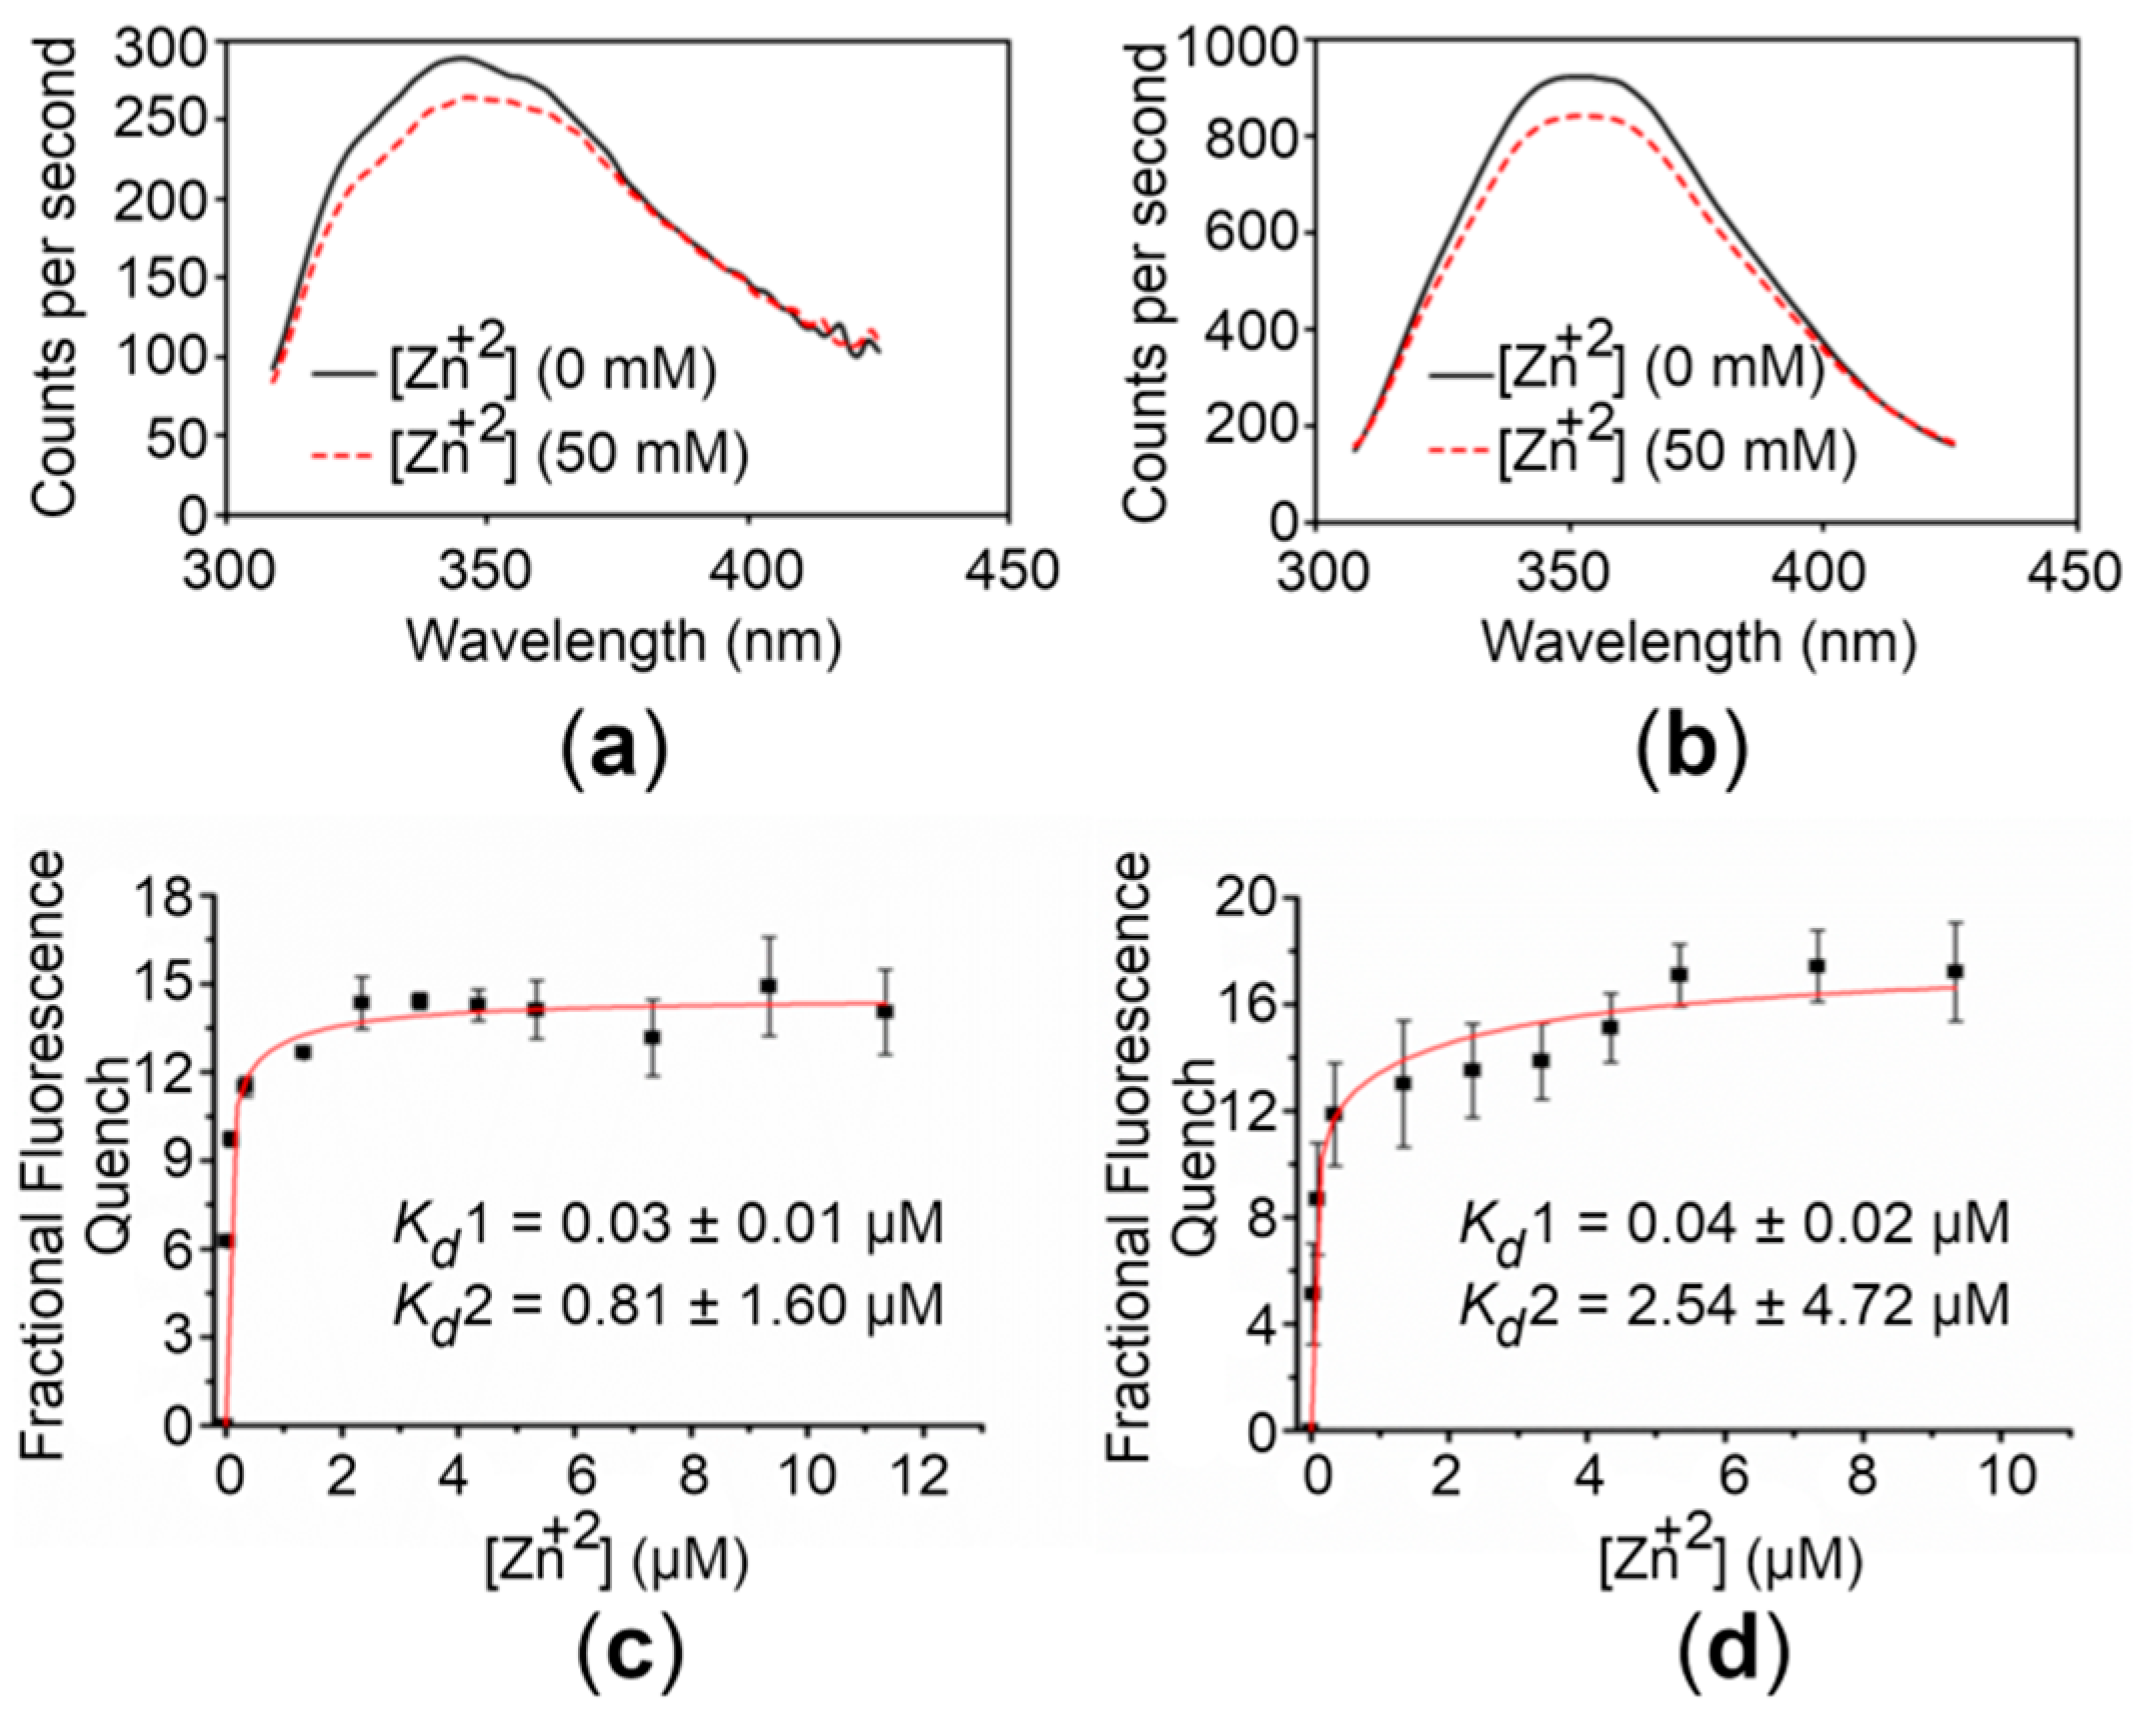
2.3. The CTDs Bind Zn+2 with High Affinity

To assess the Zn+2-binding affinity of the CTDs, we exploited the intrinsic fluorescence of proteins. Initial experiments were performed to observe any detectable change in intrinsic fluorescence upon Zn+2 addition. For this, emission spectra were recorded in the absence and presence of 50 mM Zn+2. Addition of saturating concentrations of Zn+2 to samples of the CTDs induced a significant quenching (~9%) (Figure 3). Similar experiments with the buffer alone did not result in significant quenching. The relationship between the fluorescence quenching for the CTDs and the concentration of Zn+2 used is depicted in Figure 3. The quenching increased upon Zn+2 addition with an approximately hyperbolic trend showing saturation at high Zn+2 concentrations.
The best fit of the binding curve data was obtained using a two-binding-site model as described in Materials and Methods (4.6. Metal Binding Analysis). For the WT CTD, Kd values of 0.03 ± 0.01 and 0.81 ± 1.60 µM were obtained, whereas Kd values of 0.04 ± 0.02 and 2.54 ± 4.72 µM were obtained for the R325W CTD. These results reveal that both the variants bind Zn+2 with high affinity, suggesting that the R325W substitution is compensated in the onset of T2D.

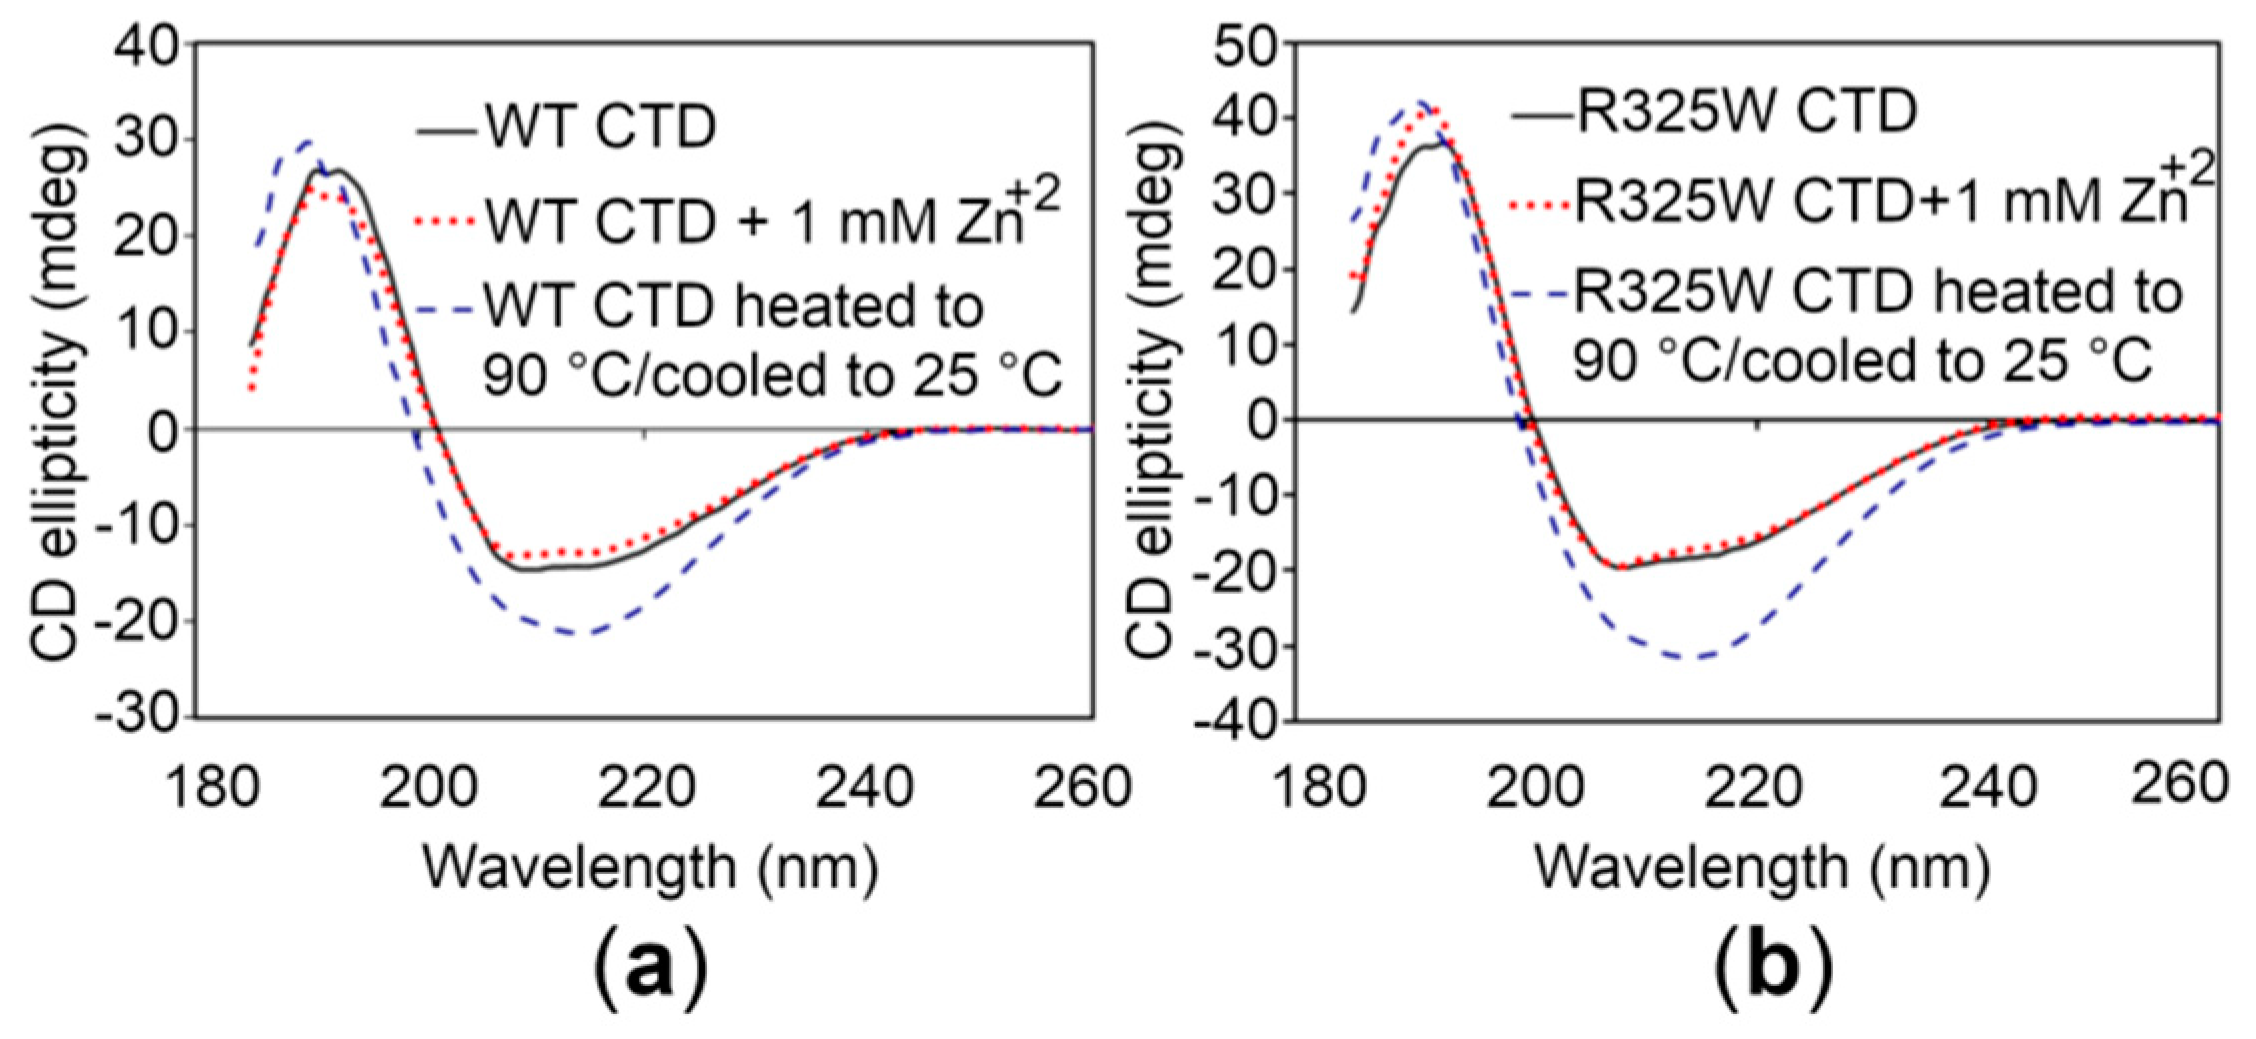
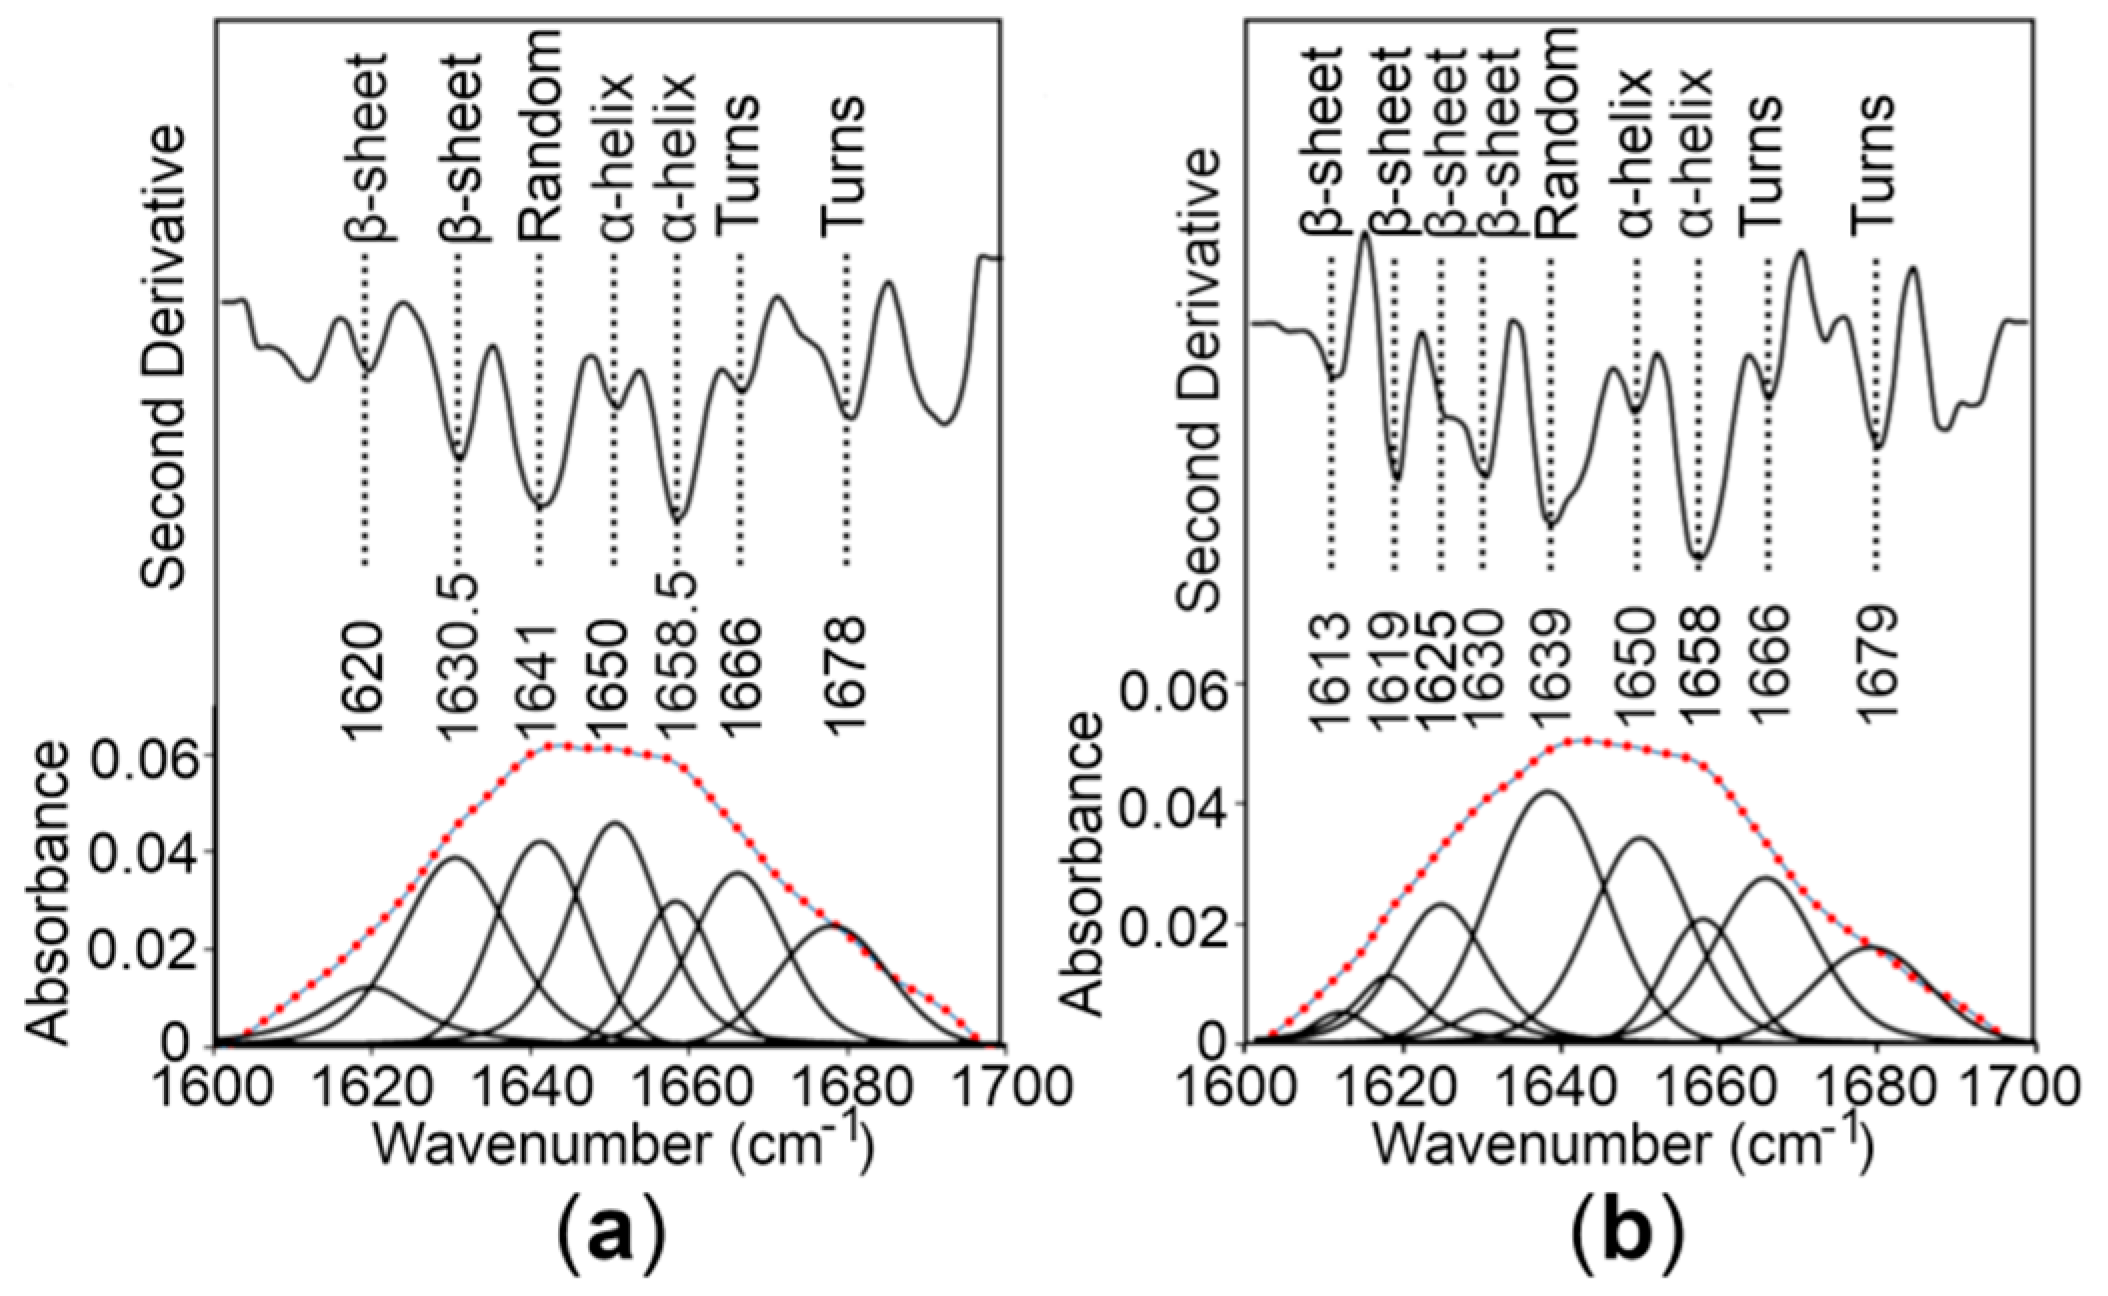
2.4. The CTDs Share Similar Structural Features in the Presence and Absence of Zn+2

In order to investigate whether the CTDs display similar structural features, circular dichroism (CD) spectroscopy of the proteins was performed. The CD spectrum of the WT CTD, particularly in the region between 200 and 240 nm that reflects the secondary structure propensities in proteins [27], is almost identical to the CTD of the disease risk variant (Figure 4). Thus, it appears that the R325W substitution does not induce significant structural changes in the CTD. Moreover, addition of 1 mM Zn+2 to the CTDs did not produce any detectable structural changes in solution, indicating that Zn+2 binding is independent of any alteration in the global structure of the CTDs (Figure 4). Finally, to check the thermal and refolding ability of the CTDs, CD spectra were recorded for the proteins after heating (unfolding) and cooling (refolding). These spectra showed that the domains could not refold after thermal unfolding (Figure 4).
To estimate the secondary structure content of the CTDs, Fourier transform infrared (FT-IR) spectroscopy of the proteins was performed, revealing that the CTDs fold into mixed secondary structure components in solution (Figure 5). To provide a quantitative estimate of the α-helical and β-sheet content of the WT CTD and the R325W CTD, the experimental spectra on the amide I region were reproduced by a fit of seven and nine components, respectively, dominated by those indicative of α-helices and β-sheets [28,29]. Our quantitative analysis predicted the presence of ~27% to 29% α-helices and ~24% to 26% β-sheets for the CTDs (Figure 5 and Table 1), suggesting that the R325W substitution does not cause any significant structural changes in the CTD of hZnT8 in solution.

3. Discussion

In the current study, we compared the biophysical properties of the CTD of hZnT8 with its disease risk variant (R325W). The CTDs were successfully expressed in E. coli and purified to homogeneity in the native form by chromatographic techniques. Gel filtration analysis reveals that the CTDs predominantly exist in tetrameric forms in solution. Surprisingly, the tetramers are also stable in the presence of denaturing concentrations (8 M) of urea. This oligomeric state is stabilized by Zn+2, as the addition of a chelating agent, such as EDTA, results in the dissociation of homotetramers into monomers. To the best of our knowledge, the tetrameric form of the CTD of ZnT8 has not been reported previously. In mouse pancreatic cell lines, the endogenous ZnT8 protein exists as homodimers that require membrane components for dimerization [34]. Recently, it has been reported that the CTDs of hZnT8 exist as dimers in solution [24]. However, the CTDs of hZnT8 were characterized with uncleaved N-terminal tags as the proteins were unstable and precipitated when the tags were removed [24]. In the present study, the tags were cleaved during purification steps, and the resultant native variants were stable and no precipitation was observed. However, it is not clear whether the oligomeric state of the CTDs of hZnT8 is influenced by the presence of N-terminal tags.
The intrinsic fluorescence exhibited by the CTDs of hZnT8 was exploited to confirm their affinity for binding Zn+2. The data presented here indicate that Zn+2 ions associate with the CTD of hZnT8 and its disease risk variant with high affinity. In a previous study, it was reported that the CTD of hZnT8 has at least two Zn+2-binding sites [24], explaining why the domain binds Zn+2 with high affinity. No significant difference in the binding affinity for Zn+2 is observed between the CTDs, suggesting that the Zn+2-binding capacity of the R325W CTD remains unaffected, which might be due to the location of the substitution in the protein structure. In the crystal structure of a homologous zinc transporter, YiiP in E. coli, the residue at position 325 is shielded by the planar surface of three cytoplasmic β-sheets [21,25].
Currently, the three-dimensional structure of the full-length hZnT8 or the CTD is not available in the Protein Data Bank (PDB). In order to estimate the secondary structure content, biophysical characterization of the CTDs of hZnT8 (WT and its R325W variant) was performed through CD and FT-IR spectroscopic techniques. The data do not reveal any structural difference between both the CTDs when analyzed using a given technique (Table 1). Differences in the overall quantitative estimation of the secondary structure content obtained by CD and FT-IR spectroscopic techniques could be due to differences in the techniques employed and algorithms used for the analysis of the secondary structure. Importantly, the addition of 1 mM Zn+2 does not cause any noticeable structural change in the CTDs. The latter findings suggest that the R325W substitution in hZnT8 is tolerated and results in the transport of reasonable amounts of Zn+2 to the correct sites in pancreatic β cells, corroborating previous reports [25]. However, our study does not rule out the possibility that local structural changes, not detectable through CD and FT-IR techniques, in the CTDs could occur that would increase the risk of developing T2D in the case of the disease risk variant. Efforts are underway to crystallize the hZnT8 CTD and its disease risk variant for solving high-resolution crystal structures of the CTDs through X-ray crystallography in order to observe local structural changes in the CTDs.

4. Materials and Methods

4.1. Cloning, Expression, and Purification of the CTDs

DNA encoding the CTD of hZnT8 (Ser281–Asp369) was amplified from the cDNA (IRCMp5012C0519D; pICMV) by “touchdown” PCR [35] using primers (5′ GCAGCCATATGAAGAGCCTGAATTACAGTGGTGTG 3′ and 5′ GCTCGAATTCTTAGTCACAGGGGTCTTCACAG 3′). The PCR reaction mixture consisted of 1 μL of template DNA, 0.2 mM dNTPs, 1.5 mM MgSO4, 0.5 μM of each primer, 1.25 U of Pfu DNA polymerase and 1X Pfu buffer (200 mM Tris-HCl, pH 8.8, 100 mM (NH4)2SO4, 100 mM KCl, 1% Triton X-100, 1 mg/mL BSA) (Fermentas, St. Leon-Rot, Germany). The amplified product was cloned into a pET28a vector using molecular biology methods. Using this recombinant plasmid as a template, the construct for the R325W variant of hZnT8 was generated by the Stratagene QuikChange site-directed mutagenesis kit. The resultant vectors allowed the expression of the CTDs fused to a His tag, an MBP tag, and the TEV site at the N-terminus of the target proteins. The constructs were first introduced into E. coli OmniMAXTM 2T1 strains and then into E. coli BL21 (DE3) expression host cells by a chemical transformation method. Transformed E. coli BL21 (DE3) cells were grown in LB shaking flask cultures supplemented with 25 µg/mL of kanamycin at 37 °C. When the OD600 reached 0.6, the expression of the CTDs was induced by adding 1 mM isopropyl β-d-1-thiogalactopyranoside (IPTG) into the broth cultures. The cells were further grown at 22 °C for 5 h in shaking flask cultures, upon which the cells were harvested through centrifugation. The cell pellet was re-suspended in buffer (20 mM Tris-Cl, pH 7.5, 300 mM NaCl, 5 mM imidazole, 4 mM β-mercaptoethanol) and lysed by two passes through a cell disruptor (Constant Systems Ltd., Daventry, Northants, UK). The cell extract was centrifuged at 12,000× g for 25 min at 4 °C to remove cell debris. The supernatant was passed through Ni-NTA agarose (Qiagen, Hilden, Germany) resin pre-equilibrated with buffer (20 mM Tris-Cl, pH 7.5, 300 mM NaCl, 5 mM imidazole, 4 mM β-mercaptoethanol). Subsequently, the column was washed with 30-column volumes of buffer (20 mM Tris-Cl, pH 7.5, 300 mM NaCl, 30 mM imidazole, 4 mM β-mercaptoethanol). The CTDs were eluted with buffer (20 mM Tris-Cl, pH 7.5, 150 mM NaCl, 150 mM imidazole, 4 mM β-mercaptoethanol). To produce the CTDs in native form, the fused tags at the N-terminus were removed by incubating the CTDs with oligohistidine-tagged tobacco etch virus protease in buffer (20 mM Tris-Cl, pH 7.5, 100 mM NaCl, 10% glycerol, 2 mM β-mercaptoethanol, and 1 mM EDTA) at 25 °C using 10:1 protein-to-protease ratio. The mixture was dialyzed overnight against buffer (20 mM Tris-Cl, pH 7.5, 10 mM NaCl), and then subjected to anion-exchange chromatography using Hi-Trap Q column (GE Healthcare Life Sciences, Uppsala, Sweden). The column was equilibrated with buffer (20 mM Tris-Cl, pH 7.5, 10 mM NaCl). The CTDs eluted when the salt concentration ranged from 50 to 700 mM. The fractions containing the CTDs were pooled and passed 3 or 4 times through Ni-NTA affinity columns to remove oligohistidine-tagged proteins using a fresh Ni-NTA affinity resin each time. In order to remove any remaining MBP-tagged proteins, purified CTDs were passed through amylose resin (New England Biolabs, Ipswich, MA, USA) pre-equilibrated with buffer (20 mM Tris-Cl, pH 7.5, 150 mM NaCl, 1 mM β-mercaptoethanol).
The protein concentration was determined using a NanoDrop 2000c spectrophotometer (Thermo Fisher Scientific, Wilmington, DE, USA) using calculated extinction coefficients of 6990 and 12,490 M−1 cm−1 for the WT CTD and the R325W CTD, respectively, at 280 nm. The CTDs were concentrated to 10–20 mg/mL in buffer (20 mM HEPES, pH 7.5, 150 mM NaCl) using Amicon Ultra centrifugal filters (Millipore, Carrigtwohill, County Cork, Ireland) with a 5 kDa molecular weight cut-off.

4.2. Gel Filtration

The purified CTDs (concentration 10 mg/mL) were analyzed by SEC using an ÄKTA-pure chromatography system (Superdex 75 column - GE Healthcare Life Sciences). The running buffer (20 mM Tris, pH 7.5, 150 mM NaCl) was supplemented with either a denaturant (3 mM β-mercaptoethanol or 8 M urea) or a chelating agent (5 mM EDTA) as required. Commercially available standard proteins (aldolase, ovalbumin, carbonic anhydrase, and ribonuclease; GE Healthcare) were used for calibration.

4.3. Analytical Ultracentrifugation

The oligomeric state of the WT CTD (6 mg/mL in buffer (20 mM Tris, pH 7.5, 150 mM NaCl)) was further analyzed by sedimentation velocity ultracentrifugation [36] using a Beckman ultracentrifuge (Beckman Coulter Inc., Indianapolis, IN, USA). The data were analyzed using the program SEDFIT (version 14.1, National Institutes of Health, Bethesda, MD, USA) [36] to calculate the sedimentation coefficient distribution of the WT CTD.

4.4. Mass Spectrometry

The identity of the CTDs was confirmed by mass spectrometry at the Taplin Mass Spectrometry facility, Harvard Medical School, Boston (http://taplin.med.harvard.edu/), by peptide mass fingerprinting using chymotrypsin that cleaves at C-terminal to the amino acid sequence (FYWML), not before prolines, under low specificity.

4.5. Negative-Stain EM

The CTDs were analyzed by negative-stain EM, as described previously [37]. A drop (3 to 4 µL) of protein solution was applied to a glow-discharged carbon-coated copper–palladium grid and incubated at room temperature for 1 min. The grid was washed with ddH20, incubated with 0.75% uranyl formate, blotted, and dried.

4.6. Metal Binding Analysis

Fluorescence measurements were performed at 25 °C on a scanning fluorimeter (PerkinElmer, Shelton, CT, USA) using 3 mL quartz cuvettes. Excitation and emission slit widths of 2 nm were used. Solutions (2.5 mL) of purified proteins in buffer (20 mM HEPES, pH 7.5, 150 mM NaCl) were serially prepared by adding ZnCl2 to a final concentration of 50 mM. Excitation was done at 285 nm and emission spectra were recorded from 310 nm to 425 nm. The affinity constant (Kd) for Zn+2 was calculated from the background-subtracted spectra by averaging three measurements and using a two-binding-site model to fit the data as follows:
F   = ( Fmax 1   × X ) ( K d 1   + X ) +   ( Fmax 2   × X ) ( K d 2   + X ) ,
where ∆F is the change in fluorescence for a given concentration of substrate X, and ∆Fmax1 and ∆Fmax2 are the total fluorescence changes for the first and second Zn+2-binding sites, respectively. Kd1 and Kd2 are dissociation constants for the first and second Zn+2-binding sites, respectively.

4.7. CD Spectroscopy

CD spectroscopic measurements were carried out using a J-810 spectropolarimeter (JASCO, Easton, MD, USA) with Hellma quartz cuvettes at 25 °C and with a constant nitrogen flush. Samples of purified proteins were dialyzed in buffer (10 mM potassium phosphate, pH 7.4) and concentrated to 0.3 mg/mL. Spectra (185–260 nm) were then recorded as an average of 10 accumulations, with the background of the buffer subtracted. Spectra were recorded at a speed of 1 nm/15 s, sensitivity 50 mdeg, bandwidth 1 nm, resolution 1 nm, and response time 15 s. The samples were scanned at 25 °C after manually heating to 90 °C and then cooling to 25 °C for 5–10 min.

4.8. FT-IR Spectroscopy

The CTDs (20 µL each; 6 mg/mL in buffer (20 mM HEPES, pH 7.5, 150 mM NaCl)) were dried on a platinum ATR platform (diamond crystal) to form a hydrated film. Spectra from 4000 to 500 cm−1 were acquired on a Bruker FT-IR spectrometer (Billerica, MA, USA) in absorbance mode at 1 nm resolution, 256 scans co-addition and three-term Blackman–Harris apodization. To remove the bending vibration of H2O that gives an absorption band at around 1645 cm−1 in the amide I region, spectra for the buffer were recorded, and subtraction of residual vapor absorption was performed. Final manipulated spectra of both domains were obtained between 2000 cm−1 and 1770 cm−1. For secondary structure analysis, the second derivative of spectra corresponding to the amide I region (1700–1600 cm−1) was obtained using Origin software version 7.0 (Origin Lab Corporation, Northampton, MA, USA) following the Savitzky–Golay method [28]. Decomposition of each spectrum into individual bands in the amide I region was performed by nonlinear peak fitting using Galactic PeakSolve™ software (version 1.05, Galactic Industries Corporation, Salem, NH, USA). Band assignments for the interpretation of spectra were done on the basis of previous measurements [29].

5. Conclusions

In the present study, we successfully expressed and purified the CTDs of hZnT8 (the WT and the R325W variant) in their native forms. Unlike many other ZnTs, the CTDs exist as tetramers, and bind Zn+2 with high affinity. Structural characterization of the variants in solution reveals that the R325W substitution does not cause any significant structural perturbations in the CTD of hZnT8. Thus, this study could provide the basis for conducting further structural investigations of the CTDs in their native forms through X-ray crystallography or small-angle X-ray scattering (SAXS), for example, in the future.

Supplementary Materials

Supplementary materials can be found at https://0-www-mdpi-com.brum.beds.ac.uk/1422-0067/21/3/926/s1.

Author Contributions

Conceptualization, M.I., S.O., M.R., and M.J.M.; Formal analysis, R.U., A.S., M.A.S., M.D.M., F.I., M.I., S.O., M.R., and M.J.M.; Funding acquisition, S.O., M.R., and M.J.M.; Investigation, R.U., M.A.S., M.D.M., F.I., and M.R.; Methodology, S.O., M.R., and M.J.M.; Project administration, S.O., M.R., and M.J.M.; Resources, S.O., M.R., and M.J.M.; Supervision, M.I., S.O., M.R., and M.J.M.; Validation, R.U., M.A.S., M.D.M., F.I., and M.R.; Visualization, R.U., A.S., M.D.M., S.O., M.R., and M.J.M.; Writing—original draft, R.U., A.S., M.A.S., M.D.M., F.I., M.I., S.O., M.R., and M.J.M.; Writing—review and editing, A.S., M.I., S.O., M.R., and M.J.M. All authors have read and agreed to the published version of the manuscript.

Funding

This work was funded by the International Centre for Genetic Engineering and Biotechnology (ICGEB), Italy, grant number CRP/PAK10-01 (awarded to Moazur Rahman), PhD studentships by the Higher Education Commission (HEC) of Pakistan (awarded to Raheem Ullah and Majid Ali Shah), and a ICTP-IAEA STEP fellowship (awarded to Raheem Ullah). Aspects of this work were funded by the Biotechnology and Biological Sciences through the SPoRT Membrane Protein Structure Initiative (Grant number BBS/B/14418).

Acknowledgments

This paper is dedicated to the memory of Stephen A. Baldwin, University of Leeds, UK.

Conflicts of Interest

The authors declare no conflict of interest.

Abbreviations

CDCircular dichroism
CDFCation diffusion facilitator
CTDC-terminal domain
EMElectron microscopy
FT-IRFourier transform infrared
GWASGenome-wide association study
hZnT8Human zinc transporter 8
MBPMaltose-binding protein
MWMolecular weight
SECSize-exclusion chromatography
SNPSingle nucleotide polymorphism
T1DType 1 diabetes
T2DType 2 diabetes
TEV siteTobacco etch virus protease recognition site
TMDTransmembrane domain
WTWild-type
ZIPZrt- and Irt-like proteins
ZnTZinc transporter

References

  1. Lichten, L.A.; Cousins, R.J. Mammalian zinc transporters: Nutritional and physiologic regulation. Annu. Rev. Nutr. 2009, 29, 153–176. [Google Scholar] [CrossRef]
  2. Wijesekara, N.; Chimienti, F.; Wheeler, M.B. Zinc, a regulator of islet function and glucose homeostasis. Diabetes Obes. Metab. 2009, 11, 202–214. [Google Scholar] [CrossRef] [PubMed]
  3. Maret, W. Zinc in cellular regulation: The nature and significance of “zinc signals”. Int. J. Mol. Sci. 2017, 18, 2285. [Google Scholar] [CrossRef] [PubMed] [Green Version]
  4. Berg, J.M.; Shi, Y. The galvanization of biology: A growing appreciation for the roles of zinc. Science 1996, 271, 1081–1085. [Google Scholar] [CrossRef] [PubMed]
  5. Andreini, C.; Banci, L.; Bertini, I.; Rosato, A. Counting the zinc-proteins encoded in the human genome. J. Proteome Res. 2006, 5, 196–201. [Google Scholar] [CrossRef]
  6. Fukada, T.; Kambe, T. Molecular and genetic features of zinc transporters in physiology and pathogenesis. Metallomics 2011, 3, 662–674. [Google Scholar] [CrossRef]
  7. Kimura, T.; Kambe, T. The functions of metallothionein and ZIP and ZnT transporters: An overview and perspective. Int. J. Mol. Sci. 2016, 17, 336. [Google Scholar] [CrossRef] [Green Version]
  8. Kolaj-Robin, O.; Russell, D.; Hayes, K.A.; Pembroke, J.T.; Soulimane, T. Cation diffusion facilitator family: Structure and function. FEBS Lett. 2015, 589, 1283–1295. [Google Scholar] [CrossRef]
  9. Hara, T.; Takeda, T.; Takagishi, T.; Fukue, K.; Kambe, T.; Fukada, T. Physiological roles of zinc transporters: Molecular and genetic importance in zinc homeostasis. J. Physiol. Sci. 2017, 67, 283–301. [Google Scholar] [CrossRef]
  10. Chimienti, F.; Devergnas, S.; Favier, A.; Seve, M. Identification and cloning of a β-cell-specific zinc transporter, ZnT-8, localized into insulin secretory granules. Diabetes 2004, 53, 2330–2337. [Google Scholar] [CrossRef] [Green Version]
  11. Chimienti, F.; Favier, A.; Seve, M. ZnT-8, a pancreatic beta-cell-specific zinc transporter. BioMetals 2005, 18, 313–317. [Google Scholar] [CrossRef] [PubMed]
  12. Lemaire, K.; Chimienti, F.; Schuit, F. Zinc transporters and their role in the pancreatic β-cell. J. Diabetes Investig. 2012, 3, 202–211. [Google Scholar] [CrossRef] [PubMed] [Green Version]
  13. Lemaire, K.; Ravier, M.A.; Schraenen, A.; Creemers, J.W.M.; Van de Plas, R.; Granvik, M.; Van Lommel, L.; Waelkens, E.; Chimienti, F.; Rutter, G.A.; et al. Insulin crystallization depends on zinc transporter ZnT8 expression, but is not required for normal glucose homeostasis in mice. Proc. Natl. Acad. Sci. USA 2009, 106, 14872–14877. [Google Scholar] [CrossRef] [PubMed] [Green Version]
  14. Sladek, R.; Rocheleau, G.; Rung, J.; Dina, C.; Shen, L.; Serre, D.; Boutin, P.; Vincent, D.; Belisle, A.; Hadjadj, S.; et al. A genome-wide association study identifies novel risk loci for type 2 diabetes. Nature 2007, 445, 881–885. [Google Scholar] [CrossRef]
  15. Huang, Q.; Du, J.; Merriman, C.; Gong, Z. Genetic, functional, and immunological study of ZnT8 in diabetes. Int. J. Endocrinol. 2019, 2019, 1–11. [Google Scholar] [CrossRef]
  16. Chauhan, G.; Spurgeon, C.J.; Tabassum, R.; Bhaskar, S.; Kulkarni, S.R.; Mahajan, A.; Chavali, S.; Kumar, M.V.K.; Prakash, S.; Dwivedi, O.P.; et al. Impact of common variants of PPARG, KCNJ11, TCF7L2, SLC30A8, HHEX, CDKN2A, IGF2BP2, and CDKAL1 on the risk of type 2 diabetes in 5164 Indians. Diabetes 2010, 59, 2068–2074. [Google Scholar] [CrossRef] [Green Version]
  17. Kommoju, U.J.; Maruda, J.; Kadarkarai, S.; Irgam, K.; Kotla, J.P.; Velaga, L.; Mohan Reddy, B. No detectable association of IGF2BP2 and SLC30A8 genes with type 2 diabetes in the population of Hyderabad, India. Meta Gene 2013, 1, 15–23. [Google Scholar] [CrossRef]
  18. Kulkarni, H.; Mamtani, M.; Peralta, J.M.; Diego, V.; Dyer, T.D.; Goring, H.; Almasy, L.; Mahaney, M.C.; Williams-Blangero, S.; Duggirala, R.; et al. Lack of association between SLC30A8 variants and type 2 diabetes in Mexican American families. J. Diabetes Res. 2016, 2016, 1–9. [Google Scholar] [CrossRef] [Green Version]
  19. Lewis, J.P.; Palmer, N.D.; Hicks, P.J.; Sale, M.M.; Langefeld, C.D.; Freedman, B.I.; Divers, J.; Bowden, D.W. Association analysis in African Americans of European-derived type 2 diabetes single nucleotide polymorphisms from whole-genome association studies. Diabetes 2008, 57, 2220–2225. [Google Scholar] [CrossRef] [Green Version]
  20. Flannick, J.; Thorleifsson, G.; Beer, N.L.; Jacobs, S.B.R.; Grarup, N.; Burtt, N.P.; Mahajan, A.; Fuchsberger, C.; Atzmon, G.; Benediktsson, R.; et al. Loss-of-function mutations in SLC30A8 protect against type 2 diabetes. Nat. Genet. 2014, 46, 357–363. [Google Scholar] [CrossRef]
  21. Lu, M.; Fu, D. Structure of the zinc transporter YiiP. Science 2007, 317, 1746–1748. [Google Scholar] [CrossRef] [PubMed] [Green Version]
  22. Lu, M.; Chai, J.; Fu, D. Structural basis for autoregulation of the zinc transporter YiiP. Nat. Struct. Mol. Biol. 2009, 16, 1063–1067. [Google Scholar] [CrossRef] [PubMed]
  23. Jansen, J.; Rosenkranz, E.; Overbeck, S.; Warmuth, S.; Mocchegiani, E.; Giacconi, R.; Weiskirchen, R.; Karges, W.; Rink, L. Disturbed zinc homeostasis in diabetic patients by in vitro and in vivo analysis of insulinomimetic activity of zinc. J. Nutr. Biochem. 2012, 23, 1458–1466. [Google Scholar] [CrossRef] [PubMed]
  24. Parsons, D.S.; Hogstrand, C.; Maret, W. The C-terminal cytosolic domain of the human zinc transporter ZnT8 and its diabetes risk variant. FEBS J. 2018, 285, 1237–1250. [Google Scholar] [CrossRef] [PubMed] [Green Version]
  25. Weijers, R.N. Three-dimensional structure of β-cell-specific zinc transporter, ZnT-8, predicted from the type 2 diabetes-associated gene variant SLC30A8 R325W. Diabetol. Metab. Syndr. 2010, 2, 33. [Google Scholar] [CrossRef] [Green Version]
  26. Wan, H.; Merriman, C.; Atkinson, M.A.; Wasserfall, C.H.; Mcgrail, K.M.; Liang, Y.; Fu, D.; Dai, H. Proteoliposome-based full-length ZnT8 self-antigen for type 1 diabetes diagnosis on a plasmonic platform. Proc. Natl. Acad. Sci. USA 2017, 114, 10196–10201. [Google Scholar] [CrossRef] [Green Version]
  27. Kelly, S.M.; Jess, T.J.; Price, N.C. How to study proteins by circular dichroism. Biochim. Biophys. Acta Proteins Proteom. 2005, 1751, 119–139. [Google Scholar] [CrossRef]
  28. Goormaghtigh, E.; Cabiaux, V.; Ruysschaert, J.M. Determination of soluble and membrane protein structure by Fourier transform infrared spectroscopy. I. Assignments and model compounds. Subcell. Biochem. 1994, 23, 329–362. [Google Scholar] [CrossRef]
  29. Goormaghtigh, E.; Cabiaux, V.; Ruysschaert, J.M. Determination of soluble and membrane protein structure by Fourier transform infrared spectroscopy. III. Secondary structures. Subcell. Biochem. 1994, 23, 405–450. [Google Scholar] [CrossRef]
  30. Raussens, V.; Ruysschaert, J.-M.; Goormaghtigh, E. Protein concentration is not an absolute prerequisite for the determination of secondary structure from circular dichroism spectra: A new scaling method. Anal. Biochem. 2003, 319, 114–121. [Google Scholar] [CrossRef]
  31. Whitmore, L.; Wallace, B.A. DICHROWEB, an online server for protein secondary structure analyses from circular dichroism spectroscopic data. Nucleic Acids Res. 2004, 32, W668–W673. [Google Scholar] [CrossRef] [PubMed] [Green Version]
  32. Whitmore, L.; Wallace, B.A. Protein secondary structure analyses from circular dichroism spectroscopy: Methods and reference databases. Biopolymers 2008, 89, 392–400. [Google Scholar] [CrossRef] [PubMed]
  33. Provencher, S.W.; Glöckner, J. Estimation of globular protein secondary structure from circular dichroism. Biochemistry 1981, 20, 33–37. [Google Scholar] [CrossRef] [PubMed]
  34. Murgia, C.; Devirgiliis, C.; Mancini, E.; Donadel, G.; Zalewski, P.; Perozzi, G. Diabetes-linked zinc transporter ZnT8 is a homodimeric protein expressed by distinct rodent endocrine cell types in the pancreas and other glands. Nutr. Metab. Cardiovasc. Dis. 2009, 19, 431–439. [Google Scholar] [CrossRef] [PubMed]
  35. Don, R.H.; Cox, P.T.; Wainwright, B.J.; Baker, K.; Mattick, J.S. “Touchdown” PCR to circumvent spurious priming during gene amplification. Nucleic Acids Res. 1991, 19, 4008. [Google Scholar] [CrossRef] [PubMed] [Green Version]
  36. Schuck, P. Size-distribution analysis of macromolecules by sedimentation velocity ultracentrifugation and Lamm equation modeling. Biophys. J. 2000, 78, 1606–1619. [Google Scholar] [CrossRef] [Green Version]
  37. Iram, N.; Shah, M.S.; Ismat, F.; Habib, M.; Iqbal, M.; Hasnain, S.S.; Rahman, M. Heterologous expression, characterization and evaluation of the matrix protein from Newcastle disease virus as a target for antiviral therapies. Appl. Microbiol. Biotechnol. 2014, 98, 1691–1701. [Google Scholar] [CrossRef]
Figure 1. Cartoon diagram of the human zinc transporter 8 (hZnT8) protein topology depicting the location of the R325W substitution in the C-terminal domain (CTD). Like many other Zn+2 transporters (ZnTs), hZnT8 consists of a transmembrane domain (TMD), with its N- and C-termini facing the cytoplasm [8].
Ijms 21 00926 g001
Figure 2. Analysis of the hZnT8 CTDs through gel filtration and analytical ultracentrifugation. (a,b) Gel filtration chromatograms of the wild-type (WT) CTD (a) and the R325W CTD (b) showing an apparent molecular mass of approximately 40 kDa. The dotted lines represent the following protein standards: aldolase (158 kDa) (peak 1), ovalbumin (44 kDa) (peak 2), carbonic anhydrase (29 kDa) (peak 3), and ribonuclease (13.7 kDa) (peak 4). Inset shows the SDS-PAGE analysis of the WT CTD (a) and the R325W CTD (b) purified by size exclusion chromatography. (c) A major peak corresponding to the tetrameric form (39.6 kDa) for the WT CTD obtained using analytical ultracentrifugation. (d) Gel filtration chromatograms of the WT CTD with 5 mM ethylenediaminetetraacetic acid (EDTA) (blue dotted lines), 8 M urea (brown dotted lines), and 3 mM β-mercaptoethanol (green dotted lines) are depicted. Protein aggregates formed in the presence of urea are shown with an asterisk (*).
Ijms 21 00926 g002
Figure 3. Zn+2 binding analysis of the hZnT8 CTDs. (a,b) Fluorescence emission spectra of the WT CTD (a) and the R325W CTD (b) before (continuous lines) and after (dotted lines) addition of 50 mM Zn+2 are shown. (c,d) Concentration-dependent Zn+2-binding affinity curves for the WT CTD (c) and the R325W CTD (d). The apparent affinities (Kd values) for Zn+2 binding to the WT CTD and the R325W CTD were obtained by nonlinear fitting of the respective quench/concentration curves to a two-binding-site model. The excitation and emission wavelengths used in the experiments were 285 nm and 350 nm, respectively. Fluorescence was recorded at excitation and emission slit widths of 2.0. Data points and error bars represent the mean and standard deviation of three individual measurements, respectively.
Ijms 21 00926 g003
Figure 4. Circular dichroism (CD) spectroscopy of the hZnT8 CTDs. (a,b) CD spectra of the WT CTD (a) and the R325W CTD (b) in the absence (black continuous lines) and in the presence (red dotted lines) of 1 mM Zn+2. Blue dotted lines represent the CD spectra of the CTDs that were heated up to 90 °C followed by an attempt of refolding upon cooling to 25 °C.
Ijms 21 00926 g004
Figure 5. Analysis of the secondary structure content of the hZnT8 CTDs by Fourier transform infrared (FT-IR) spectroscopy. (a,b) The second derivative and amide I region of FT-IR spectra of a hydrated film of the WT CTD (a) and the R325W CTD (b) are shown as thick grey lines. The bands obtained by deconvolution are also depicted. The dotted red line represents the curve fitted using the component bands. The peak position of the spectral components and their assignments are also shown.
Ijms 21 00926 g005
Table 1. Secondary structure content of the WT CTD and the R325W CTD analyzed through spectroscopic techniques in the current study.
Proteinα-Helix (%)β-Sheet (%)β-Turn (%)Random Coil (%)Technique
WT CTD41151331CD spectroscopy 1
46101727CD spectroscopy 2
R325W CTD46121329CD spectroscopy 1
53101720CD spectroscopy 2
WT CTD29.626.12717.3FT-IR spectroscopy
R325W CTD27242524FT-IR spectroscopy
1 CD spectra of the WT CTD and the R325W CTD in the absence of Zn+2 (shown in Figure 4; black continuous lines) were analyzed with the protein concentration-independent method using a web-based server at http://perry.freeshell.org/raussens.html [30]. 2 CD spectra were analyzed using the DichroWeb server at http://dichroweb.cryst.bbk.ac.uk/html/home.shtml [31,32] and the program CONTIN/reference set 3 [33].

