Aberrant Mitochondrial Morphology and Function in the BTBR Mouse Model of Autism Is Improved by Two Weeks of Ketogenic Diet

 , , and
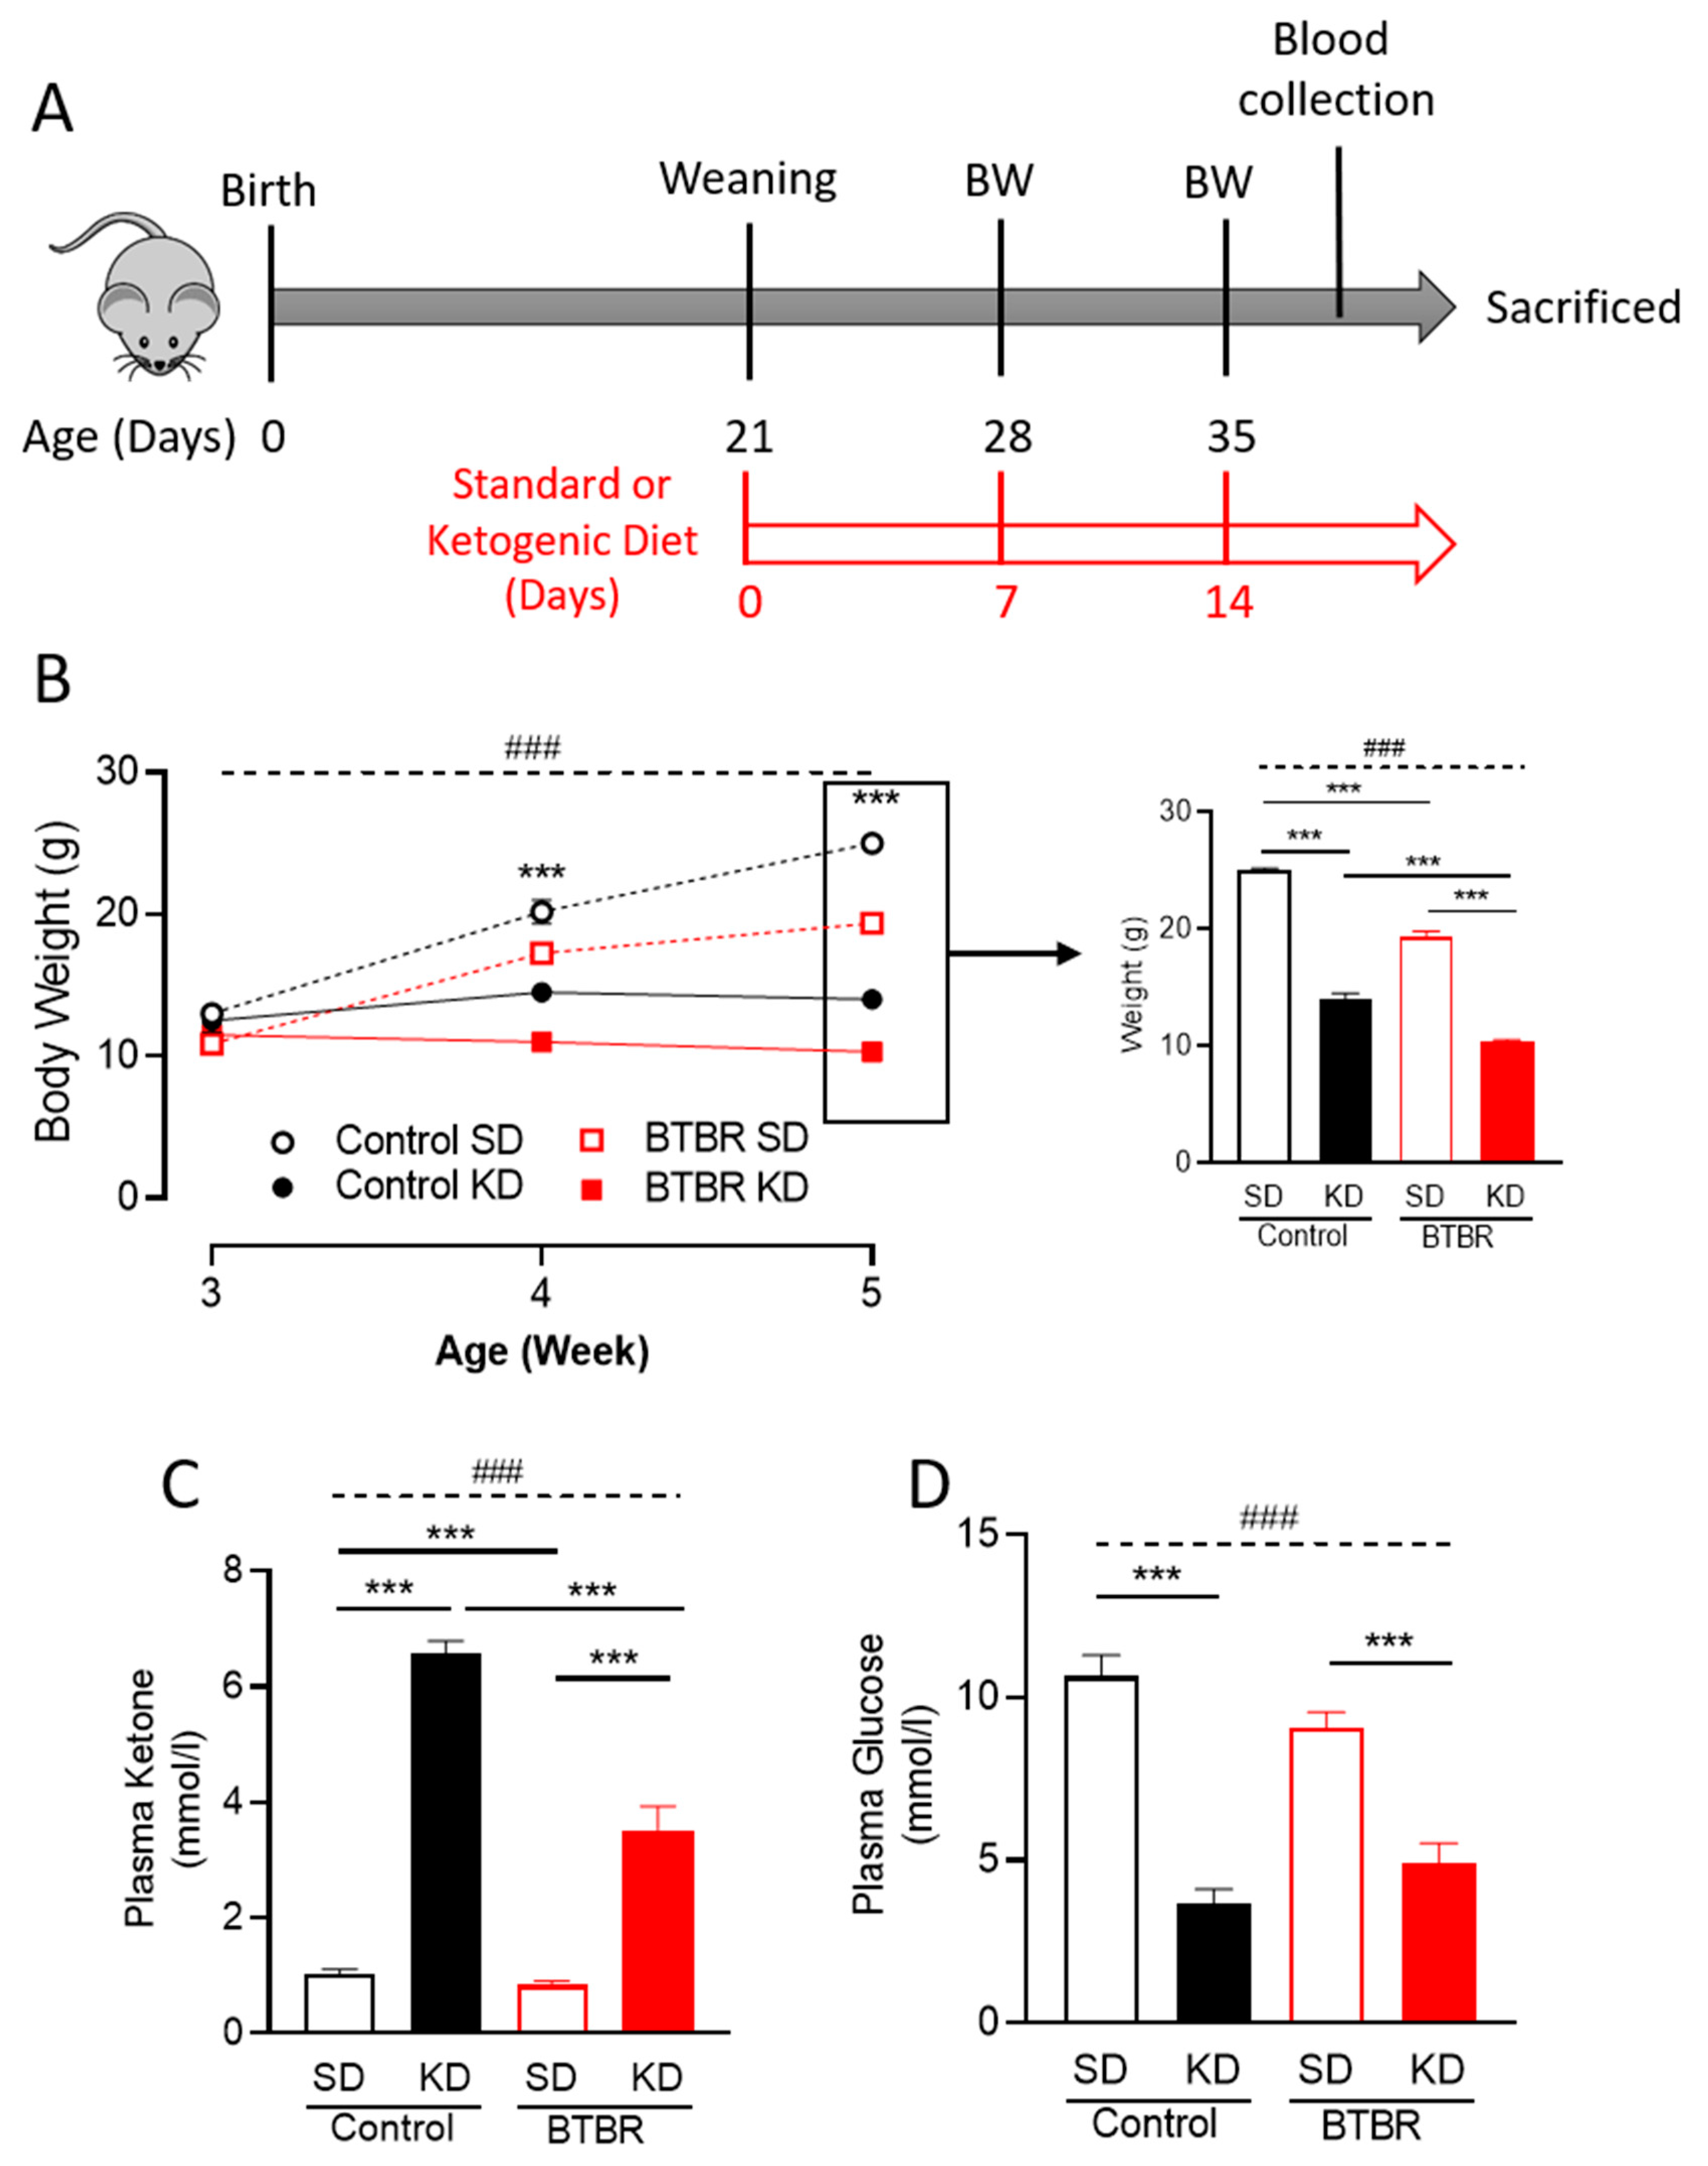
Abstract
:1. Introduction
2. Results
2.1. Two Weeks of KD Significantly Reduced Mice Body Weight and Plasma Glucose Levels
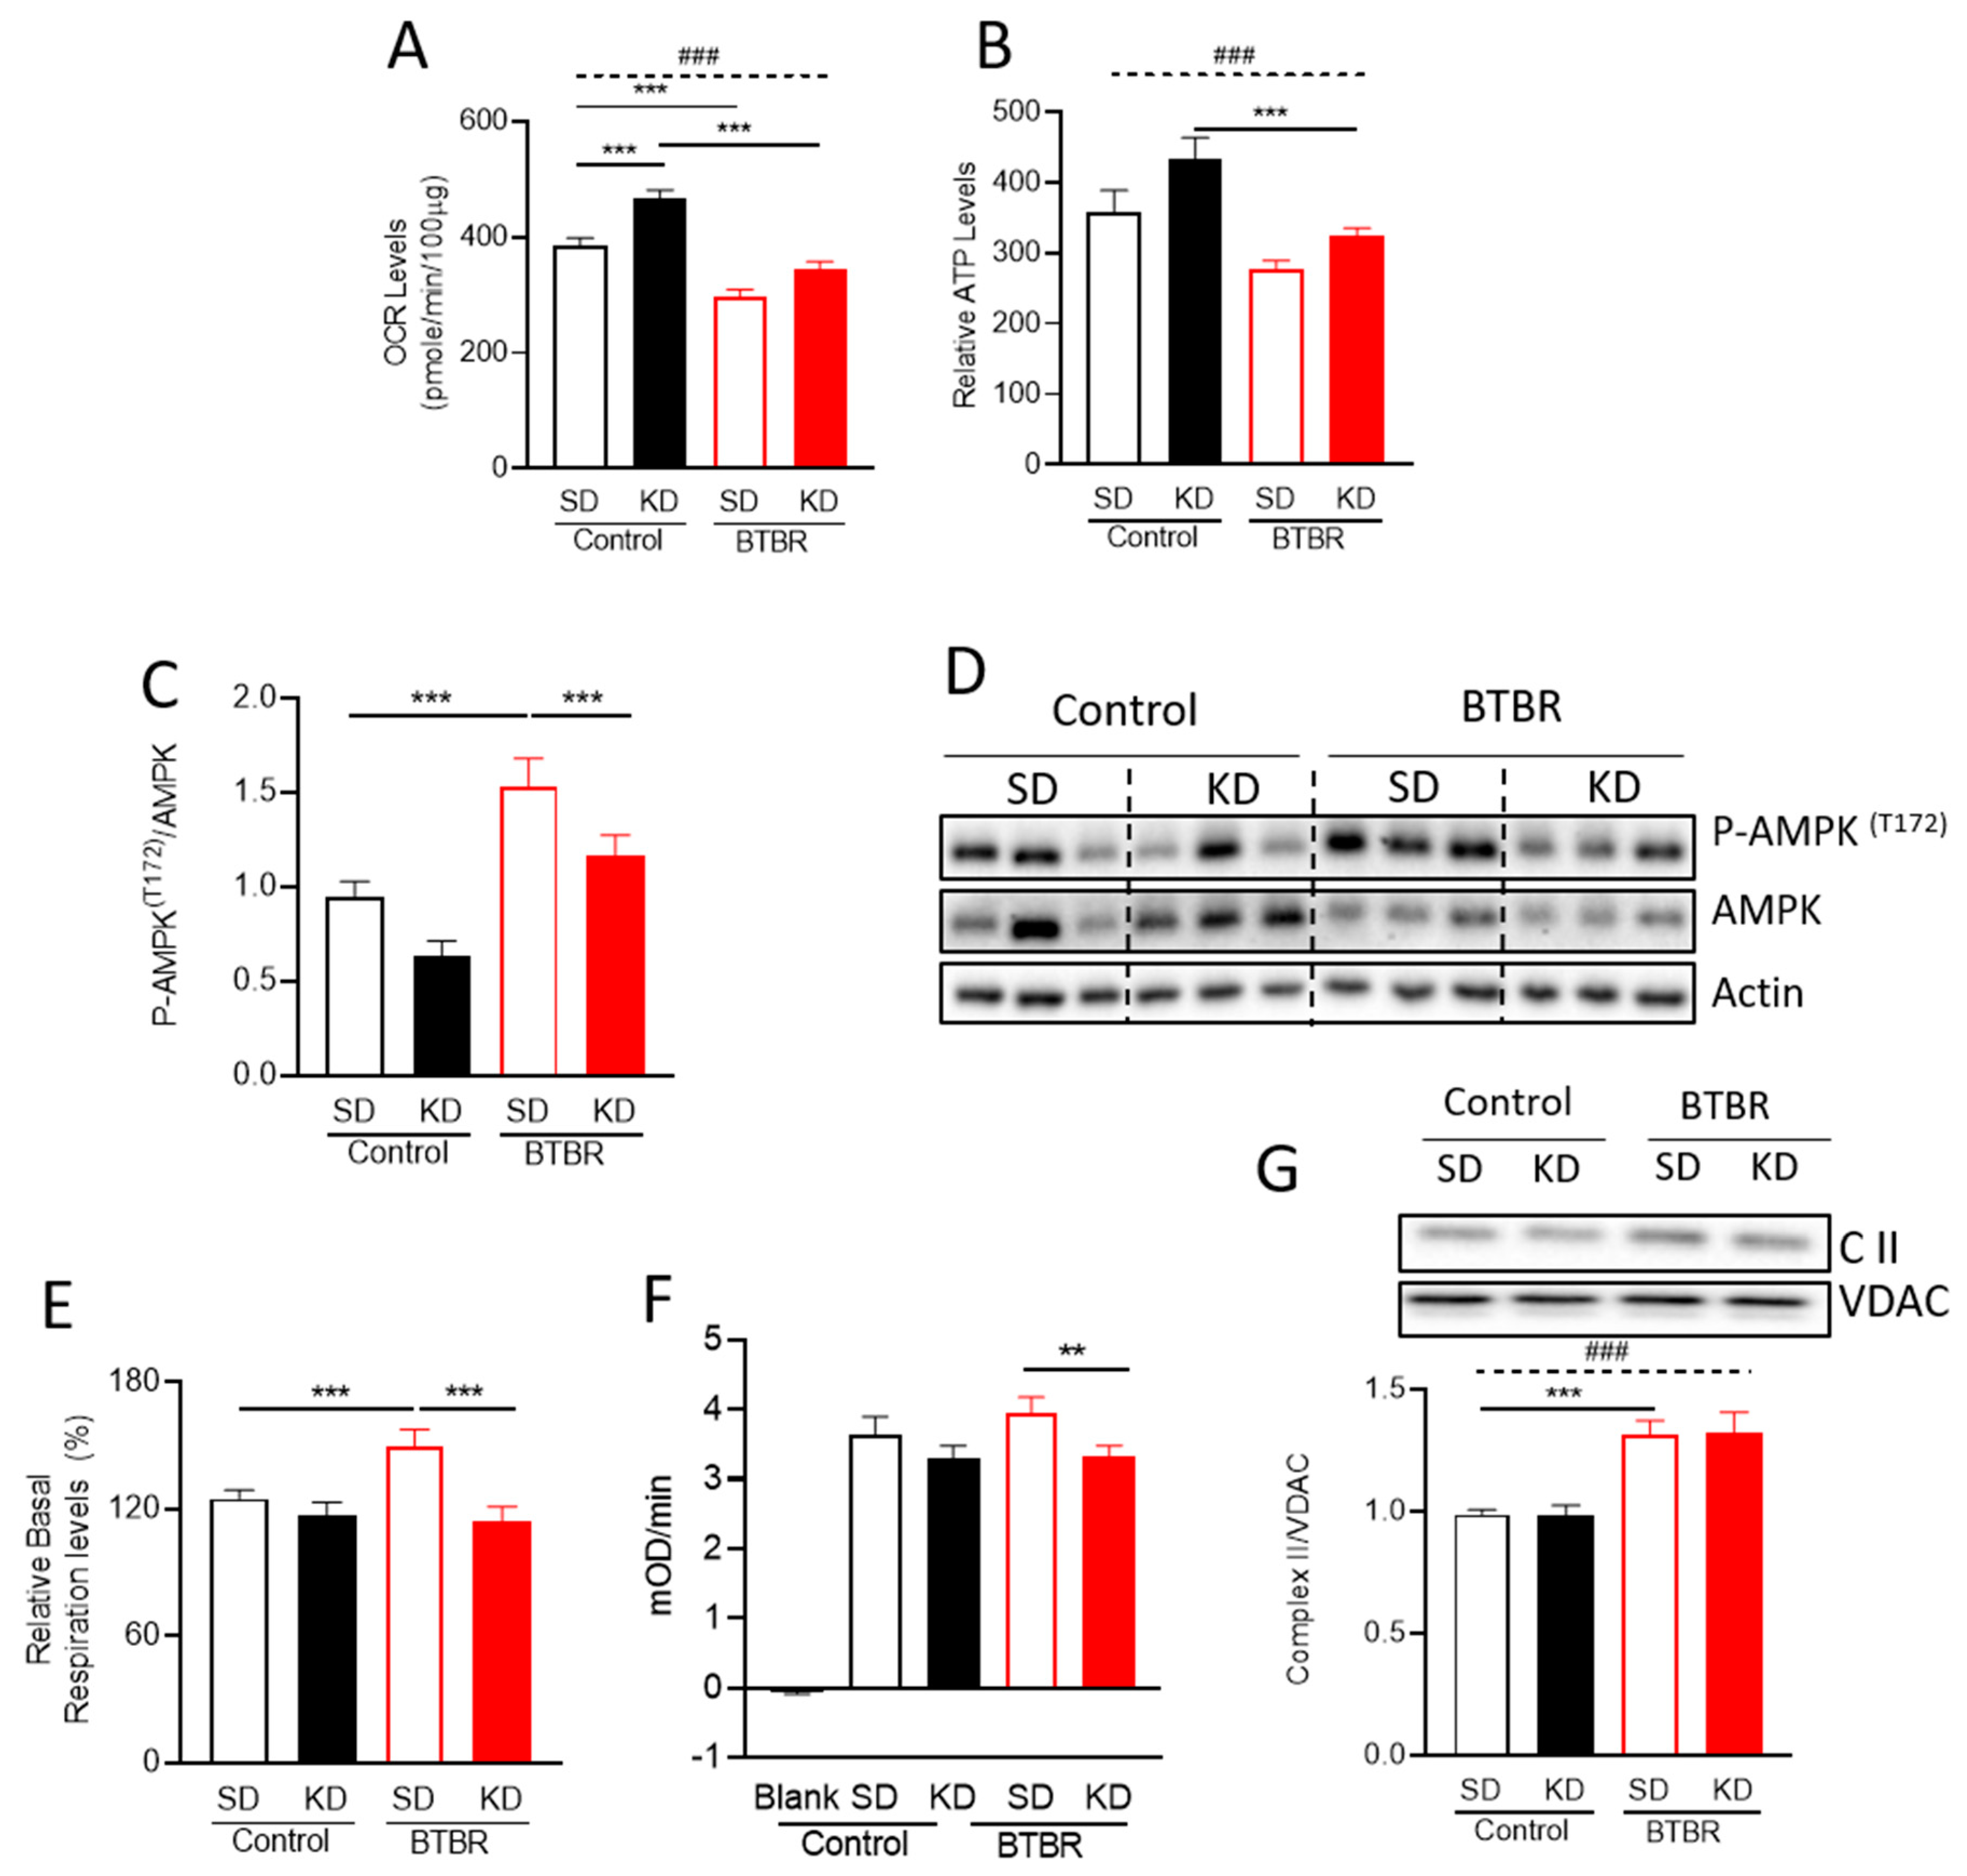
2.2. KD Increased Mitochondrial Metabolism and Decreased AMPK Activation in BTBR Mice
2.3. BTBR Have Increased Complex II Enzyme Activity and Protein Expression
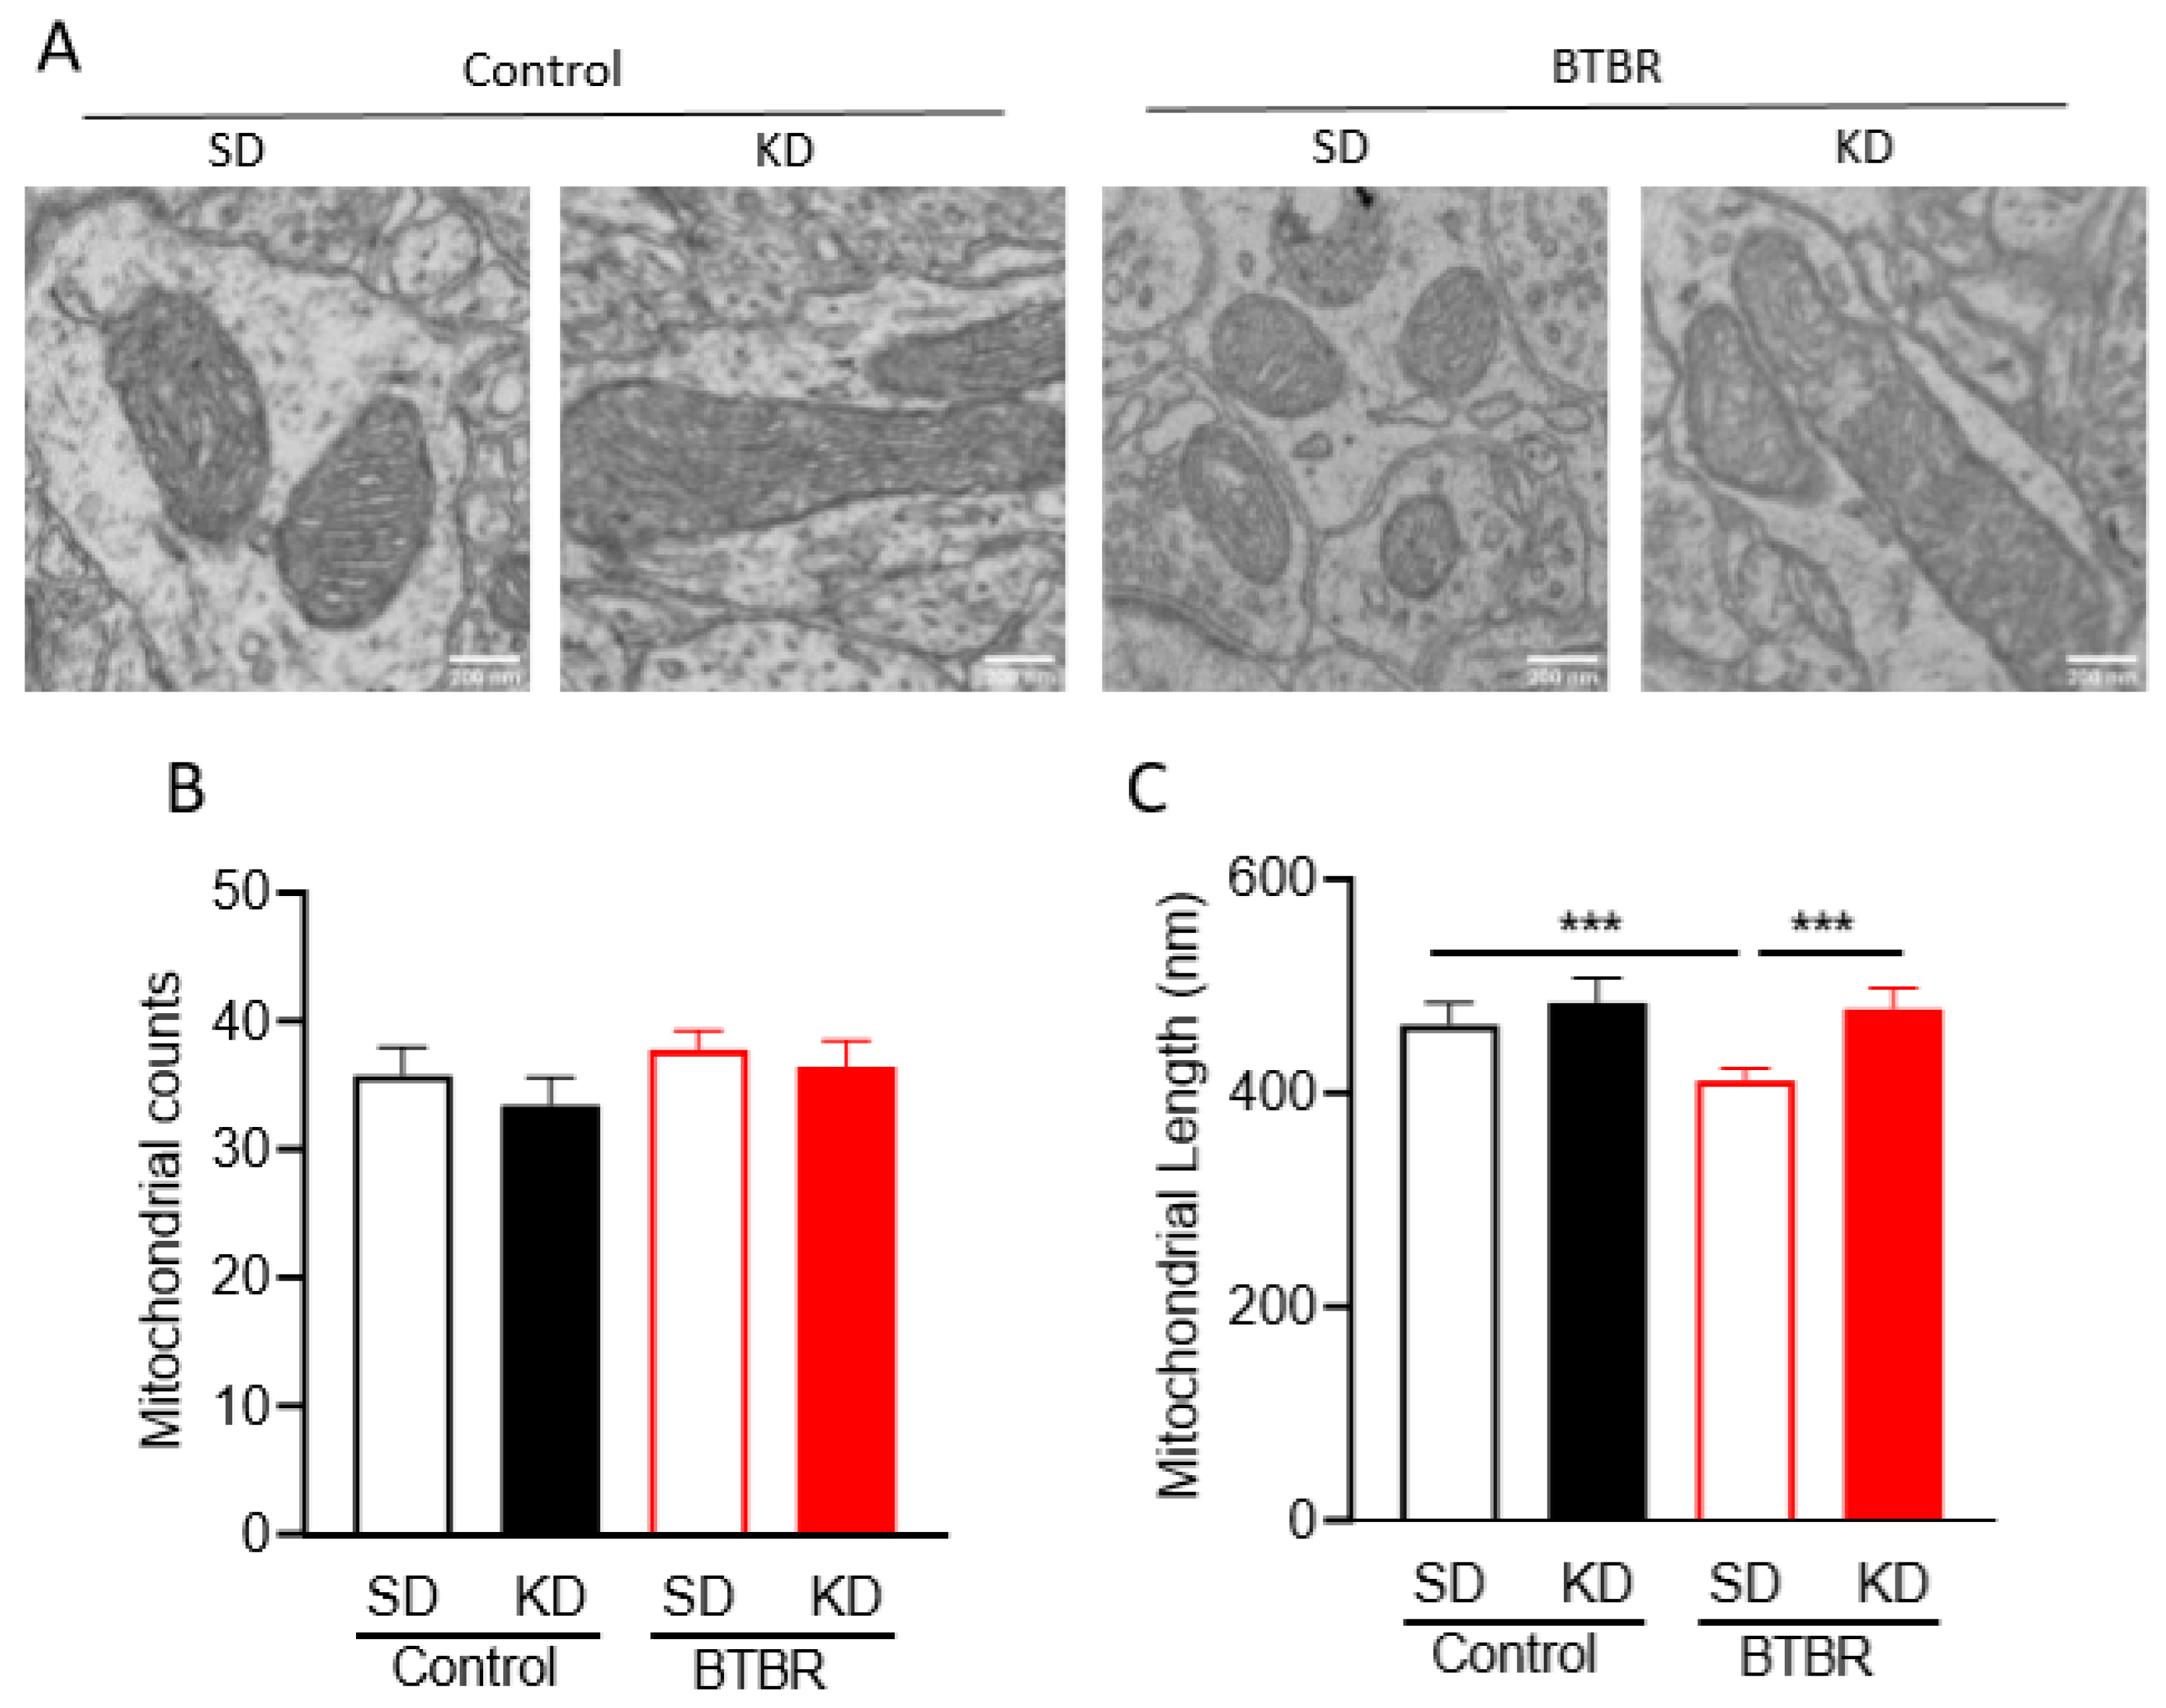
2.4. KD Rescues Mitochondrial Fragmentation Observed in Brains of BTBR Mice
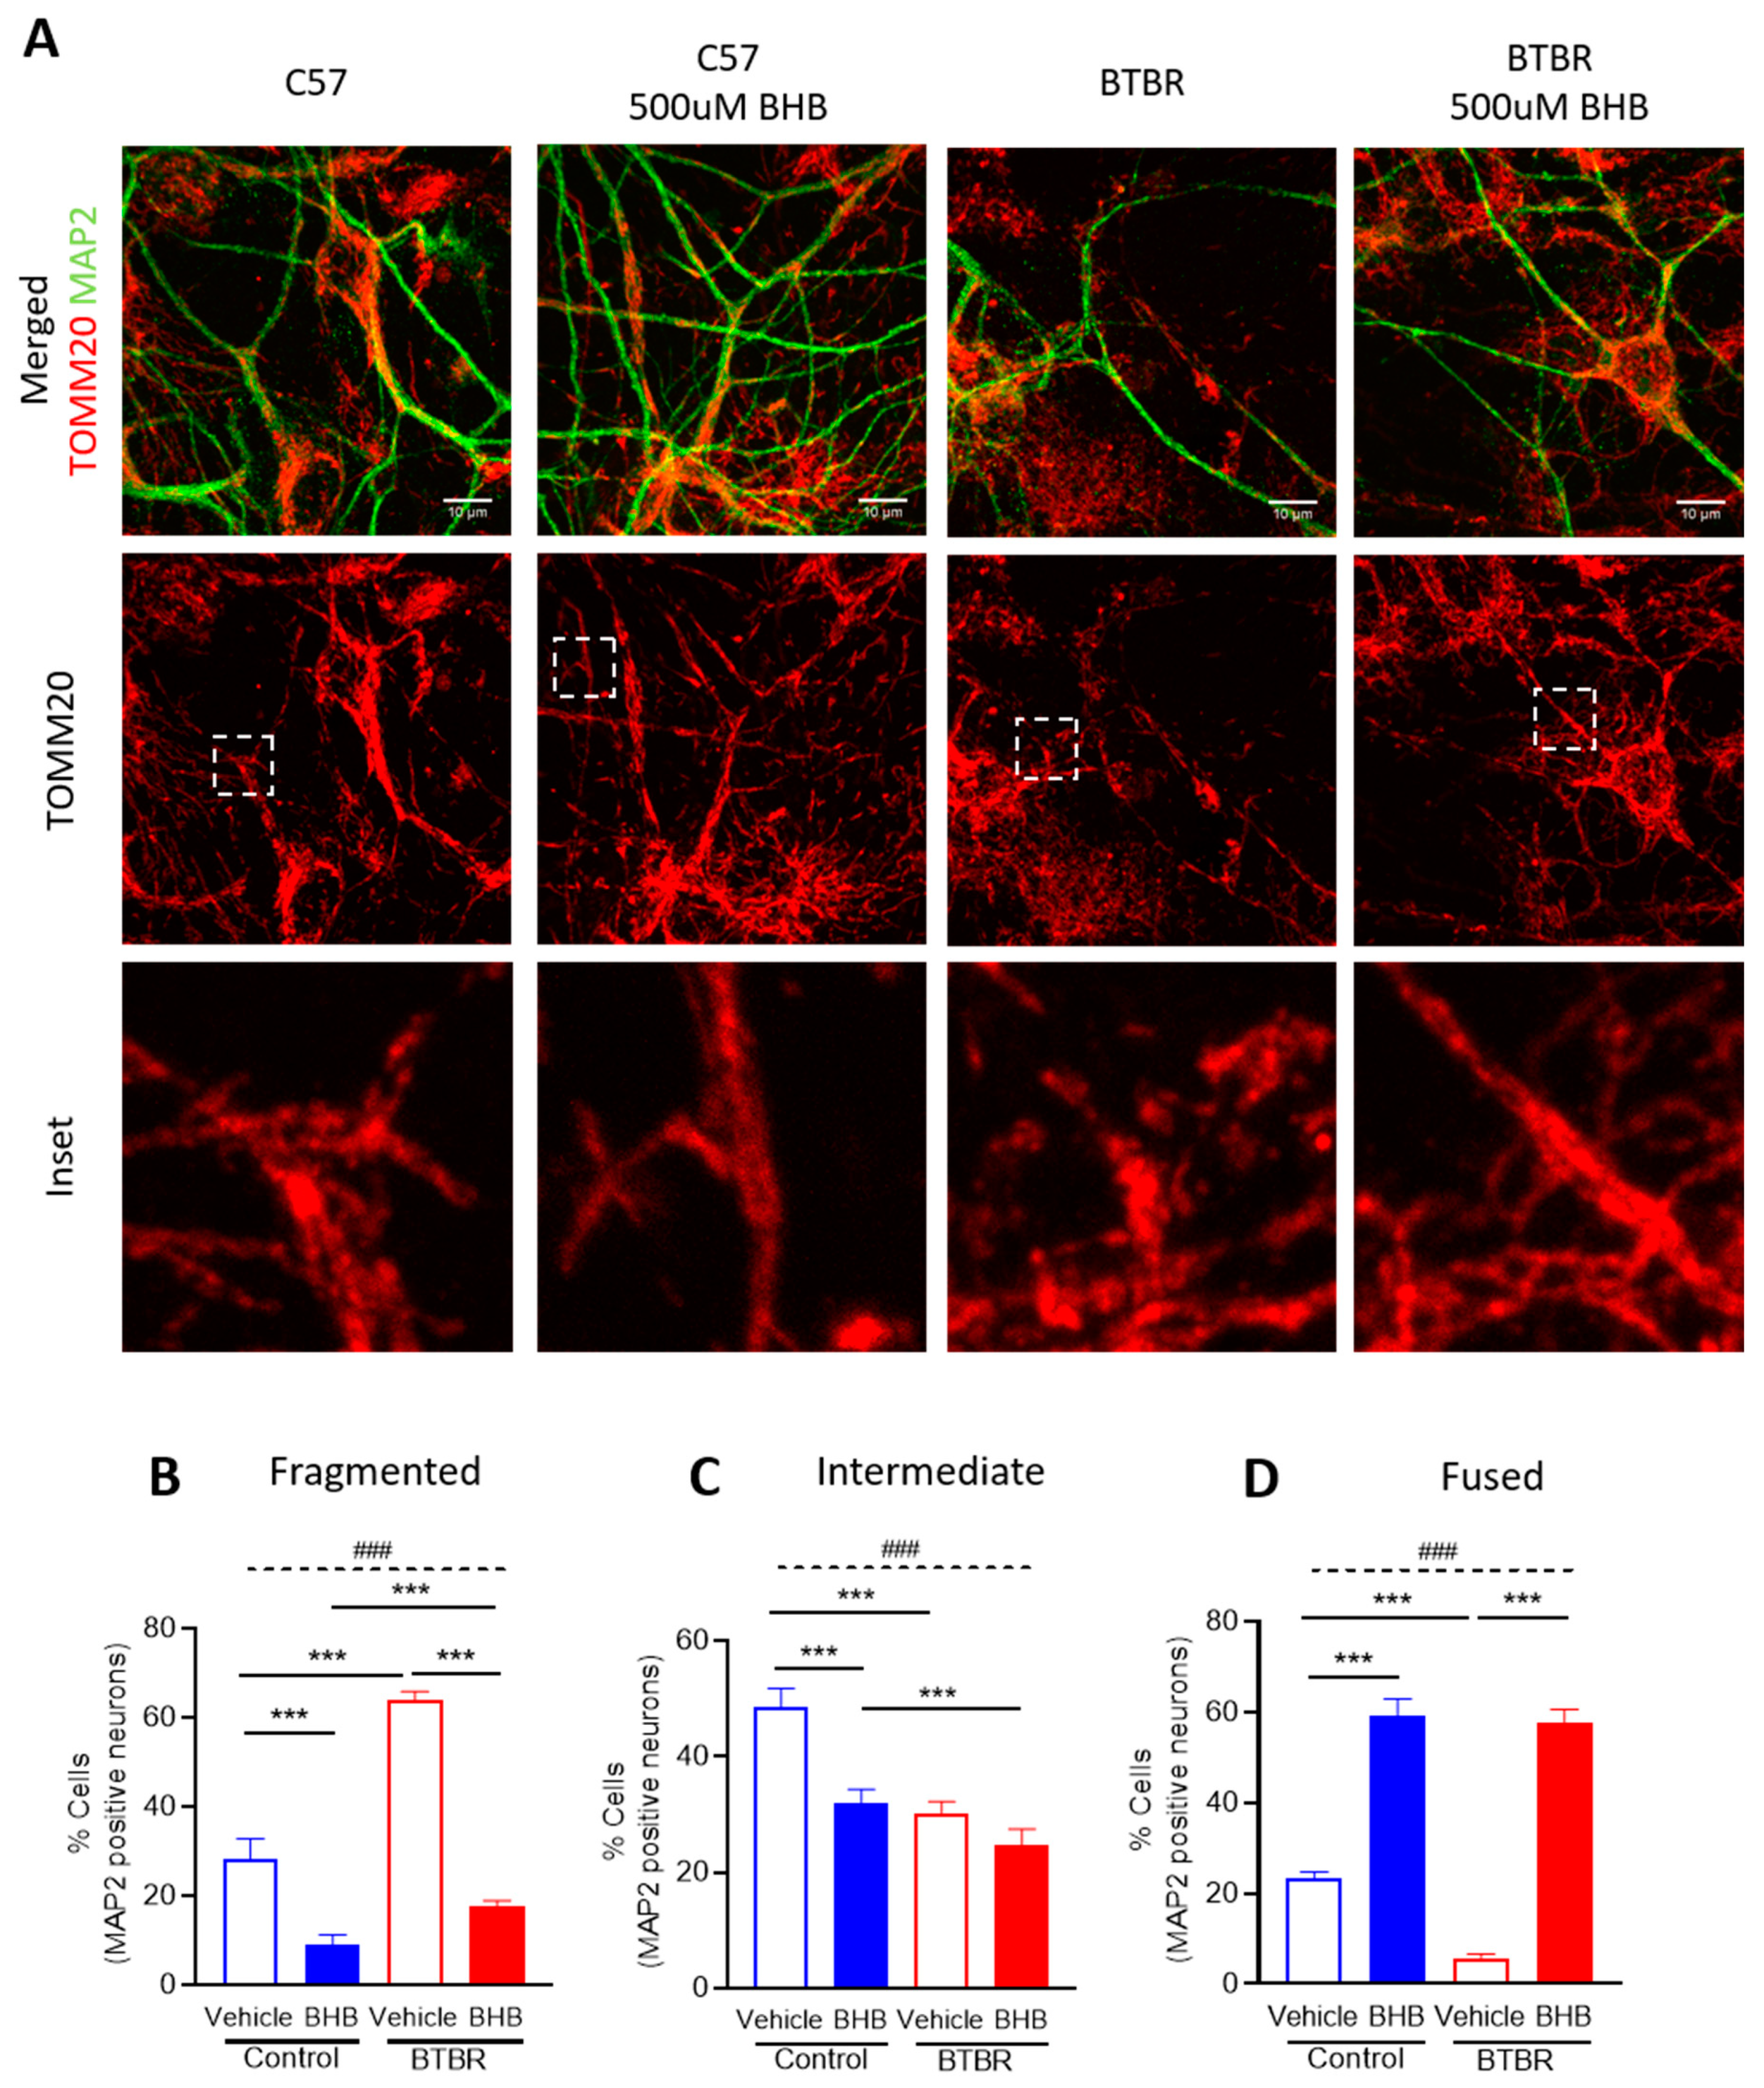
2.5. The KD Metabolite, β-hydroxybutyrate, Restores Mitochondrial Fragmentation Observed in Primary Neuronal Cells from BTBR Mice
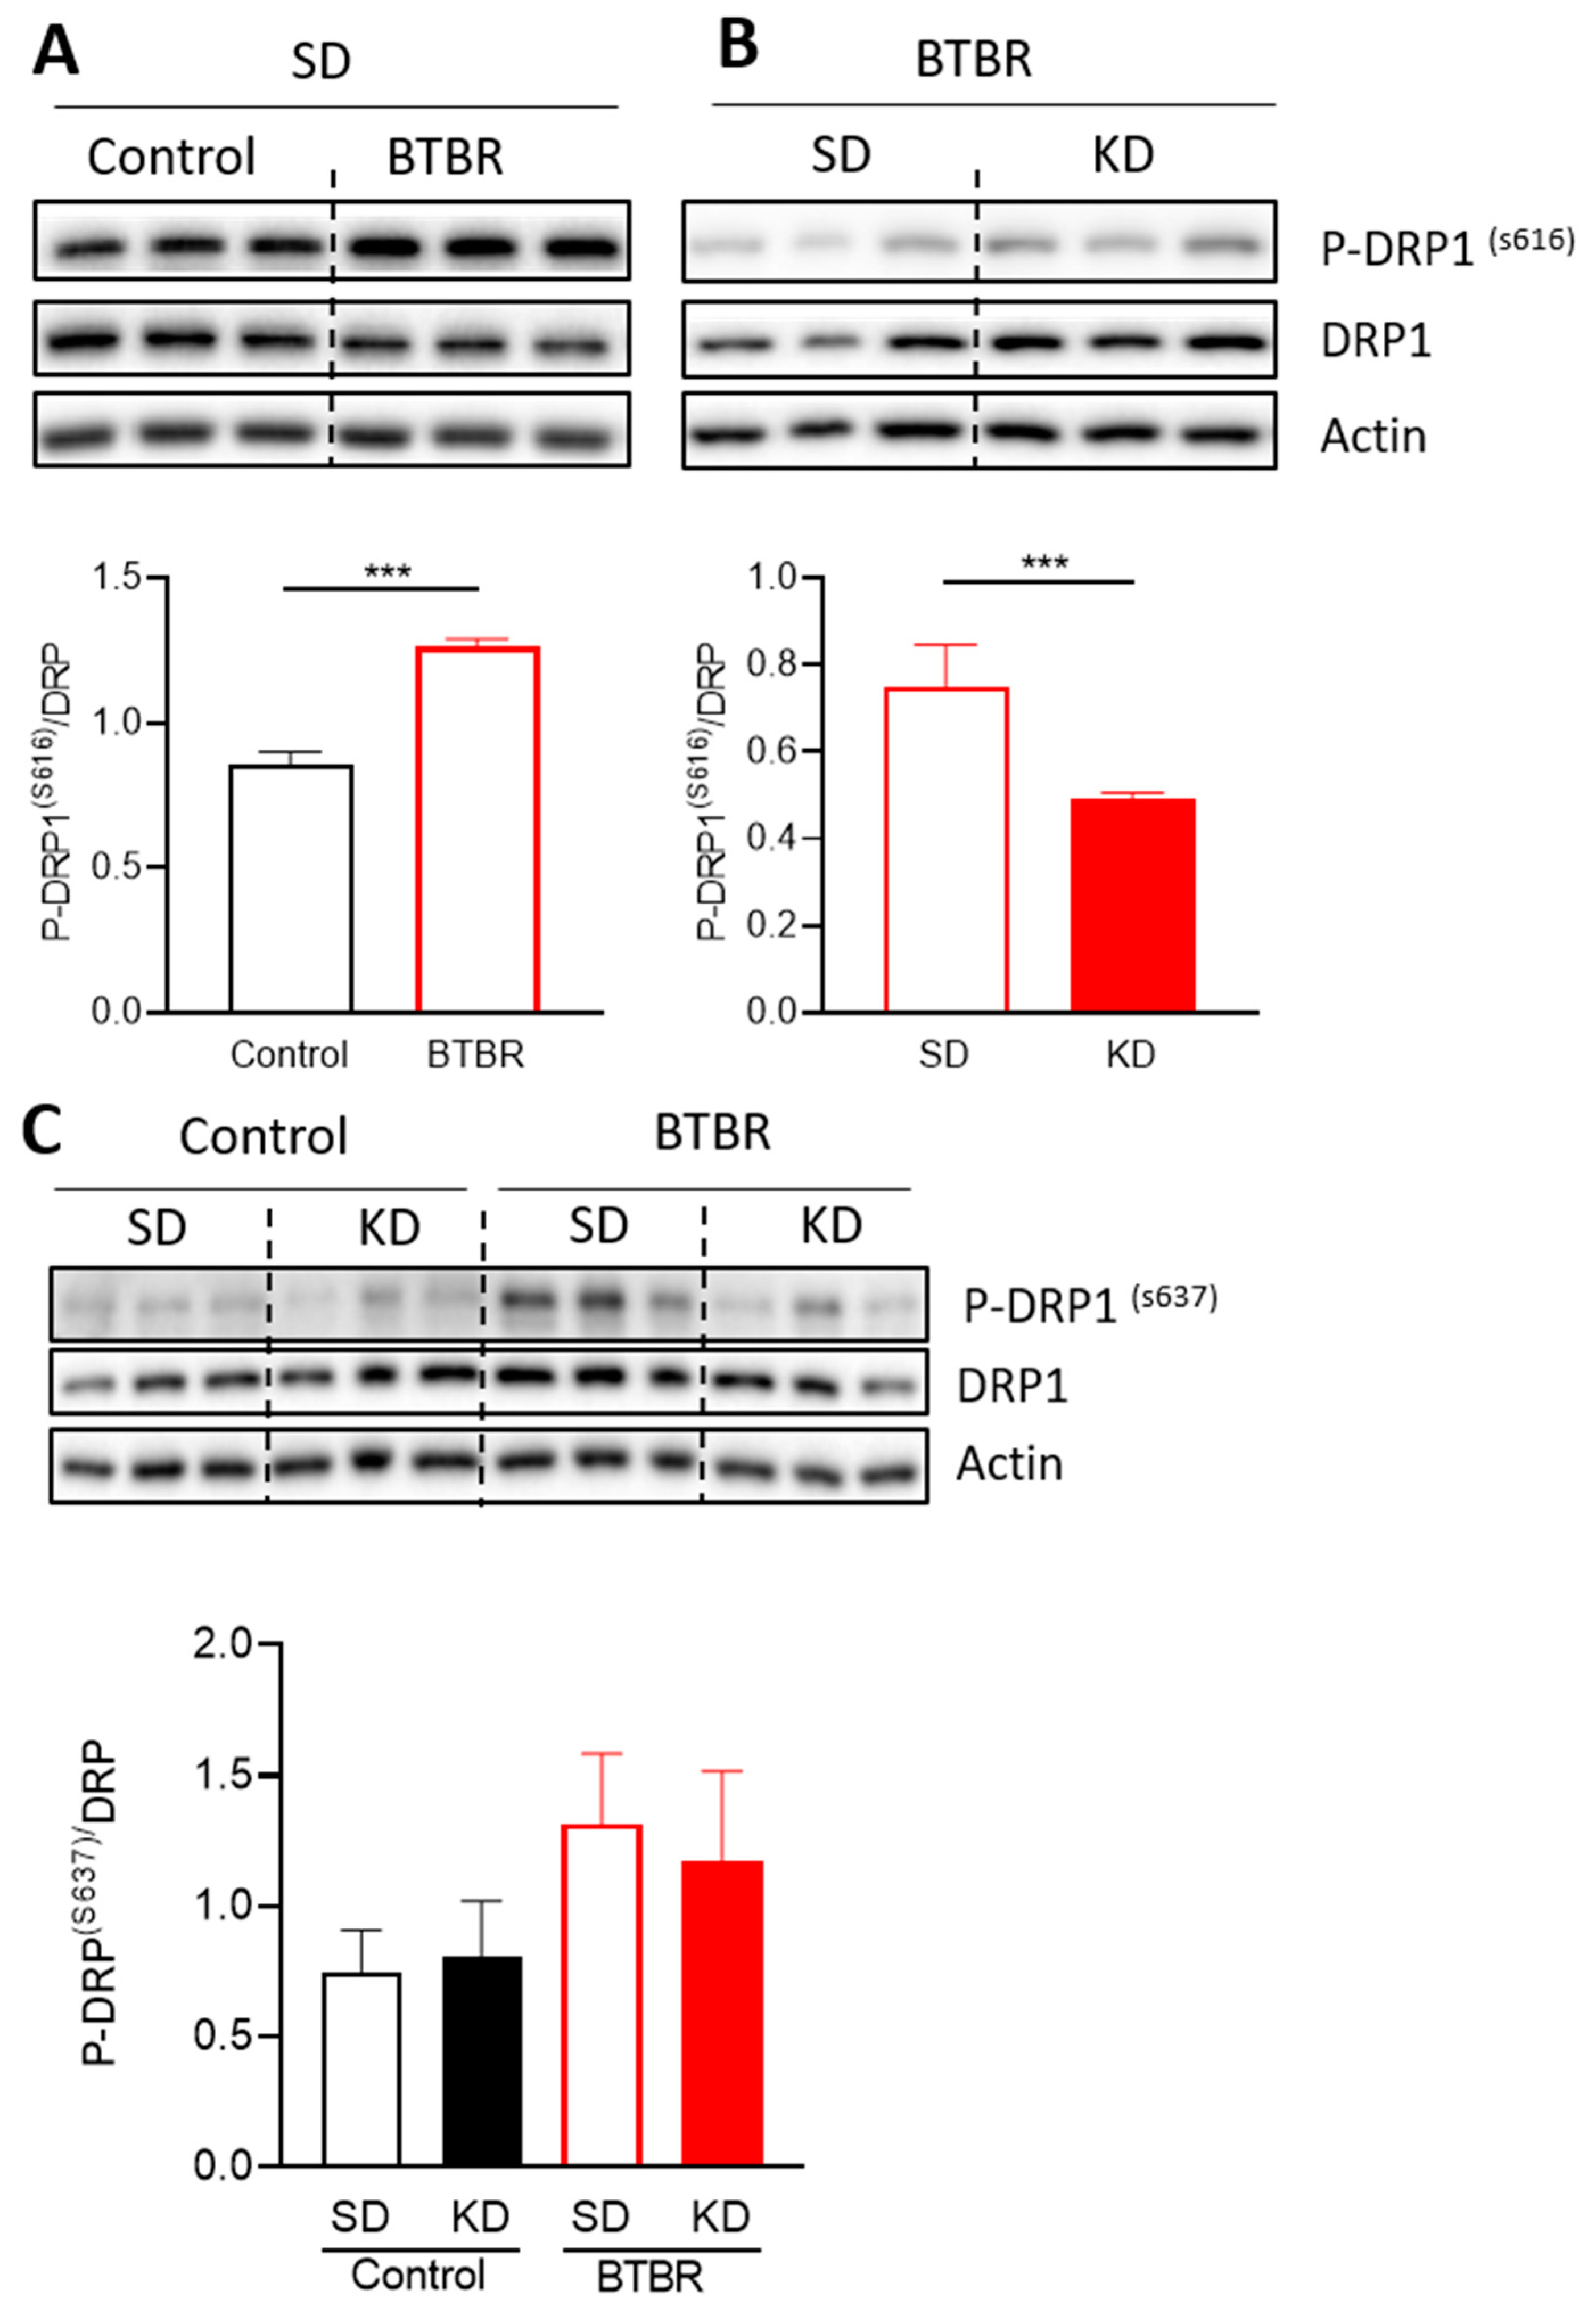
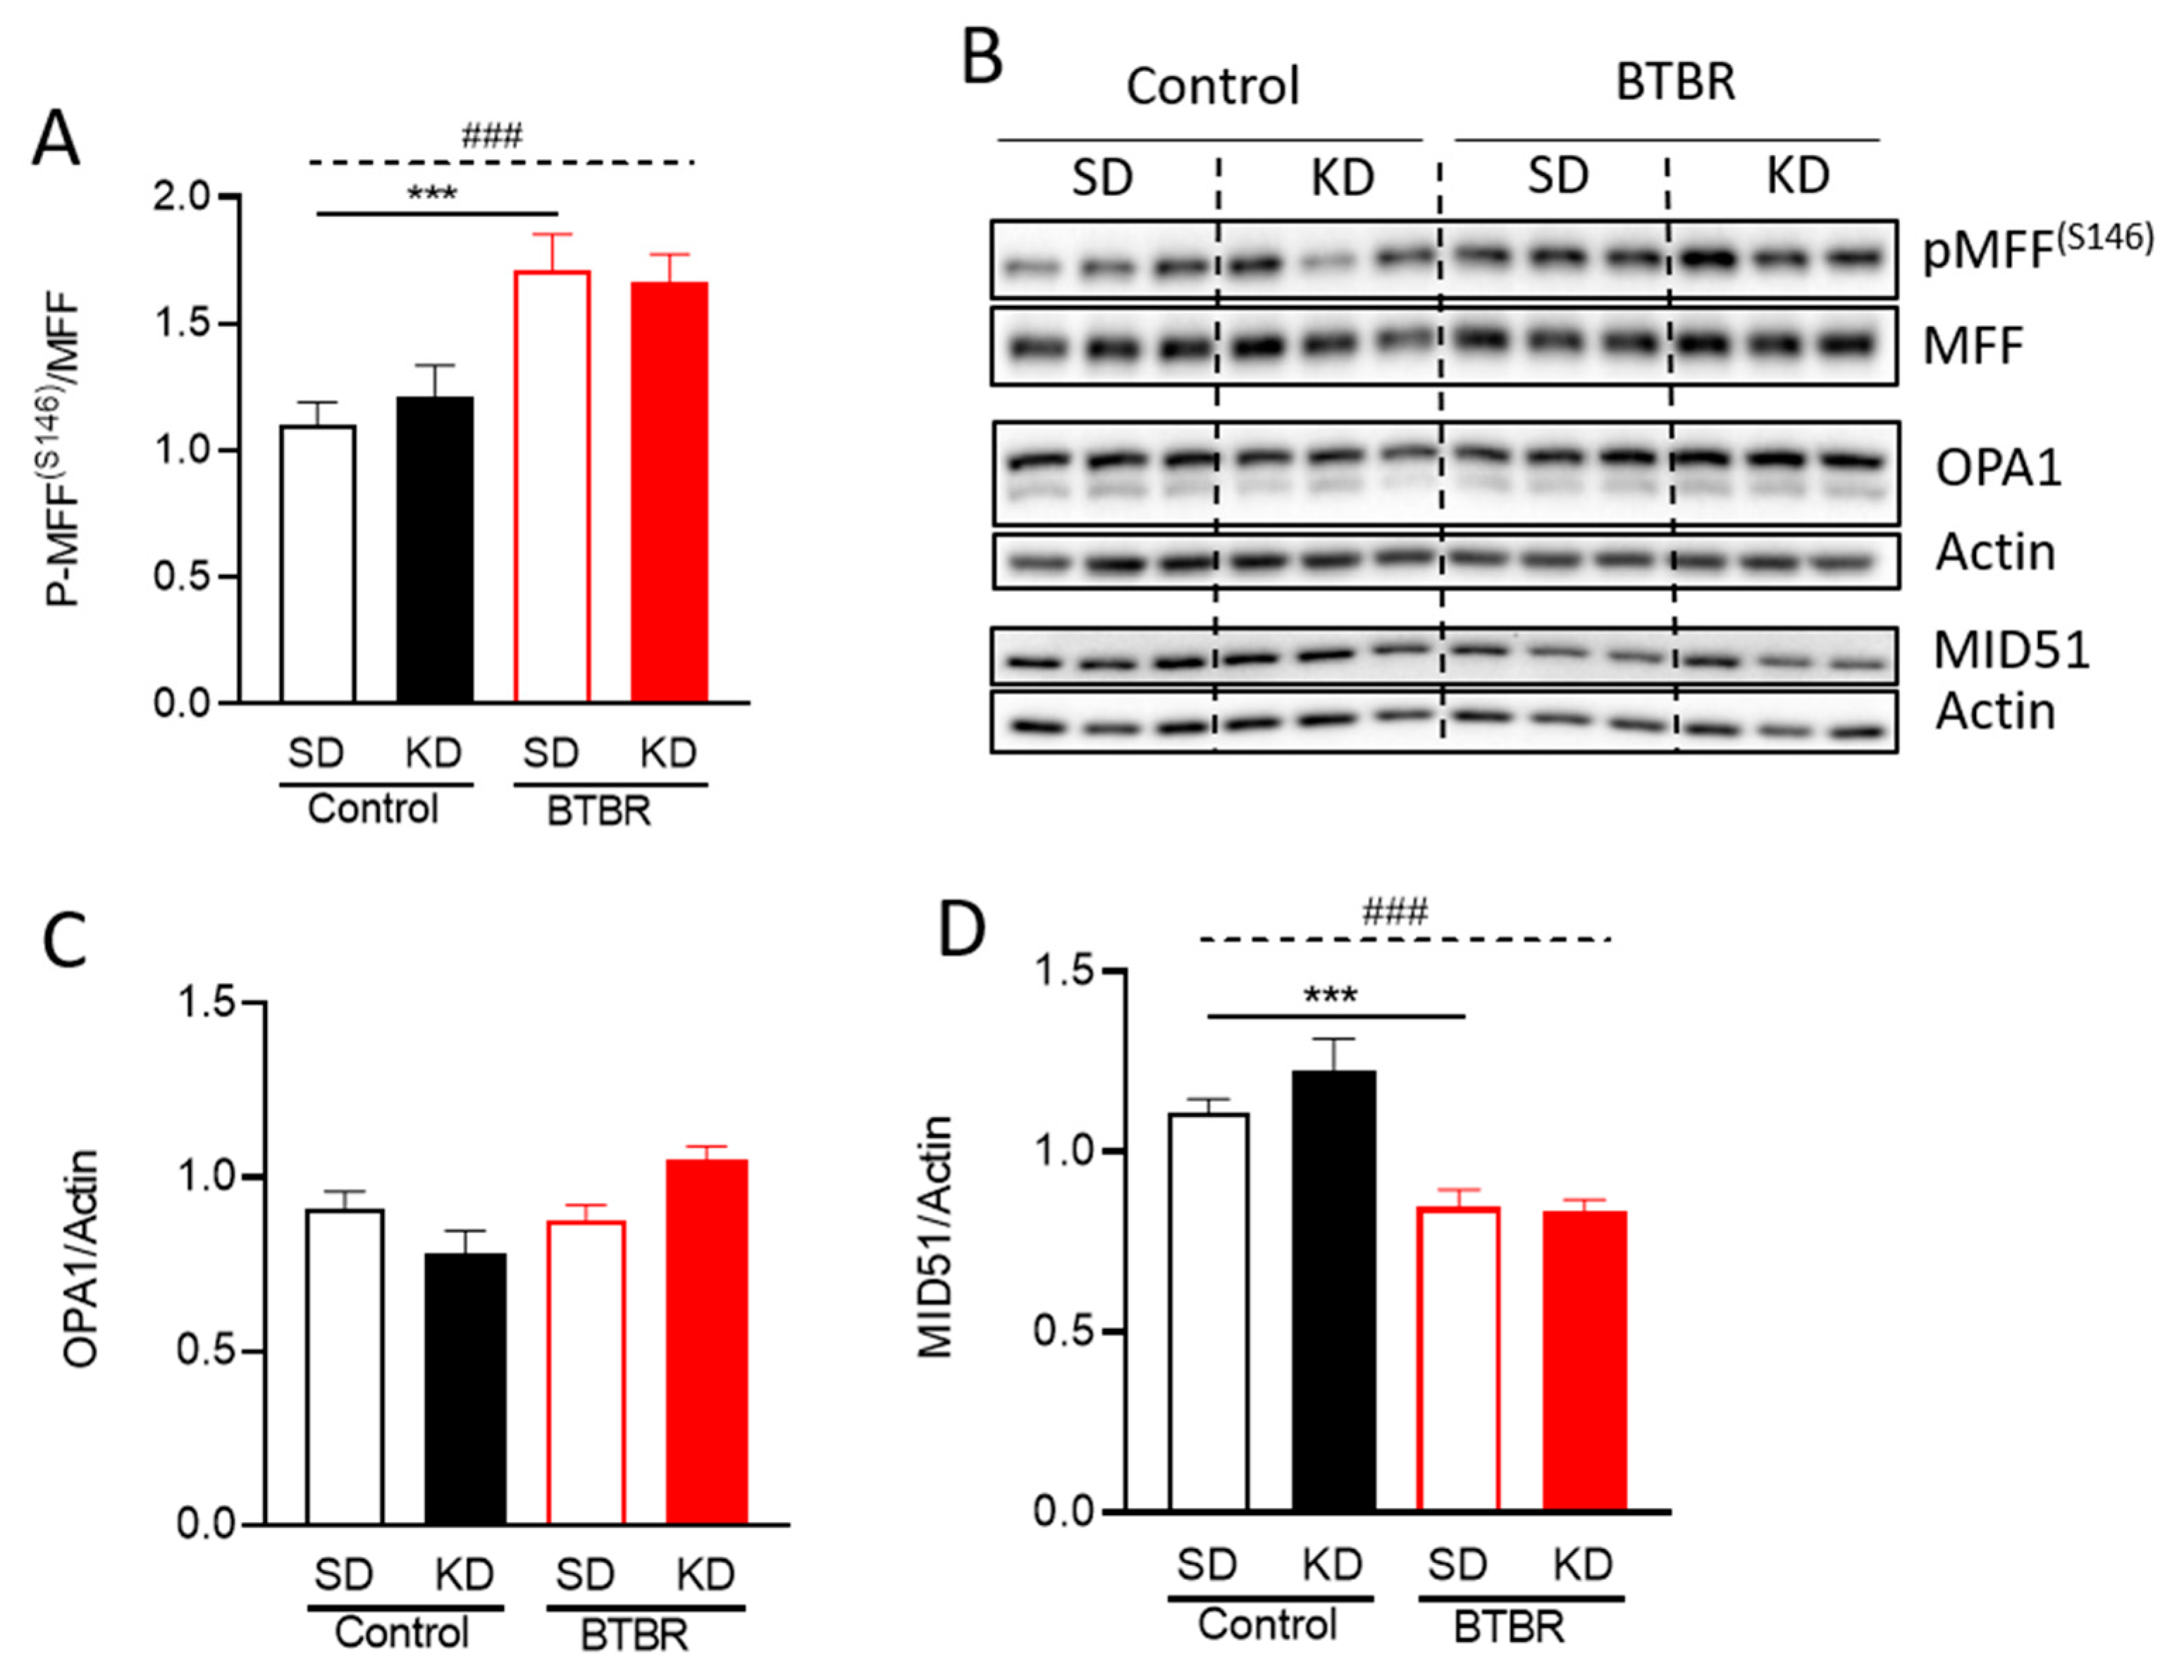
2.6. Changes in Mitochondrial Dynamics Proteins in BTBR Mouse Brains Fed the KD
3. Discussion
4. Materials and Methods
4.1. Animals and Dietary Procedure
4.2. Mitochondria Isolation and Protein Assay
4.3. Mitochondrial Bioenergetics Assay Using Seahorse XFe24
4.4. Assay for Mitochondrial Electron Transport Chain (ETC) Complex II Enzyme Activity
4.5. Primary Cortical Mixed Cell Culture
4.6. Immunofluorescence Staining
4.7. Microscopy and Mitochondrial Morphology Analysis
4.8. Mitochondrial Number and Size Determination Using Transmission Electron Microscopy (TEM)
4.9. Western Blots
4.10. Statistics
5. Conclusions
Supplementary Materials
Author Contributions
Funding
Acknowledgments
Conflicts of Interest
Abbreviations
| ASD | Autism Spectrum Disorder |
| β-HB | β-hydroxybutyrate |
| KD | Ketogenic Diet |
| OCR | Oxygen Consumption Rate |
| SD | Standard Diet |
References
- Mefford, H.C.; Batshaw, M.L.; Hoffman, E.P. Genomics, intellectual disability, and autism. N. Engl. J. Med. 2012, 366, 733–743. [Google Scholar] [CrossRef] [PubMed] [Green Version]
- Haas, R.H. Autism and mitochondrial disease. Dev. Disabil. Res. Rev. 2010, 16, 144–153. [Google Scholar] [CrossRef] [PubMed]
- Veenstra-VanderWeele, J.; Blakely, R.D. Networking in autism: Leveraging genetic, biomarker and model system findings in the search for new treatments. Neuropsychopharmacol. Off. Publ. Am. Coll. Neuropsychopharmacol. 2012, 37, 196–212. [Google Scholar] [CrossRef] [PubMed]
- Lord, C.; Brugha, T.S.; Charman, T.; Cusack, J.; Dumas, G.; Frazier, T.; Jones, E.J.; Jones, R.M.; Pickles, A.; State, M.W. Autism spectrum disorder. Nat. Rev. Dis. Primers 2020, 6, 1–23. [Google Scholar] [CrossRef] [PubMed]
- Zablotsky, B.; Black, L.I.; Maenner, M.J.; Schieve, L.A.; Danielson, M.L.; Bitsko, R.H.; Blumberg, S.J.; Kogan, M.D.; Boyle, C.A. Prevalence and Trends of Developmental Disabilities among Children in the United States: 2009–2017. Pediatrics 2019, 144, e20190811. [Google Scholar] [CrossRef] [PubMed]
- Chaste, P.; Leboyer, M. Autism risk factors: Genes, environment, and gene-environment interactions. Dialogues Clin. Neurosci. 2012, 14, 281–292. [Google Scholar]
- Canitano, R. Epilepsy in autism spectrum disorders. Eur. Child Adolesc. Psychiatry 2007, 16, 61–66. [Google Scholar] [CrossRef]
- Buie, T.; Campbell, D.B.; Fuchs, G.J., 3rd; Furuta, G.T.; Levy, J.; Vandewater, J.; Whitaker, A.H.; Atkins, D.; Bauman, M.L.; Beaudet, A.L.; et al. Evaluation, diagnosis, and treatment of gastrointestinal disorders in individuals with ASDs: A consensus report. Pediatrics 2010, 125 (Suppl. 1), S1–S18. [Google Scholar] [CrossRef] [Green Version]
- Legido, A.; Jethva, R.; Goldenthal, M.J. Mitochondrial dysfunction in autism. Semin. Pediatr. Neurol. 2013, 20, 163–175. [Google Scholar] [CrossRef]
- Oliveira, G.; Diogo, L.; Grazina, M.; Garcia, P.; Ataide, A.; Marques, C.; Miguel, T.; Borges, L.; Vicente, A.M.; Oliveira, C.R. Mitochondrial dysfunction in autism spectrum disorders: A population-based study. Dev. Med. Child Neurol. 2005, 47, 185–189. [Google Scholar] [CrossRef] [Green Version]
- Rossignol, D.A.; Frye, R.E. Mitochondrial dysfunction in autism spectrum disorders: A systematic review and meta-analysis. Mol. Psychiatry 2012, 17, 290–314. [Google Scholar] [CrossRef] [PubMed] [Green Version]
- Weissman, J.R.; Kelley, R.I.; Bauman, M.L.; Cohen, B.H.; Murray, K.F.; Mitchell, R.L.; Kern, R.L.; Natowicz, M.R. Mitochondrial disease in autism spectrum disorder patients: A cohort analysis. PLoS ONE 2008, 3, e3815. [Google Scholar] [CrossRef] [PubMed] [Green Version]
- Lombard, J. Autism: A mitochondrial disorder? Med. Hypotheses 1998, 50, 497–500. [Google Scholar] [CrossRef]
- Cheng, N.; Rho, J.M.; Masino, S.A. Metabolic Dysfunction Underlying Autism Spectrum Disorder and Potential Treatment Approaches. Front. Mol. Neurosci. 2017, 10, 34. [Google Scholar] [CrossRef] [Green Version]
- Griffiths, K.K.; Levy, R.J. Evidence of Mitochondrial Dysfunction in Autism: Biochemical Links, Genetic-Based Associations, and Non-Energy-Related Mechanisms. Oxid. Med. Cell Longev. 2017, 2017, 4314025. [Google Scholar] [CrossRef]
- Rose, S.; Niyazov, D.M.; Rossignol, D.A.; Goldenthal, M.; Kahler, S.G.; Frye, R.E. Clinical and Molecular Characteristics of Mitochondrial Dysfunction in Autism Spectrum Disorder. Mol. Diagn. 2018, 22, 571–593. [Google Scholar] [CrossRef] [Green Version]
- Chalkia, D.; Singh, L.N.; Leipzig, J.; Lvova, M.; Derbeneva, O.; Lakatos, A.; Hadley, D.; Hakonarson, H.; Wallace, D.C. Association Between Mitochondrial DNA Haplogroup Variation and Autism Spectrum Disorders. JAMA Psychiatry 2017. [Google Scholar] [CrossRef]
- Gu, F.; Chauhan, V.; Kaur, K.; Brown, W.T.; LaFauci, G.; Wegiel, J.; Chauhan, A. Alterations in mitochondrial DNA copy number and the activities of electron transport chain complexes and pyruvate dehydrogenase in the frontal cortex from subjects with autism. Transl. Psychiatry 2013, 3, e299. [Google Scholar] [CrossRef] [Green Version]
- Garrecht, M.; Austin, D.W. The plausibility of a role for mercury in the etiology of autism: A cellular perspective. Toxicol. Env. Chem. 2011, 93, 1251–1273. [Google Scholar] [CrossRef] [Green Version]
- Rose, S.; Wynne, R.; Frye, R.E.; Melnyk, S.; James, S.J. Increased susceptibility to ethylmercury-induced mitochondrial dysfunction in a subset of autism lymphoblastoid cell lines. J. Toxicol. 2015, 2015, 573701. [Google Scholar] [CrossRef]
- Wai, T.; Langer, T. Mitochondrial Dynamics and Metabolic Regulation. Trends Endocrinol. Metab. 2016, 27, 105–117. [Google Scholar] [CrossRef] [PubMed]
- Tang, G.; Gutierrez Rios, P.; Kuo, S.H.; Akman, H.O.; Rosoklija, G.; Tanji, K.; Dwork, A.; Schon, E.A.; Dimauro, S.; Goldman, J.; et al. Mitochondrial abnormalities in temporal lobe of autistic brain. Neurobiol. Dis. 2013, 54, 349–361. [Google Scholar] [CrossRef] [PubMed]
- McFarlane, H.G.; Kusek, G.K.; Yang, M.; Phoenix, J.L.; Bolivar, V.J.; Crawley, J.N. Autism-like behavioral phenotypes in BTBR T+tf/J mice. Genes Brain Behav. 2008, 7, 152–163. [Google Scholar] [CrossRef]
- Moy, S.S.; Nadler, J.J.; Young, N.B.; Perez, A.; Holloway, L.P.; Barbaro, R.P.; Barbaro, J.R.; Wilson, L.M.; Threadgill, D.W.; Lauder, J.M.; et al. Mouse behavioral tasks relevant to autism: Phenotypes of 10 inbred strains. Behav. Brain Res. 2007, 176, 4–20. [Google Scholar] [CrossRef] [Green Version]
- Ellegood, J.; Crawley, J.N. Behavioral and Neuroanatomical Phenotypes in Mouse Models of Autism. Neurotherapeutics 2015, 12, 521–533. [Google Scholar] [CrossRef]
- Ellis, H.T.; Tordoff, M.G.; Parker, M.R. Itpr3 Is responsible for the mouse tufted (tf) locus. J. Hered. 2013, 104, 295–297. [Google Scholar] [CrossRef] [Green Version]
- Bartok, A.; Weaver, D.; Golenar, T.; Nichtova, Z.; Katona, M.; Bansaghi, S.; Alzayady, K.J.; Thomas, V.K.; Ando, H.; Mikoshiba, K.; et al. IP3 receptor isoforms differently regulate ER-mitochondrial contacts and local calcium transfer. Nat. Commun. 2019, 10, 3726. [Google Scholar] [CrossRef] [Green Version]
- Rho, J.M.; Stafstrom, C.E. The ketogenic diet: What has science taught us? Epilepsy Res. 2012, 100, 210–217. [Google Scholar] [CrossRef]
- Neal, E.G.; Chaffe, H.; Schwartz, R.H.; Lawson, M.S.; Edwards, N.; Fitzsimmons, G.; Whitney, A.; Cross, J.H. The ketogenic diet for the treatment of childhood epilepsy: A randomised controlled trial. Lancet Neurol. 2008, 7, 500–506. [Google Scholar] [CrossRef]
- Napoli, E.; Duenas, N.; Giulivi, C. Potential therapeutic use of the ketogenic diet in autism spectrum disorders. Front. Pediatr. 2014, 2, 69. [Google Scholar] [CrossRef] [Green Version]
- Gogou, M.; Kolios, G. Are therapeutic diets an emerging additional choice in autism spectrum disorder management? World J. Pediatr. 2018, 14, 215–223. [Google Scholar] [CrossRef] [PubMed]
- Herbert, M.R.; Buckley, J.A. Autism and dietary therapy: Case report and review of the literature. J. Child Neurol. 2013, 28, 975–982. [Google Scholar] [CrossRef] [PubMed]
- Zarnowska, I.; Chrapko, B.; Gwizda, G.; Nocun, A.; Mitosek-Szewczyk, K.; Gasior, M. Therapeutic use of carbohydrate-restricted diets in an autistic child; a case report of clinical and 18FDG PET findings. Metab. Brain Dis. 2018, 33, 1187–1192. [Google Scholar] [CrossRef] [PubMed] [Green Version]
- El-Rashidy, O.; El-Baz, F.; El-Gendy, Y.; Khalaf, R.; Reda, D.; Saad, K. Ketogenic diet versus gluten free casein free diet in autistic children: A case-control study. Metab. Brain Dis. 2017. [Google Scholar] [CrossRef] [PubMed]
- Evangeliou, A.; Vlachonikolis, I.; Mihailidou, H.; Spilioti, M.; Skarpalezou, A.; Makaronas, N.; Prokopiou, A.; Christodoulou, P.; Liapi-Adamidou, G.; Helidonis, E.; et al. Application of a ketogenic diet in children with autistic behavior: Pilot study. J. Child Neurol. 2003, 18, 113–118. [Google Scholar] [CrossRef] [PubMed]
- Lee, R.W.Y.; Corley, M.J.; Pang, A.; Arakaki, G.; Abbott, L.; Nishimoto, M.; Miyamoto, R.; Lee, E.; Yamamoto, S.; Maunakea, A.K.; et al. A modified ketogenic gluten-free diet with MCT improves behavior in children with autism spectrum disorder. Physiol. Behav. 2018, 188, 205–211. [Google Scholar] [CrossRef] [PubMed] [Green Version]
- Spilioti, M.; Evangeliou, A.E.; Tramma, D.; Theodoridou, Z.; Metaxas, S.; Michailidi, E.; Bonti, E.; Frysira, H.; Haidopoulou, A.; Asprangathou, D.; et al. Evidence for treatable inborn errors of metabolism in a cohort of 187 Greek patients with autism spectrum disorder (ASD). Front. Hum. Neurosci. 2013, 7, 858. [Google Scholar] [CrossRef] [Green Version]
- Ahn, Y.; Narous, M.; Tobias, R.; Rho, J.M.; Mychasiuk, R. The ketogenic diet modifies social and metabolic alterations identified in the prenatal valproic acid model of autism spectrum disorder. Dev. Neurosci. 2014, 36, 371–380. [Google Scholar] [CrossRef]
- Castro, K.; Baronio, D.; Perry, I.S.; Riesgo, R.D.S.; Gottfried, C. The effect of ketogenic diet in an animal model of autism induced by prenatal exposure to valproic acid. Nutr. Neurosci. 2017, 20, 343–350. [Google Scholar] [CrossRef]
- Ruskin, D.N.; Fortin, J.A.; Bisnauth, S.N.; Masino, S.A. Ketogenic diets improve behaviors associated with autism spectrum disorder in a sex-specific manner in the EL mouse. Physiol. Behav. 2017, 168, 138–145. [Google Scholar] [CrossRef] [Green Version]
- Ruskin, D.N.; Murphy, M.I.; Slade, S.L.; Masino, S.A. Ketogenic diet improves behaviors in a maternal immune activation model of autism spectrum disorder. PLoS ONE 2017, 12, e0171643. [Google Scholar] [CrossRef] [PubMed] [Green Version]
- Verpeut, J.L.; DiCicco-Bloom, E.; Bello, N.T. Ketogenic diet exposure during the juvenile period increases social behaviors and forebrain neural activation in adult Engrailed 2 null mice. Physiol. Behav. 2016, 161, 90–98. [Google Scholar] [CrossRef] [PubMed] [Green Version]
- Ruskin, D.N.; Svedova, J.; Cote, J.L.; Sandau, U.; Rho, J.M.; Kawamura, M., Jr.; Boison, D.; Masino, S.A. Ketogenic diet improves core symptoms of autism in BTBR mice. PLoS ONE 2013, 8, e65021. [Google Scholar] [CrossRef] [Green Version]
- Masino, S.A.; Rho, J.M. Mechanisms of Ketogenic Diet Action. In Jasper’s Basic Mechanisms of the Epilepsies, 4th ed.; Noebels, J.L., Avoli, M., Rogawski, M.A., Olsen, R.W., Delgado-Escueta, A.V., Eds.; Bethesda: Rockville, MD, USA, 2012. [Google Scholar]
- Newell, C.; Shutt, T.E.; Ahn, Y.; Hittel, D.S.; Khan, A.; Rho, J.M.; Shearer, J. Tissue Specific Impacts of a Ketogenic Diet on Mitochondrial Dynamics in the BTBR(T+tf/j) Mouse. Front. Physiol. 2016, 7, 654. [Google Scholar] [CrossRef] [Green Version]
- Moscatelli, F.; Valenzano, A.; Polito, R.; Francesco, S.; Montana, A.; Salerno, M.; Messina, A.; Monda, M.; Cibelli, G.; Monda, V. Ketogenic diet and sport performance. Sport Mont. 2020, 18, 91–94. [Google Scholar]
- Towler, M.C.; Hardie, D.G. AMP-activated protein kinase in metabolic control and insulin signaling. Circ. Res. 2007, 100, 328–341. [Google Scholar] [CrossRef]
- Laffel, L. Ketone bodies: A review of physiology, pathophysiology and application of monitoring to diabetes. Diabetes/Metab. Res. Rev. 1999, 15, 412–426. [Google Scholar] [CrossRef]
- Stojanovic, V.; Ihle, S. Role of beta-hydroxybutyric acid in diabetic ketoacidosis: A review. Can. Vet. J. 2011, 52, 426. [Google Scholar]
- Kashatus, D.F.; Lim, K.H.; Brady, D.C.; Pershing, N.L.; Cox, A.D.; Counter, C.M. RALA and RALBP1 regulate mitochondrial fission at mitosis. Nat. Cell Biol. 2011, 13, 1108–1115. [Google Scholar] [CrossRef] [Green Version]
- Ko, A.R.; Hyun, H.W.; Min, S.J.; Kim, J.E. The Differential DRP1 Phosphorylation and Mitochondrial Dynamics in the Regional Specific Astroglial Death Induced by Status Epilepticus. Front. Cell. Neurosci. 2016, 10, 124. [Google Scholar] [CrossRef] [Green Version]
- Kraus, F.; Ryan, M.T. The constriction and scission machineries involved in mitochondrial fission. J. Cell Sci. 2017. [Google Scholar] [CrossRef] [PubMed] [Green Version]
- Ducommun, S.; Deak, M.; Sumpton, D.; Ford, R.J.; Nunez Galindo, A.; Kussmann, M.; Viollet, B.; Steinberg, G.R.; Foretz, M.; Dayon, L.; et al. Motif affinity and mass spectrometry proteomic approach for the discovery of cellular AMPK targets: Identification of mitochondrial fission factor as a new AMPK substrate. Cell. Signal. 2015, 27, 978–988. [Google Scholar] [CrossRef] [PubMed] [Green Version]
- Wang, C.; Youle, R. Cell biology: Form follows function for mitochondria. Nature 2016, 530, 288–289. [Google Scholar] [CrossRef] [PubMed]
- Toyama, E.Q.; Herzig, S.; Courchet, J.; Lewis, T.L., Jr.; Loson, O.C.; Hellberg, K.; Young, N.P.; Chen, H.; Polleux, F.; Chan, D.C.; et al. Metabolism. AMP-activated protein kinase mediates mitochondrial fission in response to energy stress. Science 2016, 351, 275–281. [Google Scholar] [CrossRef] [Green Version]
- Frye, R.E.; Rossignol, D.A. Mitochondrial dysfunction can connect the diverse medical symptoms associated with autism spectrum disorders. Pediatr. Res. 2011, 69, 41R–47R. [Google Scholar] [CrossRef]
- Giulivi, C.; Zhang, Y.F.; Omanska-Klusek, A.; Ross-Inta, C.; Wong, S.; Hertz-Picciotto, I.; Tassone, F.; Pessah, I.N. Mitochondrial dysfunction in autism. JAMA 2010, 304, 2389–2396. [Google Scholar] [CrossRef] [Green Version]
- Gano, L.B.; Patel, M.; Rho, J.M. Ketogenic diets, mitochondria, and neurological diseases. J. Lipid Res. 2014, 55, 2211–2228. [Google Scholar] [CrossRef] [Green Version]
- Rose, S.; Frye, R.E.; Slattery, J.; Wynne, R.; Tippett, M.; Melnyk, S.; James, S.J. Oxidative stress induces mitochondrial dysfunction in a subset of autistic lymphoblastoid cell lines. Transl. Psychiatry 2014, 4, e377. [Google Scholar] [CrossRef] [Green Version]
- Paleologou, E.; Ismayilova, N.; Kinali, M. Use of the Ketogenic Diet to Treat Intractable Epilepsy in Mitochondrial Disorders. J. Clin. Med. 2017, 6, 56. [Google Scholar] [CrossRef]
- Adams, J.B.; Audhya, T.; McDonough-Means, S.; Rubin, R.A.; Quig, D.; Geis, E.; Gehn, E.; Loresto, M.; Mitchell, J.; Atwood, S.; et al. Nutritional and metabolic status of children with autism vs. neurotypical children, and the association with autism severity. Nutr. Metab. (Lond.) 2011, 8, 34. [Google Scholar] [CrossRef] [Green Version]
- Sullivan, P.G.; Rippy, N.A.; Dorenbos, K.; Concepcion, R.C.; Agarwal, A.K.; Rho, J.M. The ketogenic diet increases mitochondrial uncoupling protein levels and activity. Ann. Neurol. 2004, 55, 576–580. [Google Scholar] [CrossRef] [PubMed]
- Nylen, K.; Velazquez, J.L.; Sayed, V.; Gibson, K.M.; Burnham, W.M.; Snead, O.C., 3rd. The effects of a ketogenic diet on ATP concentrations and the number of hippocampal mitochondria in Aldh5a1(-/-) mice. Biochim. Et Biophys. Acta 2009, 1790, 208–212. [Google Scholar] [CrossRef] [PubMed] [Green Version]
- Whitaker, R.M.; Corum, D.; Beeson, C.C.; Schnellmann, R.G. Mitochondrial Biogenesis as a Pharmacological Target: A New Approach to Acute and Chronic Diseases. Annu. Rev. Pharm. Toxicol. 2016, 56, 229–249. [Google Scholar] [CrossRef]
- Atkins, K.; Dasgupta, A.; Chen, K.H.; Mewburn, J.; Archer, S.L. The role of Drp1 adaptor proteins MiD49 and MiD51 in mitochondrial fission: Implications for human disease. Clin. Sci. 2016, 130, 1861–1874. [Google Scholar] [CrossRef] [Green Version]
- Dabrowska, A.; Venero, J.L.; Iwasawa, R.; Hankir, M.K.; Rahman, S.; Boobis, A.; Hajji, N. PGC-1alpha controls mitochondrial biogenesis and dynamics in lead-induced neurotoxicity. Aging 2015, 7, 629–647. [Google Scholar] [CrossRef] [Green Version]
- Milder, J.B.; Liang, L.-P.; Patel, M. Acute oxidative stress and systemic Nrf2 activation by the ketogenic diet. Neurobiol. Dis. 2010, 40, 238–244. [Google Scholar] [CrossRef] [Green Version]
- Wang, B.-H.; Hou, Q.; Lu, Y.-Q.; Jia, M.-M.; Qiu, T.; Wang, X.-H.; Zhang, Z.-X.; Jiang, Y. Ketogenic diet attenuates neuronal injury via autophagy and mitochondrial pathways in pentylenetetrazol-kindled seizures. Brain Res. 2018, 1678, 106–115. [Google Scholar] [CrossRef]
- Carvalho, A.N.; Firuzi, O.; Gama, M.J.; Horssen, J.V.; Saso, L. Oxidative Stress and Antioxidants in Neurological Diseases: Is There Still Hope? Curr. Drug Targets 2017, 18, 705–718. [Google Scholar] [CrossRef]
- Corona, J.C.; Duchen, M.R. PPARgamma as a therapeutic target to rescue mitochondrial function in neurological disease. Free Radic. Biol. Med. 2016, 100, 153–163. [Google Scholar] [CrossRef] [Green Version]
- Barone, R.; Rizzo, R.; Tabbi, G.; Malaguarnera, M.; Frye, R.E.; Bastin, J. Nuclear Peroxisome Proliferator-Activated Receptors (PPARs) as Therapeutic Targets of Resveratrol for Autism Spectrum Disorder. Int. J. Mol. Sci. 2019, 20, 1878. [Google Scholar] [CrossRef] [Green Version]
- Kraeuter, A.K.; Guest, P.C.; Sarnyai, Z. The Therapeutic Potential of Ketogenic Diet Throughout Life: Focus on Metabolic, Neurodevelopmental and Neurodegenerative Disorders. Adv. Exp. Med. Biol. 2019, 1178, 77–101. [Google Scholar] [CrossRef] [PubMed]
- Mychasiuk, R.; Rho, J.M. Genetic modifications associated with ketogenic diet treatment in the BTBRT+Tf/J mouse model of autism spectrum disorder. Autism Res. 2017, 10, 456–471. [Google Scholar] [CrossRef] [PubMed]
- Fenoglio-Simeone, K.A.; Wilke, J.C.; Milligan, H.L.; Allen, C.N.; Rho, J.M.; Maganti, R.K. Ketogenic diet treatment abolishes seizure periodicity and improves diurnal rhythmicity in epileptic Kcna1-null mice. Epilepsia 2009, 50, 2027–2034. [Google Scholar] [CrossRef] [PubMed] [Green Version]
- Van der Auwera, I.; Wera, S.; Van Leuven, F.; Henderson, S.T. A ketogenic diet reduces amyloid beta 40 and 42 in a mouse model of Alzheimer’s disease. Nutr. Metab. (Lond.) 2005, 2, 28. [Google Scholar] [CrossRef] [Green Version]
- Do Kim, Y.; Davis, L.M.; Sullivan, P.G.; Maalouf, M.; Simeone, T.A.; van Brederode, J.; Rho, J.M. Ketone bodies are protective against oxidative stress in neocortical neurons. J. Neurochem. 2007, 101, 1316–1326. [Google Scholar] [CrossRef]
- Sullivan, P.G.; Dube, C.; Dorenbos, K.; Steward, O.; Baram, T.Z. Mitochondrial uncoupling protein-2 protects the immature brain from excitotoxic neuronal death. Ann. Neurol. 2003, 53, 711–717. [Google Scholar] [CrossRef] [Green Version]
- Pandya, J.D.; Pauly, J.R.; Sullivan, P.G. The optimal dosage and window of opportunity to maintain mitochondrial homeostasis following traumatic brain injury using the uncoupler FCCP. Exp. Neurol. 2009, 218, 381–389. [Google Scholar] [CrossRef]
- Vogel, K.R.; Ainslie, G.R.; Jansen, E.E.; Salomons, G.S.; Gibson, K.M. Torin 1 partially corrects vigabatrin-induced mitochondrial increase in mouse. Ann. Clin. Transl. Neurol. 2015, 2, 699–706. [Google Scholar] [CrossRef]
- Kossoff, E.H.; Zupec-Kania, B.A.; Amark, P.E.; Ballaban-Gil, K.R.; Christina Bergqvist, A.G.; Blackford, R.; Buchhalter, J.R.; Caraballo, R.H.; Helen Cross, J.; Dahlin, M.G.; et al. Optimal clinical management of children receiving the ketogenic diet: Recommendations of the International Ketogenic Diet Study Group. Epilepsia 2009, 50, 304–317. [Google Scholar] [CrossRef]
- Kovacs, Z.; D’Agostino, D.P.; Dobolyi, A.; Ari, C. Adenosine A1 Receptor Antagonism Abolished the Anti-seizure Effects of Exogenous Ketone Supplementation in Wistar Albino Glaxo Rijswijk Rats. Front. Mol. Neurosci. 2017, 10, 235. [Google Scholar] [CrossRef] [Green Version]


© 2020 by the authors. Licensee MDPI, Basel, Switzerland. This article is an open access article distributed under the terms and conditions of the Creative Commons Attribution (CC BY) license (http://creativecommons.org/licenses/by/4.0/).
Share and Cite
Ahn, Y.; Sabouny, R.; Villa, B.R.; Yee, N.C.; Mychasiuk, R.; Uddin, G.M.; Rho, J.M.; Shutt, T.E. Aberrant Mitochondrial Morphology and Function in the BTBR Mouse Model of Autism Is Improved by Two Weeks of Ketogenic Diet. Int. J. Mol. Sci. 2020, 21, 3266. https://0-doi-org.brum.beds.ac.uk/10.3390/ijms21093266
Ahn Y, Sabouny R, Villa BR, Yee NC, Mychasiuk R, Uddin GM, Rho JM, Shutt TE. Aberrant Mitochondrial Morphology and Function in the BTBR Mouse Model of Autism Is Improved by Two Weeks of Ketogenic Diet. International Journal of Molecular Sciences. 2020; 21(9):3266. https://0-doi-org.brum.beds.ac.uk/10.3390/ijms21093266
Chicago/Turabian StyleAhn, Younghee, Rasha Sabouny, Bianca R. Villa, Nellie C. Yee, Richelle Mychasiuk, Golam M. Uddin, Jong M. Rho, and Timothy E. Shutt. 2020. "Aberrant Mitochondrial Morphology and Function in the BTBR Mouse Model of Autism Is Improved by Two Weeks of Ketogenic Diet" International Journal of Molecular Sciences 21, no. 9: 3266. https://0-doi-org.brum.beds.ac.uk/10.3390/ijms21093266