Body Composition Findings by Computed Tomography in SARS-CoV-2 Patients: Increased Risk of Muscle Wasting in Obesity

 ,
,  ,
,
Abstract
:1. Introduction
2. Results
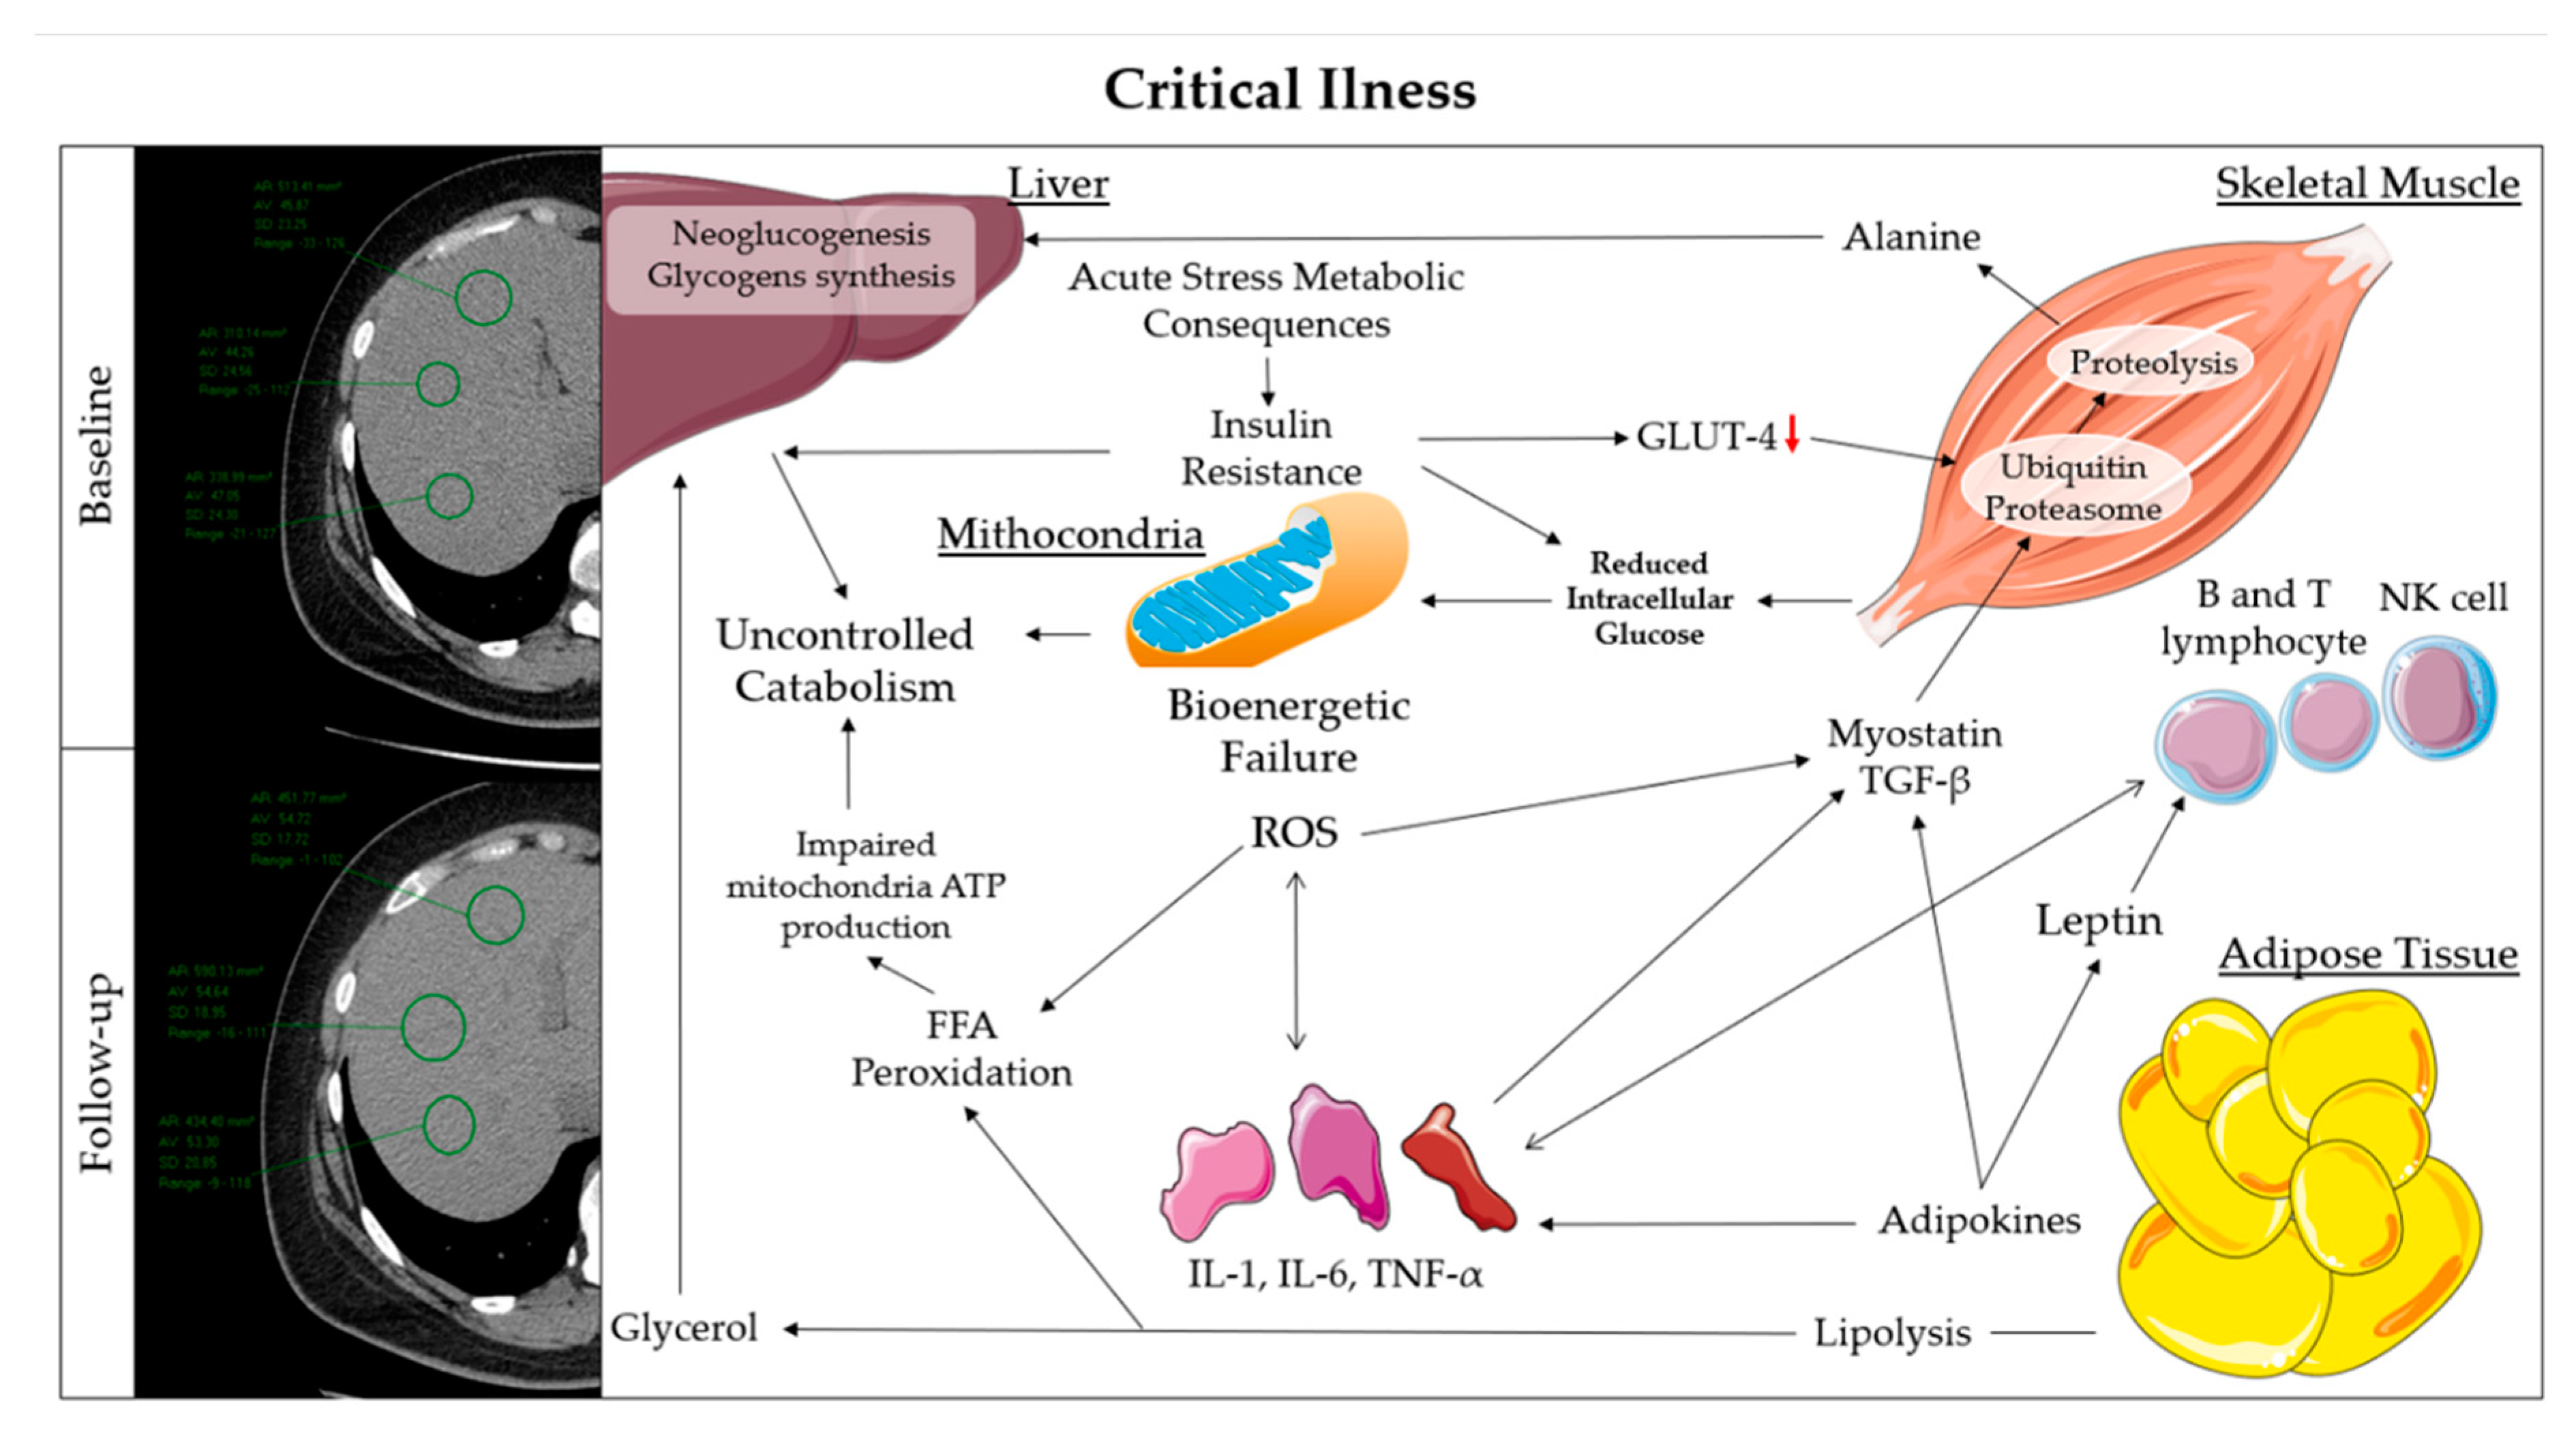
3. Discussion
4. Materials and Methods
4.1. Study Design
4.2. Data Collection
4.3. Definition
4.4. Statistical Analysis
5. Conclusions
Author Contributions
Funding
Acknowledgments
Conflicts of Interest
Abbreviations
| CT | Computed Tomography |
| ICU | Intensive Care Unit |
| LG | Lean Group |
| OG | Obese Group |
| ESM | Erector Spinae Muscle |
| ESMcsa | Erector Spinae Muscle cross sectional area |
| IL | Interleukin |
| TNF-α | Tumor Necrosis Factor-α |
| GLUT-4 | Glucose Transporter-4 |
| UPS | Ubiquitin-Proteasome System |
| IGF-1 | Insulin-like Growth Factor |
| AKT | Protein Kinase B |
| mTOR | mammalian Target Of Rapamycin |
| HU | Hounsfield Unit |
| BMI | Body Mass Index |
References
- Feeding America. Available online: https://www.feedingamerica.org/sites/default/files/2020-04/Brief_Impact%20of%20Covid%20on%20Food%20Insecurity%204.22%20%28002%29.pdf (accessed on 25 April 2020).
- Handu, D.; Moloney, L.; Rozga, M.; Cheng, F. Malnutrition Care during the COVID-19 Pandemic: Considerations for Registered Dietitian Nutritionists Evidence Analysis Center. J. Acad. Nutr. Diet. 2020. [Google Scholar] [CrossRef] [PubMed]
- Kiekens, C.; Boldrini, P.; Andreoli, A.; Avesani, R.; Gamna, F.; Grandi, M.; Lombardi, F.; Lusuardi, M.; Molteni, F.; Perboni, A.; et al. Rehabilitation and respiratory management in the acute and early post-acute phase. Instant paper from the field” on rehabilitation answers to the Covid-19 emergency. Eur. J. Phys. Rehabil. Med. 2020. [Google Scholar] [CrossRef]
- Tobert, C.M.; Mott, S.L.; Nepple, K.G. Malnutrition Diagnosis during Adult Inpatient Hospitalizations: Analysis of a Multi-Institutional Collaborative Database of Academic Medical Centers. J. Acad. Nutr. Diet. 2018, 118, 125–131. [Google Scholar] [CrossRef] [PubMed]
- Zheng, K.I.; Gao, F.; Wang, X.B.; Sun, Q.F.; Pan, K.H.; Wang, T.Y.; Ma, H.L.; Chen, Y.P.; Liu, W.Y.; George, J.; et al. Letter to the Editor: Obesity as a risk factor for greater severity of COVID-19 in patients with metabolic associated fatty liver disease. Metabolism 2020, 108, 154244. [Google Scholar] [CrossRef] [PubMed]
- Sharma, K.; Mogensen, K.M.; Robinson, M.K. Under-Recognizing Malnutrition in Hospitalized Obese Populations: The Real Paradox. Curr. Nutr. Rep. 2019, 8, 317–322. [Google Scholar] [CrossRef]
- Romano, L.; Marchetti, M.; Gualtieri, P.; Di Renzo, L.; Belcastro, M.; De Santis, G.L.; Perrone, M.A.; De Lorenzo, A. Effects of a Personalized VLCKD on Body Composition and Resting Energy Expenditure in the Reversal of Diabetes to Prevent Complications. Nutrients 2019, 11, 1526. [Google Scholar] [CrossRef] [PubMed] [Green Version]
- Krukowski, R.A.; Ross, K.M. Measuring weight with e-scales in clinical and research settings during the COVID-19 pandemic. Obesity 2020. [Google Scholar] [CrossRef]
- Singer, P.; Blaser, A.R.; Berger, M.M.; Alhazzani, W.; Calder, P.C.; Casaer, M.P.; Hiesmayr, M.; Mayer, K.; Montejo, J.C.; Pichard, C.; et al. ESPEN guideline on clinical nutrition in the intensive care unit. Clin. Nutr. 2019, 38, 48–79. [Google Scholar] [CrossRef] [Green Version]
- Salehi, S.; Abedi, A.; Balakrishnan, S.; Gholamrezanezhad, A. Coronavirus Disease 2019 (COVID-19): A Systematic Review of Imaging Findings in 919 Patients. AJR Am. J. Roentgenol. 2020, 1–7. [Google Scholar] [CrossRef]
- Ye, Q.; Wang, B.; Mao, J. The pathogenesis and treatment of the ‘Cytokine Storm’ in COVID-19. J. Infect. 2020, 80, 607–613. [Google Scholar] [CrossRef]
- Orphanidou, C.; McCargar, L.; Birmingham, C.L.; Mathieson, J.; Goldner, E. Accuracy of subcutaneous fat measurement: Comparison of skinfold calipers, ultrasound, and computed tomography. J. Am. Diet. Assoc. 1994, 94, 855–858. [Google Scholar] [CrossRef]
- Tanimura, K.; Sato, S.; Fuseya, Y.; Hasegawa, K.; Uemasu, K.; Sato, A.; Oguma, T.; Hirai, T.; Mishima, M.; Muro, S. Quantitative Assessment of Erector Spinae Muscles in Patients with Chronic Obstructive Pulmonary Disease. Novel Chest Computed Tomography-derived Index for Prognosis. Ann. Am. Thorac. Soc. 2016, 13, 334–341. [Google Scholar] [CrossRef] [PubMed]
- Kissler, S.M.; Tedijanto, C.; Goldstein, E.; Grad, Y.H.; Lipsitch, M. Projecting the transmission dynamics of SARS-CoV-2 through the postpandemic period. Science 2020, eabb5793. [Google Scholar] [CrossRef]
- Epicentro, L’epidemiologia per la Sanità Pubblica Istituto Superiore di Sanità. Available online: https://www.epicentro.iss.it/coronavirus/bollettino/Infografica_15maggio%20ITA.pdf (accessed on 17 May 2020).
- Epicentro, L’epidemiologia per la Sanità Pubblica Istituto Superiore di Sanità. Available online: https://www.epicentro.iss.it/coronavirus/bollettino/Bollettino-sorveglianza-integrata-COVID-19_14-maggio-2020.pdf (accessed on 17 May 2020).
- De Lorenzo, A.; Gratteri, S.; Gualtieri, P.; Cammarano, A.; Bertucci, P.; Di Renzo, L. Why primary obesity is a disease? J. Transl. Med. 2019, 17, 169. [Google Scholar] [CrossRef] [PubMed] [Green Version]
- Wells, M.M.; Li, Z.; Addeman, B.; McKenzie, C.A.; Mujoomdar, A.; Beaton, M.; Bird, J. Computed Tomography Measurement of Hepatic Steatosis: Prevalence of Hepatic Steatosis in a Canadian Population. Can. J. Gastroenterol. Hepatol. 2016, 2016, 4930987. [Google Scholar] [CrossRef] [PubMed] [Green Version]
- Rocha, R.; Cotrim, H.P.; Carvalho, F.M.; Siqueira, A.C.; Braga, H.; Freitas, L.A. Body mass index and waist circumference in non-alcoholic fatty liver disease. J. Hum. Nutr. Diet. 2005, 18, 365–370. [Google Scholar] [CrossRef]
- Kyle, U.G.; Genton, L.; Hans, D.; Karsegard, L.; Slosman, D.O.; Pichard, C. Age-related differences in fat-free mass, skeletal muscle, body cell mass and fat mass between 18 and 94 years. Eur. J. Clin. Nutr. 2001, 55, 663–672. [Google Scholar] [CrossRef]
- Epstein, D.; Andrawis, W.; Lipsky, A.M.; Ziad, H.A.; Matan, M. Anxiety and Suicidality in a Hospitalized Patient with COVID-19 Infection. Eur. J. Case Rep. Intern. Med. 2020, 7, 001651. [Google Scholar] [CrossRef]
- Aubertin-Leheudre, M.; Rolland, Y. The importance of physical activity to care for frail older adults during the covid-19 pandemic. J. Am. Med. Dir. Assoc. 2020. [Google Scholar] [CrossRef]
- Narici, M.; De Vito, G.; Franchi, M.; Paoli, A.; Moro, T.; Marcolin, G.; Grassi, B.; Baldassarre, G.; Zuccarelli, L.; Biolo, G.; et al. Impact of sedentarism due to the COVID-19 home confinement on neuromuscular, cardiovascular and metabolic health: Physiological and pathophysiological implications and recommendations for physical and nutritional countermeasures. Eur. J. Sport Sci. 2020, 12, 1–22. [Google Scholar] [CrossRef]
- Romano, L.; Bilotta, F.; Dauri, M.; Macheda, S.; Pujia, A.; De Santis, G.L.; Tarsitano, M.G.; Merra, G.; Di Renzo, L.; Esposito, E.; et al. Short Report—Medical nutrition therapy for critically ill patients with COVID-19. Eur. Rev. Med. Pharmacol. Sci. 2020, 24, 4035–4039. [Google Scholar] [CrossRef] [PubMed]
- Tappy, L.; Schwarz, J.M.; Schneiter, P.; Cayeux, C.; Revelly, J.P.; Fagerquist, C.K.; Jéquier, E.; Chioléro, R. Effects of isoenergetic glucose-based or lipid-based parenteral nutrition on glucose metabolism, de novo lipogenesis, and respiratory gas exchanges in critically ill patients. Crit. Care Med. 1998, 26, 860–867. [Google Scholar] [CrossRef]
- De Lorenzo, A.; Soldati, L.; Sarlo, F.; Calvani, M.; Di Lorenzo, N.; Di Renzo, L. New obesity classification criteria as a tool for bariatric surgery indication. World J. Gastroenterol. 2016, 22, 681–703. [Google Scholar] [CrossRef]
- De Lorenzo, A.; Romano, L.; Di Renzo, L.; Di Lorenzo, N.; Cenname, G.; Gualtieri, P. Obesity: A preventable, treatable, but relapsing disease. Nutrition 2020, 71, 110615. [Google Scholar] [CrossRef] [PubMed]
- Preiser, J.C.; Ichai, C.; Orban, J.C.; Groeneveld, A.B. Metabolic response to the stress of critical illness. Br. J. Anaesth 2014, 113, 945–954. [Google Scholar] [CrossRef] [PubMed] [Green Version]
- Claycombe, K.; King, L.E.; Fraker, P.J. A role for leptin in sustaining lymphopoiesis and myelopoiesis. Proc. Natl. Acad. Sci. USA 2008, 105, 2017–2021. [Google Scholar] [CrossRef] [PubMed] [Green Version]
- Stofkova, A. Leptin and adiponectin: From energy and metabolic dysbalance to inflammation and autoimmunity. Endocr. Regul. 2009, 43, 157–168. [Google Scholar]
- Gardner, E.M.; Beli, E.; Clinthorne, J.F.; Duriancik, D.M. Energy intake and response to infection with influenza. Annu. Rev. Nutr. 2011, 31, 353–367. [Google Scholar] [CrossRef]
- Biolo, G.; Grimble, G.; Preiser, J.C.; Leverve, X.; Jolliet, P.; Planas, M.; Roth, E.; Wernerman, J.; Pichard, C.; European Society of Intensive Care Medicine Working Group on Nutrition and Metabolism. Position paper of the ESICM Working Group on Nutrition and Metabolism. Metabolic basis of nutrition in intensive care unit patients: Ten critical questions. Intensive Care Med. 2002, 28, 1512–1520. [Google Scholar] [CrossRef] [Green Version]
- Dungan, K.M.; Braithwaite, S.S.; Preiser, J.C. Stress hyperglycaemia. Lancet 2009, 373, 1798–1807. [Google Scholar] [CrossRef]
- Lecker, S.H. Ubiquitin-protein ligases in muscle wasting: Multiple parallel pathways? Curr. Opin. Clin. Nutr. Metab. Care 2003, 6, 271–275. [Google Scholar] [CrossRef] [PubMed]
- Bodine, S.C.; Latres, E.; Baumhueter, S.; Lai, V.K.; Nunez, L.; Clarke, B.A.; Poueymirou, W.T.; Panaro, F.J.; Na, E.; Dharmarajan, K.; et al. Identification of ubiquitin ligases required for skeletal muscle atrophy. Science 2001, 294, 1704–1708. [Google Scholar] [CrossRef] [PubMed]
- Li, Y.P.; Reid, M.B. NF-kappaB mediates the protein loss induced by TNF-alpha in differentiated skeletal muscle myotubes. Am. J. Physiol. Regul. Integr. Comp. Physiol. 2000, 279, R1165–R1170. [Google Scholar] [CrossRef] [PubMed]
- Scimeca, M.; Piccirilli, E.; Mastrangeli, F.; Rao, C.; Feola, M.; Orlandi, A.; Gasbarra, E.; Bonanno, E.; Tarantino, U. Bone Morphogenetic Proteins and myostatin pathways: Key mediator of human sarcopenia. J. Transl. Med. 2017, 15, 34. [Google Scholar] [CrossRef] [PubMed] [Green Version]
- Bloch, S.; Polkey, M.I.; Griffiths, M.; Kemp, P. Molecular mechanisms of intensive care unit-acquired weakness. Eur. Respir. J. 2012, 39, 1000–1011. [Google Scholar] [CrossRef]
- Friedrich, O. Critical illness myopathy: What is happening? Curr. Opin. Clin. Nutr. Metab. Care 2006, 9, 403–409. [Google Scholar] [CrossRef]
- Fredriksson, K.; Tjäder, I.; Keller, P.; Petrovic, N.; Ahlman, B.; Schéele, C.; Wernerman, J.; Timmons, J.A.; Rooyackers, O. Dysregulation of mitochondrial dynamics and the muscle transcriptome in ICU patients suffering from sepsis induced multiple organ failure. PLoS ONE 2008, 3, e3686. [Google Scholar] [CrossRef]
- Liaw, K.Y.; Wei, T.C.; Hsu, S.C.; Lin, J.K. Effect of severe injury and critical illness on high-energy phosphates in human liver and muscle. J. Trauma. 1985, 25, 628–633. [Google Scholar] [CrossRef]
- Brealey, D.; Singer, M. Hyperglycemia in critical illness: A review. J. Diabetes Sci. Technol. 2009, 3, 1250–1260. [Google Scholar] [CrossRef] [Green Version]
- Leander, P.; Sjöberg, S.; Höglund, P. CT and MR imaging of the liver. Clinical importance of nutritional status. Acta Radiol. 2000, 41, 151–155. [Google Scholar] [CrossRef]
- Hruschka, D.J.; Hadley, C. How much do universal anthropometric standards bias the global monitoring of obesity and undernutrition? Obes. Rev. 2016, 17, 1030–1039. [Google Scholar] [CrossRef] [PubMed] [Green Version]
- Avolio, E.; Gualtieri, P.; Romano, L.; Pecorella, C.; Ferraro, S.; Palma, G.; Di Renzo, L.; De Lorenzo, A. Obesity and Body Composition in Man and Woman: Associated Diseases and the New Role of Gut Microbiota. Curr. Med. Chem. 2020, 27, 216–229. [Google Scholar] [CrossRef] [PubMed]
- De Lorenzo, A.; Siclari, M.; Gratteri, S.; Romano, L.; Gualtieri, P.; Marchetti, M.; Merra, G.; Colica, C. Developing and cross-validation of new equations to estimate fat mass in Italian population. Eur. Rev. Med. Pharmacol. Sci. 2019, 23, 2513–2524. [Google Scholar] [CrossRef]
- Siri, W.E. Body composition from fluid spaces and density: Analysis of methods. 1961. Nutrition 1993, 9, 480–492. [Google Scholar]
- Durnin, J.V.; Womersley, J. Body fat assessed from total body density and its estimation from skinfold thickness: Measurements on 481 men and women aged from 16 to 72 years. Br. J. Nutr. 1974, 32, 77–97. [Google Scholar] [CrossRef] [PubMed] [Green Version]
- Faul, F.; Erdfelder, E.; Lang, A.G.; Buchner, A. G*Power 3: A flexible statistical power analysis program for the social, behavioral, and biomedical sciences. Behav. Res. Methods 2007, 39, 175–191. [Google Scholar] [CrossRef]


| Parameters | Overall (n 30) | Lean (n 13) | Obese (n 17) | |
|---|---|---|---|---|
| Mean ± SD | Mean ± SD | Mean ± SD | p | |
| Subscapular Thickness (mm) | 16.45 ± 6.92 | 10.85 ± 3.81 | 21.36 ± 4.95 | 0.001 |
| Suprailiac Thickness (mm) | 17.68 ± 8.32 | 11.85 ± 5.11 | 22.77 ± 7.25 | 0.006 |
| Sum Thickness (mm) | 34.13 ± 13.95 | 22.70 ± 8.35 | 44.13 ± 9.21 | 0.000 |
| Body Density (kg/m3) | 1.03 ± 0.01 | 1.05 ± 0.01 | 1.03 ± 0.01 | 0.001 |
| Fat Mass (%) | 28.42 ± 6.29 | 23.34 ± 5.21 | 32.87 ± 2.73 | 0.001 |
| Waist Circumference (cm) | 103.19 ± 10.18 | 93.72 ± 4.10 | 111.48 ± 4.97 | 0.000 |
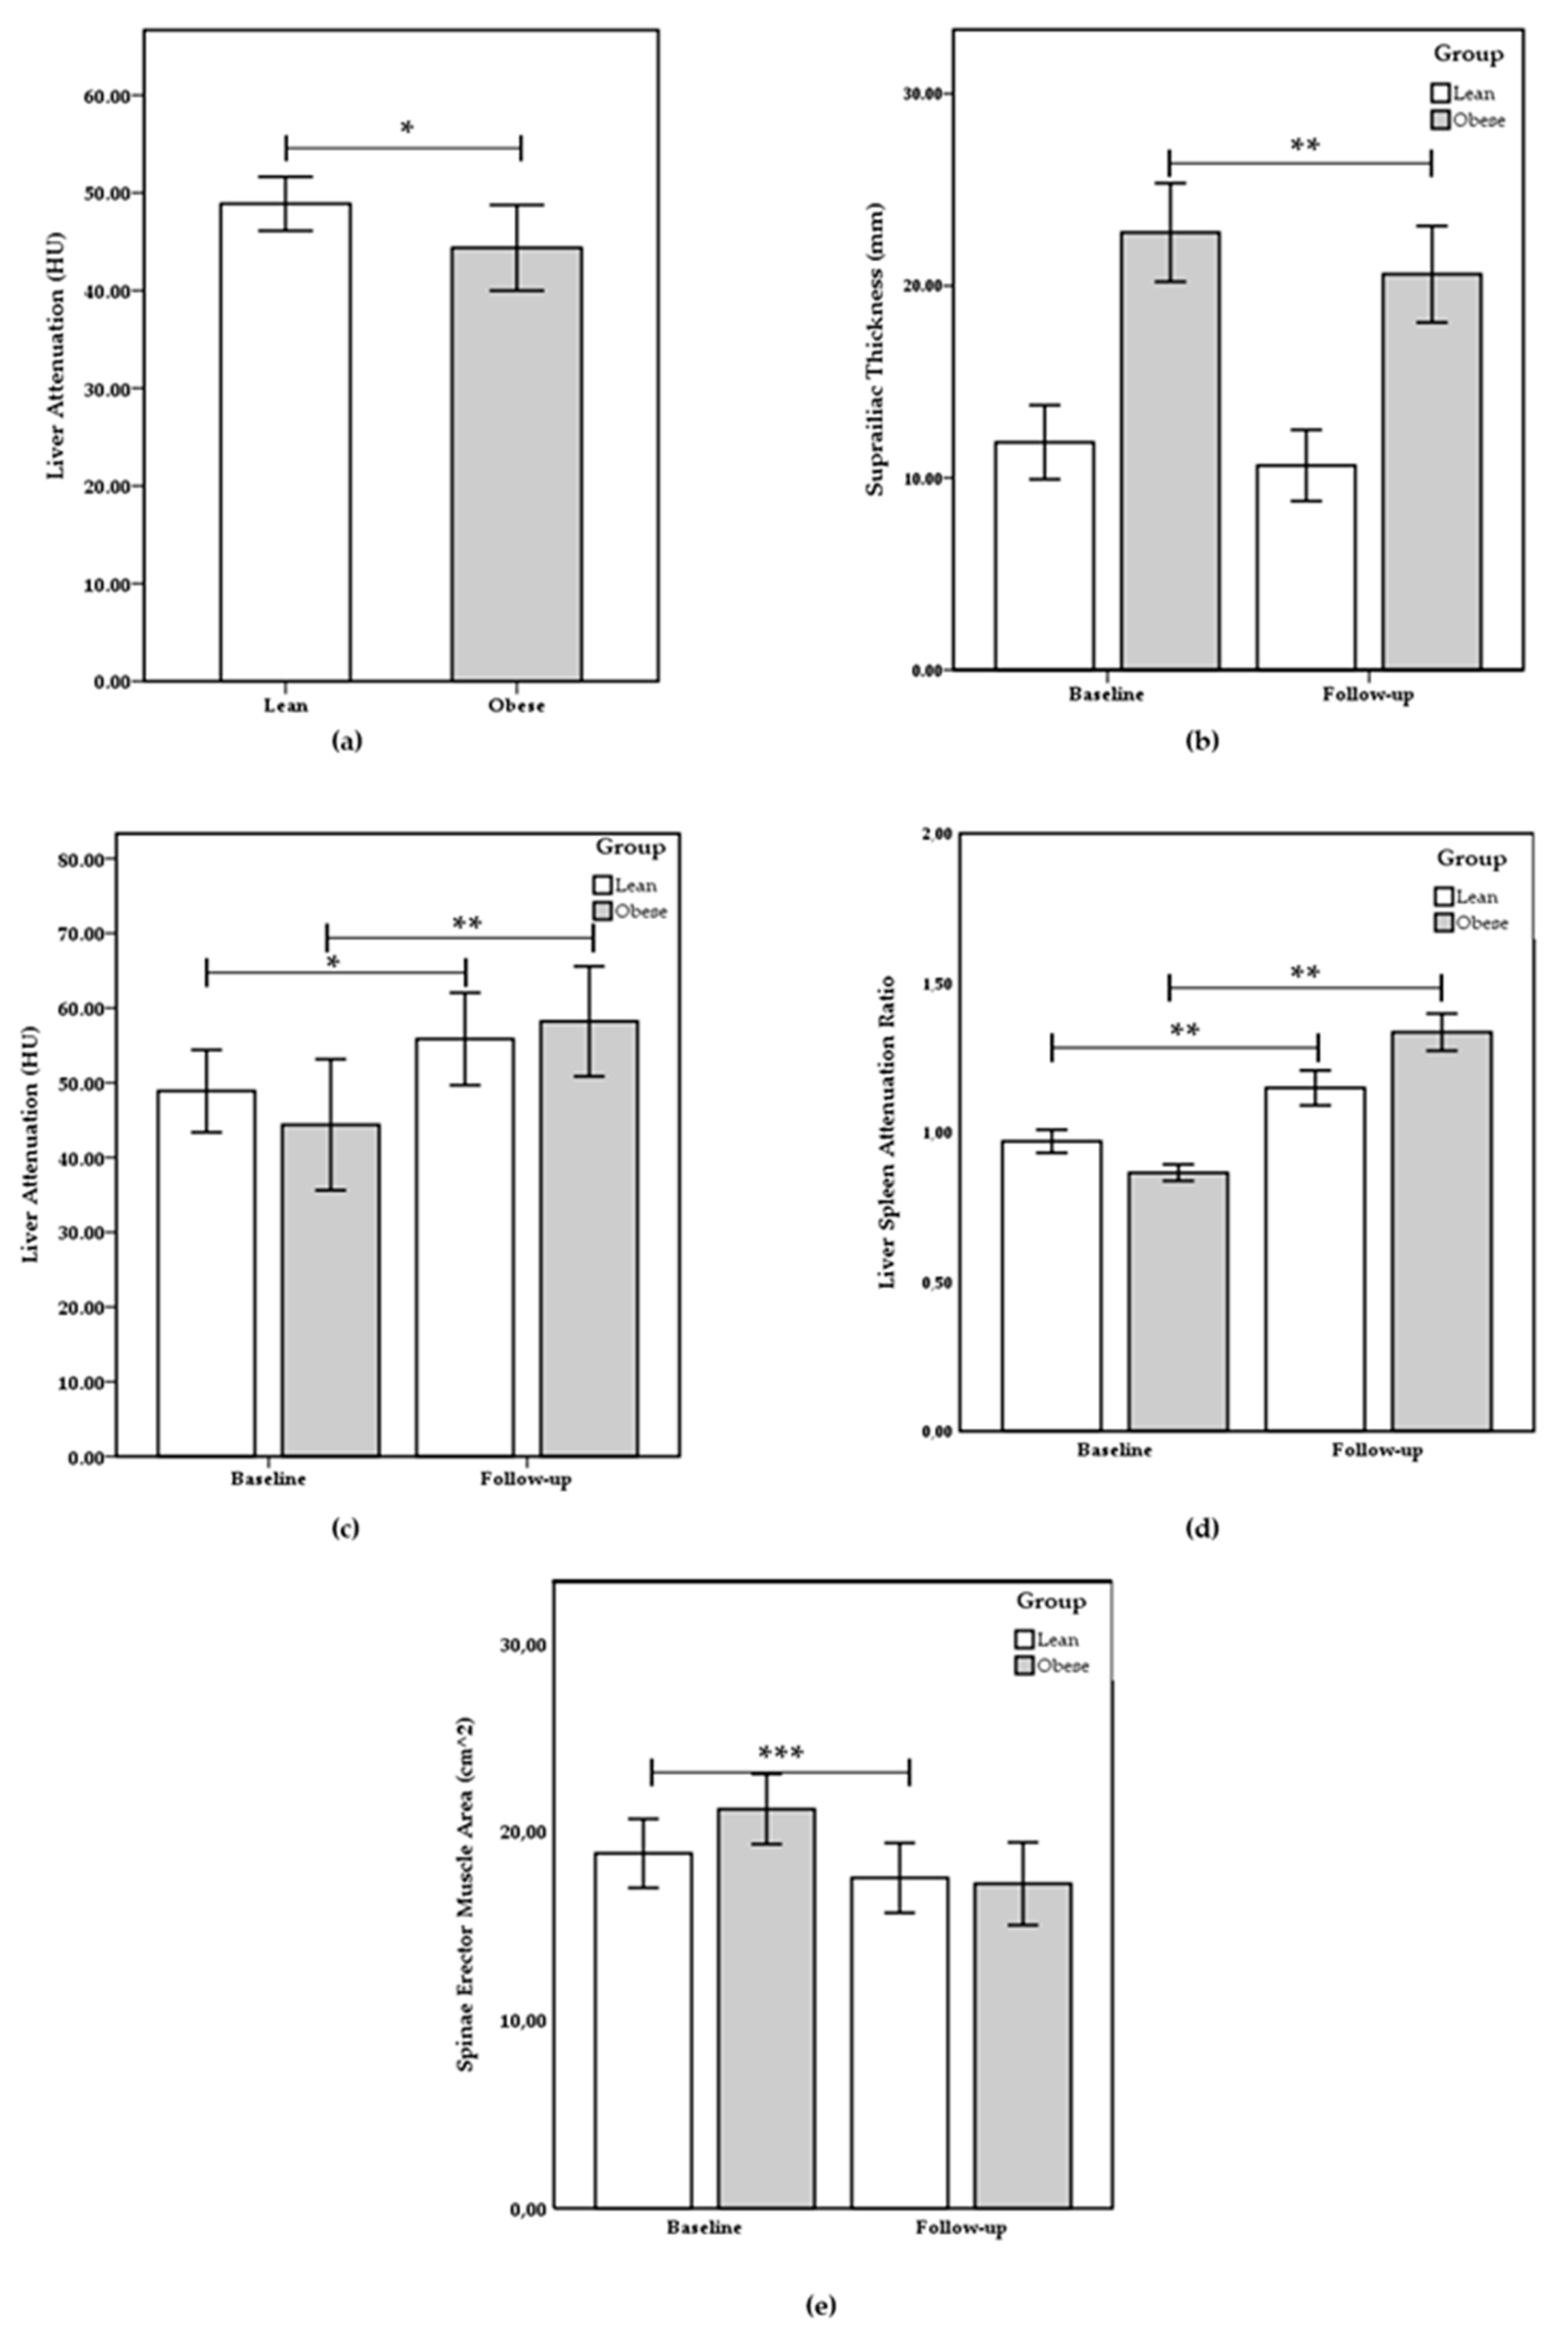
| Liver Attenuation (HU) | 46.17 ± 4.91 | 48.89 ± 2.76 | 43.79 ± 5.28 | 0.037 |
| Spleen Attenuation (HU) | 49.68 ± 6.85 | 51.84 ± 6.27 | 47.78 ± 7.15 | 0.267 |
| LRS | 0.91 ± 0.10 | 0.97 ± 0.10 | 0.86 ± 0.08 | 0.042 |
| ESMcsa (cm2) | 20.08 ± 4.52 | 18.84 ± 4.42 | 21.18 ± 4.63 | 0.387 |
| ESM attenuation (HU) | 27.63 ± 3.24 | 28.54 ± 5.84 | 26.83 ± 4.29 | 0.667 |
| Parameters | Overall | Lean | Obese | ||||||
|---|---|---|---|---|---|---|---|---|---|
| Baseline | Follow-up | Baseline | Follow-up | Baseline | Follow-up | ||||
| Mean ± SD | Mean ± SD | p | Mean ± SD | Mean ± SD | p | Mean ± SD | Mean ± SD | p | |
| Subscapular Thickness (mm) | 16.45 ± 6.92 | 14.97 ± 7.42 | 0.000 | 10.85 ± 3.81 | 9.01 ± 5.17 | 0.004 | 21.36 ± 4.95 | 19.94 ± 4.84 | 0.001 |
| Suprailiac Thickness (mm) | 17.68 ± 8.32 | 16.08 ± 7.27 | 0.004 | 11.85 ± 5.11 | 10.64 ± 4.14 | 0.237 | 22.77 ± 7.25 | 20.6 ± 6.15 | 0.004 |
| Sum Thickness (mm) | 34.13 ± 13.95 | 31.05 ± 13.34 | 0.000 | 22.7 ± 8.35 | 19.65 ± 8.52 | 0.025 | 44.13 ± 9.21 | 40.54 ± 7.72 | 0.001 |
| Body Density (kg/m3) | 1.03 ± 0.01 | 1.05 ± 0.02 | 0.000 | 1.05 ± 0.01 | 1.07 ± 0.01 | 0.000 | 1.03 ± 0.01 | 1.04 ± 0.01 | 0.000 |
| Fat Mass (%) | 28.42 ± 6.29 | 20.15 ± 7.01 | 0.000 | 23.34 ± 5.21 | 14.5 ± 6.45 | 0.000 | 32.87 ± 2.73 | 24.86 ± 2.54 | 0.000 |
| Waist Circumference (cm) | 103.19 ± 10.18 | 99.85 ± 9.64 | 0.002 | 93.72 ± 4.10 | 92.25 ± 3.78 | 0.185 | 111.48 ± 4.97 | 108.71 ± 5.55 | 0.000 |
| Liver Attenuation (HU) | 46.17 ± 4.91 | 57.14 ± 3.48 | 0.000 | 48.89 ± 2.76 | 55.85 ± 3.09 | 0.017 | 43.79 ± 5.28 | 58.22 ± 3.68 | 0.002 |
| Spleen Attenuation (HU) | 49.68 ± 6.85 | 46.31 ± 5.49 | 0.013 | 51.84 ± 6.27 | 49.02 ± 4.60 | 0.066 | 47.78 ± 7.15 | 44.05 ± 5.47 | 0.147 |
| LRS | 0.91 ± 0.10 | 1.25 ± 0.17 | 0.000 | 0.97 ± 0.10 | 1.15 ± 0.13 | 0.004 | 0.86 ± 0.08 | 1.34 ± 0.15 | 0.001 |
| ESMcsa (cm2) | 20.08 ± 4.52 | 17.36 ± 3.72 | 0.000 | 18.84 ± 4.42 | 17.52 ± 3.46 | 0.091 | 21.18 ± 4.63 | 17.22 ± 5.11 | 0.000 |
| ESM attenuation (HU) | 27.63 ± 3.24 | 26.80 ± 6.86 | 0.510 | 28.54 ± 5.84 | 27.29 ± 4.11 | 0.404 | 26.83 ± 4.29 | 26.08 ± 4.82 | 0.950 |
| ∆% Baseline Follow-up | ||||
|---|---|---|---|---|
| Parameters | Overall (n 30) | Lean (n 13) | Obese (n 17) | |
| Mean ± SD | Mean ± SD | Mean ± SD | p | |
| Subscapular Thickness (∆%) | −15.18 ± 11.75 | −17.55 ± 16.07 | −11.74 ± 4.16 | 0.182 |
| Suprailiac Thickness (∆%) | −12.38 ± 11.64 | −9.54 ± 15.98 | −14.75 ± 7.21 | 0.045 |
| Sum Thickness (∆%) | −14.14 ± 6.32 | −14.84 ± 8.48 | −13.56 ± 4.62 | 0.752 |
| Body Density (∆%) | 1.88 ± 0.21 | 1.88 ± 0.28 | 1.87 ± 0.15 | 0.953 |
| Fat Mass (∆%) | −28.85 ± 4.66 | −31.73 ± 5.03 | −26.46 ± 2.83 | 0.055 |
| Waist Circumference (∆%) | −2.25 ± 2.19 | −1.52 ± 2.74 | −3.11 ± 0.9 | 0.206 |
| Liver Attenuation (∆%) | 27.61 ± 18.58 | 14.14 ± 8.45 | 38.84 ± 17.35 | 0.018 |
| Spleen Attenuation (∆%) | −4.39 ± 4.76 | −4.87 ± 4.42 | −3.99 ± 5.42 | 0.777 |
| LRS (∆%) | 40.56 ± 24.79 | 20.00 ± 6.98 | 57.7 ± 20.38 | 0.004 |
| ESMcsa (∆%) | −14.99 ± 15.36 | −7.41 ± 9.43 | −18.63 ± 6.96 | 0.031 |
| ESM attenuation (∆%) | −3.03 ± 3.42 | −4,37 ± 7.51 | −2.79 ± 3.56 | 0.683 |
© 2020 by the authors. Licensee MDPI, Basel, Switzerland. This article is an open access article distributed under the terms and conditions of the Creative Commons Attribution (CC BY) license (http://creativecommons.org/licenses/by/4.0/).
Share and Cite
Gualtieri, P.; Falcone, C.; Romano, L.; Macheda, S.; Correale, P.; Arciello, P.; Polimeni, N.; De Lorenzo, A. Body Composition Findings by Computed Tomography in SARS-CoV-2 Patients: Increased Risk of Muscle Wasting in Obesity. Int. J. Mol. Sci. 2020, 21, 4670. https://0-doi-org.brum.beds.ac.uk/10.3390/ijms21134670
Gualtieri P, Falcone C, Romano L, Macheda S, Correale P, Arciello P, Polimeni N, De Lorenzo A. Body Composition Findings by Computed Tomography in SARS-CoV-2 Patients: Increased Risk of Muscle Wasting in Obesity. International Journal of Molecular Sciences. 2020; 21(13):4670. https://0-doi-org.brum.beds.ac.uk/10.3390/ijms21134670
Chicago/Turabian StyleGualtieri, Paola, Carmela Falcone, Lorenzo Romano, Sebastiano Macheda, Pierpaolo Correale, Pietro Arciello, Nicola Polimeni, and Antonino De Lorenzo. 2020. "Body Composition Findings by Computed Tomography in SARS-CoV-2 Patients: Increased Risk of Muscle Wasting in Obesity" International Journal of Molecular Sciences 21, no. 13: 4670. https://0-doi-org.brum.beds.ac.uk/10.3390/ijms21134670