The Structure of Amyloid Versus the Structure of Globular Proteins

 , , ,
, , , 
Abstract
:1. Introduction
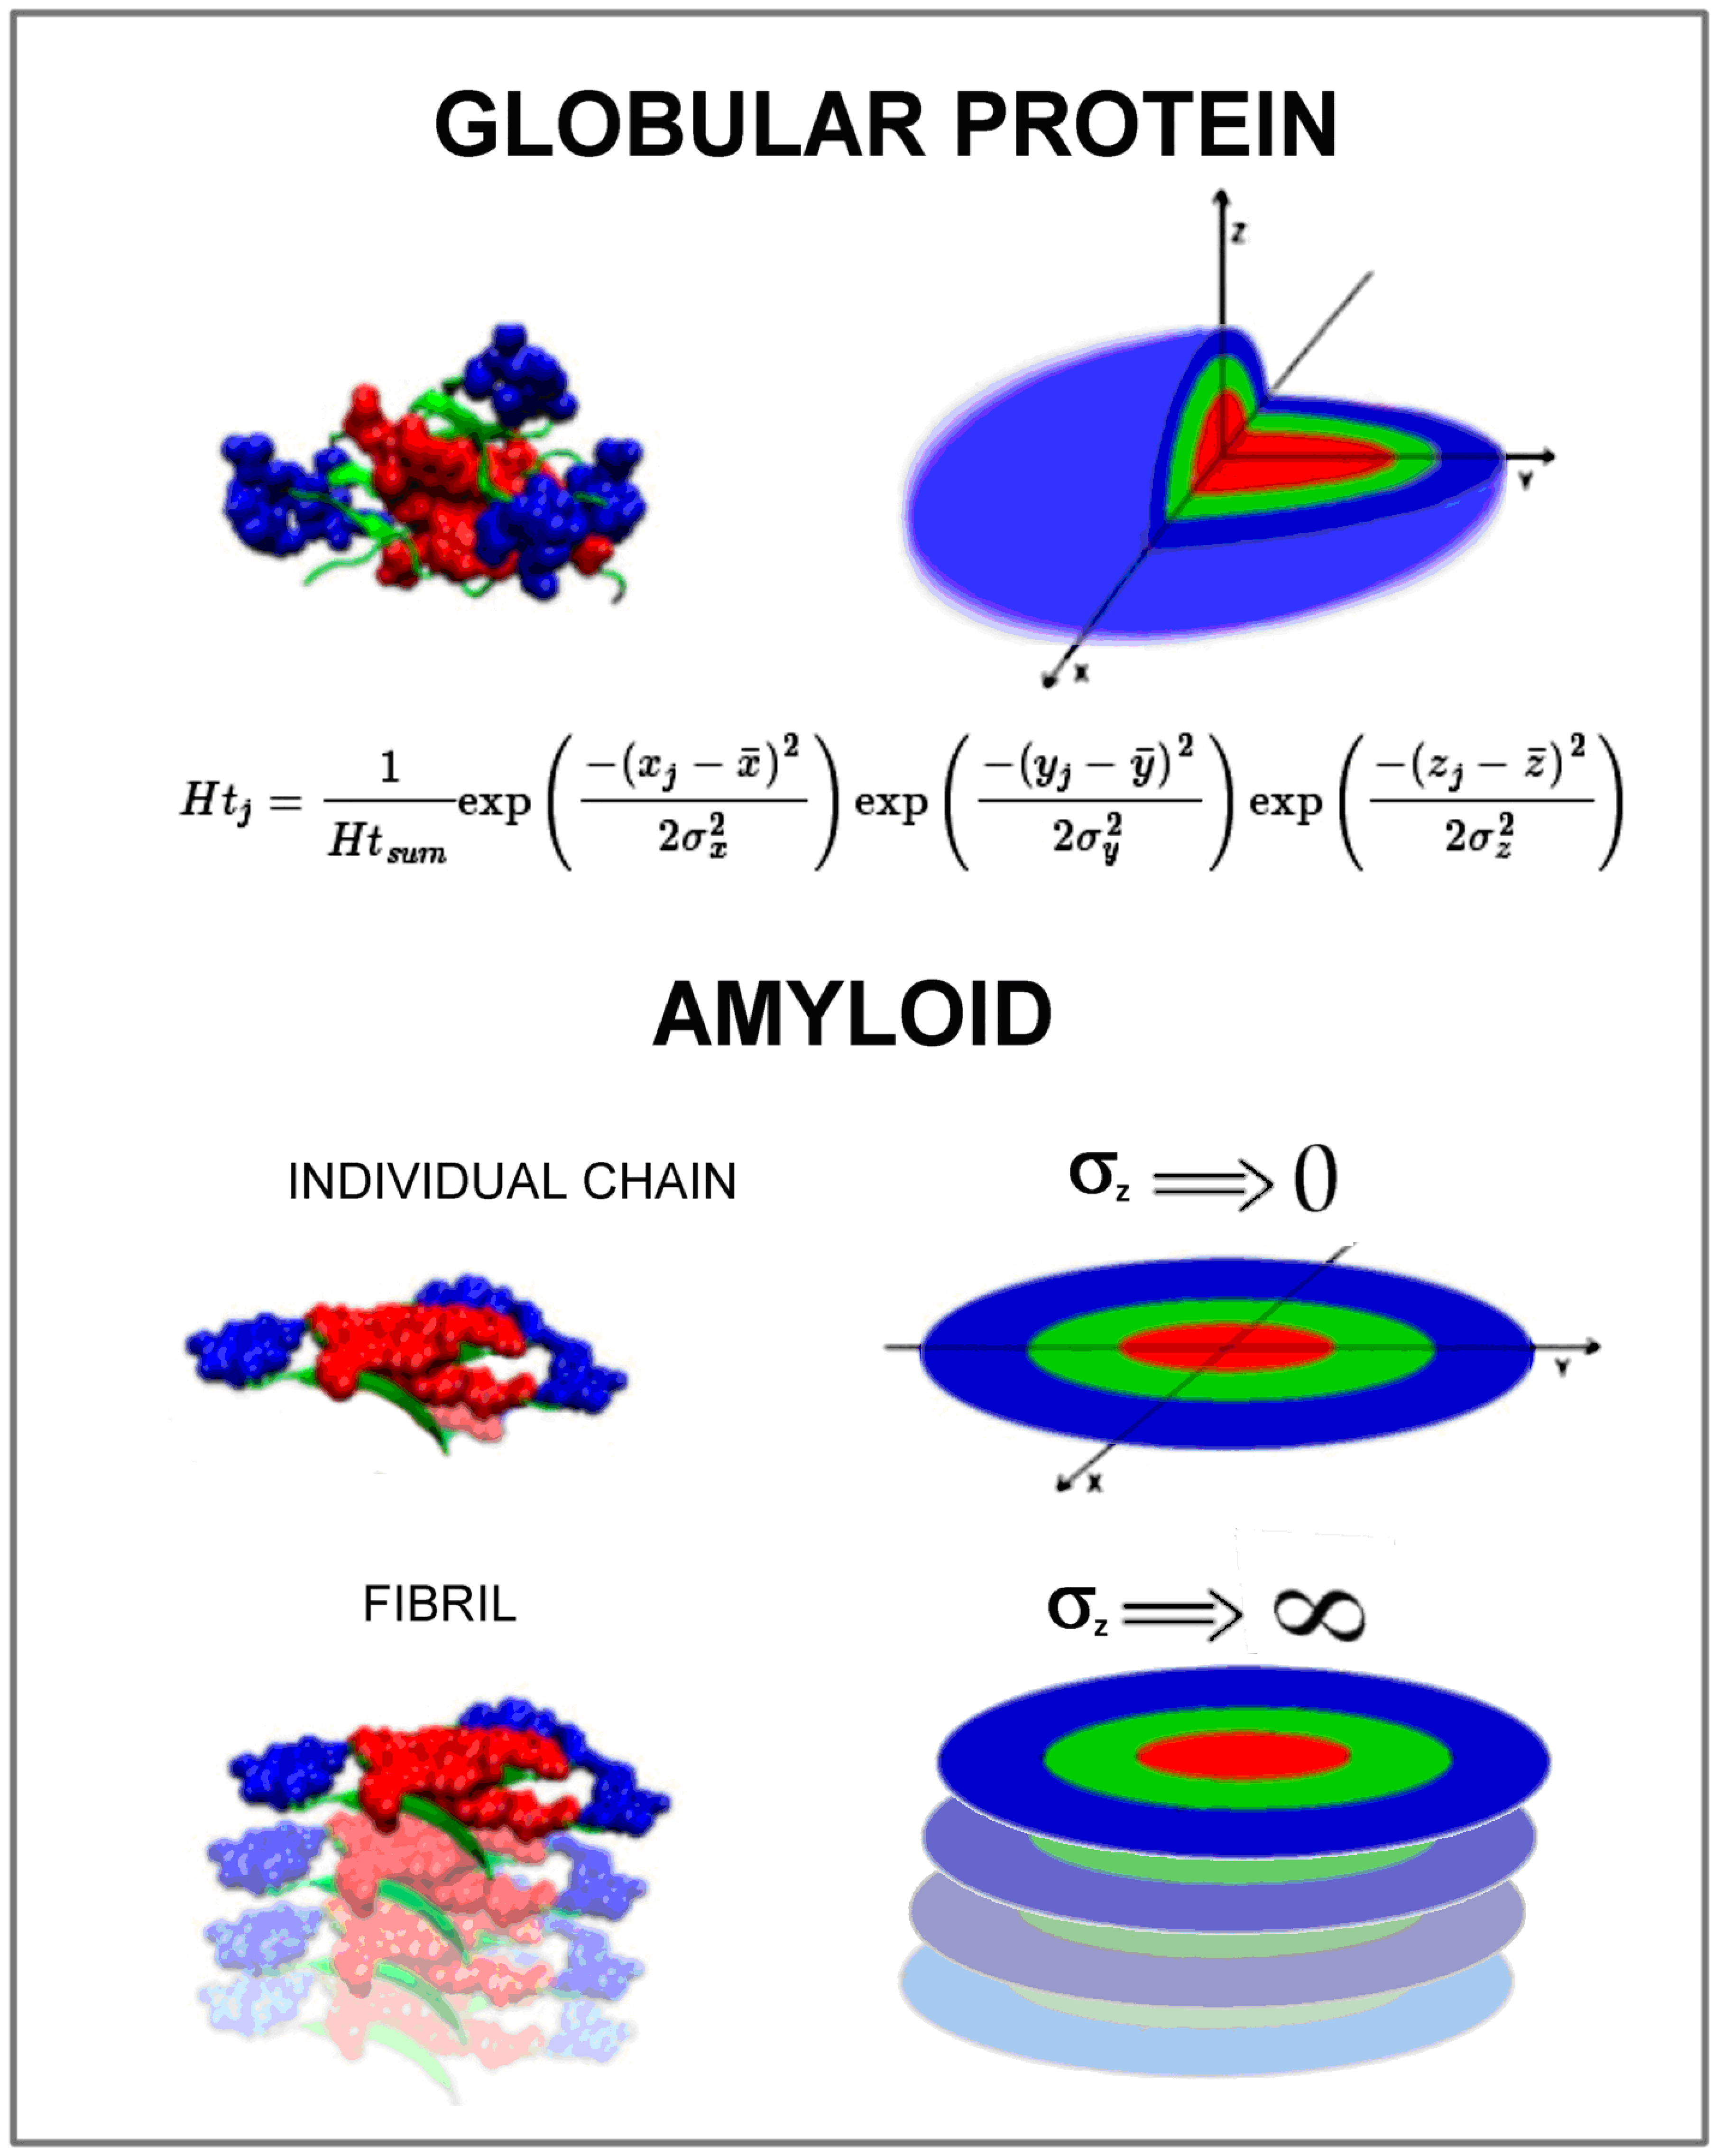
- (1)
- orientation of the fibril in the coordinate system so that the geometric center of the fibril is located at the origin of the coordinate system
- (2)
- orientation of the fibril, so that the position of the central chain in the fibril coincides with the XY plane and the Z axis is oriented according to the main axis of the fibril
- (3)
- then the RD value was determined for the central chain (lying in the XY plane) treating this chain as part of the whole fibril ellipsoid
- (4)
- for such orientation, RD (against 3D Gaussian distribution) was determined for the entire fibril, for the same orientation, RD (against 3D Gaussian distribution) was determined for the central chain treated as an individual structural unit for which the corresponding 3D G function was determined
- (5)
- RD (2DG) was determined for the same orientation for the central chain (component for the Z variable is not present)
- (6)
- for all determined RD values (points 3, 4, 5), the procedure of residue elimination was applied, which significantly influences exceeding the threshold of 0.5 for the RD value in order to identify residues showing the status as expected (distribution T).
2. Results
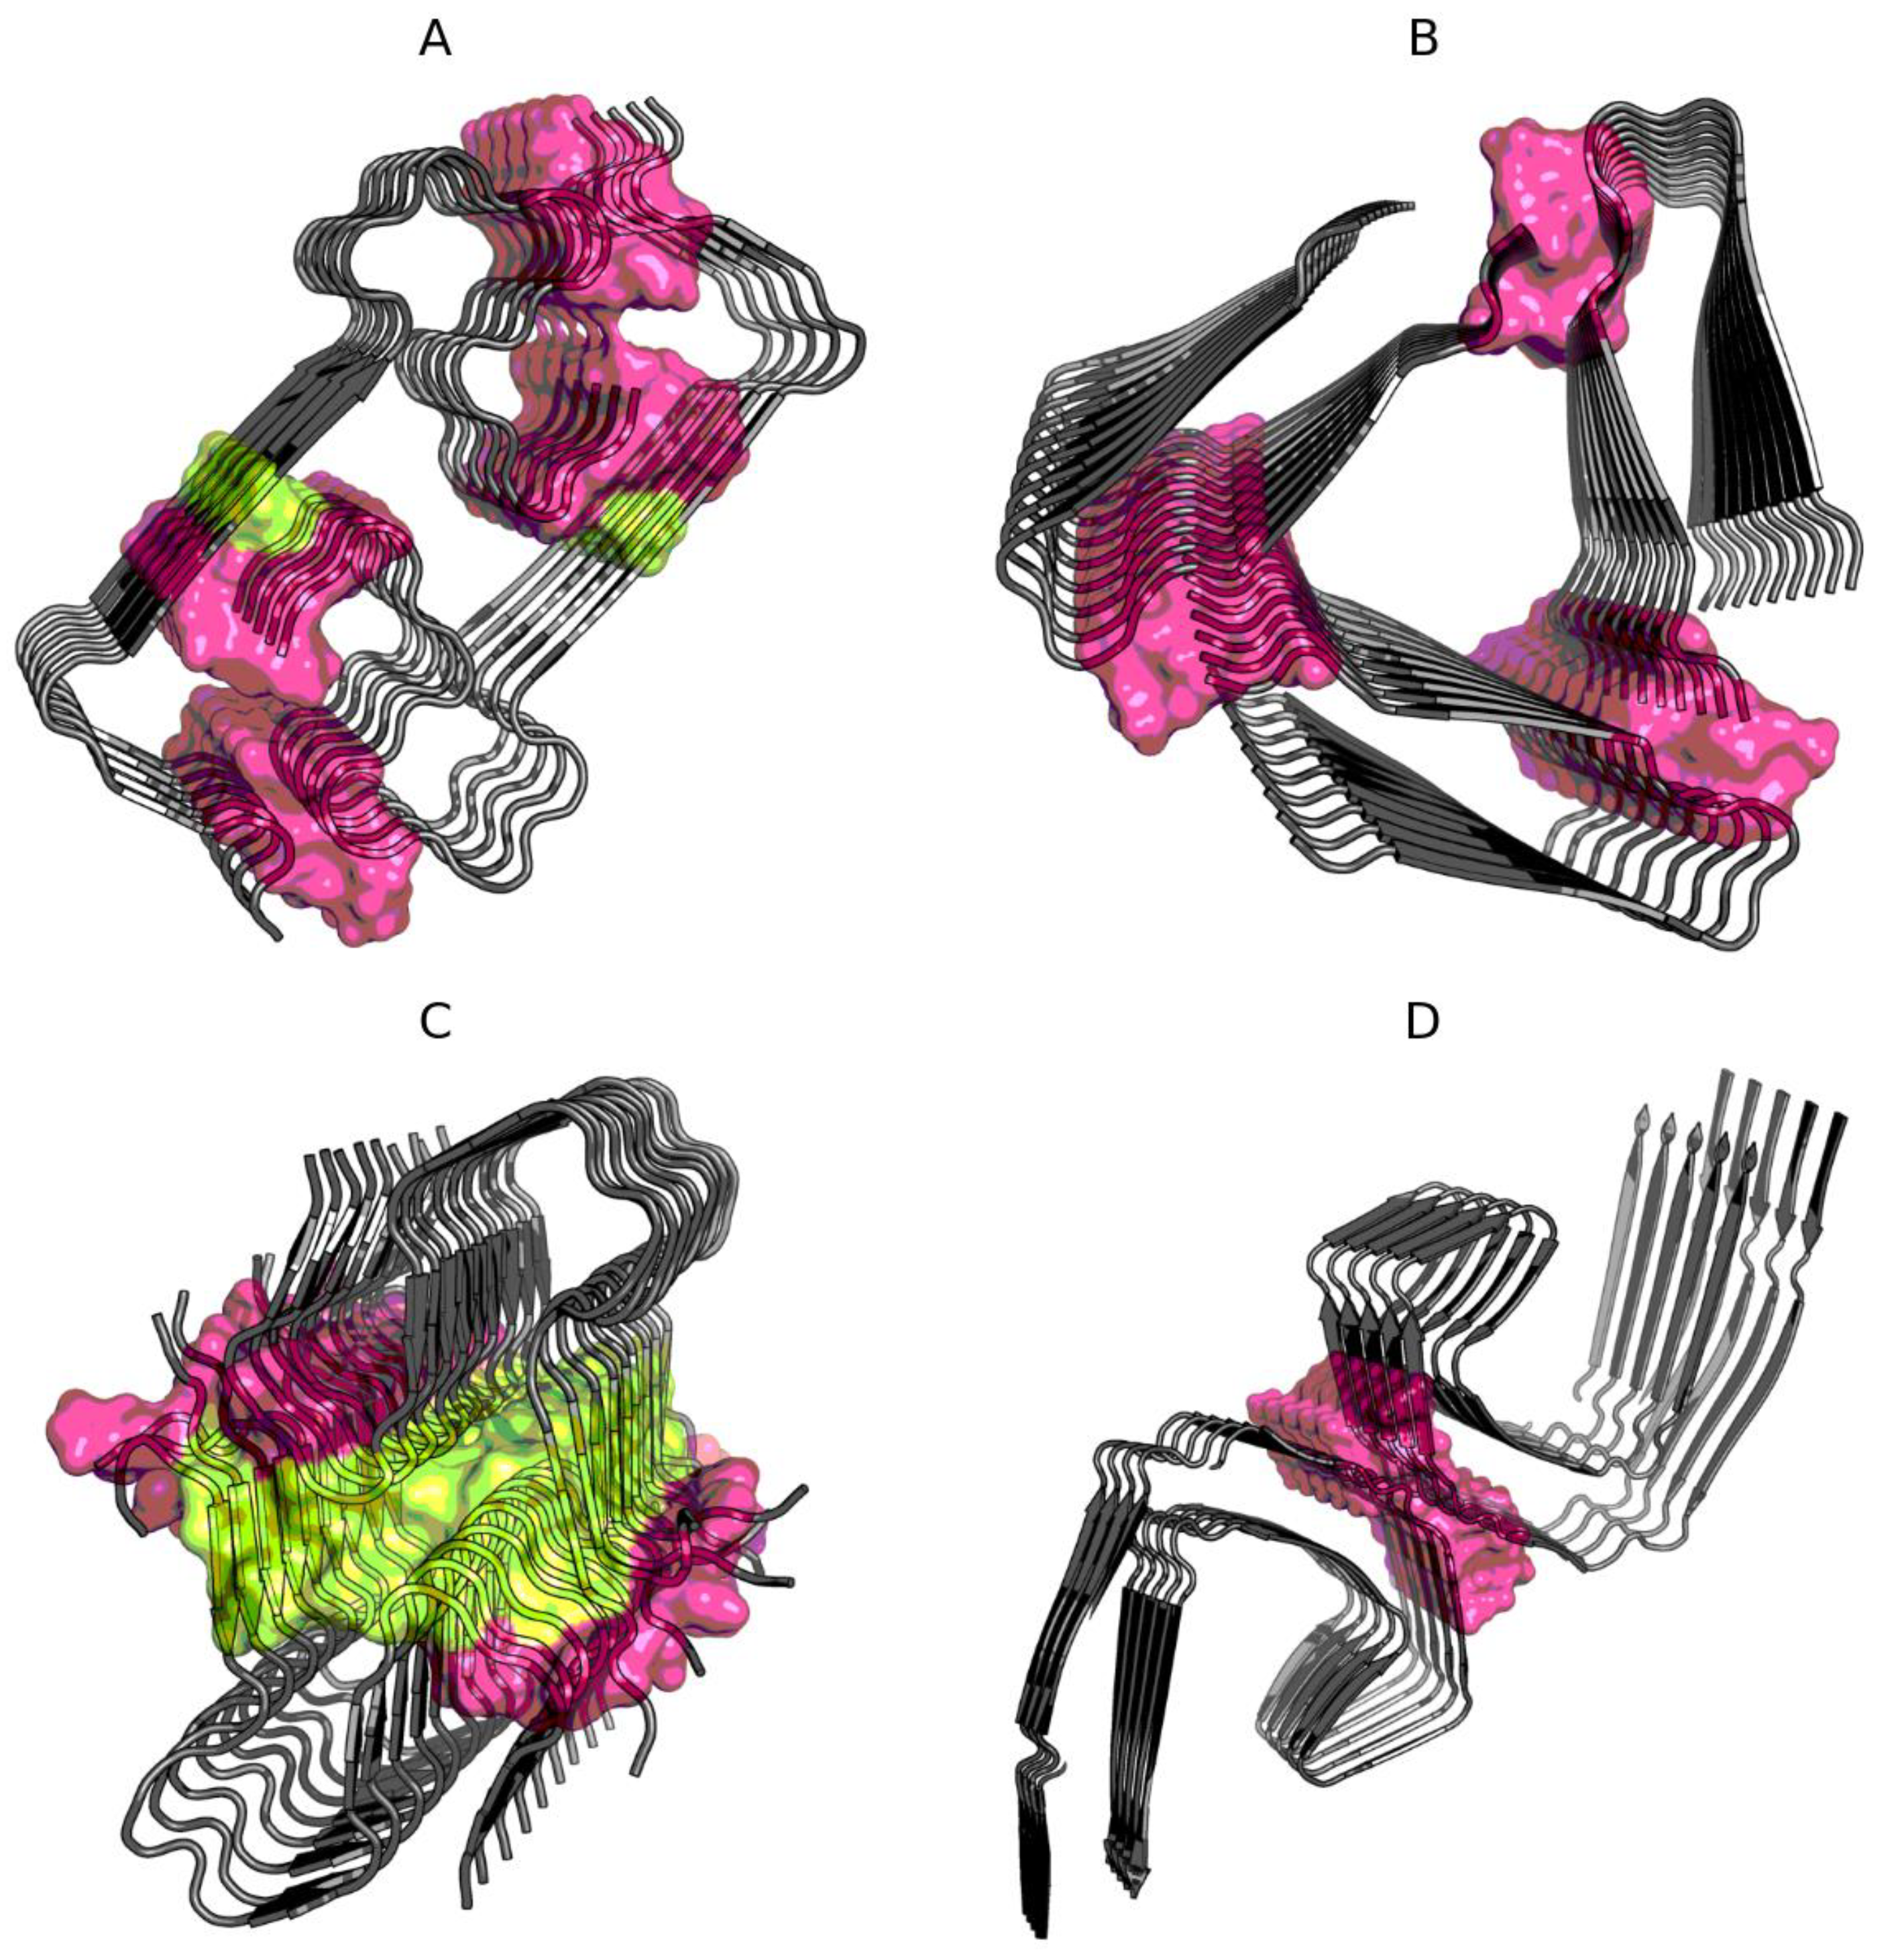
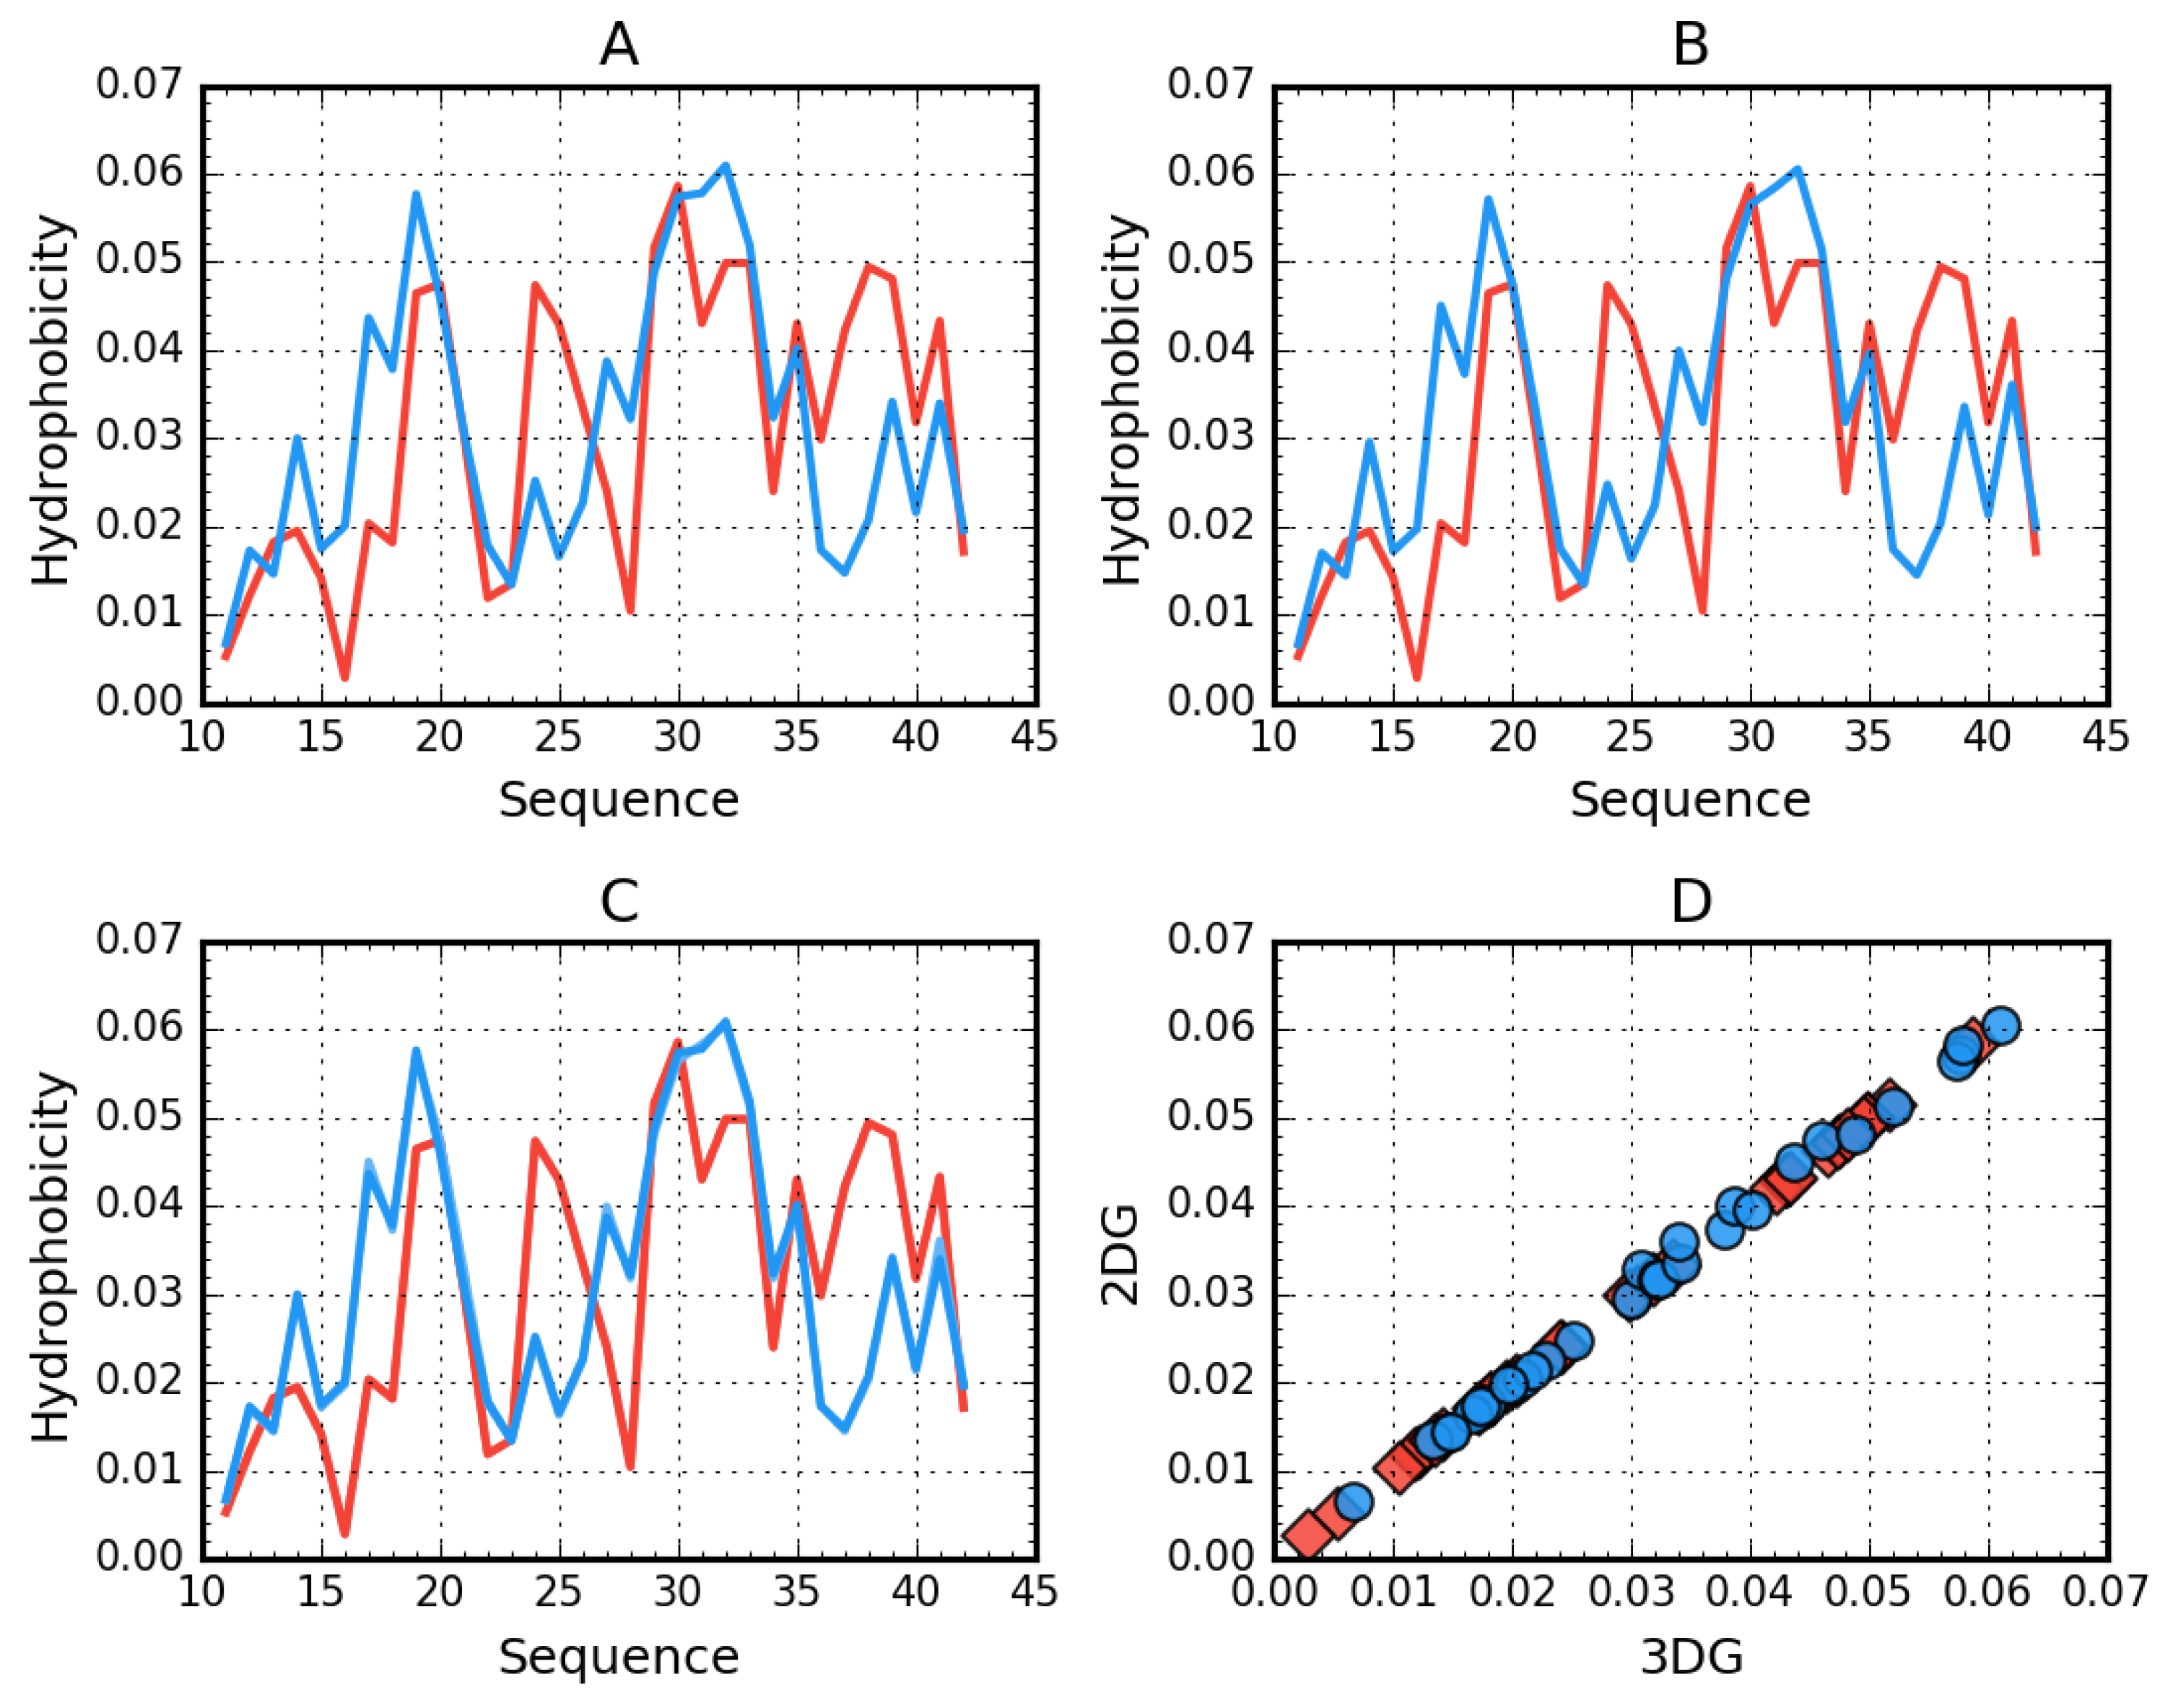
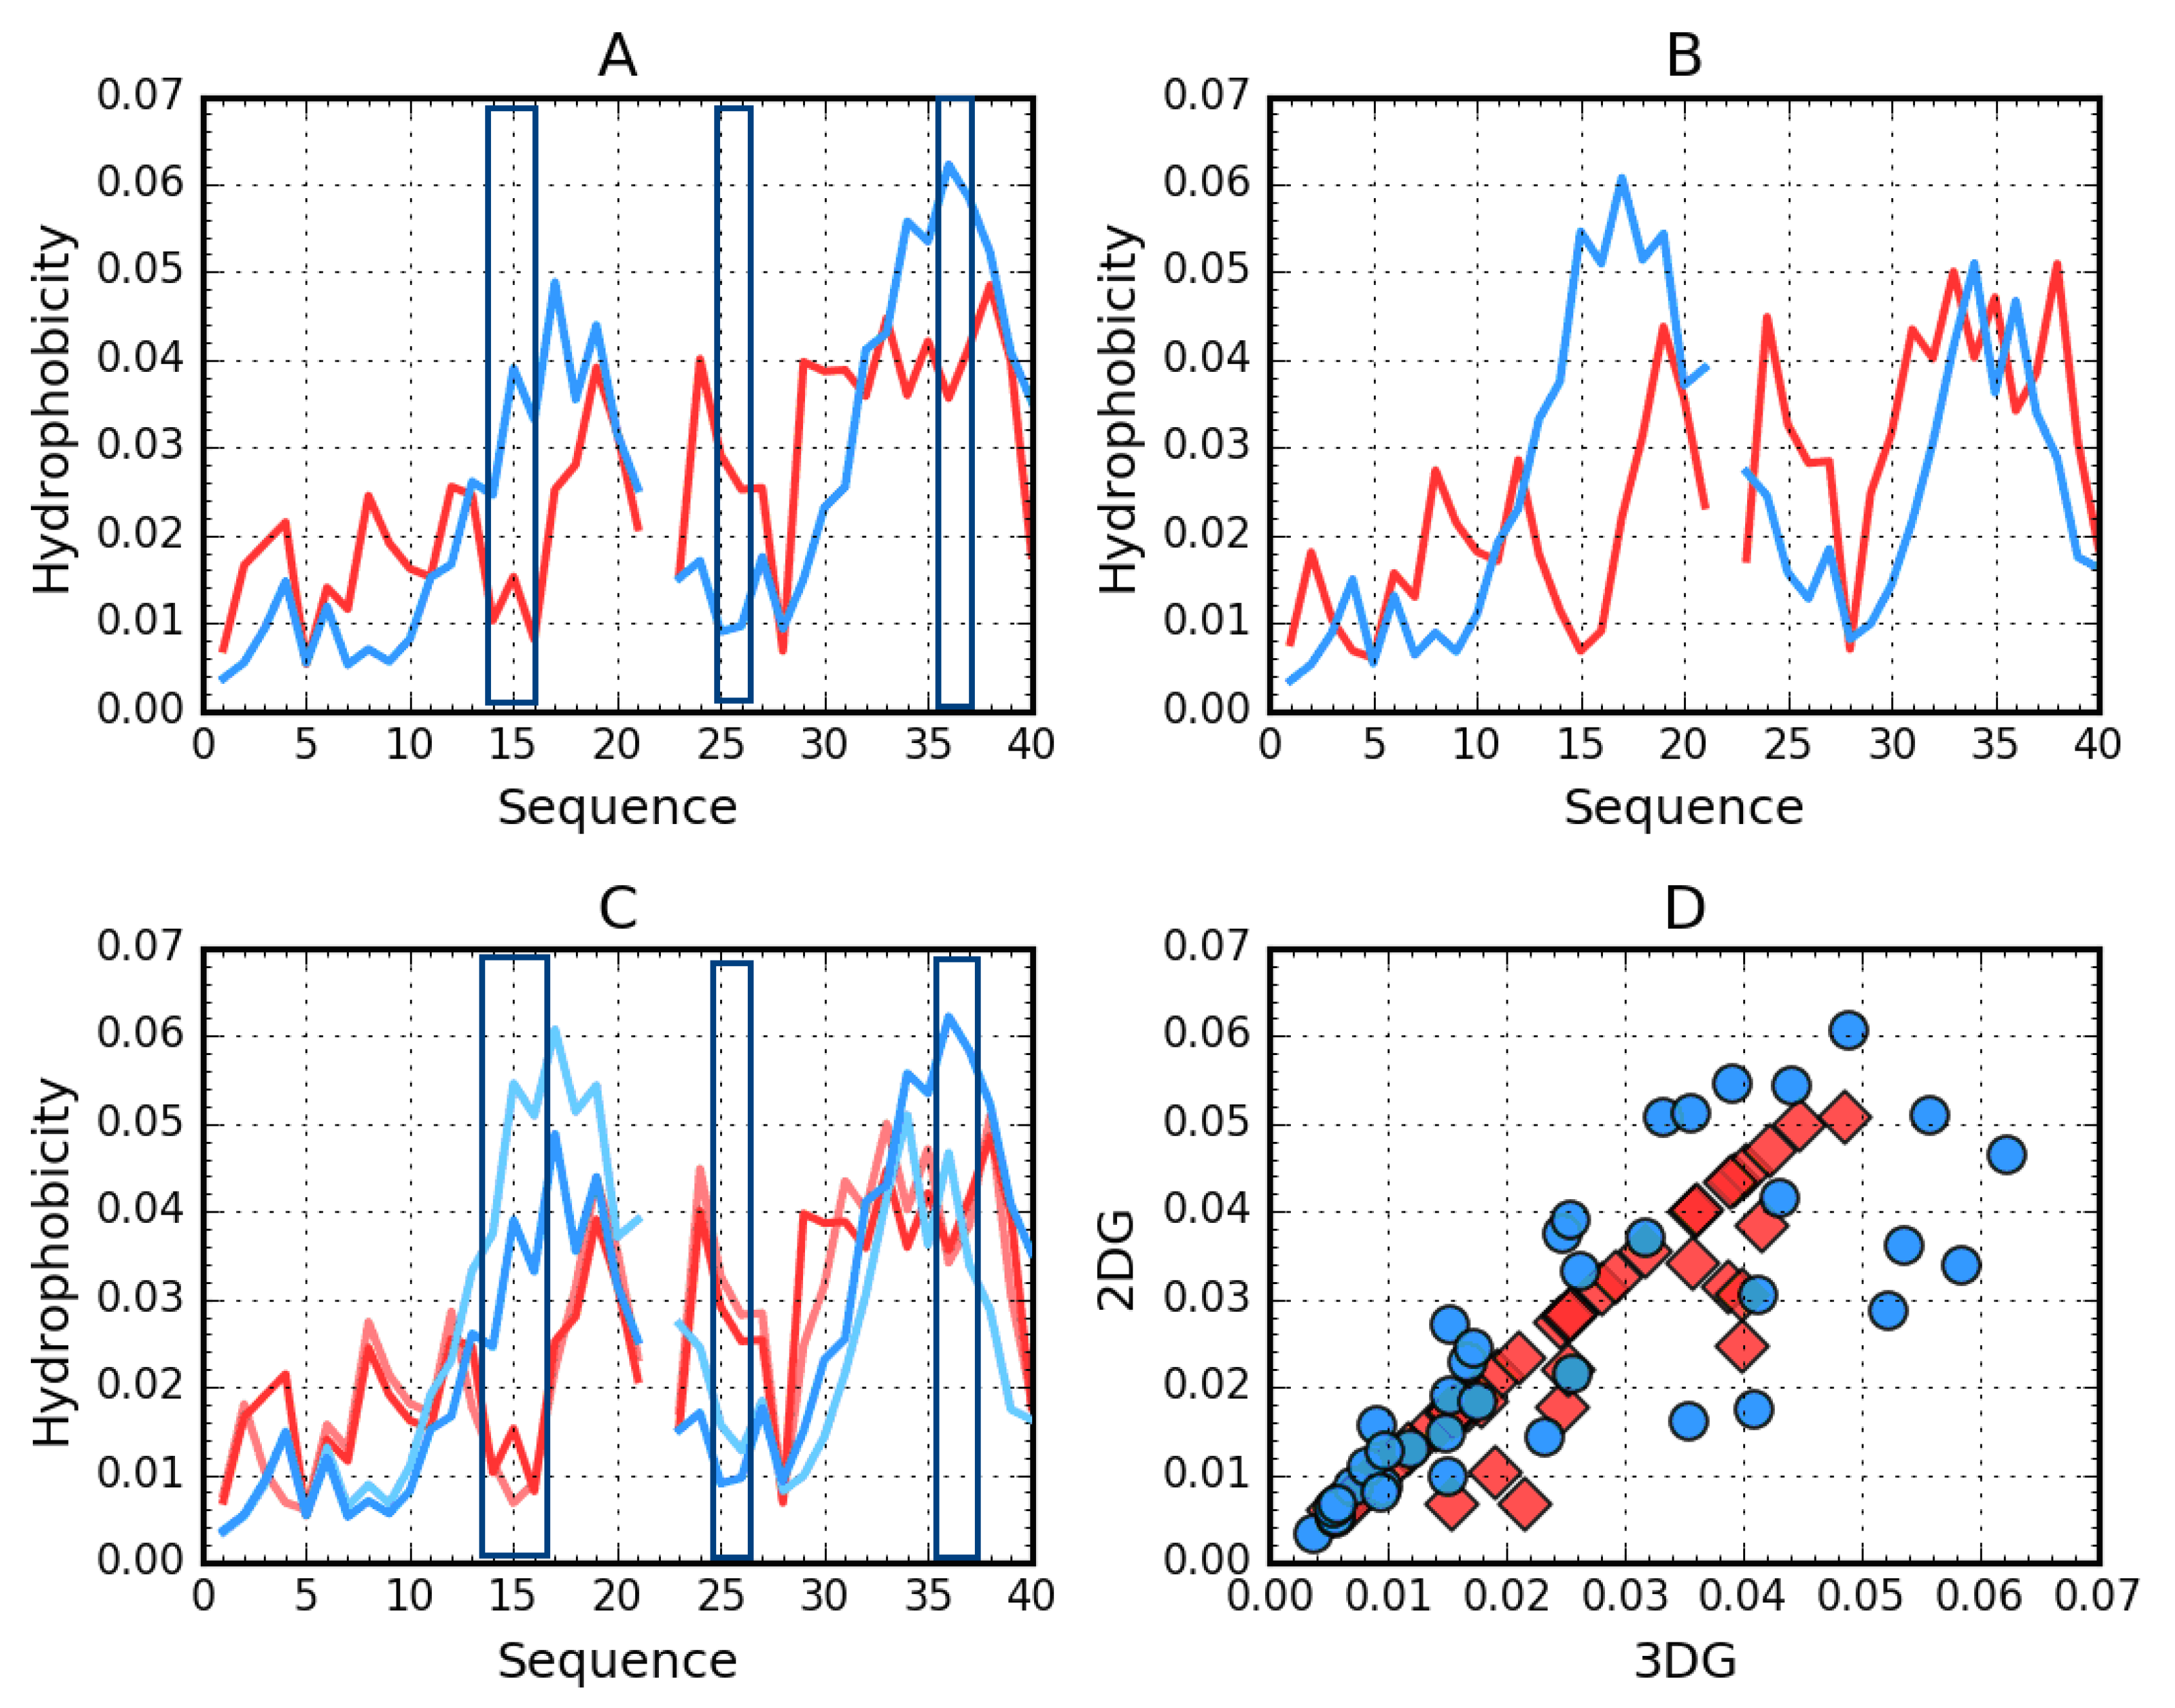
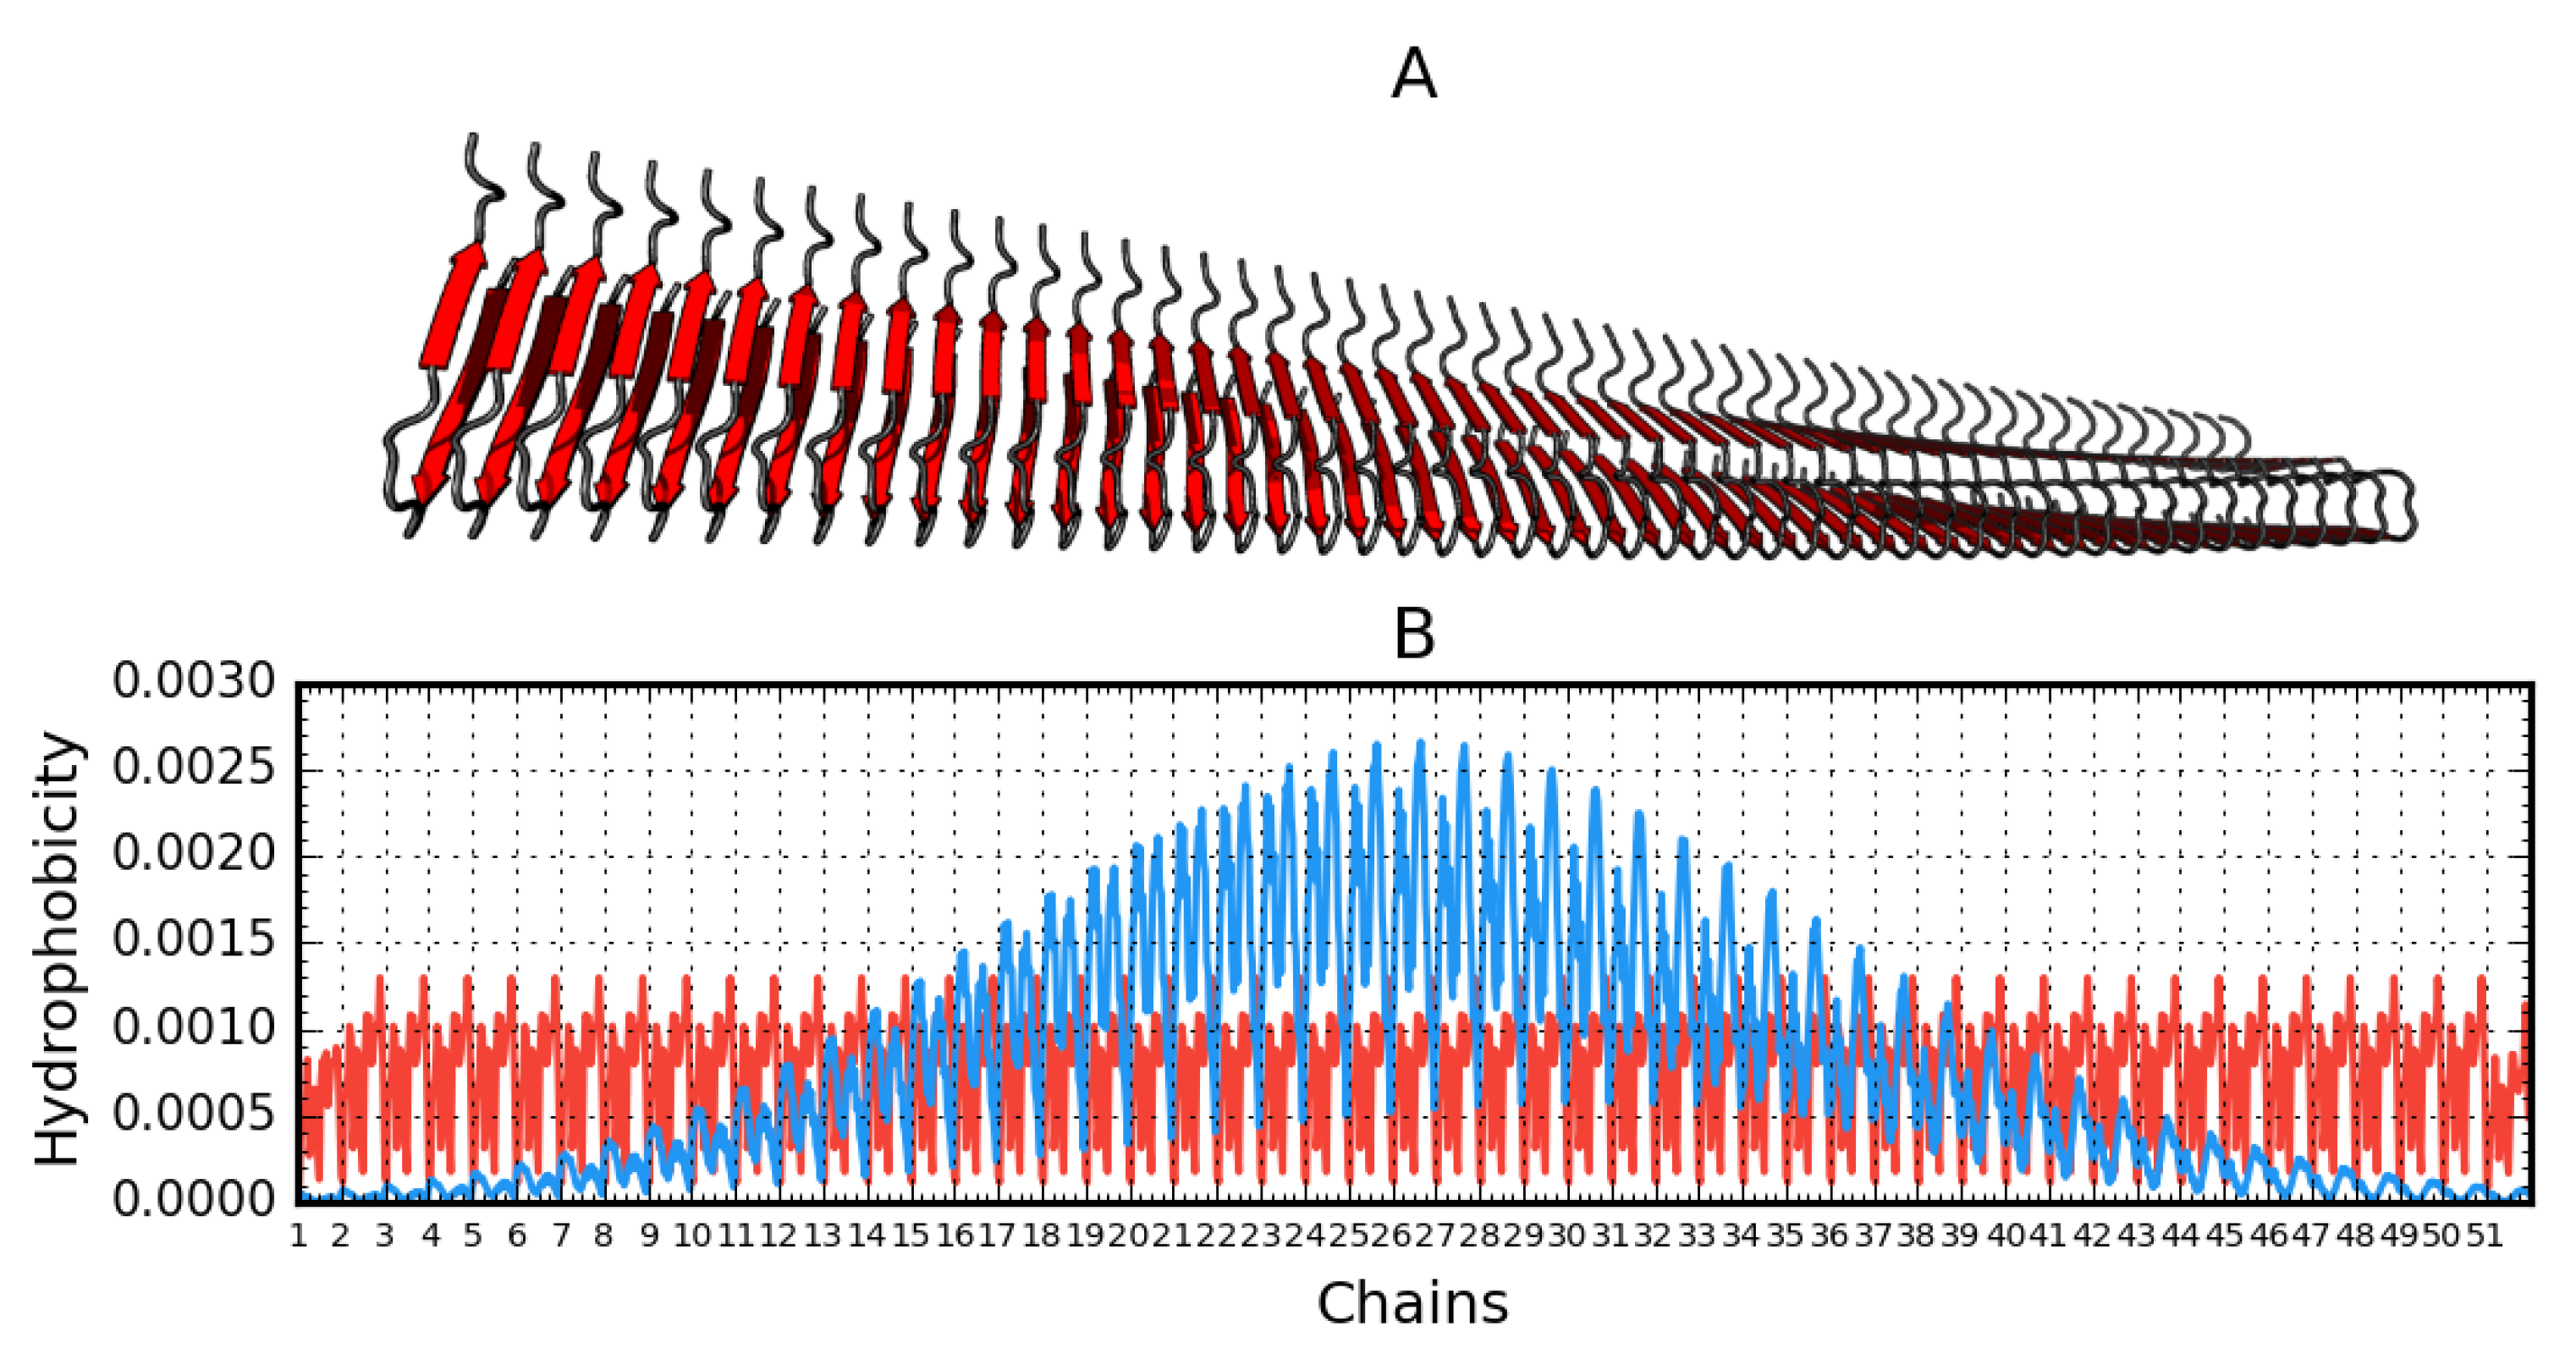
2.1. Superfibril Structure Analysis
2.2. Analysis of Protofibril Structure
3. Discussion
4. Materials and Methods
Data
5. Conclusions
Author Contributions
Funding
Acknowledgments
Conflicts of Interest
Abbreviations
| ImVA | IgG domain V |
References
- Chiti, F.; Dobson, C.M. Protein misfolding, functional amyloid, and human disease. Annu. Rev. Biochem. 2006, 75, 333–366. [Google Scholar] [CrossRef] [PubMed] [Green Version]
- Jarrett, J.T.; Lansbury, P.T., Jr. Seeding “one-dimensional crystallization” of amyloid: A pathogenic mechanism in Alzheimer’s disease and scrapie? Cell 1993, 73, 1055–1058. [Google Scholar] [CrossRef]
- Lomakin, A.; Chung, D.S.; Benedek, G.B.; Kirschner, D.A.; Teplow, D.B. On the nucleation and growth of amyloid beta-protein fibrils: Detection of nuclei and quantitation of rate constants. Proc. Natl. Acad. Sci. USA 1996, 93, 1125–1129. [Google Scholar] [CrossRef] [PubMed] [Green Version]
- Bemporad, F.; Chiti, F. Protein misfolded oligomers: Experimental approaches, mechanism of formation, and structure-toxicity relationships. Chem. Biol. 2012, 19, 315–327. [Google Scholar] [CrossRef] [PubMed] [Green Version]
- Tjernberg, L.; Hosia, W.; Bark, N.; Thyberg, J.; Johansson, J. Charge attraction and beta propensity are necessary for amyloid fibril formation from tetrapeptides. J. Biol. Chem. 2002, 277, 43243–43246. [Google Scholar] [CrossRef] [Green Version]
- Kim, W.; Hecht, M.H. Generic hydrophobic residues are sufficient to promote aggregation of the Alzheimer’s Abeta42 peptide. Proc. Natl. Acad. Sci. USA 2006, 103, 15824–15829. [Google Scholar] [CrossRef] [Green Version]
- Canet, D.; Last, A.M.; Tito, P.; Sunde, M.; Spencer, A.; Archer, D.B.; Redfield, C.; Robinson, C.V.; Dobson, C.M. Local cooperativity in the unfolding of an amyloidogenic variant of human lysozyme. Nat. Struct. Biol. 2002, 9, 308–315. [Google Scholar] [CrossRef]
- De Simone, A.; Dhulesia, A.; Soldi, G.; Vendruscolo, M.; Hsu, S.T.; Chiti, F.; Dobson, C.M. Experimental free energy surfaces reveal the mechanisms of maintenance of protein solubility. Proc. Natl. Acad. Sci. USA 2011, 108, 21057–21062. [Google Scholar] [CrossRef] [Green Version]
- Xiong, H.; Buckwalter, B.L.; Shieh, H.M.; Hecht, M.H. Periodicity of polar and nonpolar amino acids is the major determinant of secondary structure in self-assembling oligomeric peptides. Proc. Natl. Acad. Sci. USA 1995, 92, 6349–6353. [Google Scholar] [CrossRef] [PubMed] [Green Version]
- Udgaonkar, J.B. Polypeptide chain collapse and protein folding. Arch. Biochem. Biophys. 2013, 531, 24–33. [Google Scholar] [CrossRef] [PubMed]
- de Groot, N.S.; Aviles, F.X.; Vendrell, J.; Ventura, S. Mutagenesis of the central hydrophobic cluster in Abeta42 Alzheimer’s peptide. Side-chain properties correlate with aggregation propensities. Febs. J. 2006, 273, 658–668. [Google Scholar] [CrossRef] [PubMed]
- Uversky, V.N.; Dunker, A.K. Understanding protein non-folding. Biochim. Biophys. Acta 2010, 1804, 1231–1264. [Google Scholar] [CrossRef] [PubMed] [Green Version]
- Frousios, K.K.; Iconomidou, V.A.; Karletidi, C.M.; Hamodrakas, S.J. Amyloidogenic determinants are usually not buried. BMC Struct. Biol. 2009, 9, 44. [Google Scholar] [CrossRef] [PubMed] [Green Version]
- Berman, H.M.; Westbrook, J.; Feng, Z.; Gilliland, G.; Bhat, T.N.; Weissig, H.; Shindyalov, I.N.; Bourne, P.E. The Protein Data Bank. Nucleic Acids Res. 2000, 28, 235–242. [Google Scholar] [CrossRef] [Green Version]
- Konieczny, L.; Bryliński, M.; Roterman, I. Gauss-function-Based model of hydrophobicity density in proteins. Silico Biol. 2006, 6, 15–22. [Google Scholar]
- Kalinowska, B.; Banach, M.; Konieczny, L.; Roterman, I. Application of Divergence Entropy to Characterize the Structure of the Hydrophobic Core in DNA Interacting Proteins. Entropy 2015, 17, 1477–1507. [Google Scholar] [CrossRef] [Green Version]
- Kalinowska, B.; Banach, M.; Wiśniowski, Z.; Konieczny, L.; Roterman, I. Is the hydrophobic core a universal structural element in proteins? J. Mol. Model. 2017, 23, 205. [Google Scholar] [CrossRef] [Green Version]
- Banach, M.; Konieczny, L.; Roterman, I. The Amyloid as a Ribbon-Like Micelle in Contrast to Spherical Micelles Represented by Globular Proteins. Molecules 2019, 24, 4395. [Google Scholar] [CrossRef] [Green Version]
- Xiao, Y.; Ma, B.; McElheny, D.; Parthasarathy, S.; Long, F.; Hoshi, M.; Nussinov, R.; Ishii, Y. Aβ(1-42) fibril structure illuminates self-recognition and replication of amyloid in Alzheimer’s disease. Nat. Struct. Mol. Biol. 2015, 22, 499–505. [Google Scholar] [CrossRef] [Green Version]
- Schütz, A.K.; Vagt, T.; Huber, M.; Ovchinnikova, O.Y.; Cadalbert, R.; Wall, J.; Güntert, P.; Böckmann, A.; Glockshuber, R.; Meier, B.H. Atomic-resolution three-dimensional structure of amyloid β fibrils bearing the Osaka mutation. Angew. Chem. Int. Ed. Engl. 2015, 54, 331–335. [Google Scholar] [CrossRef] [Green Version]
- Sgourakis, N.G.; Yau, W.M.; Qiang, W. Modeling an in-register, parallel “iowa” aβ fibril structure using solid-state NMR data from labeled samples with rosetta. Structure 2015, 23, 216–227. [Google Scholar] [CrossRef] [PubMed] [Green Version]
- Colvin, M.T.; Silvers, R.; Ni, Q.Z.; Can, T.V.; Sergeyev, I.; Rosay, M.; Donovan, K.J.; Michael, B.; Wall, J.; Linse, S.; et al. Atomic Resolution Structure of Monomorphic Aβ42 Amyloid Fibrils. J. Am. Chem. Soc. 2016, 138, 9663–9674. [Google Scholar] [CrossRef] [PubMed] [Green Version]
- Fitzpatrick, A.W.P.; Falcon, B.; He, S.; Murzin, A.G.; Murshudov, G.; Garringer, H.J.; Crowther, R.A.; Ghetti, B.; Goedert, M.; Scheres, S.H.W. Cryo-EM structures of tau filaments from Alzheimer’s disease. Nature 2017, 547, 185–190. [Google Scholar] [CrossRef] [PubMed] [Green Version]
- Tuttle, M.D.; Comellas, G.; Nieuwkoop, A.J.; Covell, D.J.; Berthold, D.A.; Kloepper, K.D.; Courtney, J.M.; Kim, J.K.; Barclay, A.M.; Kendall, A.; et al. Solid-state NMR structure of a pathogenic fibril of full-length human α-synuclein. Nat. Struct. Mol. Biol. 2016, 23, 409–415. [Google Scholar] [CrossRef]
- Swuec, P.; Lavatelli, F.; Tasaki, M.; Paissoni, C.; Rognoni, P.; Maritan, M.; Brambilla, F.; Milani, P.; Mauri, P.; Camilloni, C.; et al. Cryo-EM structure of cardiac amyloid fibrils from an immunoglobulin light chain AL amyloidosis patient. Nat. Commun. 2019, 10, 1269. [Google Scholar] [CrossRef] [Green Version]
- Levitt, M. A simplified representation of protein conformations for rapid simulation of protein folding. J. Mol. Biol. 1976, 104, 59–107. [Google Scholar] [CrossRef]
- Kullback, S.; Leibler, R.A. On Information and Sufficiency. Ann. Math. Stat. 1951, 22, 79–86. [Google Scholar] [CrossRef]
- Fabian, P.; Stapor, K.; Banach, M.; Ptak-Kaczor, M.; Konieczny, L.; Roterman, I. Alternative Hydrophobic Core in Proteins—The Effect of Specific Synergy. Symmetry 2020, 12, 273. [Google Scholar] [CrossRef] [Green Version]
- Dułak, D.; Gadzała, M.; Banach, M.; Roterman, I. Analysis of alternative conformations of the Aβ(1-40)amyloid protein. In From Globular Proteins to Amyoids; Roterman-Konieczna, I., Ed.; Elsevier: Amsterdam, The Netherlands; Oxford, UK; Cambridge, MA, USA, 2020; pp. 193–206. [Google Scholar]
- Roterman, I.; Dułak, D.; Gadzała, M.; Banach, M.; Konieczny, L. Structural analysis of the Aβ(11-42) amyloid fibril based on hydrophobicity distribution. J. Comput. Aided Mol. Des. 2019, 33, 665–675. [Google Scholar] [CrossRef] [Green Version]
- Dułak, D.; Gadzała, M.; Banach, M.; Ptak, M.; Wiśniowski, Z.; Konieczny, L.; Roterman, I. Filamentous Aggregates of Tau Proteins Fulfil Standard Amyloid Criteria Provided by the Fuzzy Oil Drop (FOD) Model. Int. J. Mol. Sci. 2018, 19, 2910. [Google Scholar] [CrossRef] [Green Version]
- Dułak, D.; Gadzała, M.; Banach, M.; Konieczny, L.; Roterman, I. Alternative Structures of α-Synuclein. Molecules 2020, 25, 600. [Google Scholar] [CrossRef] [PubMed] [Green Version]
- Banach, M.; Konieczny, L.; Roterman, I. Fuzzy oil drop model application–From globular proteins to amyloids. In Computational Methods to Study the Structure and Dynamics of Biomolecules and Biomolecular Processes. Springer Series on Bio- and Neurosystems 8; Liwo, J.A., Ed.; Springer Nature Switzerland AG, 2019; pp. 639–658. [Google Scholar] [CrossRef]
- Serpell, L.C. Alzheimer’s amyloid fibrils: Structure and assembly. Biochim. Biophys Acta 2000, 1502, 16–30. [Google Scholar] [CrossRef] [Green Version]
- Nimmrich, V.; Ebert, U. Is Alzheimer’s disease a result of presynaptic failure? Synaptic dysfunctions induced by oligomeric beta-amyloid. Rev. Neurosci. 2009, 20, 1–12. [Google Scholar] [CrossRef] [PubMed]
- Banach, M.; Roterman, I. Non-amyloid structure of the Aβ(1–42) polypeptide in presence of a permanent chaperone. In From Globular Proteins to Amyoids; Roterman-Konieczna, I., Ed.; Elsevier: Amsterdam, The Netherlands; Oxford, UK; Cambridge, MA, USA, 2020; pp. 135–136. [Google Scholar]
- Banach, M.; Konieczny, L.; Roterman, I. Protein-protein interaction encoded as an exposure of hydrophobic residues on the surface. In From Globular Proteins to Amyoids; Roterman-Konieczna, I., Ed.; Elsevier: Amsterdam, The Netherlands; Oxford, UK; Cambridge, MA, USA, 2020; pp. 79–80. ISBN 978-0-08-102981-7. [Google Scholar]
- de Rosa, M.; Bemporad, F.; Pellegrino, S.; Chiti, F.; Bolognesi, M.; Ricagno, S. Edge strand engineering prevents native-like aggregation in Sulfolobus solfataricus acylphosphatase. FEBS J. 2014, 281, 4072–4084. [Google Scholar] [CrossRef]
- Fabian, P.; Stapor, K.; Roterman, I. Model of Early Stage Intermediate in Respect to Its Final Structure. Biomolecules 2019, 9, 866. [Google Scholar] [CrossRef] [Green Version]


| Protein | Chains | RD | σX | σY | σZ |
|---|---|---|---|---|---|
| Aβ(1-40) (2MVX) Aβ(15–40) (2MPZ) Aβ(11–42)S (5KK3) TAU (5O3L) | A-J (F) A-a (N) A-R (J) A-J (F) | 0.603 0.613 0.571 0.626 | 12.393 15.496 13.797 25.939 | 14.480 15.039 12.635 13.827 | 8.6907 14.156 14.690 11.118 |
| Protein | RD | Interface | Eliminated |
|---|---|---|---|
| Aβ(1–40) (2MVX) Aβ(15–40) (2MPZ) Aβ(11–42)S (5KK3) TAU (5O3L) | 0.557 0.443 0.592 0.388 | 3,4,13,15,28–30,37–40 28,29,31,38,40 13,15,17,34–37 331–336,338 | 15 – 15,17,34,35 – |
| Protein | Chains | RD 3DG 3DG * 2DG | RDe 3DG 3DG * 2DG | Number of Residues Eliminated to Reach RD Value Below 0.5 |
|---|---|---|---|---|
| Aβ(1–40) (2MVX) | C, H | 0.578 0.623 0.576 | 0.498 0.499 0.487 | 6 11 6 |
| Aβ(15–40) (2MPZ) | N, O, P | 0.630 0.584 0.644 | 0.498 0.497 0.481 | 3 5 4 |
| Aβ(11–42)S (5KK3) | E, N | 0.607 0.536 0.609 | 0.489 0.495 0.494 | 4 4 4 |
| TAU (5O3L) | E, F | 0.666 0.637 0.655 | 0.485 0.497 0.495 | 28 18 22 |
| Protein | Chains | RD | σX | σY | σZ |
|---|---|---|---|---|---|
| Aβ(11–42) (2MXU) | A-L (F) | 0.655 | 10.06 | 13.61 | 13.84 |
| Aβ(1–40) (2MVX) | A, B, C, D, E (C) | 0.619 | 13.87 | 12.42 | 8.34 |
| Aβ(15–40) (2MPZ) | B, E, H, K, N, Q, T, W, Z | 0.683 | 12.04 | 10.61 | 11.13 |
| Aβ(11–42)S (5KK3) | A-I (E) | 0.525 | 12.38 | 10.46 | 13.98 |
| TAU (5O3L) | A, C, E, G, I (E) | 0.604 | 14.65 | 15.42 | 8.28 |
| ASyn (2N0A) | A- J (E) | 0.576 | 18.94 | 18.7 | 14.14 |
| 30–100 | 0.486 | 13.48 | 11.88 | 14.19 | |
| 47–100 | |||||
| ImVA (6HUD) | A-E (C) | 0.724 | 15.62 | 12.5 | 9.03 |
| Aβ(15–40)51 (2MPZ) | 51 chains | 0.847 | 15.1 | 14.76 | 47.11 |
| Protein | Chain | RD | σX | σY | σZ |
|---|---|---|---|---|---|
| 3DG | |||||
| 2DG | |||||
| Aβ(11–42) (2MXU) | F | 0.441 | 9.289 | 11.829 | 4.625 – |
| 0.445 | 9.289 | 11.829 | |||
| Aβ(1–40) (2MVX) | C | 0.609 | 13.639 | 12.227 | 4.961 |
| 0.603 | 13.639 | 12.227 | – | ||
| Aβ(15–40) (2MPZ) | N | 0.667 | 11.195 | 7.515 | 4.921 |
| 0.669 | 11.195 | 7.515 | – | ||
| Aβ(11–42)S (5KK3) | E | 0.547 | 9.912 | 9.972 | 4.664 |
| 0.548 | 9.912 | 9.972 | – | ||
| TAU (5O3L) | E | 0.602 | 14.304 | 15.102 | 5.121 |
| 0.605 | 14.304 | 15.102 | – | ||
| Asyn (2N0A) | E (30–100) | 0.548 | 16.52 | 17.019 | 5.165 |
| 0.551 | 16.52 | 17.019 | – | ||
| E (47–100) | 0.375 | 13.092 | 11.57 | 4.703 | |
| 0.378 | 13.092 | 11.57 | – | ||
| ImVA (6HUD) | C | 0.72 | 15.517 | 12.098 | 5.768 |
| 0.729 | 15.517 | 12.098 | – |
| ASyn (2N0A) 30–1000.527 | 0.487 | 9 | |
|---|---|---|---|
| 0.441 | |||
| 0.551 | 0.484 | 9 | |
| Aβ(15–40)51 (2MPZ*) | 0.505 | 0.479 | 38 |
| PDB ID | Name | Structure | Number of layers | Ref |
|---|---|---|---|---|
| 2MXU | Aβ(11–42) | Protofibril | 12 | [20] |
| 2MVX | Aβ(1–40) E22Δ | Superfibril (2) | 5 | [21] |
| 2MPZ | Aβ(15–40)D23N | Superfibril (3) | 9 | [22] |
| 5KK3 | Aβ(11–42)S | Superfibril (2) | 9 | [23] |
| 5O3L | TAU | Superfibril (2) | 5 | [24] |
| 2N0A | ASyn | Protofibril | 10 | [25] |
| 30–100 | 30–100 | 10 | ||
| 47–100 | 47–100 | 10 | ||
| 6HUD | IgG V domain ImVA | Protofibril | 5 | |
| 2MPZ* | Aβ(15–40)51 D23N* | Protofibril | 51 | [26] |
© 2020 by the authors. Licensee MDPI, Basel, Switzerland. This article is an open access article distributed under the terms and conditions of the Creative Commons Attribution (CC BY) license (http://creativecommons.org/licenses/by/4.0/).
Share and Cite
Fabian, P.; Banach, M.; Stapor, K.; Konieczny, L.; Ptak-Kaczor, M.; Roterman, I. The Structure of Amyloid Versus the Structure of Globular Proteins. Int. J. Mol. Sci. 2020, 21, 4683. https://0-doi-org.brum.beds.ac.uk/10.3390/ijms21134683
Fabian P, Banach M, Stapor K, Konieczny L, Ptak-Kaczor M, Roterman I. The Structure of Amyloid Versus the Structure of Globular Proteins. International Journal of Molecular Sciences. 2020; 21(13):4683. https://0-doi-org.brum.beds.ac.uk/10.3390/ijms21134683
Chicago/Turabian StyleFabian, Piotr, Mateusz Banach, Katarzyna Stapor, Leszek Konieczny, Magdalena Ptak-Kaczor, and Irena Roterman. 2020. "The Structure of Amyloid Versus the Structure of Globular Proteins" International Journal of Molecular Sciences 21, no. 13: 4683. https://0-doi-org.brum.beds.ac.uk/10.3390/ijms21134683