Graphene Quantum Dots’ Surface Chemistry Modulates the Sensitivity of Glioblastoma Cells to Chemotherapeutics

 , , ,
, , ,  ,
, 
Abstract
:
1. Introduction
2. Results
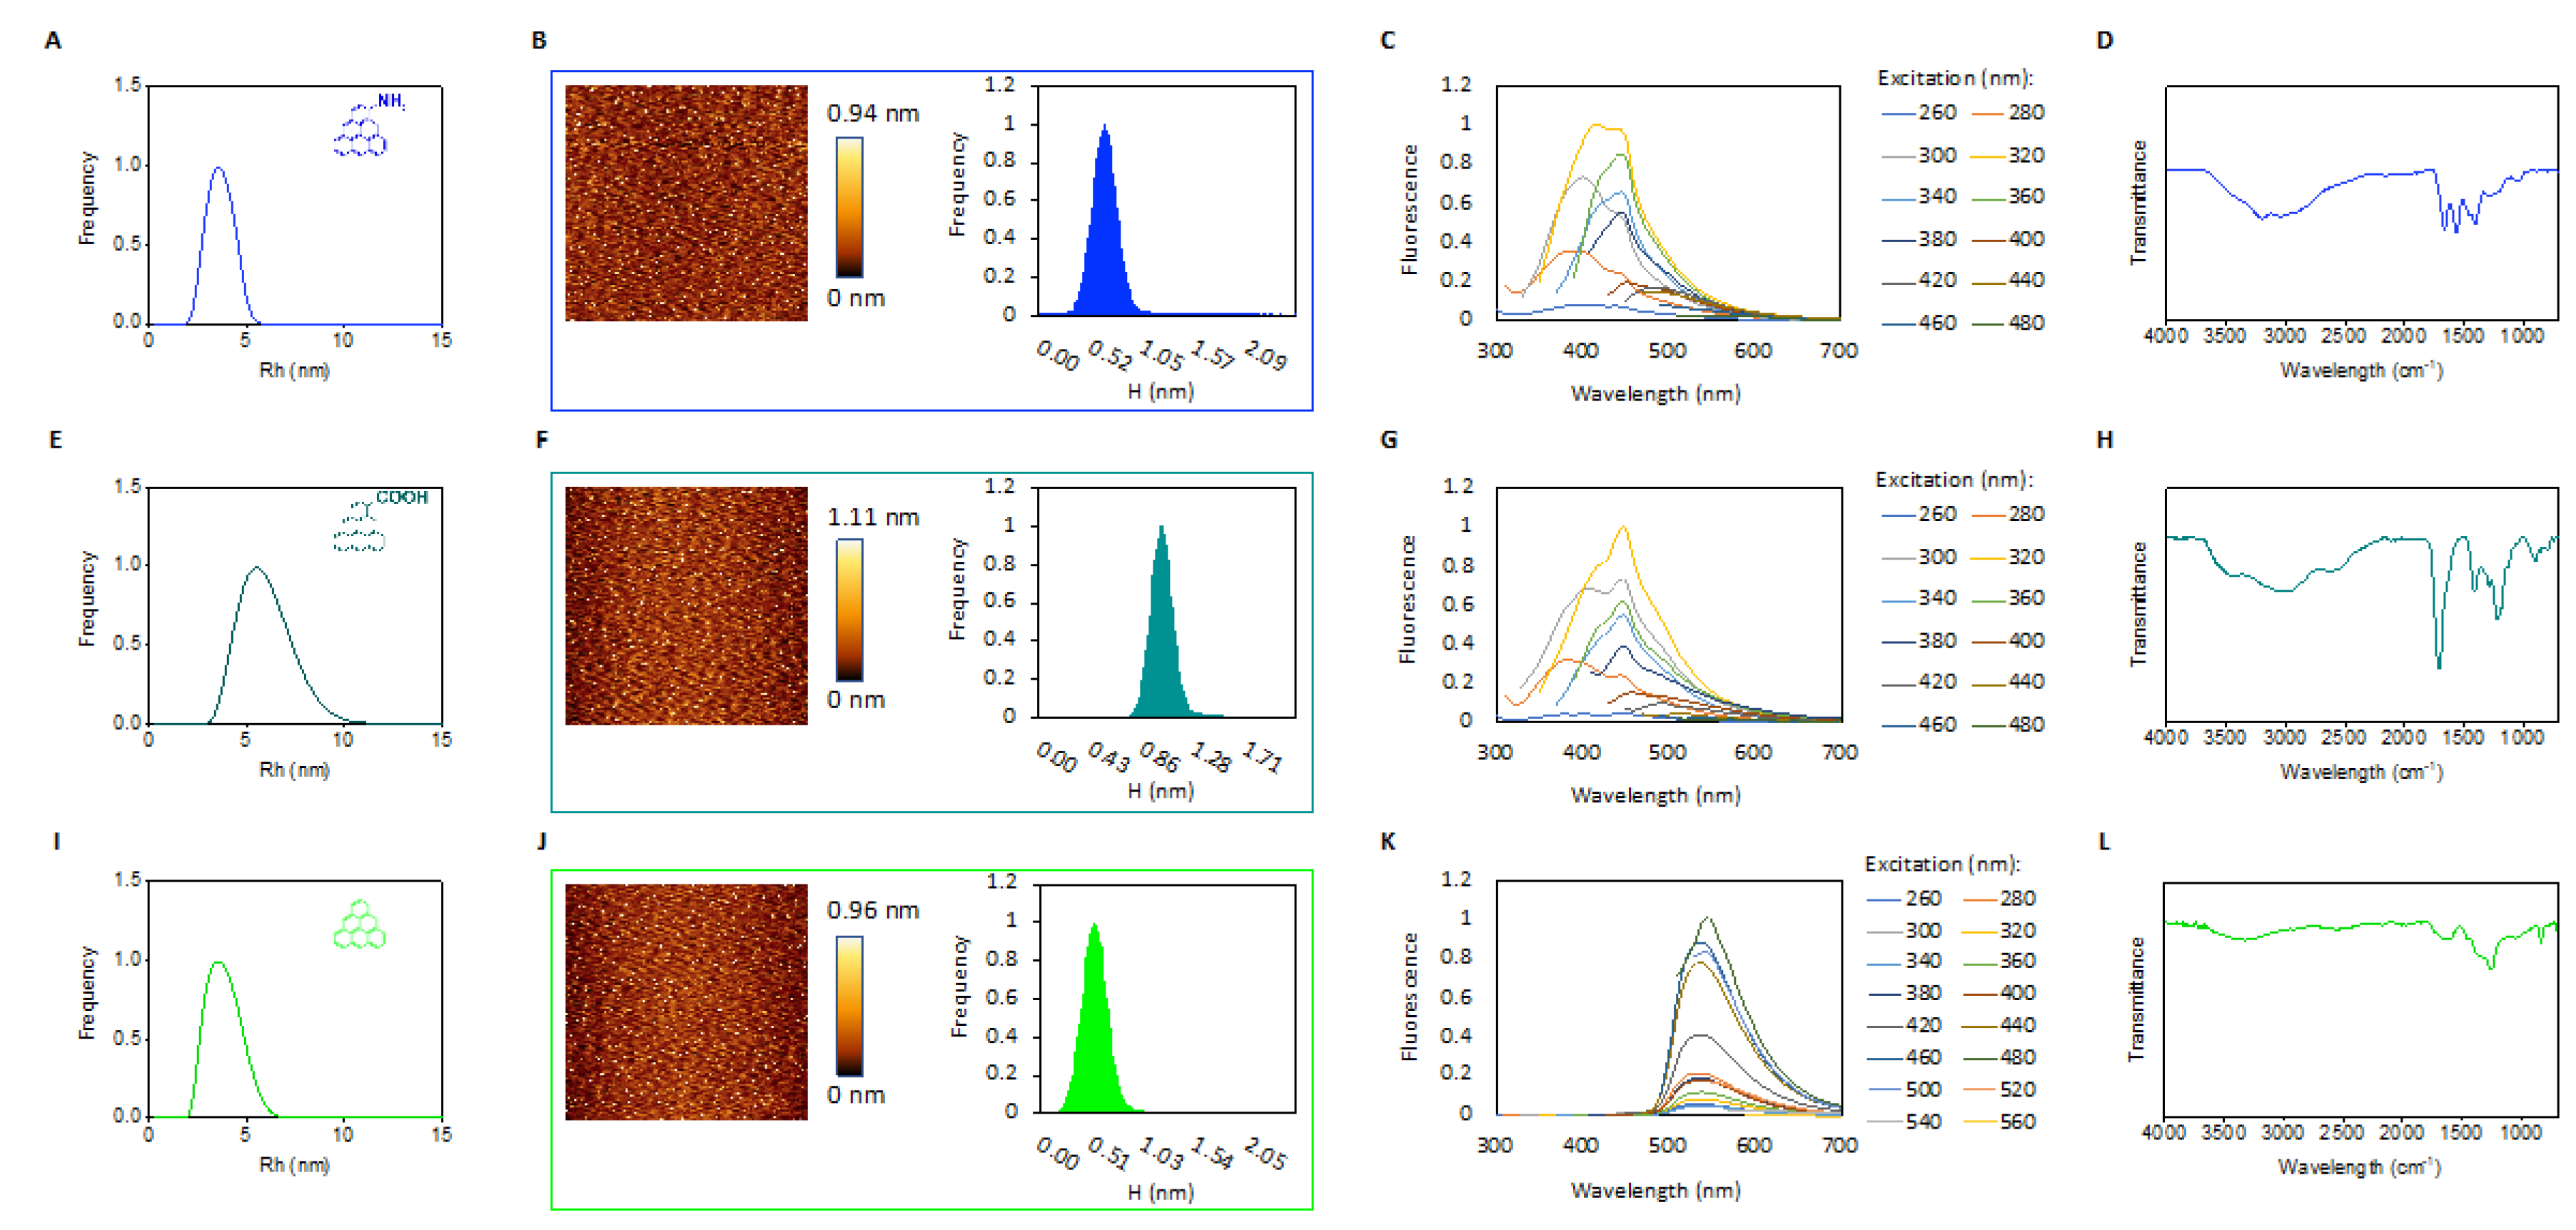
2.1. Characterization of GQDs
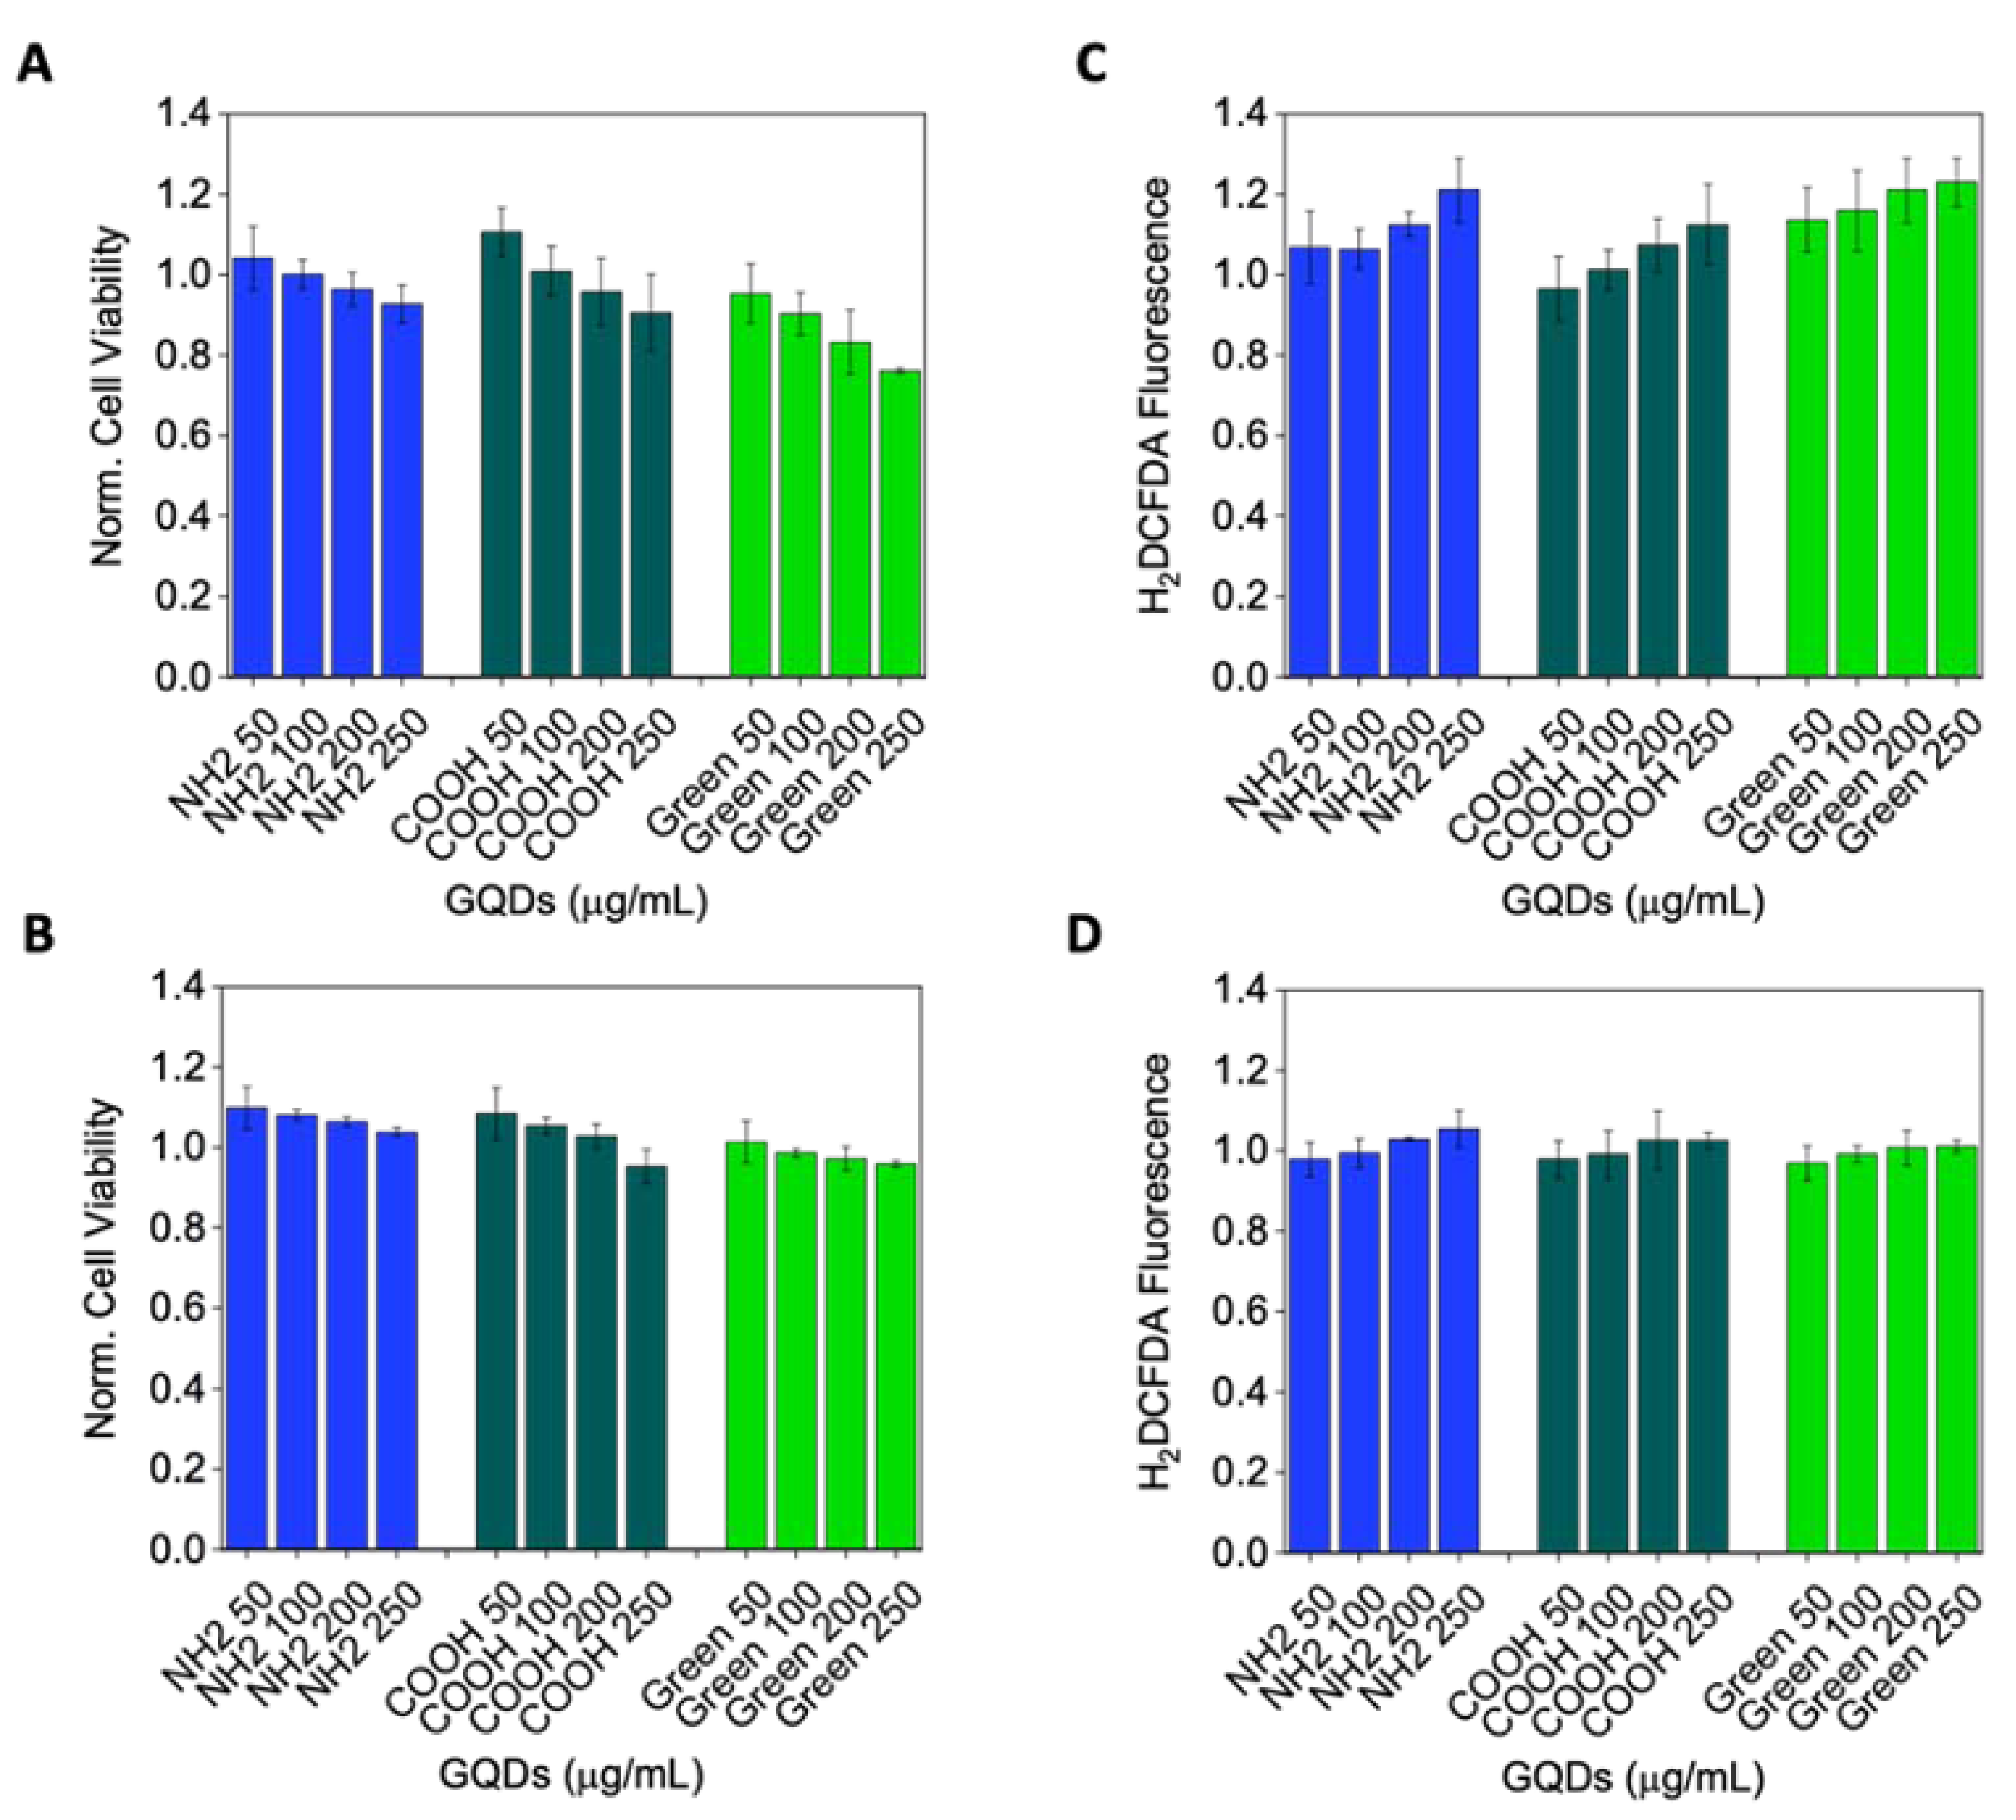
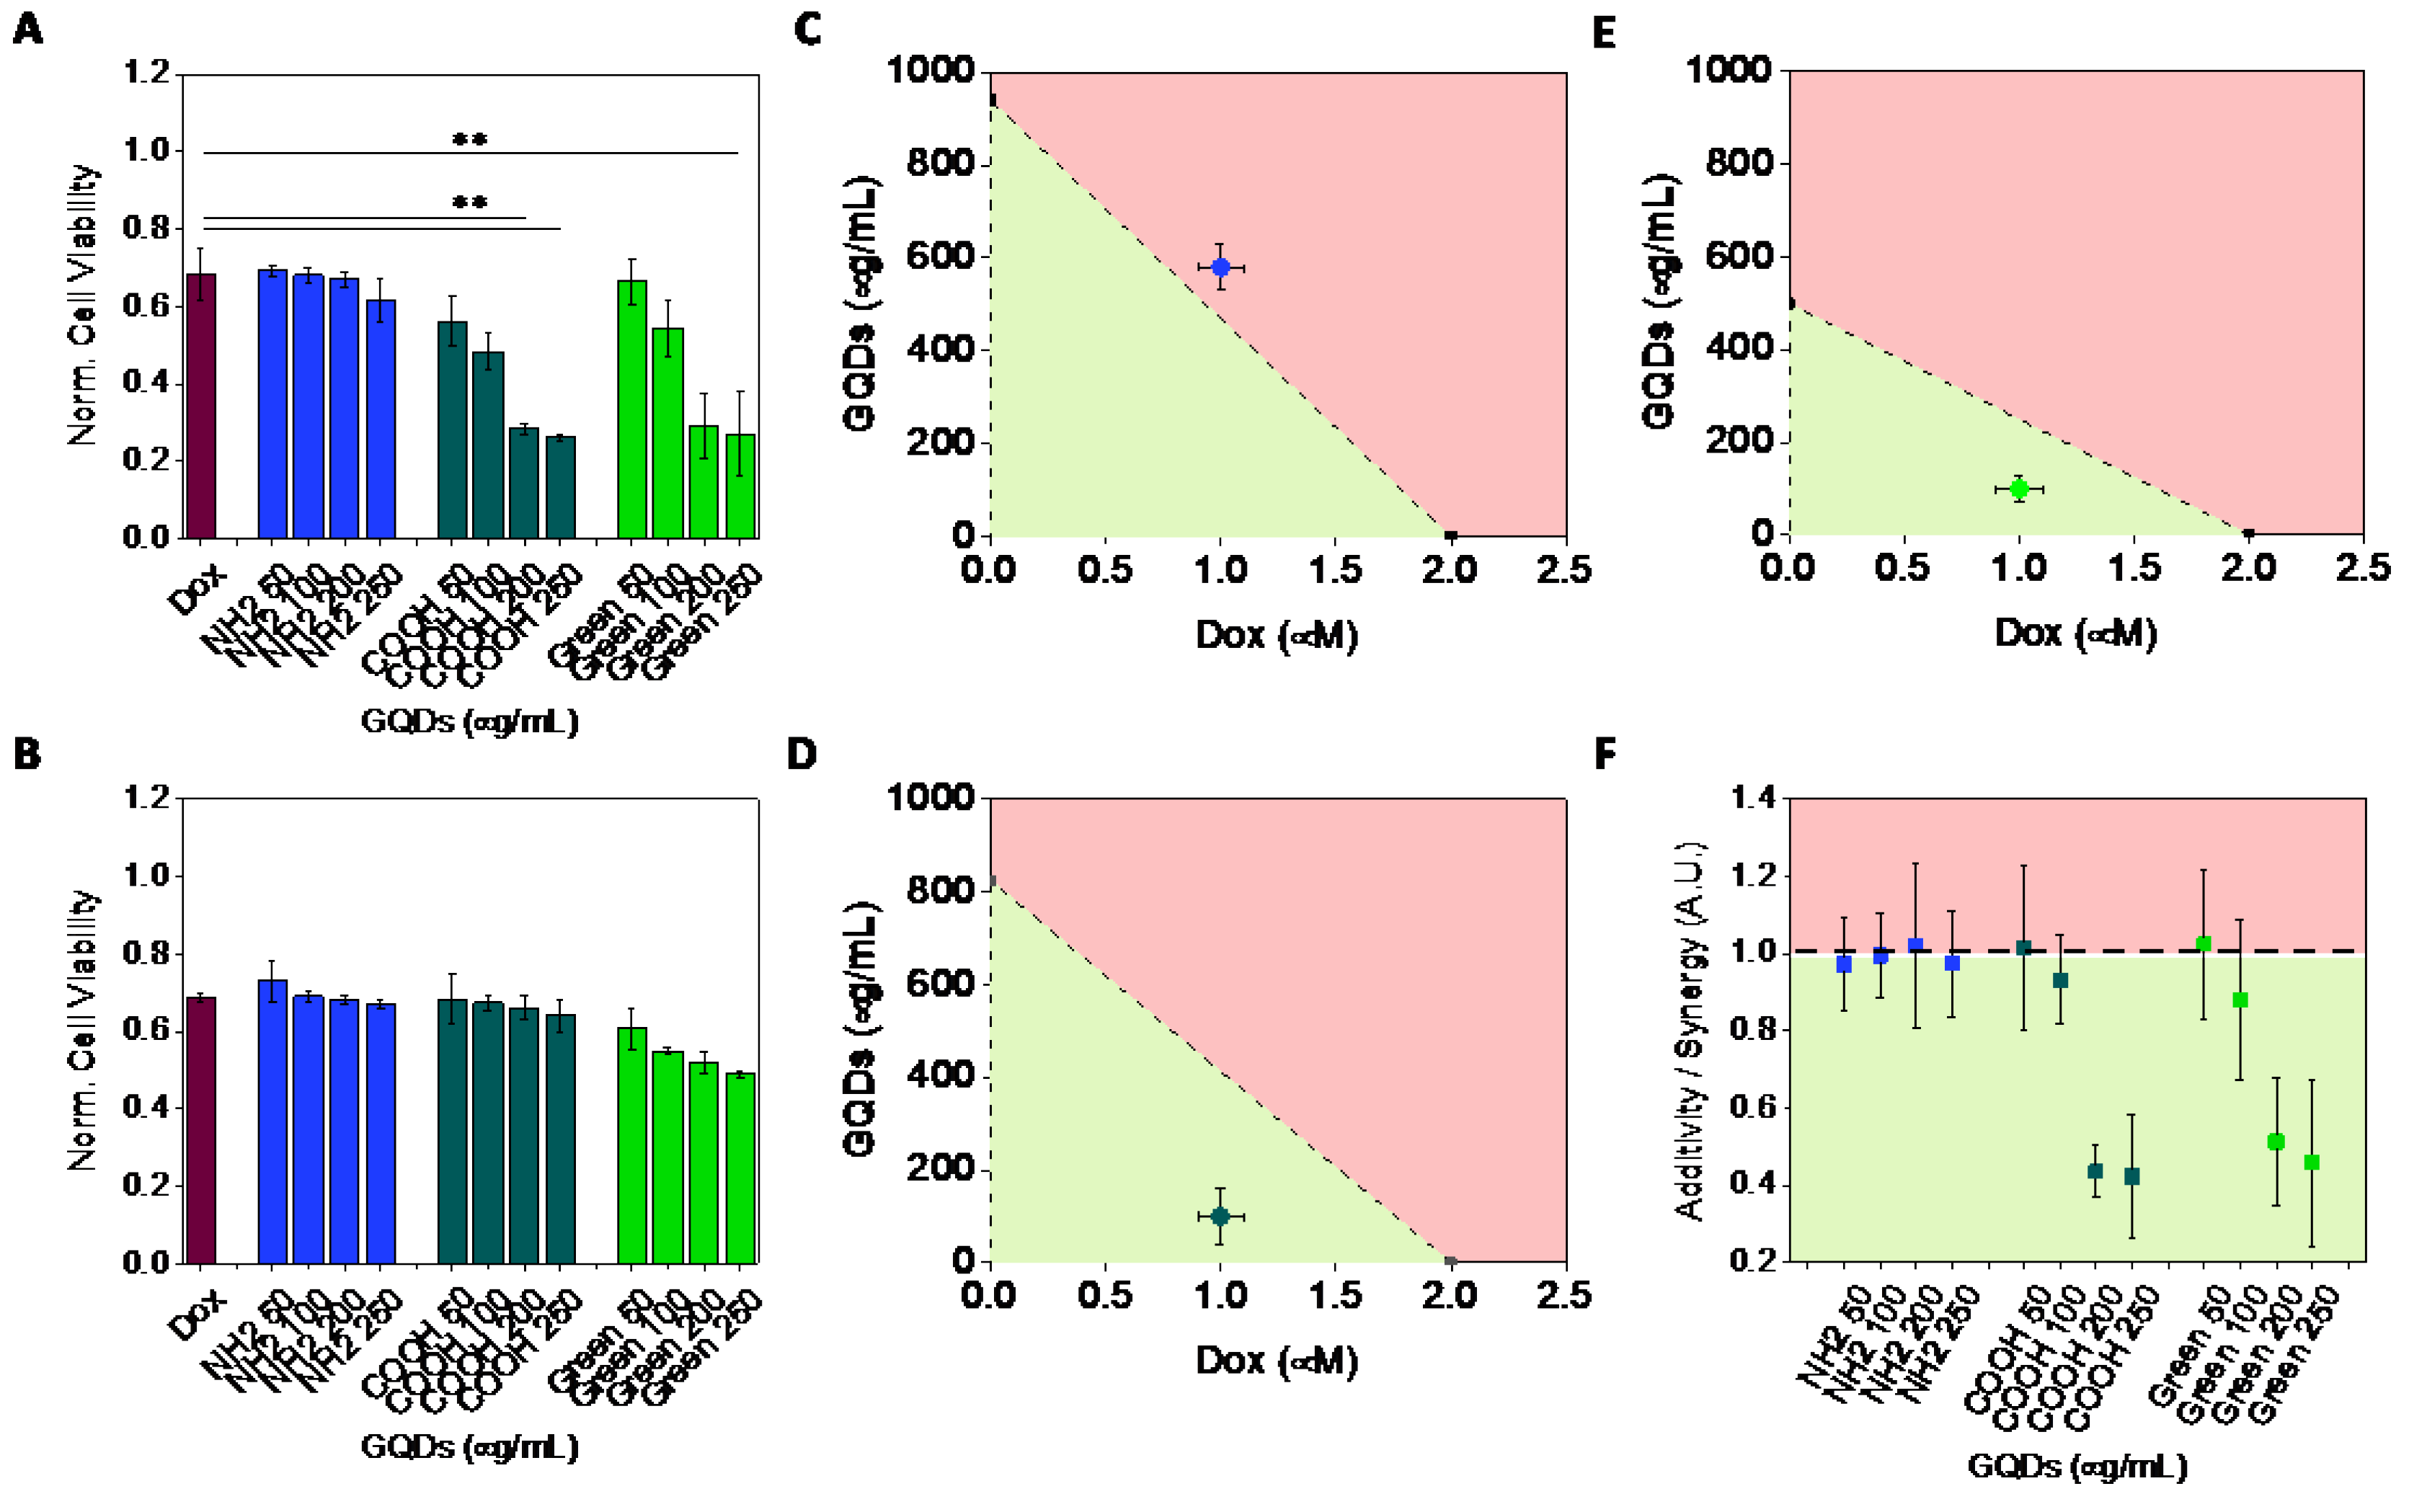
2.2. Cytotoxicity
2.3. Synergy of GQDs and Dox
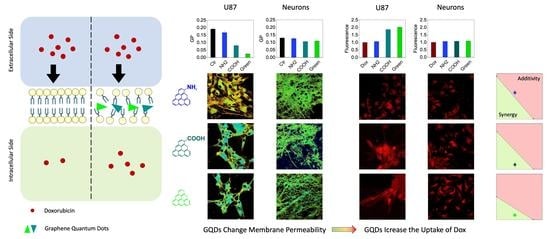
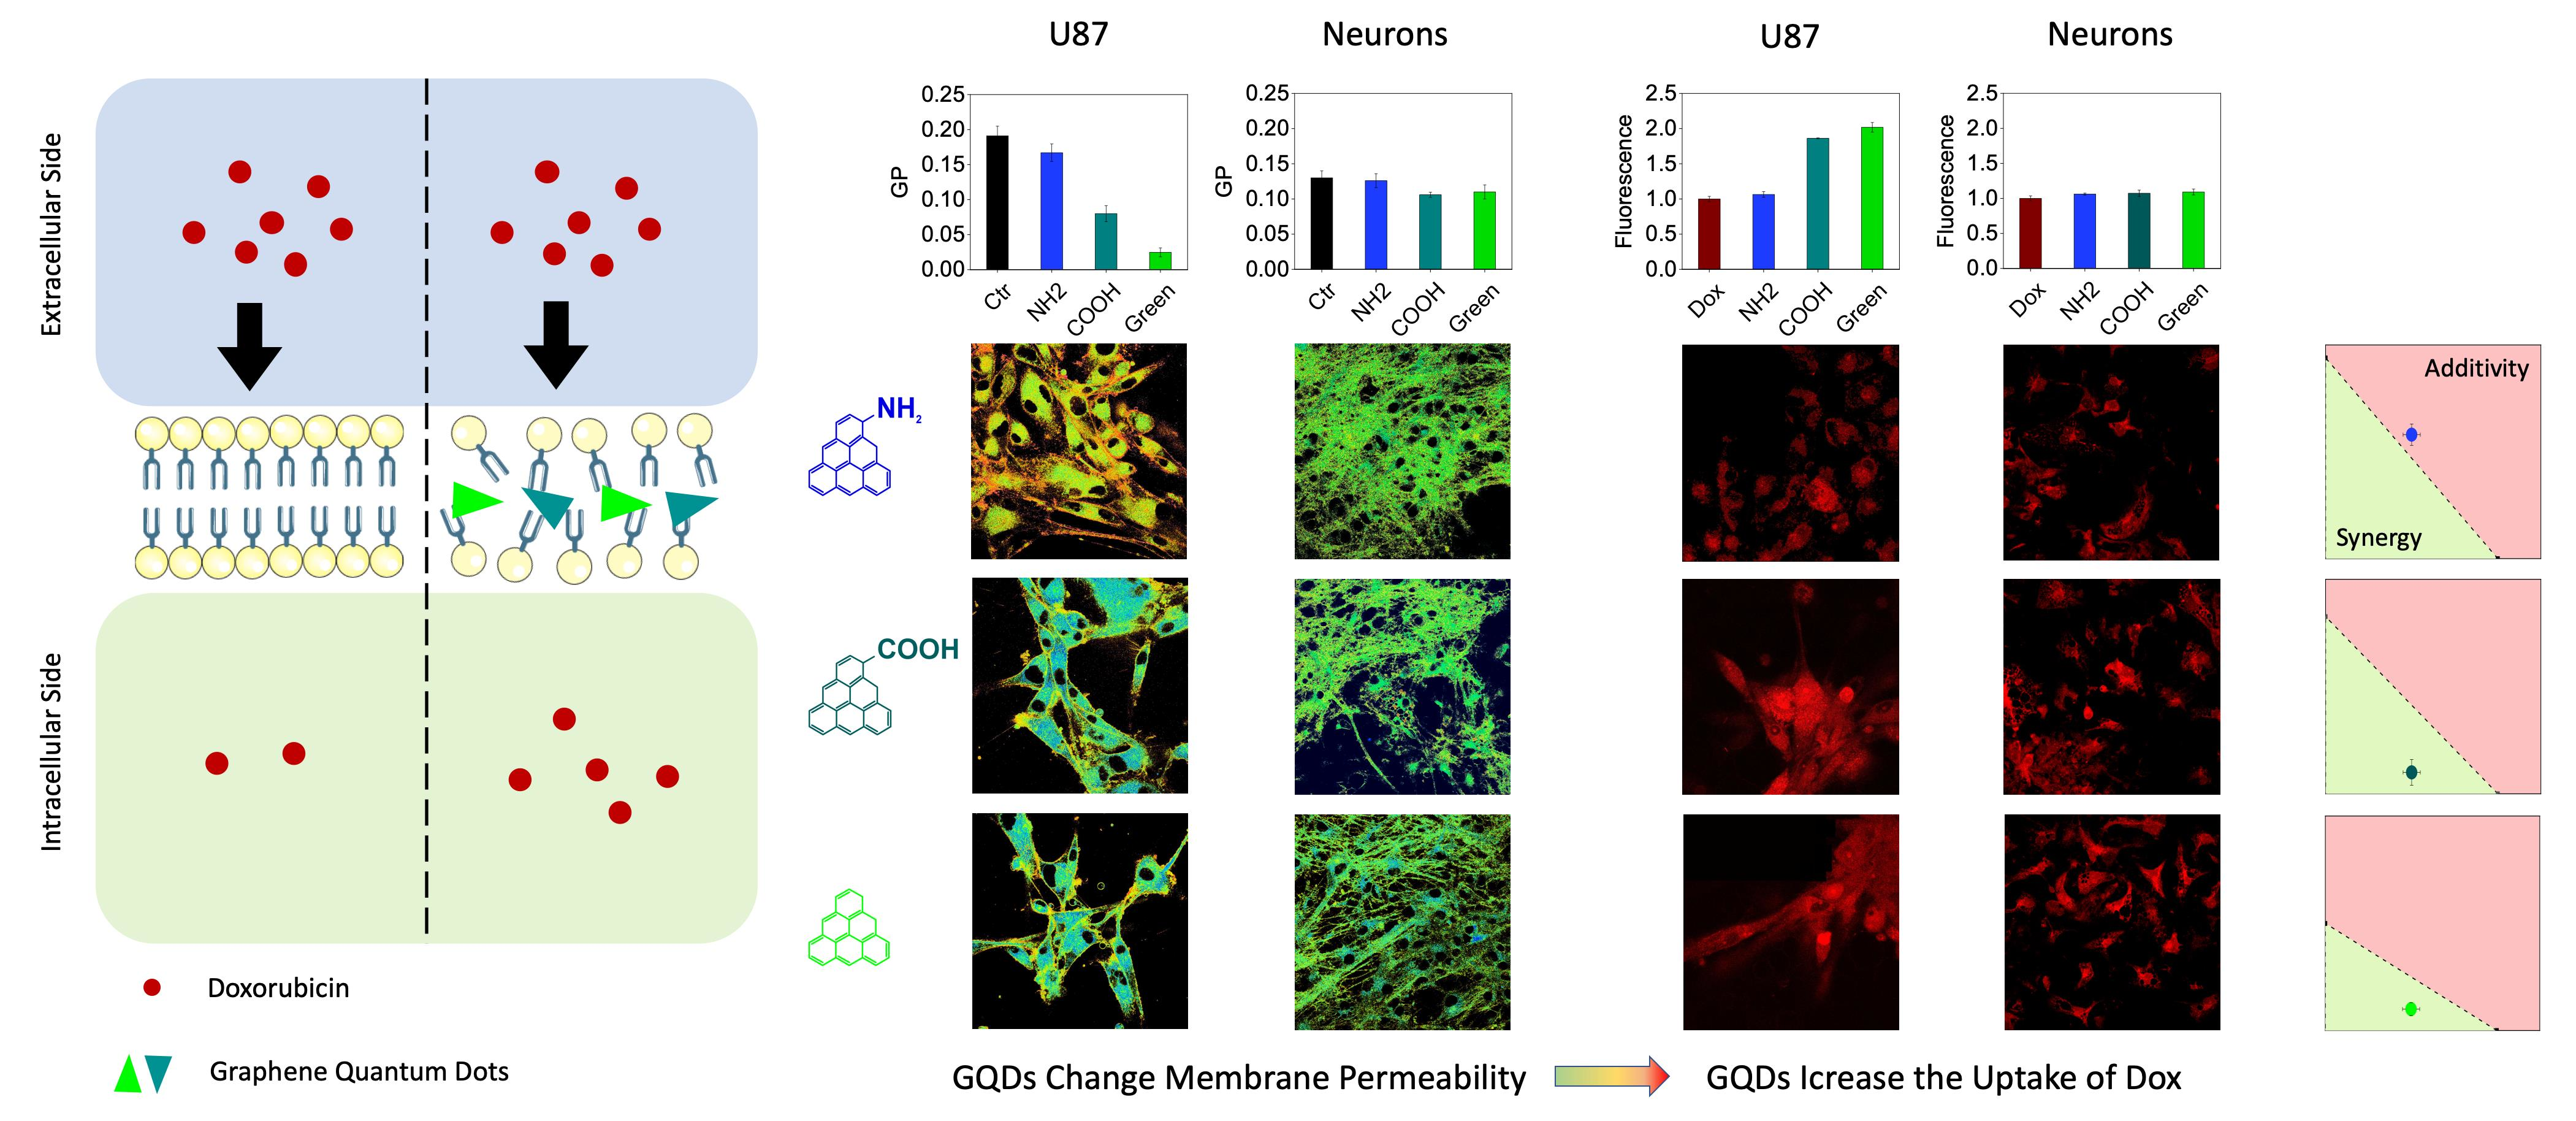
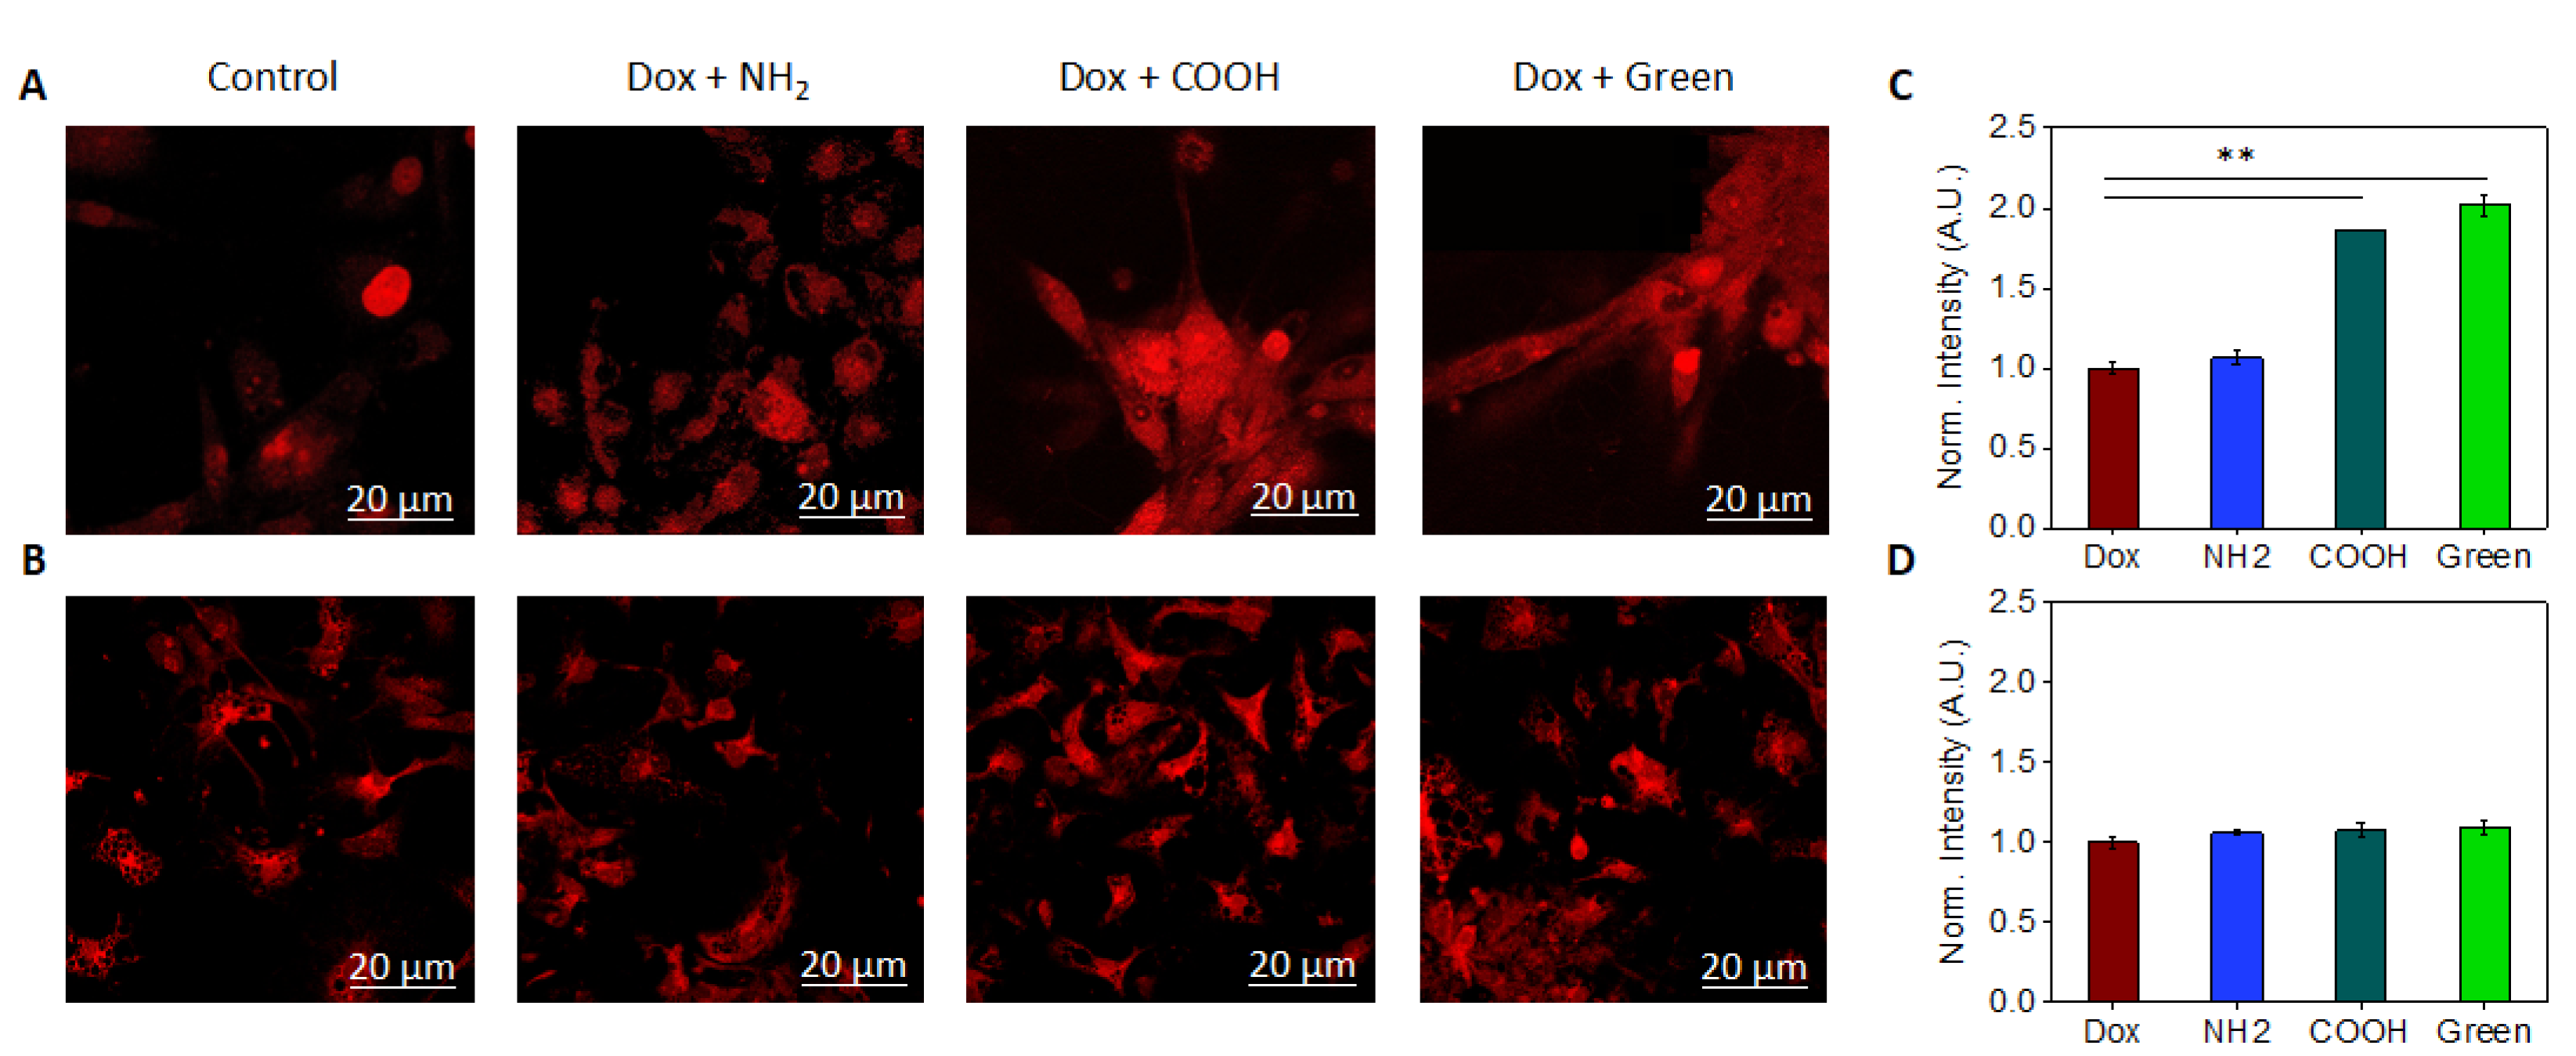
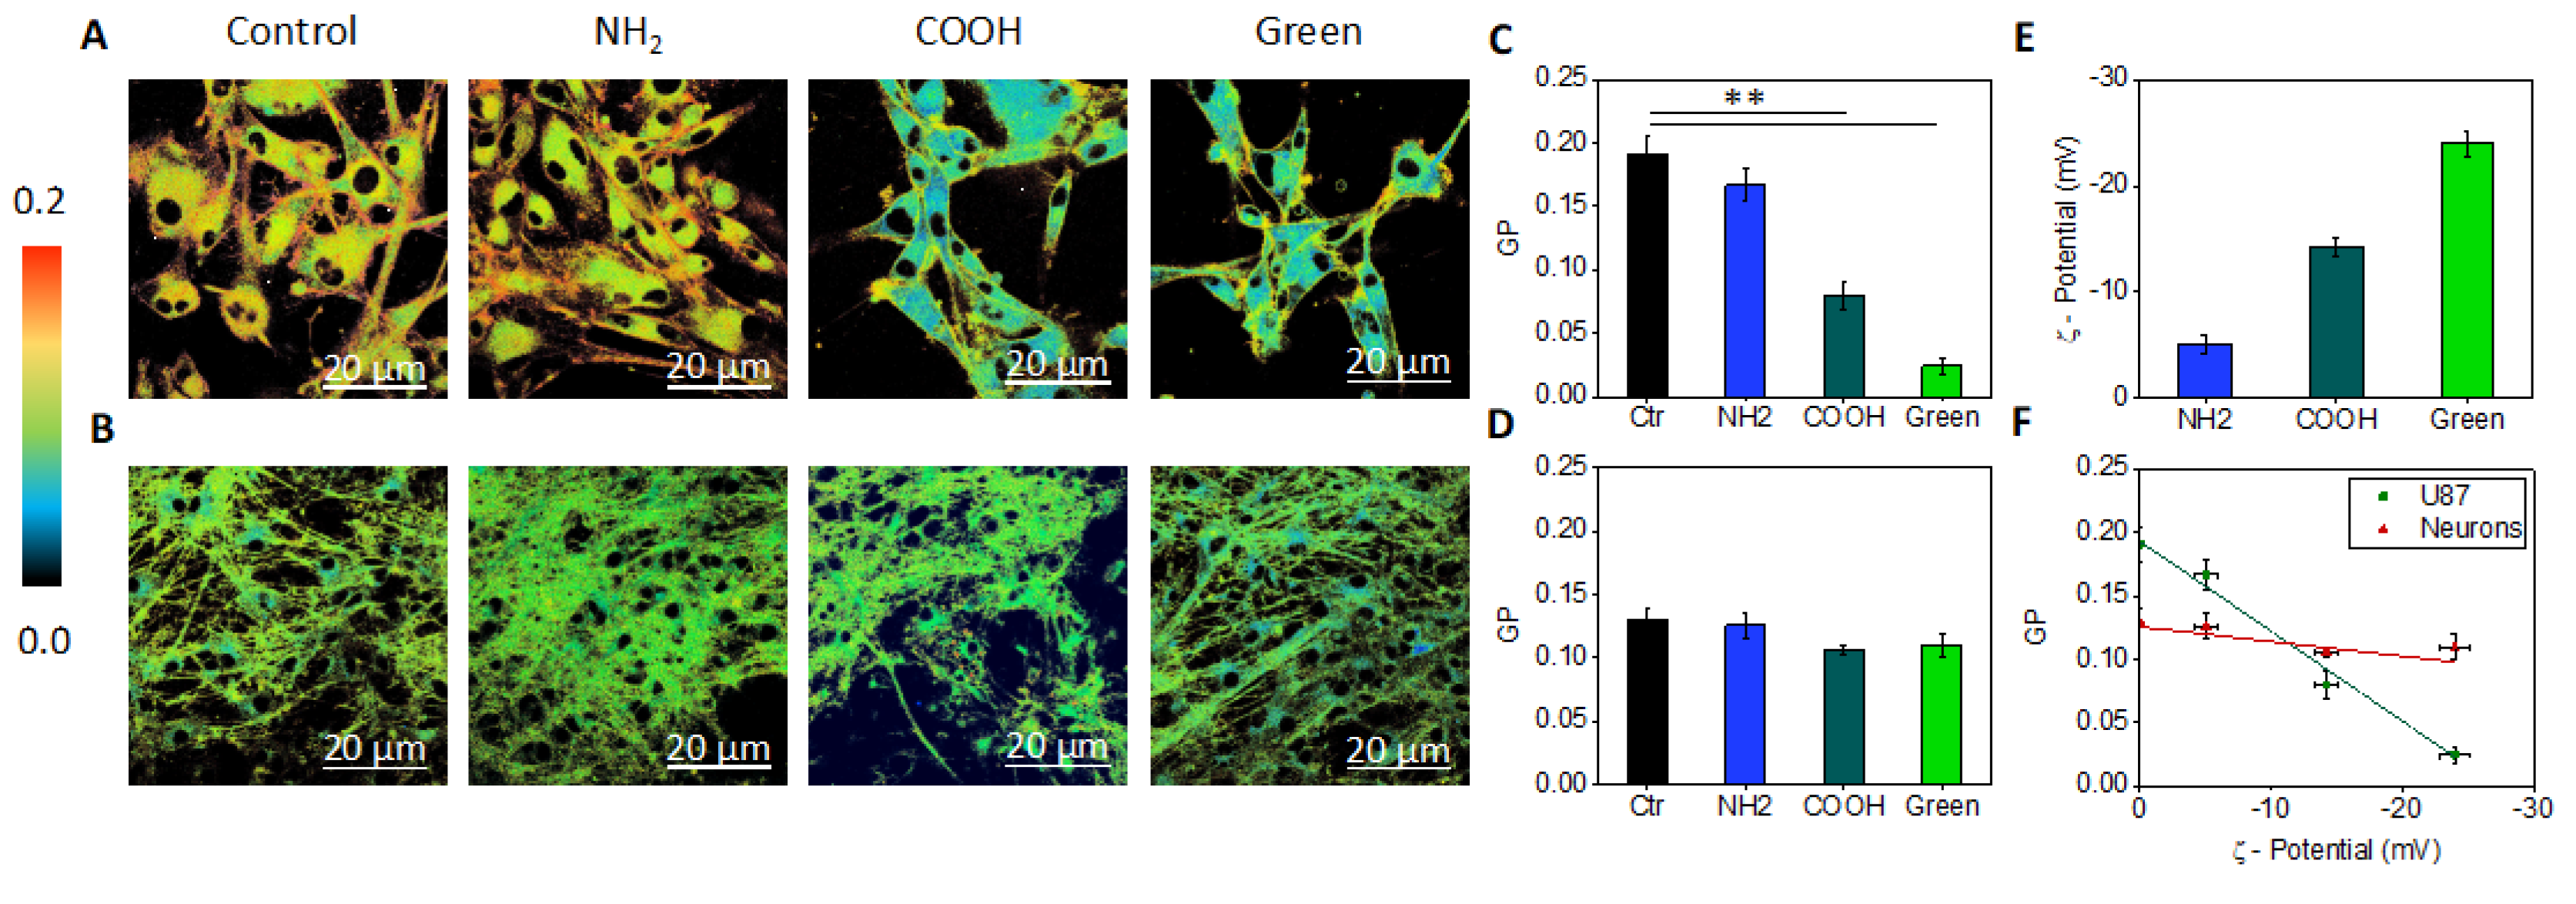
2.4. Analysis of the Interaction Mechanism between GQDs and Cell Compartments
3. Discussion
4. Materials and Methods
4.1. Characterization of GQDs
4.2. Cell Cultures
4.3. Cell Viability
4.4. ROS Detection
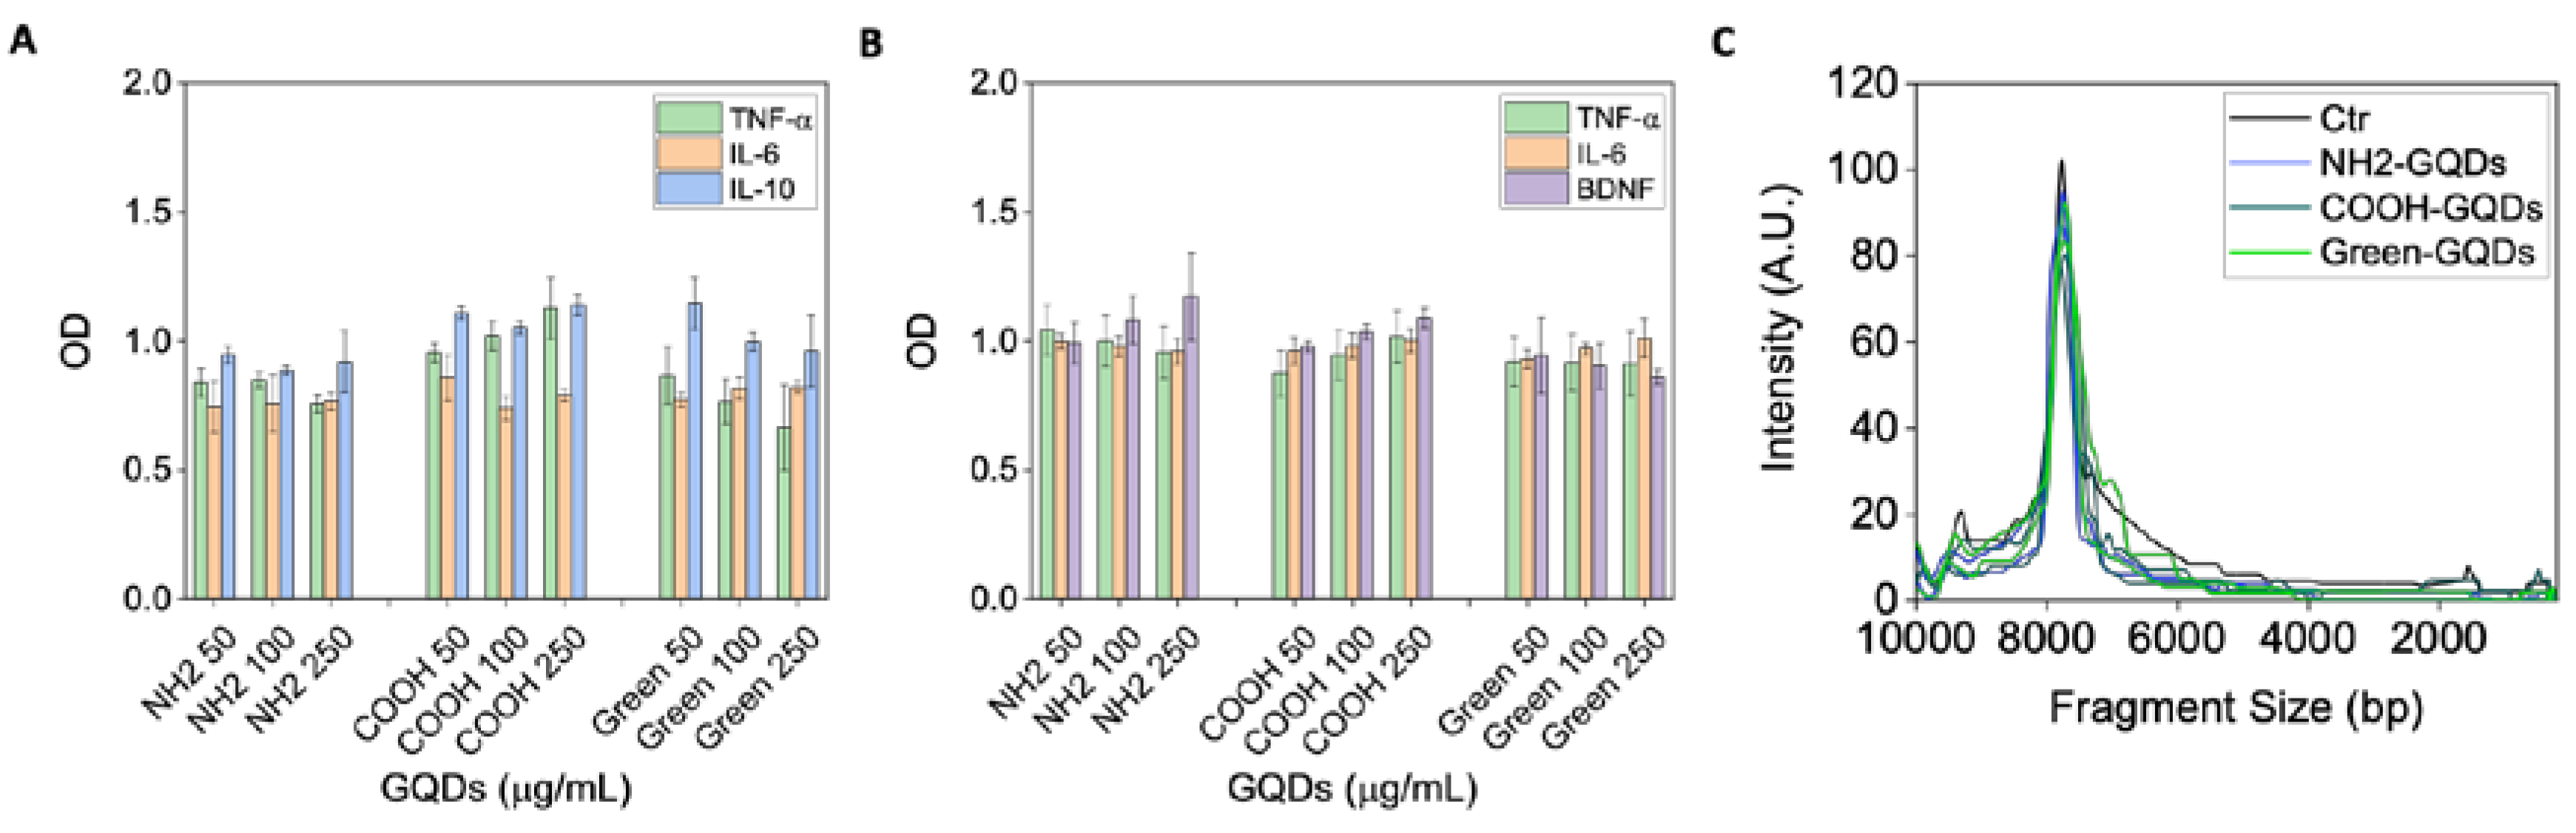
4.5. ELISA Assay
4.6. Statistical Analysis
4.7. DNA Fragmentation
4.8. Confocal Microscopy
Author Contributions
Funding
Conflicts of Interest
References
- Mansur, H.S. Quantum dots and nanocomposites. WIREs Nanomed. Nanobiotechnol. 2010, 2, 113–129. [Google Scholar] [CrossRef] [PubMed]
- Jamieson, T.; Bakhshi, R.; Petrova, D.; Pocock, R.; Imani, M.; Seifalian, A.M. Biological applications of quantum dots. Biomaterials 2007, 28, 4717–4732. [Google Scholar] [CrossRef] [PubMed]
- Nurunnabi, M.; Khatun, Z.; Reeck, G.R.; Lee, D.Y.; Lee, Y.K. Photoluminescent graphene nanoparticles for cancer phototherapy and imaging. ACS Appl. Mater. Interfaces 2014, 6, 12413–12421. [Google Scholar] [CrossRef] [PubMed]
- Bacon, M.; Bradley, S.J.; Nann, T. Graphene quantum dots. Part. Part. Syst. Charact. 2014, 31, 415–428. [Google Scholar] [CrossRef]
- Iannazzo, D.; Pistone, A.; Salamò, M.; Galvagno, S.; Romeo, R.; Giofrè, S.V.; Branca, C.; Visalli, G.; Di Pietro, A. Graphene quantum dots for cancer targeted drug delivery. Int. J. Pharm. 2017, 518, 185–192. [Google Scholar] [CrossRef]
- Palmieri, V.; Bugli, F.; Lauriola, M.C.; Cacaci, M.; Torelli, R.; Ciasca, G.; Conti, C.; Sanguinetti, M.; Papi, M.; De Spirito, M. Bacteria Meet Graphene: Modulation of Graphene Oxide Nanosheet Interaction with Human Pathogens for Effective Antimicrobial Therapy. ACS Biomater. Sci. Eng. 2017. [Google Scholar] [CrossRef]
- De Maio, F.; Palmieri, V.; Salustri, A.; Perini, G.; Sanguinetti, M.; De Spirito, M.; Delogu, G.; Papi, M. Graphene oxide prevents mycobacteria entry into macrophages through extracellular entrapment. Nanoscale Adv. 2019, 1, 1421–1431. [Google Scholar] [CrossRef] [Green Version]
- Palmieri, V.; Bugli, F.; Cacaci, M.; Perini, G.; De Maio, F.; Delogu, G.; Torelli, R.; Conti, C.; Sanguinetti, M.; De Spirito, M.; et al. Graphene oxide coatings prevent Candida albicans biofilm formation with a controlled release of curcumin-loaded nanocomposites. Nanomedicine 2018, 13, 2867–2879. [Google Scholar] [CrossRef]
- Palmieri, V.; Barba, M.; Di Pietro, L.; Gentilini, S.; Braidotti, M.C.; Ciancico, C.; Bugli, F.; Ciasca, G.; Larciprete, R.; Lattanzi, W.; et al. Reduction and shaping of graphene-oxide by laser-printing for controlled bone tissue regeneration and bacterial killing. 2D Mater. 2018, 5, 15027. [Google Scholar] [CrossRef]
- Palmieri, V.; Dalchiele, E.A.; Perini, G.; Motta, A.; De Spirito, M.; Zanoni, R.; Marrani, A.G.; Papi, M. Biocompatible: N -acetyl cysteine reduces graphene oxide and persists at the surface as a green radical scavenger. Chem. Commun. 2019, 55, 4186–4189. [Google Scholar] [CrossRef]
- Palmieri, V.; Perini, G.; De Spirito, M.; Papi, M. Graphene oxide touches blood: In vivo interactions of bio-coronated 2D materials. Nanoscale Horiz. 2018. [Google Scholar] [CrossRef] [PubMed]
- Di Santo, R.; Quagliarini, E.; Palchetti, S.; Pozzi, D.; Palmieri, V.; Perini, G.; Papi, M.; Capriotti, A.L.; Laganà, A.; Caracciolo, G. Microfluidic-generated lipid-graphene oxide nanoparticles for gene delivery. Appl. Phys. Lett. 2019, 114. [Google Scholar] [CrossRef]
- Shang, W.; Zhang, X.; Zhang, M.; Fan, Z.; Sun, Y.; Han, M.; Fan, L. The uptake mechanism and biocompatibility of graphene quantum dots with human neural stem cells. Nanoscale 2014, 6, 5799–5806. [Google Scholar] [CrossRef] [PubMed]
- Wang, X.; Wang, X.; Lei, R.; Huang, H.; Wang, N.; Yuan, L.; Xiao, R.; Bai, L.; Li, X.; Li, L.; et al. The permeability and transport mechanism of graphene quantum dots (GQDs) across the biological barrier. Nanoscale 2015, 7, 2034–2041. [Google Scholar] [CrossRef] [PubMed]
- Parsons, D.W.; Jones, S.; Zhang, X.; Lin, J.C.H.; Leary, R.J.; Angenendt, P.; Mankoo, P.; Carter, H.; Siu, I.M.; Gallia, G.L. An integrated genomic analysis of human glioblastoma multiforme. Science 2008, 321, 1807–1812. [Google Scholar] [CrossRef] [Green Version]
- Yang, F.Y.; Wong, T.T.; Teng, M.C.; Liu, R.S.; Lu, M.; Liang, H.F.; Wei, M.C. Focused ultrasound and interleukin-4 receptor-targeted liposomal doxorubicin for enhanced targeted drug delivery and antitumor effect in glioblastoma multiforme. J. Control. Release 2012, 160, 652–658. [Google Scholar] [CrossRef]
- Dragojevic, S.; Mackey, R.; Raucher, D. Evaluation of Elastin-Like Polypeptides for Tumor Targeted Delivery of Doxorubicin to Glioblastoma. Molecules 2019, 24, 3242. [Google Scholar] [CrossRef] [Green Version]
- Hanada, S.; Fujioka, K.; Inoue, Y.; Kanaya, F.; Manome, Y.; Yamamoto, K. Cell-based in vitro blood-brain barrier model can rapidly evaluate nanoparticles’ brain permeability in association with particle size and surface modification. Int. J. Mol. Sci. 2014, 15, 1812–1825. [Google Scholar] [CrossRef] [Green Version]
- Wang, X.; Sun, X.; Lao, J.; He, H.; Cheng, T.; Wang, M.; Wang, S.; Huang, F. Multifunctional graphene quantum dots for simultaneous targeted cellular imaging and drug delivery. Colloids Surf. B Biointerfaces 2014, 122, 638–644. [Google Scholar] [CrossRef]
- Sui, X.; Luo, C.; Wang, C.; Zhang, F.; Zhang, J.; Guo, S. Graphene quantum dots enhance anticancer activity of cisplatin via increasing its cellular and nuclear uptake. Nanomed. Nanotechnol. Biol. Med. 2016, 12, 1997–2006. [Google Scholar] [CrossRef]
- Zhu, S.; Zhang, J.; Qiao, C.; Tang, S.; Li, Y.; Yuan, W.; Li, B.; Tian, L.; Liu, F.; Hu, R.; et al. Strongly green-photoluminescent graphene quantum dots for bioimaging applications. Chem. Commun. 2011, 47, 6858–6860. [Google Scholar] [CrossRef] [PubMed]
- Zhu, S.; Zhang, J.; Liu, X.; Li, B.; Wang, X.; Tang, S.; Meng, Q.; Li, Y.; Shi, C.; Hu, R.; et al. Graphene quantum dots with controllable surface oxidation, tunable fluorescence and up-conversion emission. RSC Adv. 2012, 2, 2717–2720. [Google Scholar] [CrossRef]
- Chhabra, V.A.; Kaur, R.; Kumar, N.; Deep, A.; Rajesh, C.; Kim, K.H. Synthesis and spectroscopic studies of functionalized graphene quantum dots with diverse fluorescence characteristics. RSC Adv. 2018, 8, 11446–11454. [Google Scholar] [CrossRef] [Green Version]
- Yang, T.; Liu, L.; Liu, J.; Chen, M.-L.; Wang, J.-H. Cyanobacterium metallothionein decorated graphene oxide nanosheets for highly selective adsorption of ultra-trace cadmium. J. Mater. Chem. 2012, 22, 21909–21916. [Google Scholar] [CrossRef]
- Yuan, X.; Liu, Z.; Guo, Z.; Ji, Y.; Jin, M.; Wang, X. Cellular distribution and cytotoxicity of graphene quantum dots with different functional groups. Nanoscale Res. Lett. 2014, 9, 108. [Google Scholar] [CrossRef] [PubMed] [Green Version]
- Brown, J.M.; Giaccia, A.J. The Unique Physiology of Solid Tumors: Opportunities (and Problems) for Cancer Therapy. Cancer Res. 1998, 58, 1408–1416. [Google Scholar]
- Wang, L.; Yin, Y.; Jain, A.; Susan Zhou, H. Aqueous phase synthesis of highly luminescent, nitrogen-doped carbon dots and their application as bioimaging agents. Langmuir 2014, 30, 14270–14275. [Google Scholar] [CrossRef]
- Nurunnabi, M.; Huh, K.M.; Lee, D.Y.; Cho, K.J.; Lee, Y.; Khatun, Z.; Park, S.Y. In Vivo Biodistribution and Toxicology of Carboxylated Graphene Quantum Dots. ACS Nano 2013, 7, 6858–6867. [Google Scholar] [CrossRef]
- Xia, T.; Kovochich, M.; Brant, J.; Hotze, M.; Sempf, J.; Oberley, T.; Sioutas, C.; Yeh, J.I.; Wiesner, M.R.; Nel, A.E. Comparison of the Abilities of Ambient and Manufactured Nanoparticles to Induce Cellular Toxicity According to an Oxidative Stress Paradigm. Nano Lett. 2006, 6, 1794–1807. [Google Scholar] [CrossRef]
- Begum, P.; Ikhtiari, R.; Fugetsu, B. Graphene phytotoxicity in the seedling stage of cabbage, tomato, red spinach, and lettuce. Carbon N. Y. 2011, 49, 3907–3919. [Google Scholar] [CrossRef] [Green Version]
- Gurunathan, S.; Han, J.W.; Dayem, A.A.; Eppakayala, V.; Kim, J.-H. Oxidative stress-mediated antibacterial activity of graphene oxide and reduced graphene oxide in Pseudomonas aeruginosa. Int. J. Nanomed. 2012, 7, 5901–5914. [Google Scholar] [CrossRef] [PubMed] [Green Version]
- Wu, C.; Wang, C.; Han, T.; Zhou, X.; Guo, S.; Zhang, J. Insight into the Cellular Internalization and Cytotoxicity of Graphene Quantum Dots. Adv. Healthc. Mater. 2013, 2, 1613–1619. [Google Scholar] [CrossRef] [PubMed]
- Markovic, Z.M.; Ristic, B.Z.; Arsikin, K.M.; Klisic, D.G.; Harhaji-Trajkovic, L.M.; Todorovic-Markovic, B.M.; Kepic, D.P.; Kravic-Stevovic, T.K.; Jovanovic, S.P.; Milenkovic, M.M.; et al. Graphene quantum dots as autophagy-inducing photodynamic agents. Biomaterials 2012, 33, 7084–7092. [Google Scholar] [CrossRef] [PubMed]
- Zhang, Y.; Pan, H.; Zhang, P.; Gao, N.; Lin, Y.; Luo, Z.; Li, P.; Wang, C.; Liu, L.; Pang, D.; et al. Functionalized quantum dots induce proinflammatory responses in vitro: The role of terminal functional group-associated endocytic pathways. Nanoscale 2013, 5, 5919–5929. [Google Scholar] [CrossRef] [PubMed]
- Qiu, B.; Zhang, D.; Wang, Y.; Ou, S.; Wang, J.; Tao, J.; Wang, Y. Interleukin-6 is overexpressed and augments invasiveness of human glioma stem cells in vitro. Clin. Exp. Metastasis 2013, 30, 1009–1018. [Google Scholar] [CrossRef] [PubMed]
- Goswami, S.; Gupta, A.; Sharma, S.K. Interleukin-6-mediated autocrine growth promotion in human glioblastoma multiforme cell line U87MG. J. Neurochem. 1998, 71, 1837–1845. [Google Scholar] [CrossRef] [Green Version]
- Tchirkov, A.; Rolhion, C.; Bertrand, S.; Doré, J.-F.; Dubost, J.-J.; Verrelle, P. IL-6 gene amplification and expression in human glioblastomas. Br. J. Cancer 2001, 85, 518–522. [Google Scholar] [CrossRef]
- Tchirkov, A.; Khalil, T.; Chautard, E.; Mokhtari, K.; Véronèse, L.; Irthum, B.; Vago, P.; Kémény, J.-L.; Verrelle, P. Interleukin-6 gene amplification and shortened survival in glioblastoma patients. Br. J. Cancer 2007, 96, 474–476. [Google Scholar] [CrossRef] [Green Version]
- McGeer, E.G.; McGeer, P.L. Inflammatory processes in Alzheimer’s disease. Prog. Neuro Psychopharmacol. Biol. Psychiatry 2003, 27, 741–749. [Google Scholar] [CrossRef]
- Tarkowski, E.; Liljeroth, A.-M.; Minthon, L.; Tarkowski, A.; Wallin, A.; Blennow, K. Cerebral pattern of pro- and anti-inflammatory cytokines in dementias. Brain Res. Bull. 2003, 61, 255–260. [Google Scholar] [CrossRef]
- Becher, B.; Spath, S.; Goverman, J. Cytokine networks in neuroinflammation. Nat. Rev. Immunol. 2017, 17, 49–59. [Google Scholar] [CrossRef] [PubMed]
- Woehrling, E.K.; Hill, E.J.; Nagel, D.; Coleman, M.D. Brain-derived Neurotrophic Factor as an Indicator of Chemical Neurotoxicity: An Animal-free CNS Cell Culture Model. Altern. Lab. Anim. 2013, 41, 503–511. [Google Scholar] [CrossRef]
- De, S.; Patra, K.; Ghosh, D.; Dutta, K.; Dey, A.; Sarkar, G.; Maiti, J.; Basu, A.; Rana, D.; Chattopadhyay, D. Tailoring the Efficacy of Multifunctional Biopolymeric Graphene Oxide Quantum Dot-Based Nanomaterial as Nanocargo in Cancer Therapeutic Application. ACS Biomater. Sci. Eng. 2018, 4, 514–531. [Google Scholar] [CrossRef]
- Bianchetti, G.; Di Giacinto, F.; Pitocco, D.; Rizzi, A.; Rizzo, G.E.; De Leva, F.; Flex, A.; Di Stasio, E.; Ciasca, G.; De Spirito, M.; et al. Red blood cells membrane micropolarity as a novel diagnostic indicator of type 1 and type 2 diabetes. Anal. Chim. Acta X 2019, 3, 100030. [Google Scholar] [CrossRef]
- Stewart, G.S.A.B.; Eaton, M.W.; Johnstone, K.; Barrett, M.D.; Ellar, D.J. An investigation of membrane fluidity changes during sporulation and germination of Bacillus megaterium K.M. measured by electron spin and nuclear magnetic resonance spectroscopy. Biochim. Biophys. Acta Biomembr. 1980, 600, 270–290. [Google Scholar] [CrossRef]
- Klein, C.; Pillot, T.; Chambaz, J.; Drouet, B. Determination of plasma membrane fluidity with a fluorescent analogue of sphingomyelin by FRAP measurement using a standard confocal microscope. Brain Res. Protoc. 2003, 11, 46–51. [Google Scholar] [CrossRef]
- Amaro, M.; Reina, F.; Hof, M.; Eggeling, C.; Sezgin, E. Laurdan and Di-4-ANEPPDHQ probe different properties of the membrane. J. Phys. D Appl. Phys. 2017, 50, 134004. [Google Scholar] [CrossRef] [Green Version]
- Giacinto, F.; Di Spirito, M.; De Maulucci, G. Low-Intensity Ultrasound Induces Thermodynamic Phase Separation of Cell Membranes through a Nucleation–Condensation Process. Ultrasound Med. Biol. 2019, 45, 1143–1150. [Google Scholar] [CrossRef]
- He, C.; Hu, Y.; Yin, L.; Tang, C.; Yin, C. Effects of particle size and surface charge on cellular uptake and biodistribution of polymeric nanoparticles. Biomaterials 2010, 31, 3657–3666. [Google Scholar] [CrossRef]
- Sun, X.; Liu, Z.; Welsher, K.; Robinson, J.T.; Goodwin, A.; Zaric, S.; Dai, H. Nano-graphene oxide for cellular imaging and drug delivery. Nano Res. 2008, 1, 203–212. [Google Scholar] [CrossRef] [Green Version]
- Li, Y.; Yuan, H.; Von Dem Bussche, A.; Creighton, M.; Hurt, R.H.; Kane, A.B.; Gao, H. Graphene microsheets enter cells through spontaneous membrane penetration at edge asperities and corner sites. Proc. Natl. Acad. Sci. USA 2013, 110, 12295–12300. [Google Scholar] [CrossRef] [PubMed] [Green Version]
- Tu, Y.; Lv, M.; Xiu, P.; Huynh, T.; Zhang, M.; Castelli, M.; Liu, Z.; Huang, Q.; Fan, C.; Fang, H.; et al. Destructive extraction of phospholipids from Escherichia coli membranes by graphene nanosheets. Nat. Nanotechnol. 2013, 8, 594–601. [Google Scholar] [CrossRef] [PubMed]
- Titov, A.V.; Král, P.; Pearson, R. Sandwiched Graphene−Membrane Superstructures. ACS Nano 2010, 4, 229–234. [Google Scholar] [CrossRef] [PubMed]
- Nikanjam, M.; Gibbs, A.R.; Hunt, C.A.; Budinger, T.F.; Forte, T.M. Synthetic nano-LDL with paclitaxel oleate as a targeted drug delivery vehicle for glioblastoma multiforme. J. Control. Release 2007, 124, 163–171. [Google Scholar] [CrossRef] [PubMed]
- Zhang, L.W.; Monteiro-Riviere, N.A. Mechanisms of Quantum Dot Nanoparticle Cellular Uptake. Toxicol. Sci. 2009, 110, 138–155. [Google Scholar] [CrossRef] [Green Version]
- Wu, X.; Tian, F.; Wang, W.; Chen, J.; Wu, M.; Zhao, J.X. Fabrication of highly fluorescent graphene quantum dots using L-glutamic acid for in vitro/in vivo imaging and sensing. J. Mater. Chem. C 2013, 1, 4676–4684. [Google Scholar] [CrossRef] [Green Version]
- Krishnamoorthy, K.; Veerapandian, M.; Yun, K.; Kim, S.J. The chemical and structural analysis of graphene oxide with different degrees of oxidation. Carbon N. Y. 2013, 53, 38–49. [Google Scholar] [CrossRef]
- Perini, G.; Ciasca, G.; Minelli, E.; Papi, M.; Palmieri, V.; Maulucci, G.; Nardini, M.; Latina, V.; Corsetti, V.; Florenzano, F.; et al. Dynamic structural determinants underlie the neurotoxicity of the N-terminal tau 26-44 peptide in Alzheimer’s disease and other human tauopathies. Int. J. Biol. Macromol. 2019, 141, 278–289. [Google Scholar] [CrossRef]
- Papi, M.; Lauriola, M.C.; Palmieri, V.; Ciasca, G.; Maulucci, G.; De Spirito, M. Plasma protein corona reduces the haemolytic activity of graphene oxide nano and micro flakes. RSC Adv. 2015, 5, 81638–81641. [Google Scholar] [CrossRef]
- Piacentini, R.; Li Puma, D.D.; Ripoli, C.; Marcocci, M.E.; De Chiara, G.; Garaci, E.; Palamara, A.T.; Grassi, C. Herpes Simplex Virus type-1 infection induces synaptic dysfunction in cultured cortical neurons via GSK-3 activation and intraneuronal amyloid-β protein accumulation. Sci. Rep. 2015, 5, 15444. [Google Scholar] [CrossRef] [Green Version]
- Parasassi, T.; De Stasio, G.; D’Ubaldo, A.; Gratton, E. Phase fluctuation in phospholipid membranes revealed by Laurdan fluorescence. Biophys. J. 1990, 57, 1179–1186. [Google Scholar] [CrossRef] [Green Version]
- Moriconi, C.; Palmieri, V.; Di Santo, R.; Tornillo, G.; Papi, M.; Pilkington, G.; De Spirito, M.; Gumbleton, M. INSIDIA: A FIJI Macro Delivering High-Throughput and High-Content Spheroid Invasion Analysis. Biotechnol. J. 2017, 12, 1700140. [Google Scholar] [CrossRef] [PubMed]
- Perini, G.; Palmieri, V.; Ciasca, G.; De Spirito, M.; Papi, M. Unravelling the Potential of Graphene Quantum Dots in Biomedicine and Neuroscience. Int. J. Mol. Sci. 2020, 21, 3712. [Google Scholar] [CrossRef] [PubMed]


© 2020 by the authors. Licensee MDPI, Basel, Switzerland. This article is an open access article distributed under the terms and conditions of the Creative Commons Attribution (CC BY) license (http://creativecommons.org/licenses/by/4.0/).
Share and Cite
Perini, G.; Palmieri, V.; Ciasca, G.; D’Ascenzo, M.; Gervasoni, J.; Primiano, A.; Rinaldi, M.; Fioretti, D.; Prampolini, C.; Tiberio, F.; et al. Graphene Quantum Dots’ Surface Chemistry Modulates the Sensitivity of Glioblastoma Cells to Chemotherapeutics. Int. J. Mol. Sci. 2020, 21, 6301. https://0-doi-org.brum.beds.ac.uk/10.3390/ijms21176301
Perini G, Palmieri V, Ciasca G, D’Ascenzo M, Gervasoni J, Primiano A, Rinaldi M, Fioretti D, Prampolini C, Tiberio F, et al. Graphene Quantum Dots’ Surface Chemistry Modulates the Sensitivity of Glioblastoma Cells to Chemotherapeutics. International Journal of Molecular Sciences. 2020; 21(17):6301. https://0-doi-org.brum.beds.ac.uk/10.3390/ijms21176301
Chicago/Turabian StylePerini, Giordano, Valentina Palmieri, Gabriele Ciasca, Marcello D’Ascenzo, Jacopo Gervasoni, Aniello Primiano, Monica Rinaldi, Daniela Fioretti, Chiara Prampolini, Federica Tiberio, and et al. 2020. "Graphene Quantum Dots’ Surface Chemistry Modulates the Sensitivity of Glioblastoma Cells to Chemotherapeutics" International Journal of Molecular Sciences 21, no. 17: 6301. https://0-doi-org.brum.beds.ac.uk/10.3390/ijms21176301