Eosinophil microRNAs Play a Regulatory Role in Allergic Diseases Included in the Atopic March


Abstract
:1. Introduction
2. Results
2.1. Differential Counts of Pri-miRNA Associated with Allergic Diseases Included in the Atopic March
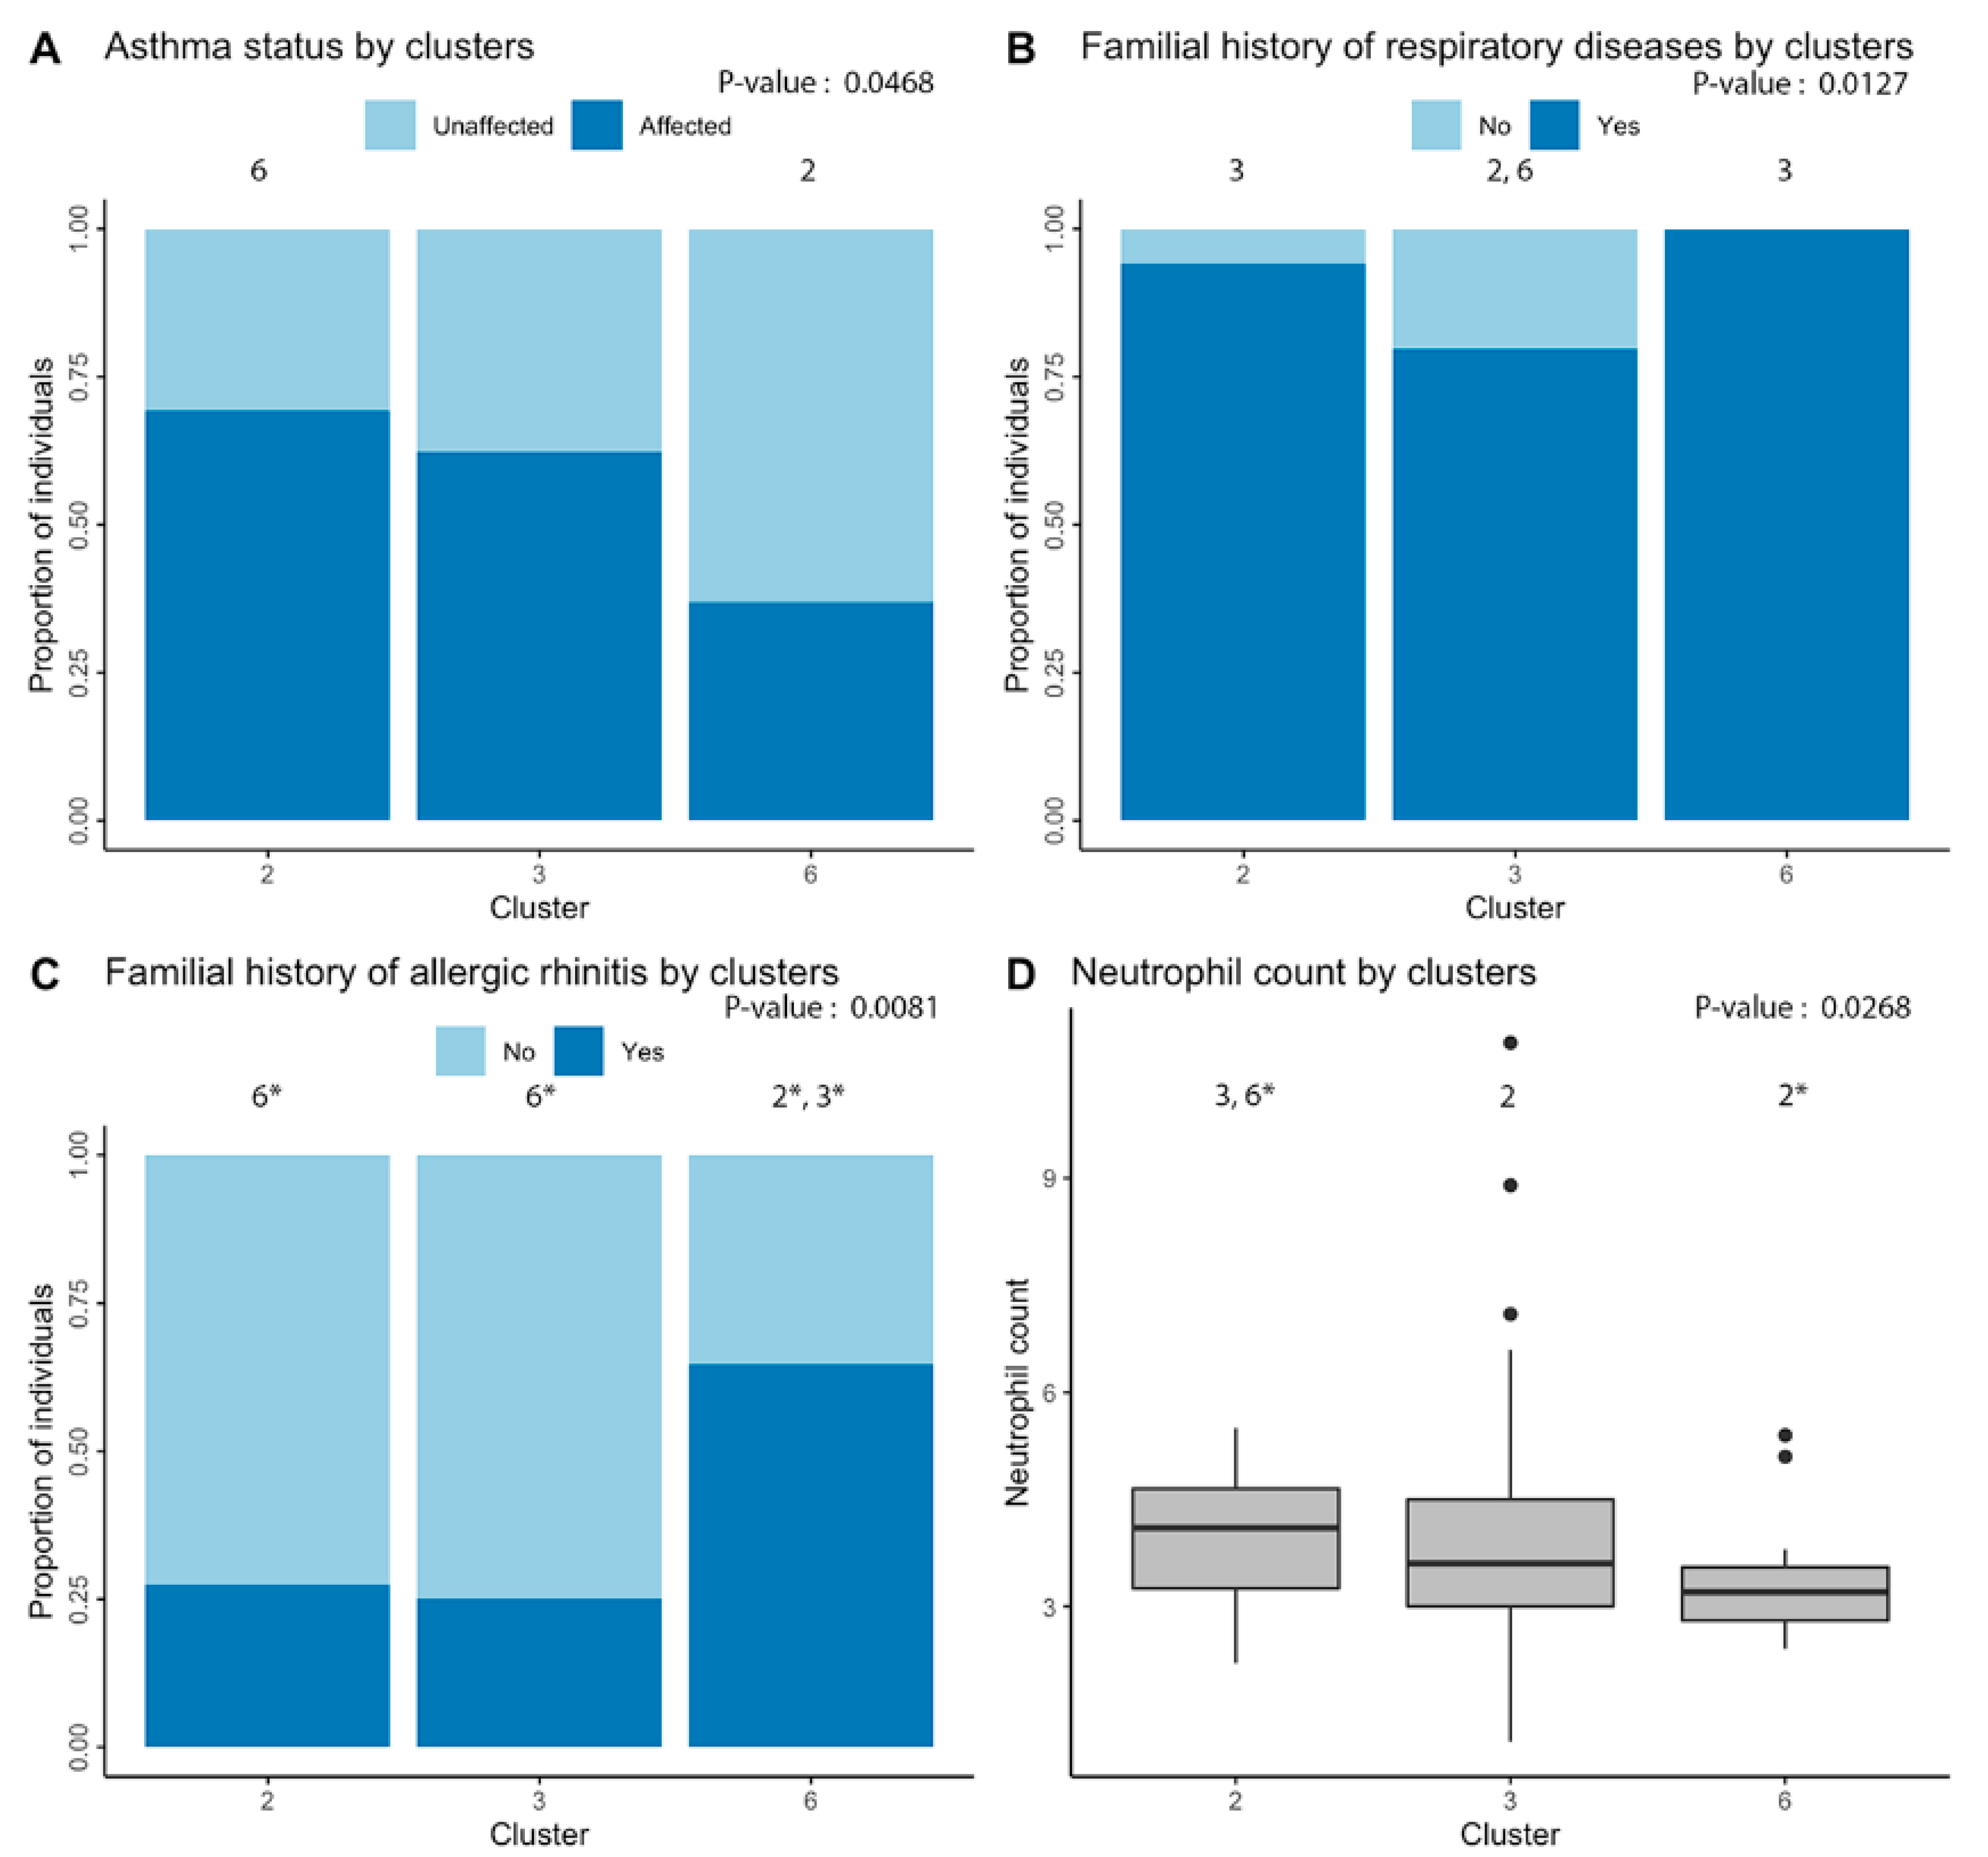
2.2. Clustering of Significant miRNAs
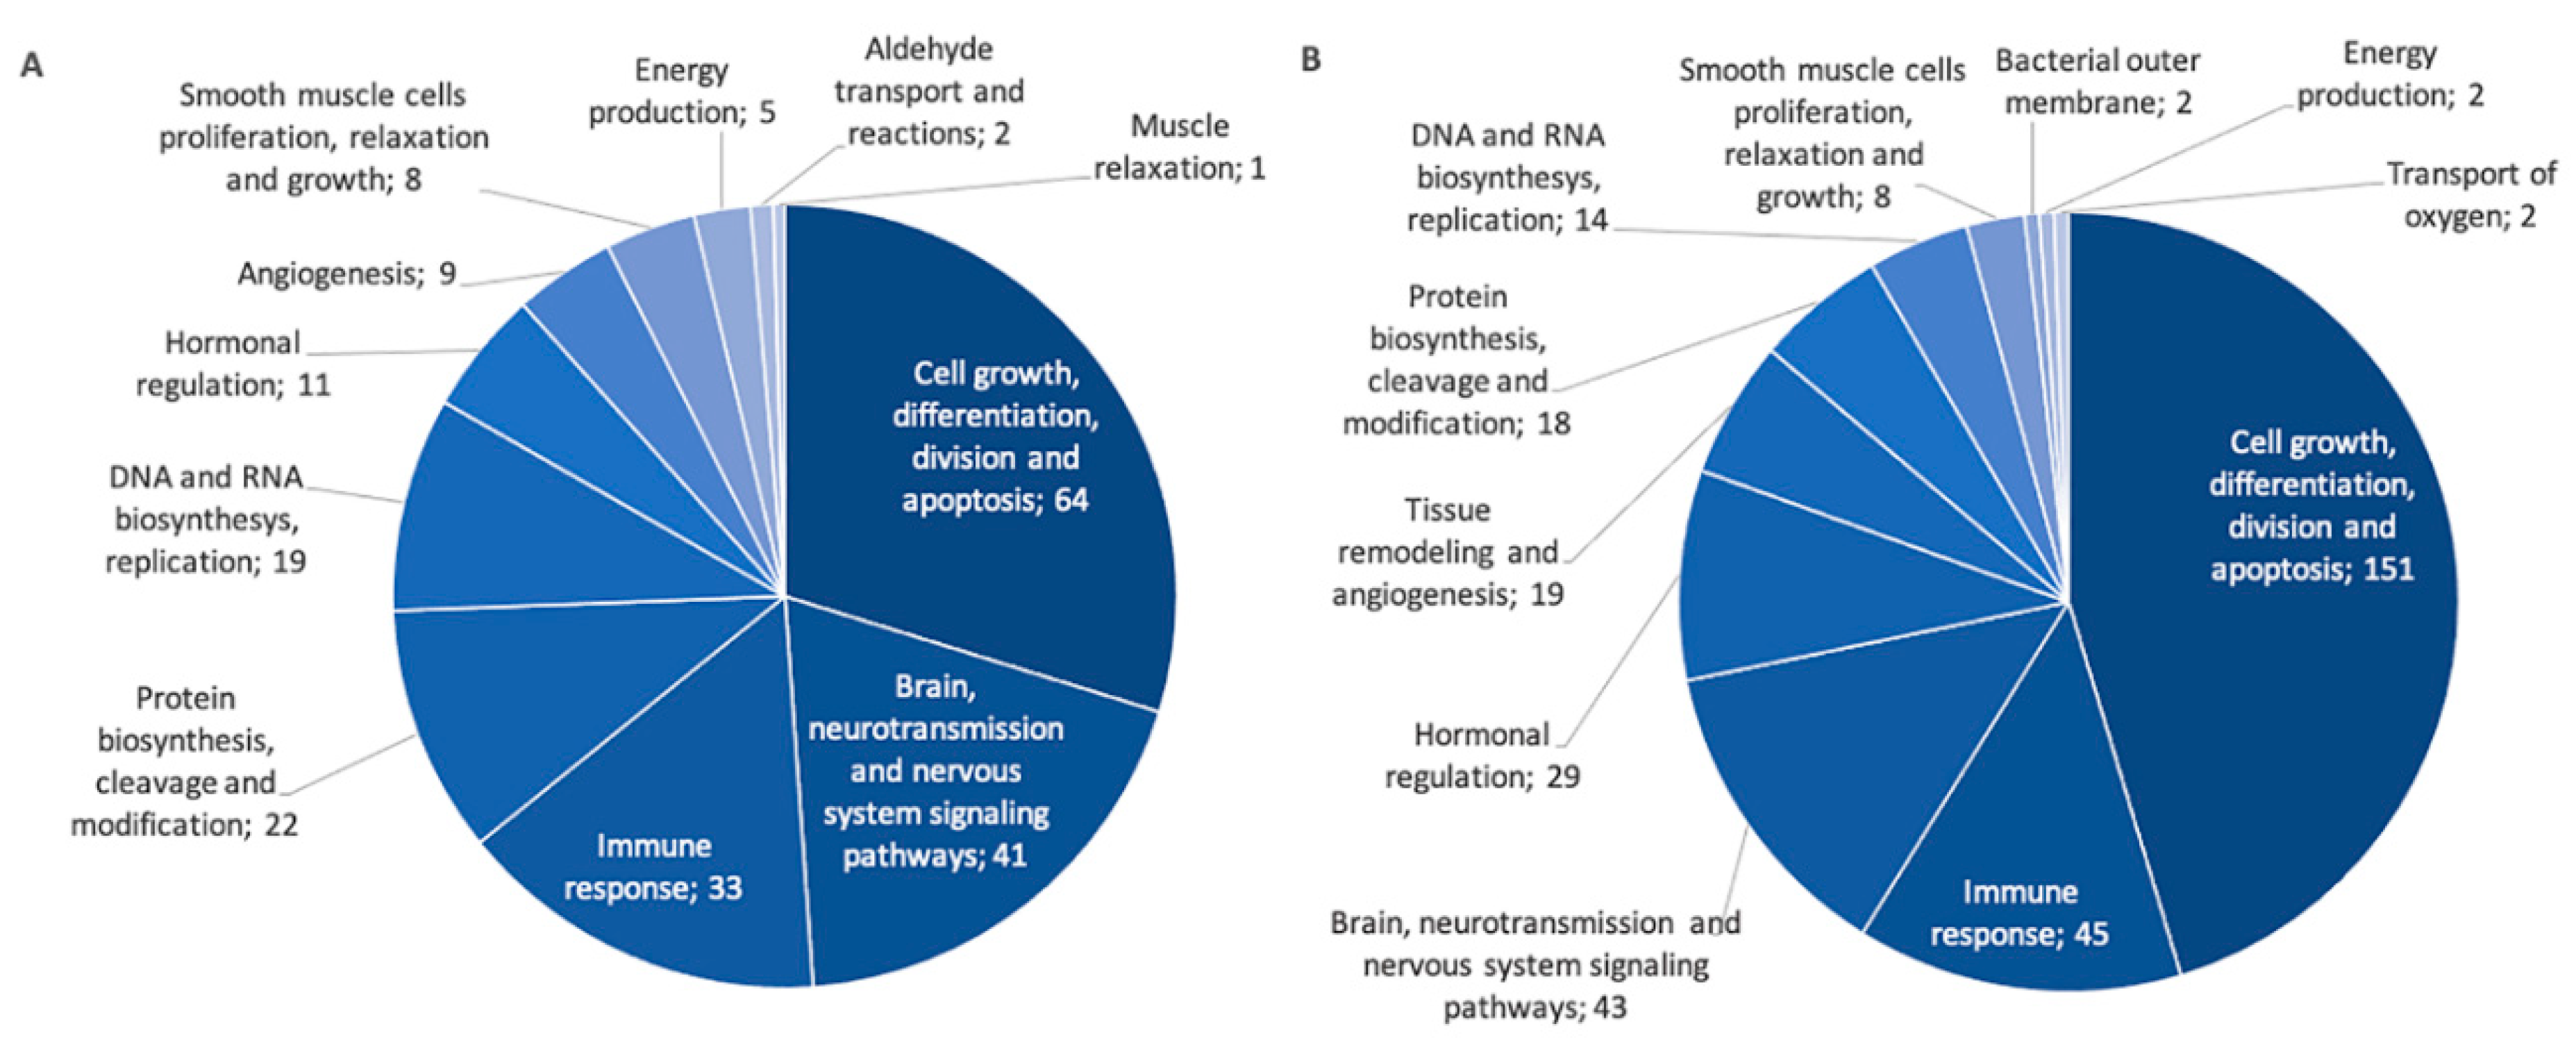
2.3. Identifiaction of Possible Gene Targets
3. Discussion
4. Materials and Methods
4.1. SLSJ Asthma Cohort
4.2. Isolation of RNA from Eosinophils and Sequencing
4.3. Statistical Methods
4.3.1. Analyses of Pri-miRNA Expression Counts between Individuals
4.3.2. Clustering of miRNAs
4.3.3. Identification of Possible Gene Targets for Associated Pri-miRNAs
Supplementary Materials
Author Contributions
Funding
Acknowledgments
Conflicts of Interest
References
- Platts-Mills, T.A. The allergy epidemics: 1870–2010. J. Allergy Clin. Immunol. 2015, 136, 3–13. [Google Scholar] [CrossRef] [PubMed] [Green Version]
- Mullins, R.J.; Dear, K.B.; Tang, M.L. Time trends in Australian hospital anaphylaxis admissions in 1998–1999 to 2011–2012. J. Allergy Clin. Immunol. 2015, 136, 367–375. [Google Scholar] [CrossRef] [Green Version]
- Du Toit, G.; Tsakok, T.; Lack, S.; Lack, G. Prevention of food allergy. J. Allergy Clin. Immunol. 2016, 137, 998–1010. [Google Scholar] [CrossRef] [PubMed] [Green Version]
- Carlsten, C.; Dimich-Ward, H.; Ferguson, A.; Watson, W.; Rousseau, R.; Dybuncio, A.; Becker, A.; Chan-Yeung, M. Atopic dermatitis in a high-risk cohort: Natural history, associated allergic outcomes, and risk factors. Ann. Allergy Asthma Immunol. 2013, 110, 24–28. [Google Scholar] [CrossRef] [PubMed]
- Global Initiative for Asthma. Global Strategy for Asthma Management and Prevention. 2019. Available online: https://ginasthma.org/wp-content/uploads/2019/06/GINA-2019-main-report-June-2019-wms.pdf (accessed on 23 April 2020).
- Mims, J.W. Asthma: Definitions and pathophysiology. Int. Forum Allergy Rhinol. 2015, 5 (Suppl. 1), S2–S6. [Google Scholar] [CrossRef] [PubMed]
- Hernandez-Pacheco, N.; Pino-Yanes, M.; Flores, C. Genomic Predictors of Asthma Phenotypes and Treatment Response. Front. Pediatr. 2019, 7, 6. [Google Scholar] [CrossRef] [Green Version]
- Lovinsky-Desir, S.; Miller, R.L. Epigenetics, asthma, and allergic diseases: A review of the latest advancements. Curr. Allergy Asthma Rep. 2012, 12, 211–220. [Google Scholar] [CrossRef] [Green Version]
- Lu, T.X.; Rothenberg, M.E. MicroRNA. J. Allergy Clin. Immunol. 2018, 141, 1202–1207. [Google Scholar] [CrossRef] [Green Version]
- Lee, Y.; Jeon, K.; Lee, J.T.; Kim, S.; Kim, V.N. MicroRNA maturation: Stepwise processing and subcellular localization. EMBO J. 2002, 21, 4663–4670. [Google Scholar] [CrossRef] [Green Version]
- Maneechotesuwan, K. Role of microRNA in severe asthma. Respir. Investig. 2019, 57, 9–19. [Google Scholar] [CrossRef]
- Ma, L.; Xue, H.B.; Wang, F.; Shu, C.M.; Zhang, J.H. MicroRNA-155 may be involved in the pathogenesis of atopic dermatitis by modulating the differentiation and function of T helper type 17 (Th17) cells. Clin. Exp. Immunol. 2015, 181, 142–149. [Google Scholar] [CrossRef] [PubMed] [Green Version]
- Rebane, A.; Runnel, T.; Aab, A.; Maslovskaja, J.; Rückert, B.; Zimmermann, M.; Plaas, M.; Kärner, J.; Treis, A.; Pihlap, M.; et al. MicroRNA-146a alleviates chronic skin inflammation in atopic dermatitis through suppression of innate immune responses in keratinocytes. J. Allergy Clin. Immunol. 2014, 134, 836–847.e11. [Google Scholar] [CrossRef] [PubMed]
- Wu, G.; Yang, G.; Zhang, R.; Xu, G.; Zhang, L.; Wen, W.; Lu, J.; Liu, J.; Yu, Y. Altered microRNA Expression Profiles of Extracellular Vesicles in Nasal Mucus From Patients With Allergic Rhinitis. Allergy Asthma Immunol. Res. 2015, 7, 449–457. [Google Scholar] [CrossRef] [PubMed] [Green Version]
- Suojalehto, H.; Toskala, E.; Kilpeläinen, M.; Majuri, M.L.; Mitts, C.; Lindström, I.; Puustinen, A.; Plosila, T.; Sipilä, J.; Wolff, H.; et al. MicroRNA profiles in nasal mucosa of patients with allergic and nonallergic rhinitis and asthma. Int. Forum Allergy Rhinol. 2013, 3, 612–620. [Google Scholar] [CrossRef] [PubMed]
- Nair, P.; Martin, J.G.; Cockcroft, D.C.; Dolovich, M.; Lemiere, C.; Boulet, L.P.; O’Byrne, P.M. Airway Hyperresponsiveness in Asthma: Measurement and Clinical Relevance. J. Allergy Clin. Immunol. Pract. 2017, 5, 649–659.e2. [Google Scholar] [CrossRef] [PubMed]
- Schneider, A.; Gindner, L.; Tilemann, L.; Schermer, T.; Dinant, G.J.; Meyer, F.J.; Szecsenyi, J. Diagnostic accuracy of spirometry in primary care. BMC Pulm. Med. 2009, 9, 31. [Google Scholar] [CrossRef] [Green Version]
- Davis, J.S.; Sun, M.; Kho, A.T.; Moore, K.G.; Sylvia, J.M.; Weiss, S.T.; Lu, Q.; Tantisira, K.G. Circulating microRNAs and association with methacholine PC20 in the Childhood Asthma Management Program (CAMP) cohort. PLoS ONE 2017, 12, e0180329. [Google Scholar] [CrossRef] [Green Version]
- Trinh, H.K.T.; Pham, D.L.; Kim, S.C.; Kim, R.Y.; Park, H.S.; Kim, S.H. Association of the miR-196a2, miR-146a, and miR-499 Polymorphisms with Asthma Phenotypes in a Korean Population. Mol. Diagn. Ther. 2017, 21, 547–554. [Google Scholar] [CrossRef]
- Kho, A.T.; Sharma, S.; Davis, J.S.; Spina, J.; Howard, D.; McEnroy, K.; Moore, K.; Sylvia, J.; Qiu, W.; Weiss, S.T.; et al. Circulating MicroRNAs: Association with Lung Function in Asthma. PLoS ONE 2016, 11, e0157998. [Google Scholar] [CrossRef]
- Mousavi, S.R.; Ahmadi, A.; Jamalkandi, S.A.; Salimian, J. Involvement of microRNAs in physiological and pathological processes in asthma. J. Cell. Physiol. 2019, 234, 21547–21559. [Google Scholar] [CrossRef]
- Levänen, B.; Bhakta, N.R.; Paredes, P.T.; Barbeau, R.; Hiltbrunner, S.; Pollack, J.L.; Sköld, C.M.; Svartengren, M.; Grunewald, J.; Gabrielsson, S.; et al. Altered microRNA profiles in bronchoalveolar lavage fluid exosomes in asthmatic patients. J. Allergy Clin. Immunol. 2013, 131, 894–903. [Google Scholar] [CrossRef] [Green Version]
- Kai, W.; Qian, X.U.; Qun, W.U. MicroRNAs and Asthma Regulation. Iran. J. Allergy Asthma Immunol. 2015, 14, 120–125. [Google Scholar] [PubMed]
- Wang, Y.; Yang, L.; Li, P.; Huang, H.; Liu, T.; He, H.; Lin, Z.; Jiang, Y.; Ren, N.; Wu, B.; et al. Circulating microRNA Signatures Associated with Childhood Asthma. Clin. Lab. 2015, 61, 467–474. [Google Scholar] [CrossRef] [PubMed]
- Bin, L.; Leung, D.Y. Genetic and epigenetic studies of atopic dermatitis. Allergy Asthma Clin. Immunol. 2016, 12, 52. [Google Scholar] [CrossRef] [Green Version]
- Zhang, X.-H.; Zhang, Y.-N.; Liu, Z. MicroRNA in chronic rhinosinusitis and allergic rhinitis. Curr. Allergy Asthma Rep. 2014, 14, 415. [Google Scholar] [CrossRef]
- Dissanayake, E.; Inoue, Y. MicroRNAs in Allergic Disease. Curr. Allergy Asthma Rep. 2016, 16, 67. [Google Scholar] [CrossRef]
- Drake, M.G.; Lebold, K.M.; Roth-Carter, Q.R.; Pincus, A.B.; Blum, E.D.; Proskocil, B.J.; Jacoby, D.B.; Fryer, A.D.; Nie, Z. Eosinophil and airway nerve interactions in asthma. J. Leukoc. Biol. 2018, 104, 61–67. [Google Scholar] [CrossRef]
- Rodrigo-Muñoz, J.M.; Cañas, J.A.; Sastre, B.; Rego, N.; Greif, G.; Rial, M.; Mínguez, P.; Mahíllo-Fernández, I.; Fernández-Nieto, M.; Mora, I.; et al. Asthma diagnosis using integrated analysis of eosinophil microRNAs. Allergy 2019, 74, 507–517. [Google Scholar] [CrossRef]
- Allantaz, F.; Cheng, D.T.; Bergauer, T.; Ravindran, P.; Rossier, M.F.; Ebeling, M.; Badi, L.; Reis, B.; Bitter, H.; D’Asaro, M.; et al. Expression profiling of human immune cell subsets identifies miRNA-mRNA regulatory relationships correlated with cell type specific expression. PLoS ONE 2012, 7, e29979. [Google Scholar] [CrossRef] [Green Version]
- Huang, H.-Y.; Lin, Y.-C.-D.; Li, J.; Huang, K.-Y.; Shrestha, S.; Hong, H.-C.; Tang, Y.; Chen, Y.-G.; Jin, C.-N.; Yu, Y.; et al. miRTarBase 2020: Updates to the experimentally validated microRNA–target interaction database. Nucleic Acids Res. 2019, 48, D148–D154. [Google Scholar] [CrossRef] [Green Version]
- Wang, L.; Zhu, J.; Deng, F.Y.; Wu, L.F.; Mo, X.B.; Zhu, X.W.; Xia, W.; Xie, F.F.; He, P.; Bing, P.F.; et al. Correlation analyses revealed global microRNA-mRNA expression associations in human peripheral blood mononuclear cells. Mol. Genet. Genom. 2018, 293, 95–105. [Google Scholar] [CrossRef] [PubMed]
- Mi, H.; Lazareva-Ulitsky, B.; Loo, R.; Kejariwal, A.; Vandergriff, J.; Rabkin, S.; Guo, N.; Muruganujan, A.; Doremieux, O.; Campbell, M.J.; et al. The PANTHER database of protein families, subfamilies, functions and pathways. Nucleic Acids Res. 2005, 33, D284–D288. [Google Scholar] [CrossRef] [PubMed] [Green Version]
- Cañas, J.A.; Sastre, B.; Rodrigo-Muñoz, J.M.; del Pozo, V. Exosomes: A new approach to asthma pathology. Clin. Chim. Acta 2019, 495, 139–147. [Google Scholar] [CrossRef] [PubMed]
- Heffler, E.; Allegra, A.; Pioggia, G.; Picardi, G.; Musolino, C.; Gangemi, S. MicroRNA Profiling in Asthma: Potential Biomarkers and Therapeutic Targets. Am. J. Respir. Cell Mol. Biol. 2017, 57, 642–650. [Google Scholar] [CrossRef]
- Lu, T.X.; Rothenberg, M.E. Diagnostic, functional, and therapeutic roles of microRNA in allergic diseases. J. Allergy Clin. Immunol. 2013, 132, 3–13. [Google Scholar] [CrossRef] [Green Version]
- Badalzadeh, M.; Mazinani, M.; Pourpak, Z.; Heidarnazhad, H.; Mortaz, E.; Moin, M.; Farazmand, A. In Vitro Analysis of Nine MicroRNAs in CD8+ T Cells of Asthmatic Patients and the Effects of Two FDA-approved Drugs. Iran. J. Allergy Asthma Immunol. 2019, 18, 358–368. [Google Scholar] [CrossRef]
- Sharma, S. Immunomodulation: A definitive role of microRNA-142. Dev. Comp. Immunol. 2017, 77, 150–156. [Google Scholar] [CrossRef]
- Panganiban, R.P.; Pinkerton, M.H.; Maru, S.Y.; Jefferson, S.J.; Roff, A.N.; Ishmael, F.T. Differential microRNA epression in asthma and the role of miR-1248 in regulation of IL-5. Am. J. Clin. Exp. Immunol. 2012, 1, 154–165. [Google Scholar]
- Li, H.M.; Xiao, Y.J.; Min, Z.S.; Tan, C. Identification and interaction analysis of key genes and microRNAs in atopic dermatitis by bioinformatics analysis. Clin. Exp. Dermatol. 2019, 44, 257–264. [Google Scholar] [CrossRef]
- Wardzyńska, A.; Pawełczyk, M.; Rywaniak, J.; Kurowski, M.; Makowska, J.S.; Kowalski, M.L. Circulating MicroRNAs and T-Cell Cytokine Expression Are Associated With the Characteristics of Asthma Exacerbation. Allergy Asthma Immunol. Res. 2020, 12, 125–136. [Google Scholar] [CrossRef]
- Yan, J.; Zhang, X.; Sun, S.; Yang, T.; Yang, J.; Wu, G.; Qiu, Y.; Yin, Y.; Xu, W. miR-29b Reverses T helper 1 cells/T helper 2 cells Imbalance and Alleviates Airway Eosinophils Recruitment in OVA-Induced Murine Asthma by Targeting Inducible Co-Stimulator. Int. Arch. Allergy Immunol. 2019, 180, 182–194. [Google Scholar] [CrossRef] [PubMed]
- Shi, S.; Jin, L.; Zhang, S.; Li, H.; Zhang, B.; Sun, M. MicroRNA-590-5p represses proliferation of human fetal airway smooth muscle cells by targeting signal transducer and activator of transcription 3. Arch. Med. Sci. 2018, 14, 1093–1101. [Google Scholar] [CrossRef] [PubMed]
- Wang, H.; Yao, H.; Yi, B.; Kazama, K.; Liu, Y.; Deshpande, D.; Zhang, J.; Sun, J. MicroRNA-638 inhibits human airway smooth muscle cell proliferation and migration through targeting cyclin D1 and NOR1. J. Cell. Physiol. 2018, 234, 369–381. [Google Scholar] [CrossRef] [PubMed] [Green Version]
- Zhan, J.W.; Jiao, D.M.; Wang, Y.; Song, J.; Wu, J.H.; Wu, L.J.; Chen, Q.Y.; Ma, S.L. Integrated microRNA and gene expression profiling reveals the crucial miRNAs in curcumin anti-lung cancer cell invasion. Thorac. Cancer 2017, 8, 461–470. [Google Scholar] [CrossRef]
- Li, C.G.; Pu, M.F.; Li, C.Z.; Gao, M.; Liu, M.X.; Yu, C.Z.; Yan, H.; Peng, C.; Zhao, Y.; Li, Y.; et al. MicroRNA-1304 suppresses human non-small cell lung cancer cell growth in vitro by targeting heme oxygenase-1. Acta Pharmacol. Sin. 2017, 38, 110–119. [Google Scholar] [CrossRef] [Green Version]
- Qu, J.; Li, M.; An, J.; Zhao, B.; Zhong, W.; Gu, Q.; Cao, L.; Yang, H.; Hu, C. MicroRNA-33b inhibits lung adenocarcinoma cell growth, invasion, and epithelial-mesenchymal transition by suppressing Wnt/β-catenin/ZEB1 signaling. Int. J. Oncol. 2015, 47, 2141–2152. [Google Scholar] [CrossRef] [Green Version]
- Xu, C.Z.; Shi, R.J.; Chen, D.; Sun, Y.Y.; Wu, Q.W.; Wang, T.; Wang, P.H. Potential biomarkers for paclitaxel sensitivity in hypopharynx cancer cell. Int. J. Clin. Exp. Pathol. 2013, 6, 2745–2756. [Google Scholar]
- Fesen, K.; Silveyra, P.; Fuentes, N.; Nicoleau, M.; Rivera, L.; Kitch, D.; Graff, G.R.; Siddaiah, R. The role of microRNAs in chronic pseudomonas lung infection in Cystic fibrosis. Respir. Med. 2019, 151, 133–138. [Google Scholar] [CrossRef]
- Lin, C.E.; Kaptein, J.S.; Sheikh, J. Differential expression of microRNAs and their possible roles in patients with chronic idiopathic urticaria and active hives. Allergy Rhinol. 2017, 8, 67–80. [Google Scholar] [CrossRef] [Green Version]
- Pan, K.; Wang, Y.; Pan, P.; Xu, G.; Mo, L.; Cao, L.; Wu, C.; Shen, X. The regulatory role of microRNA-mRNA co-expression in hepatitis B virus-associated acute liver failure. Ann. Hepatol. 2019, 18, 883–892. [Google Scholar] [CrossRef]
- Ono, K. A Novel Link between Plasma MicroRNA-33b Levels and Lipid Disorders in Diabetes Mellitus. J. Atheroscler. Thromb. 2016, 23, 1259–1260. [Google Scholar] [CrossRef] [PubMed] [Green Version]
- Januskevicius, A.; Vaitkiene, S.; Gosens, R.; Janulaityte, I.; Hoppenot, D.; Sakalauskas, R.; Malakauskas, K. Eosinophils enhance WNT-5a and TGF-β1 genes expression in airway smooth muscle cells and promote their proliferation by increased extracellular matrix proteins production in asthma. BMC Pulm. Med. 2016, 16, 94. [Google Scholar] [CrossRef] [PubMed] [Green Version]
- Lin, J.; Li, J.; Huang, B.; Liu, J.; Chen, X.; Chen, X.M.; Xu, Y.M.; Huang, L.F.; Wang, X.Z. Exosomes: Novel biomarkers for clinical diagnosis. Sci. World J. 2015, 2015, 657086. [Google Scholar] [CrossRef] [PubMed]
- Tohidinik, H.R.; Mallah, N.; Takkouche, B. History of allergic rhinitis and risk of asthma; a systematic review and meta-analysis. World Allergy Organ. J. 2019, 12, 100069. [Google Scholar] [CrossRef] [Green Version]
- Gon, Y.; Hashimoto, S. Role of airway epithelial barrier dysfunction in pathogenesis of asthma. Allergol Int. 2018, 67, 12–17. [Google Scholar] [CrossRef]
- Rosati, M.G.; Peters, A.T. Relationships among allergic rhinitis, asthma, and chronic rhinosinusitis. Am. J. Rhinol. Allergy 2016, 30, 44–47. [Google Scholar] [CrossRef] [Green Version]
- Boonpiyathad, T.; Sözener, Z.C.; Satitsuksanoa, P.; Akdis, C.A. Immunologic mechanisms in asthma. Semin. Immunol. 2019, 46, 101333. [Google Scholar] [CrossRef]
- Simard, M.; Madore, A.M.; Girard, S.; Waserman, S.; Duan, Q.; Subbarao, P.; Sears, M.R.; Moraes, T.J.; Becker, A.B.; Turvey, S.E.; et al. Polygenic risk score for atopic dermatitis in the Canadian population. J. Allergy Clin. Immunol. 2020. [Google Scholar] [CrossRef]
- American Thoracic Society. Standardization of Spirometry, 1994 Update. Am. J. Respir. Crit. Care Med. 1995, 152, 1107–1136. [Google Scholar] [CrossRef]
- Standards for the diagnosis and care of patients with chronic obstructive pulmonary disease (COPD) and asthma. This official statement of the American Thoracic Society was adopted by the ATS Board of Directors, November 1986. Am. Rev. Respir. Dis. 1987, 136, 225–244. [Google Scholar] [CrossRef]
- Laprise, C. The Saguenay-Lac-Saint-Jean asthma familial collection: The genetics of asthma in a young founder population. Genes Immun. 2014, 15, 247–255. [Google Scholar] [CrossRef] [PubMed]
- Madore, A.M.; Pain, L.; Boucher-Lafleur, A.M.; Morin, A.; Meloche, J.; Simon, M.M.; Ge, B.; Kwan, T.; Cheung, W.A.; Pastinen, T.; et al. Asthma-associated polymorphisms in 17q12-21 locus modulate methylation and gene expression of GSDMA in naïve CD4(+) T cells. J. Genet. Genom. 2020, 47, 171–174. [Google Scholar] [CrossRef]
- Houseman, E.A.; Accomando, W.P.; Koestler, D.C.; Christensen, B.C.; Marsit, C.J.; Nelson, H.H.; Wiencke, J.K.; Kelsey, K.T. DNA methylation arrays as surrogate measures of cell mixture distribution. BMC Bioinform. 2012, 13, 86. [Google Scholar] [CrossRef] [PubMed] [Green Version]
- Reinius, L.E.; Acevedo, N.; Joerink, M.; Pershagen, G.; Dahlén, S.E.; Greco, D.; Söderhäll, C.; Scheynius, A.; Kere, J. Differential DNA methylation in purified human blood cells: Implications for cell lineage and studies on disease susceptibility. PLoS ONE 2012, 7, e41361. [Google Scholar] [CrossRef] [PubMed]
- Leek, J.T.; Storey, J.D. Capturing heterogeneity in gene expression studies by surrogate variable analysis. PLoS Genet. 2007, 3, 1724–1735. [Google Scholar] [CrossRef] [PubMed] [Green Version]
- O’Sullivan, F.; Keenan, J.; Aherne, S.; O’Neill, F.; Clarke, C.; Henry, M.; Meleady, P.; Breen, L.; Barron, N.; Clynes, M.; et al. Parallel mRNA, proteomics and miRNA expression analysis in cell line models of the intestine. World J. Gastroenterol. 2017, 23, 7369–7386. [Google Scholar] [CrossRef]


| Eosinophil Samples a (n = 145) | Affected b (n = 130) | Unaffected c (n = 15) | |
|---|---|---|---|
| M:F ratio | 1:1.04 | 1:1.09 | 1:0.67 |
| Age, mean (range) | 46 (18–81) | 45 (18–81) | 55 (22–72) |
| Age, median | 47 | 60 | 44 |
| Smoking status d | |||
| Non-smokers, n (%) | 93 (64) | 88 (68) | 5 (33) |
| Ex-smokers, n (%) | 29 (20) | 22 (17) | 7 (47) |
| Smokers, n (%) | 22 (15) | 19 (15) | 3 (20) |
| PC20, mean mg/mL (SD) e | 1.76 (1.67) | 1.5 (1.57) | 3.75 (0.76) |
| IgE, mean µg/L (SD) f | 4.93 (1.67) | 5.09 (1.67) | 3.61 (0.97) |
| FEV1, mean% pred. (range) g | 94.72 (31–146) | 94.25 (31–46) | 98.6 (65–119) |
| FEV1/FVC ratio, mean (range) h | 79.09 (38–97) | 94.25 (38–97) | 82.43 (68–96) |
| White blood cell count i | |||
| Eosinophil, mean × 109/L (%) | 0.25 (3.76) | 0.26 (3.96) | 0.15 (2.18) |
| Lymphocyte, mean × 109/L (%) | 2.15 (32.12) | 2.15 (32.05) | 2.03 (31.43) |
| Monocyte, mean × 109/L (%) | 0.52 (7.89) | 0.53 (7.88) | 0.50 (8.01) |
| Neutrophil, mean × 109/L (%) | 3.80 (55.60) | 3.82 (55.45) | 3.72 (57.89) |
| Basophil, mean × 109/L (%) | 0.04 (0.78) | 0.05 (0.77) | 0.04 (0.89) |
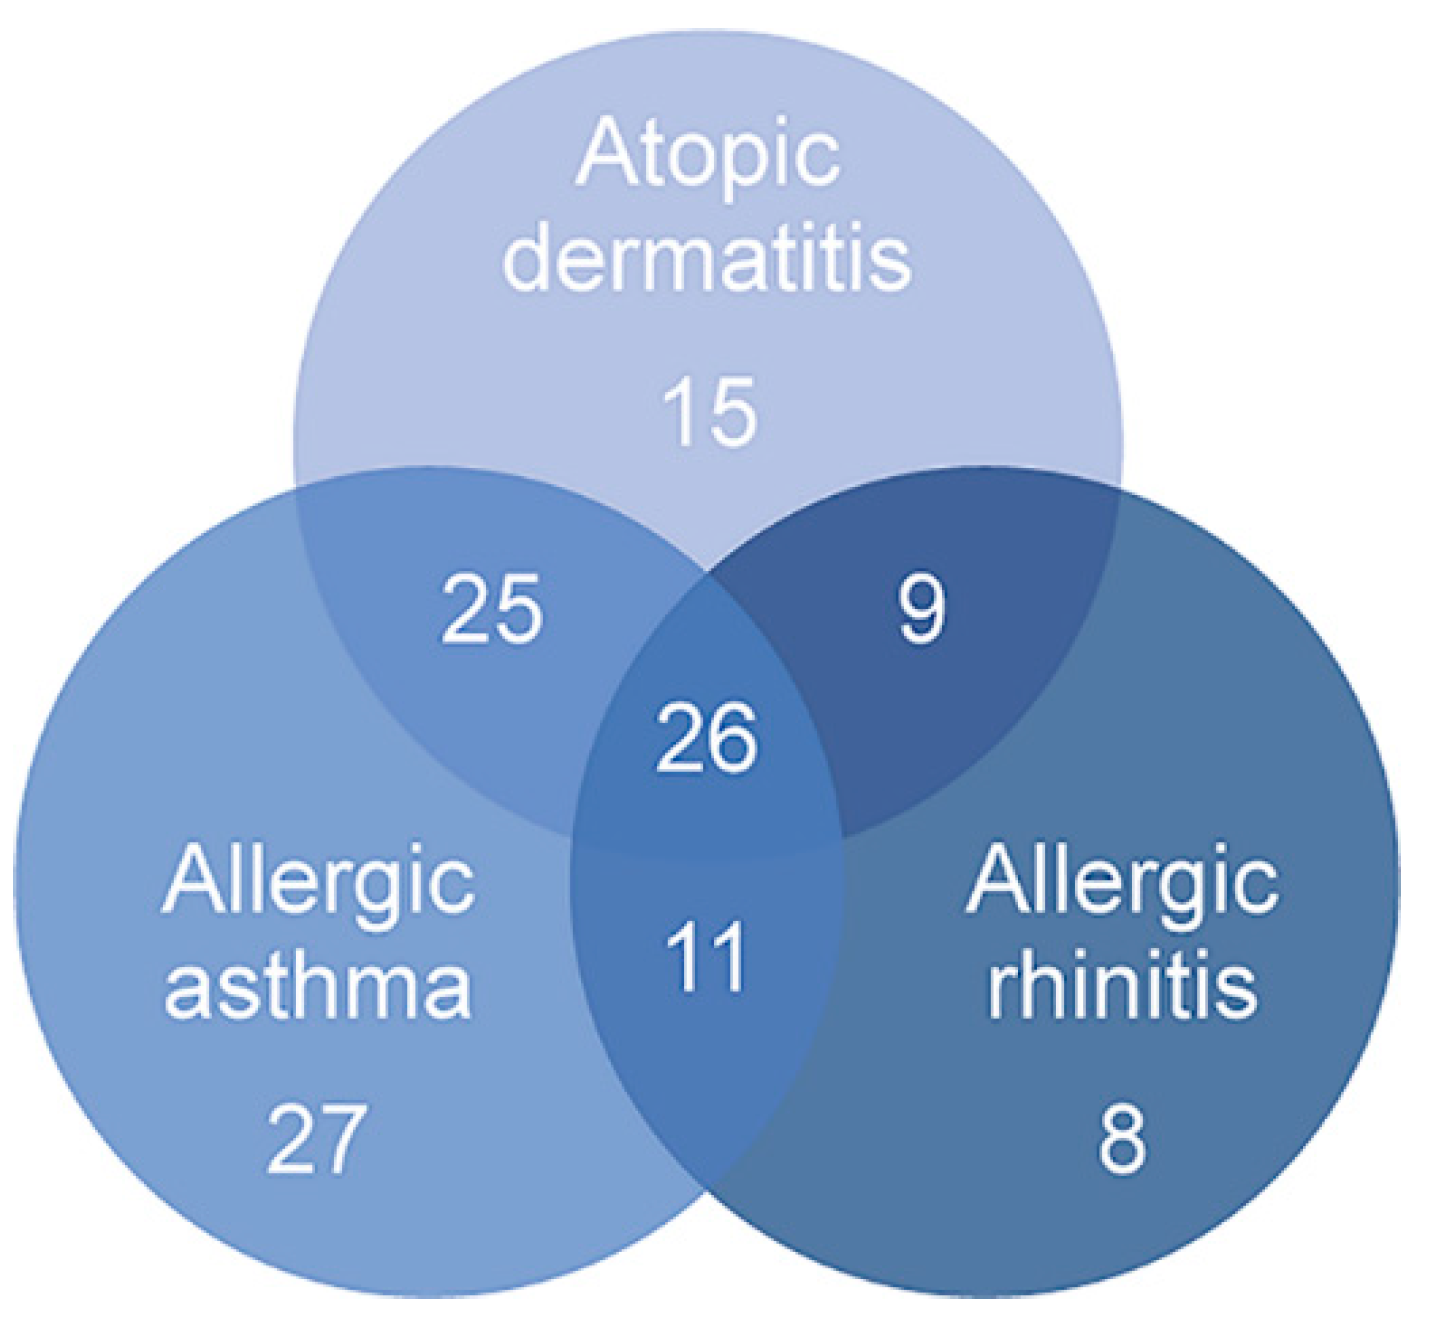
| Asthma, n (%) j | 89 (61.81) | ||
| Allergic rhinitis, n (%) k | 54 (37.50) | ||
| Atopic dermatitis, n (%) l | 75 (52.08) |
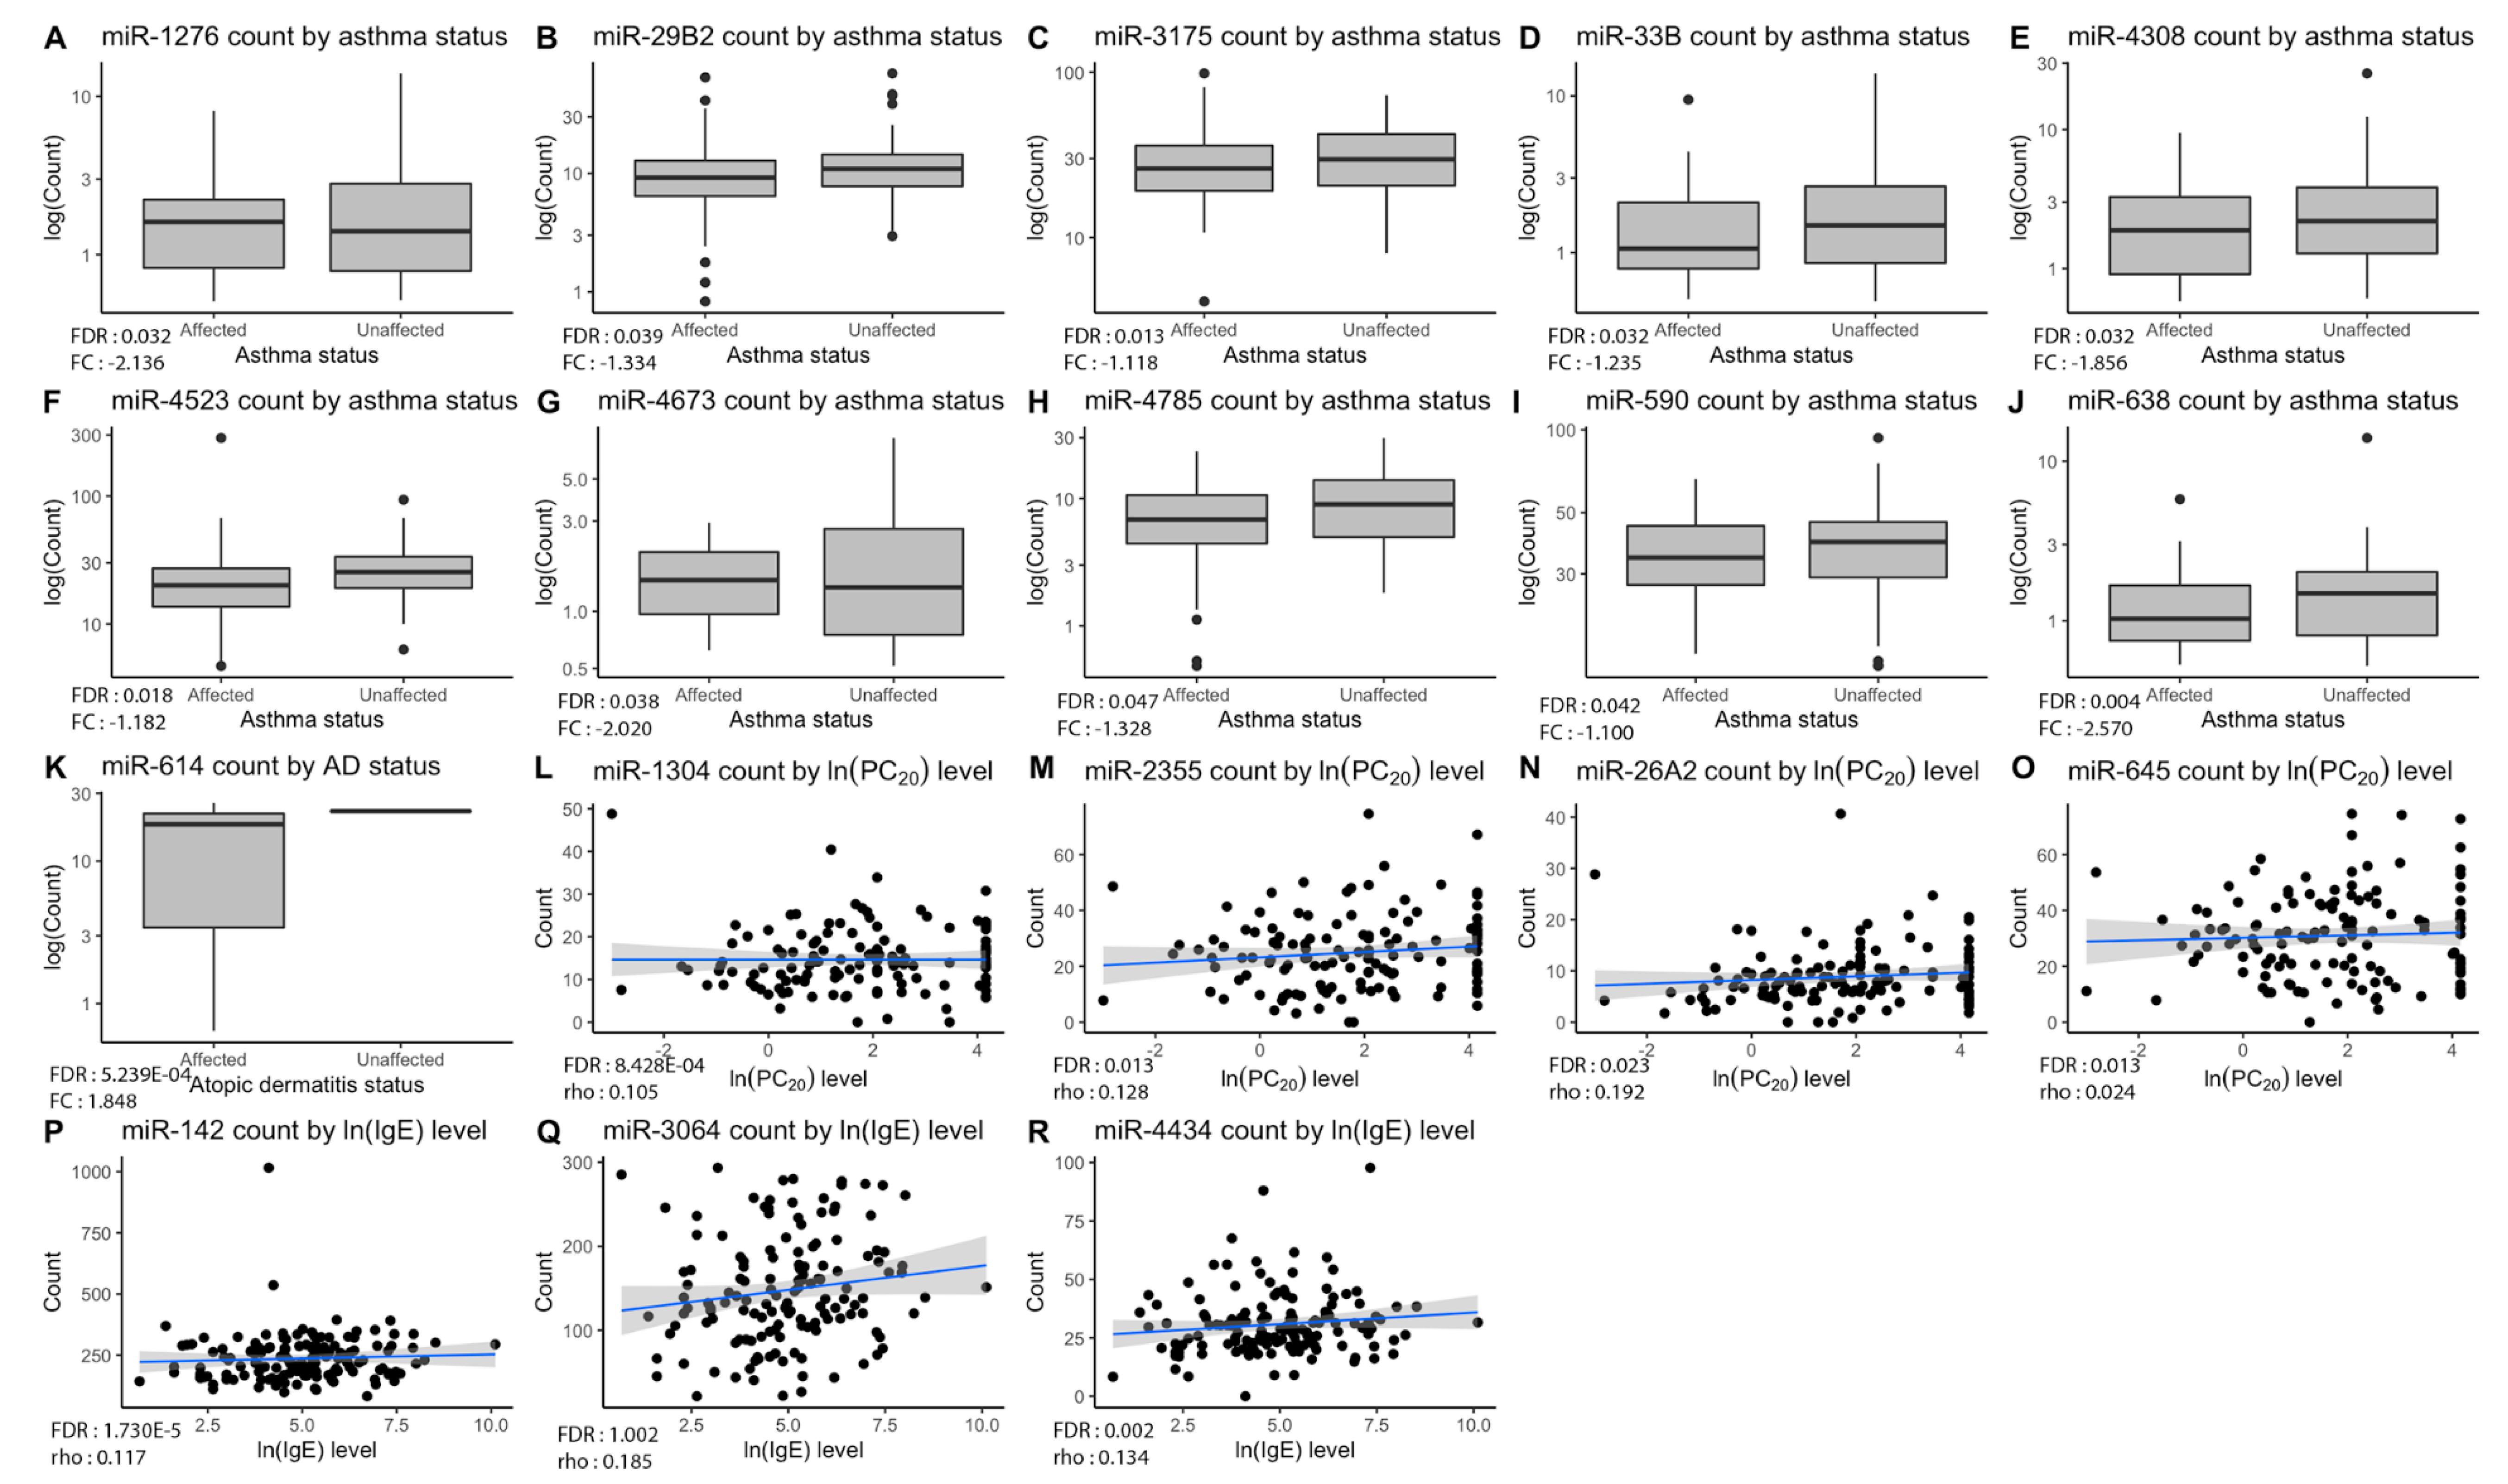
| miRNA | Phenotype Observed | p-Value | FDR a | FC or rho b |
|---|---|---|---|---|
| miR-1276 | Asthma | 4.511 × 10⁻⁴ | 0.032 | −2.136 |
| miR-29B2 | Asthma | 7.260 × 10⁻⁴ | 0.040 | −1.334 |
| miR-3175 | Asthma | 5.920 × 10⁻⁵ | 0.013 | −1.118 |
| miR-33B | Asthma | 4.971 × 10⁻⁴ | 0.032 | −1.235 |
| miR-4308 | Asthma | 5.039 × 10⁻⁴ | 0.032 | −1.856 |
| miR-4523 | Asthma | 1.195 × 10⁻⁴ | 0.018 | −1.182 |
| miR-4673 | Asthma | 2.164 × 10⁻⁴ | 0.024 | −2.020 |
| miR-4785 | Asthma | 0.001 | 0.047 | −1.328 |
| miR-590 | Asthma | 8.479 × 10⁻⁴ | 0.041 | −1.100 |
| miR-638 | Asthma | 1.010 × 10⁻⁵ | 0.004 | −2.570 |
| miR-614 | Atopic dermatitis | 1.190 × 10⁻⁶ | 5.239 × 10⁻⁴ | 1.847 |
| miR-142 | IgE | 3.940 × 10⁻⁸ | 1.730 × 10⁻⁵ | 0.112 |
| miR-3064 | IgE | 4.880 × 10⁻⁵ | 0.007 | 0.185 |
| miR-4434 | IgE | 4.060 × 10⁻⁵ | 0.007 | 0.134 |
| miR-1304 | PC20 | 1.920 × 10⁻⁶ | 8.428 × 10⁻⁴ | 0.105 |
| miR-2355 | PC20 | 7.120 × 10⁻⁵ | 0.013 | 0.128 |
| miR-26A2 | PC20 | 2.054 × 10⁻⁵ | 0.023 | 0.192 |
| miR-645 | PC20 | 8.540 × 10⁻⁵ | 0.013 | 0.024 |
| Pathway | Nb of Gene Targets | GWAS Associated Genes a | SLSJ Associated Genes a | |
|---|---|---|---|---|
| Negative correlation | Cell growth, division, differentiation and apoptosis | 64 | COL15A1, SOCS1, BCL2L1, DUSP2, SSR3 | COL15A1, SOCS1 |
| Immune response | 33 | FER, IL6 | ||
| Protein cleavage, biosynthesis and modification | 21 | BACE2 | ||
| DNA and RNA synthesis and replication | 19 | MAT2A | ||
| Aldehyde transport and reactions | 2 | DCAKD | ||
| Positive correlation | Cell growth, division, differentiation and apoptosis | 158 | APC, CASP8, CRK, DUSP2, FOS, FRS2, HSPA1B, PRKCD, RTF1, SKI, TGFBR1 | HSPA1B, HSPA6, YWHAZ |
| Brain, neurotransmission and nervous system | 44 | ALDH1A2, CDC42 | ARHGEF1 | |
| Immune response | 38 | REL, TNFA1P3 | CDNK1B, STAT3 | |
| Protein cleavage, biosynthesis and modification | 35 | INO80, LRP3 | MMP9 | |
| Hormonal regulation | 29 | NAB2, POU2F1 | LDB1, SP1 |
Publisher’s Note: MDPI stays neutral with regard to jurisdictional claims in published maps and institutional affiliations. |
© 2020 by the authors. Licensee MDPI, Basel, Switzerland. This article is an open access article distributed under the terms and conditions of the Creative Commons Attribution (CC BY) license (http://creativecommons.org/licenses/by/4.0/).
Share and Cite
Bélanger, É.; Madore, A.-M.; Boucher-Lafleur, A.-M.; Simon, M.-M.; Kwan, T.; Pastinen, T.; Laprise, C. Eosinophil microRNAs Play a Regulatory Role in Allergic Diseases Included in the Atopic March. Int. J. Mol. Sci. 2020, 21, 9011. https://0-doi-org.brum.beds.ac.uk/10.3390/ijms21239011
Bélanger É, Madore A-M, Boucher-Lafleur A-M, Simon M-M, Kwan T, Pastinen T, Laprise C. Eosinophil microRNAs Play a Regulatory Role in Allergic Diseases Included in the Atopic March. International Journal of Molecular Sciences. 2020; 21(23):9011. https://0-doi-org.brum.beds.ac.uk/10.3390/ijms21239011
Chicago/Turabian StyleBélanger, Émile, Anne-Marie Madore, Anne-Marie Boucher-Lafleur, Marie-Michelle Simon, Tony Kwan, Tomi Pastinen, and Catherine Laprise. 2020. "Eosinophil microRNAs Play a Regulatory Role in Allergic Diseases Included in the Atopic March" International Journal of Molecular Sciences 21, no. 23: 9011. https://0-doi-org.brum.beds.ac.uk/10.3390/ijms21239011