The 3D Pattern of the Rainbow Trout (Oncorhynchus mykiss) Enterocytes and Intestinal Stem Cells


Abstract
:1. Introduction
2. Results
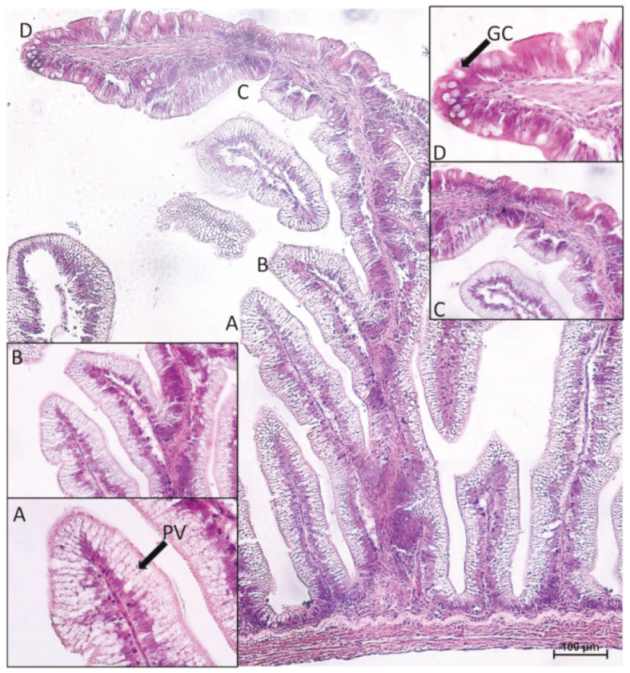
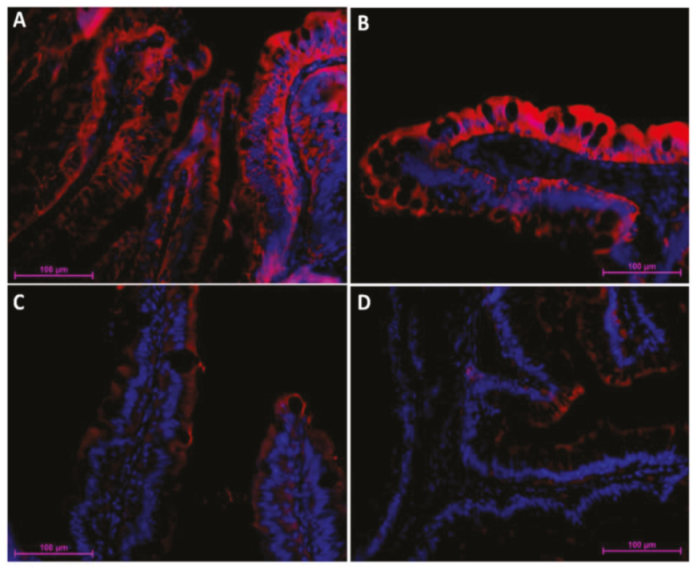
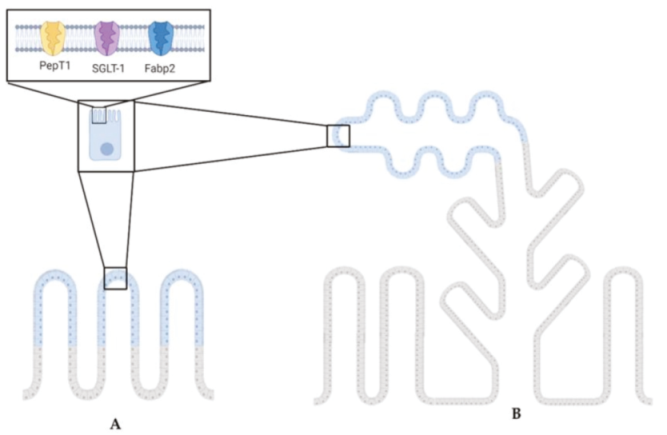
2.1. Distribution of Functional Brush Borders Proteins along the Mid-Intestine
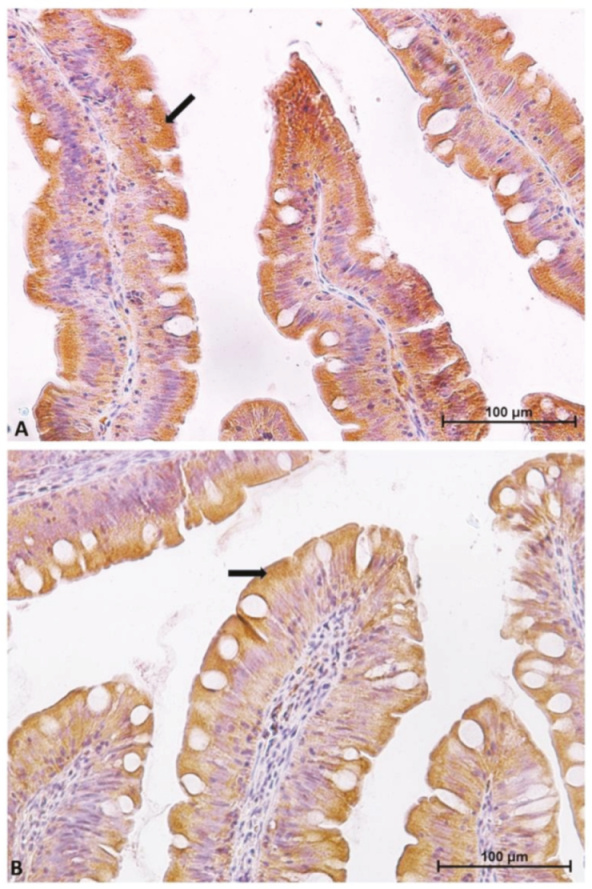
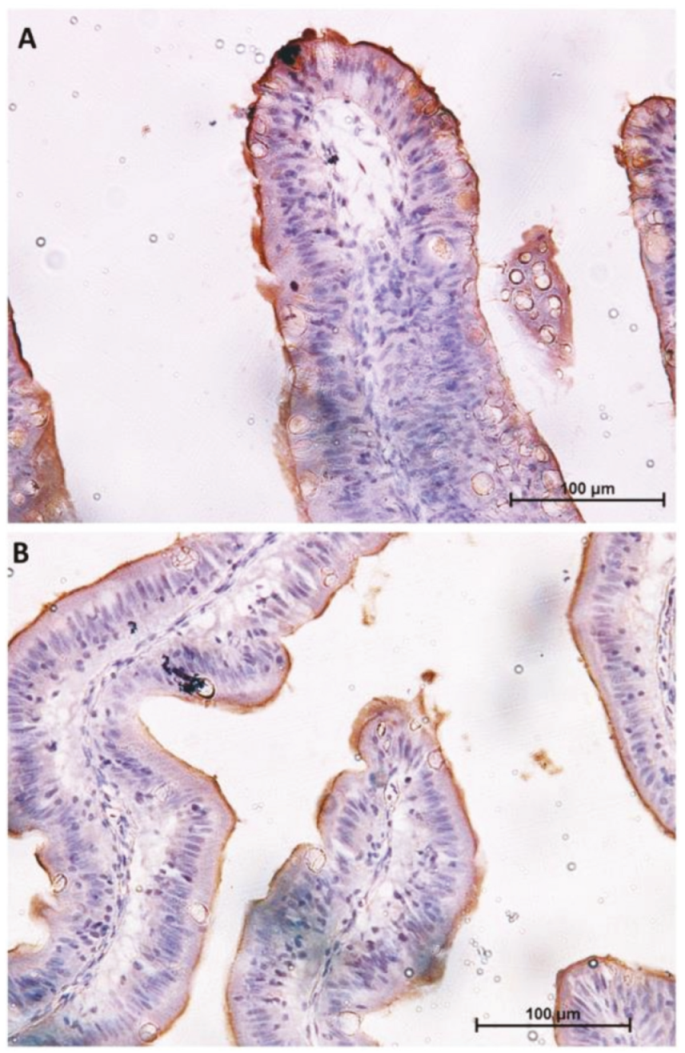
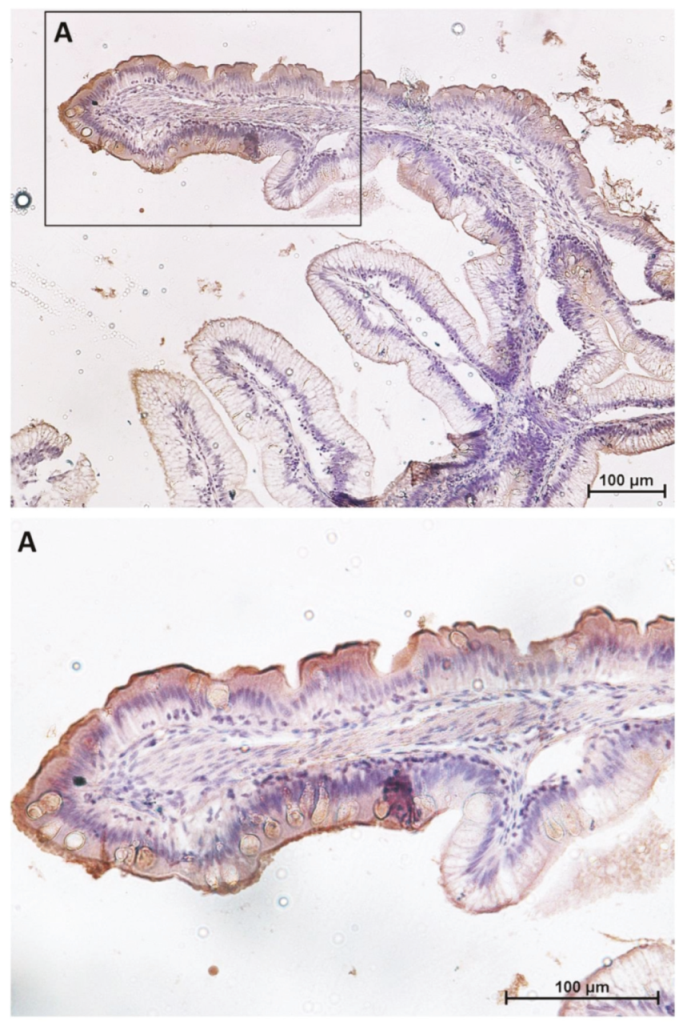
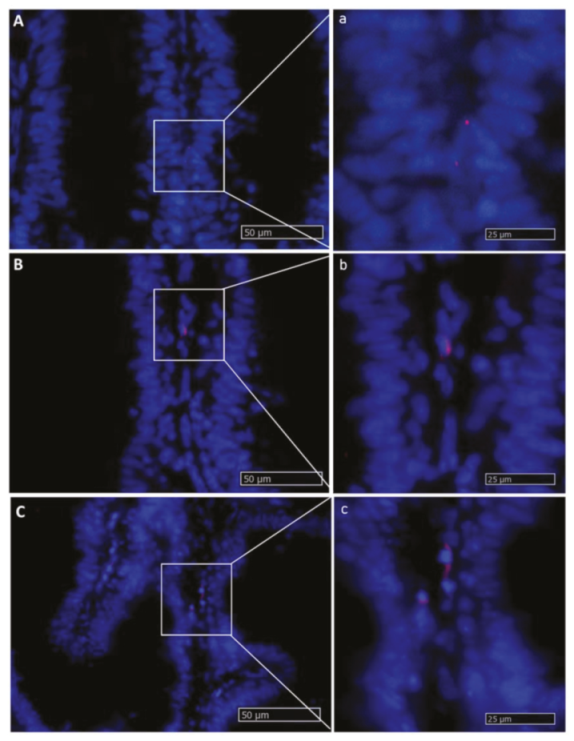
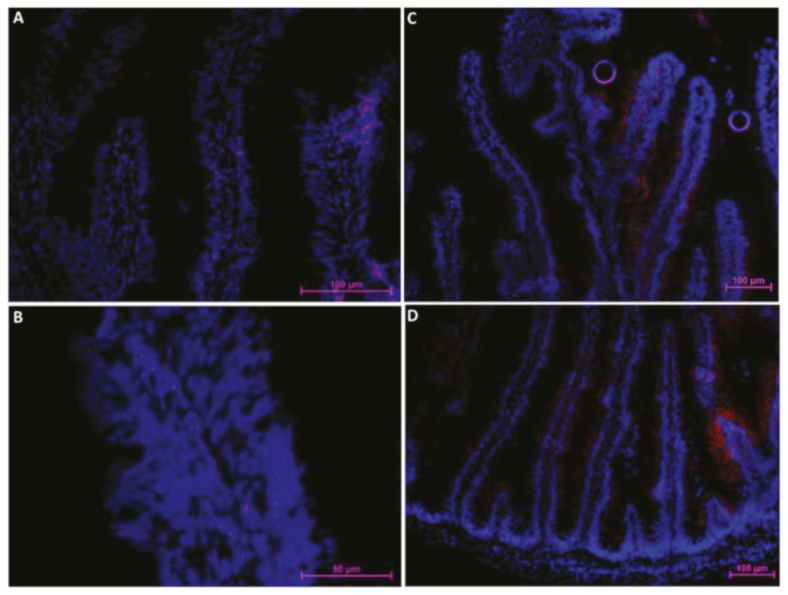
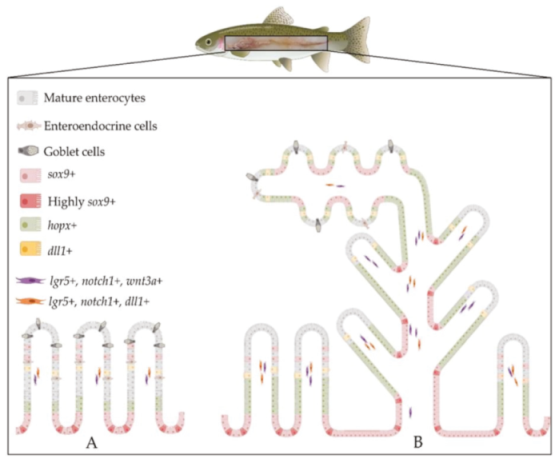
2.2. The Intestinal Stem-Cell Niche Morphological and Molecular Architecture
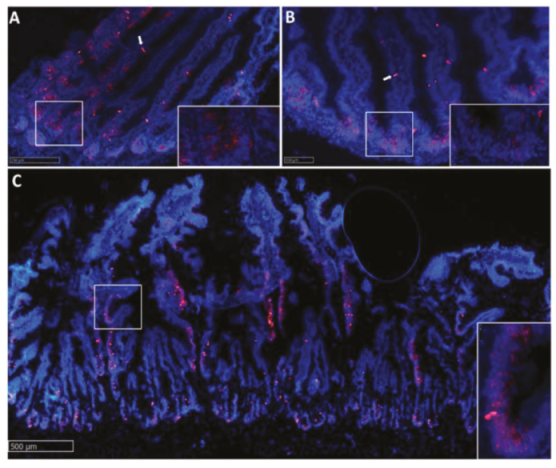
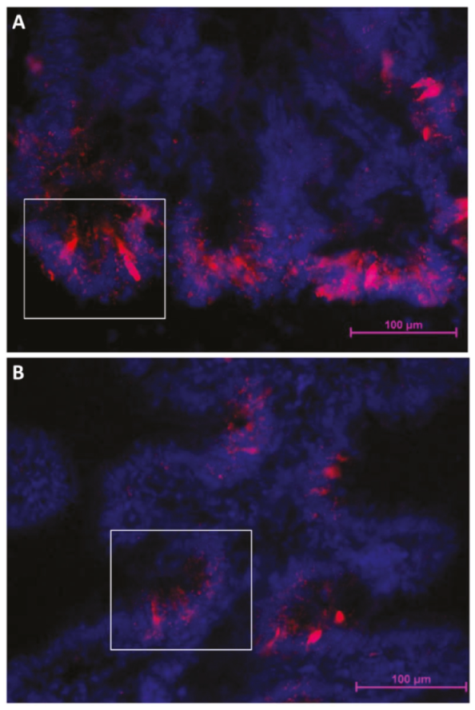
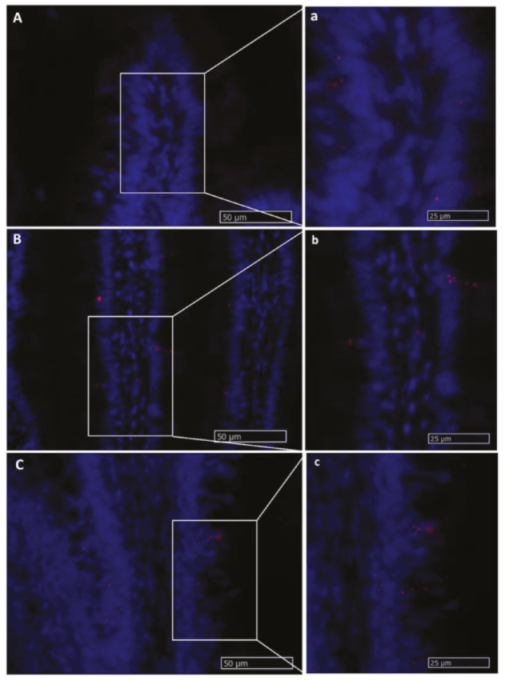
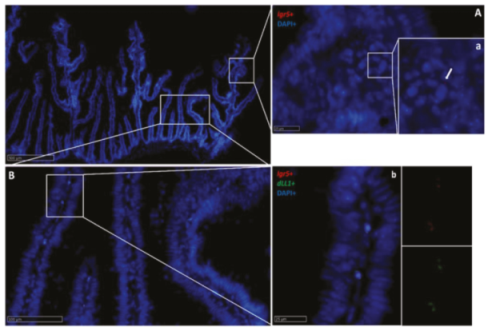
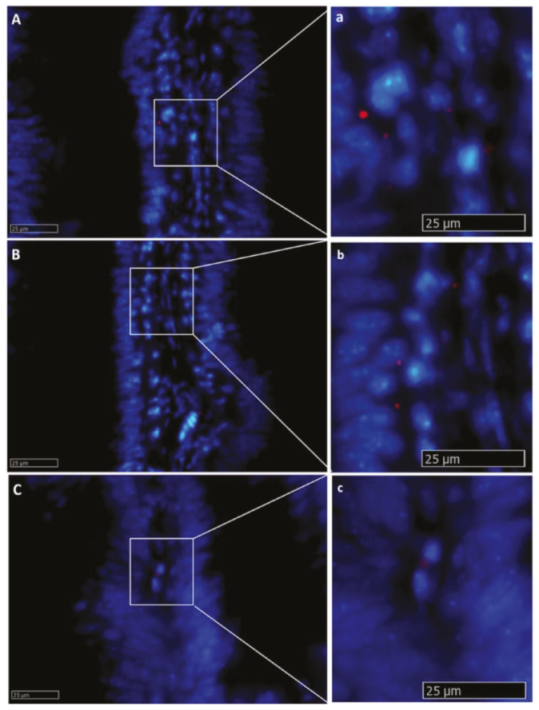
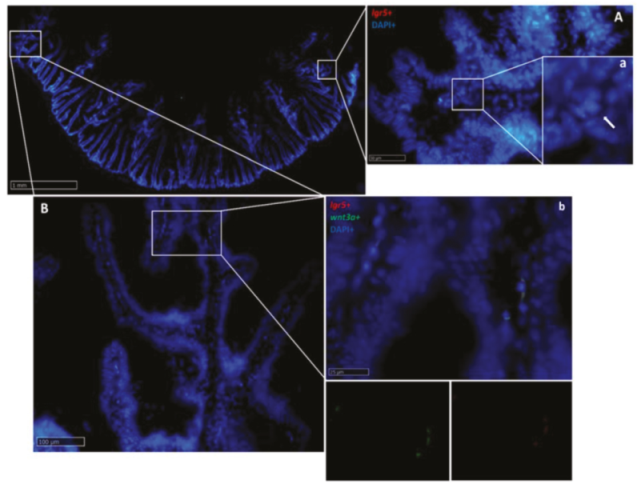
2.2.1. Lgr5
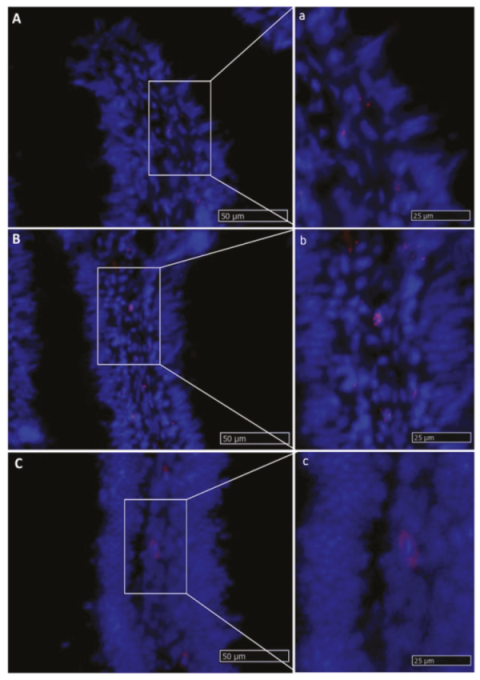
2.2.2. Hopx
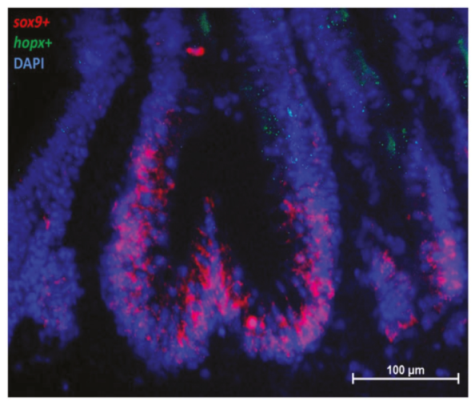
2.2.3. Sox9
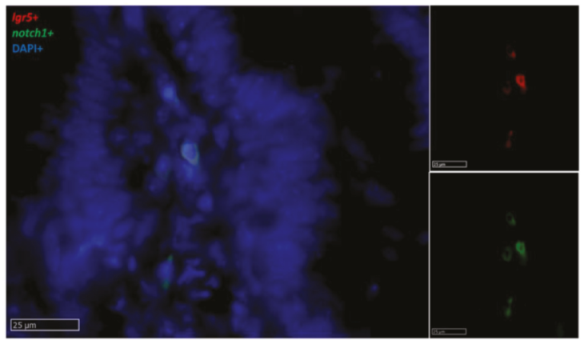
2.2.4. Notch1
2.2.5. Dll1
2.2.6. Wnt3a
3. Discussion
4. Materials and Methods
4.1. Sample Collection and Processing
4.2. Histology and Immunohistochemistry
4.3. Target Probe Design and Fluoresce in Situ Hybridization (FISH)
5. Conclusions
Author Contributions
Funding
Acknowledgments
Conflicts of Interest
Abbreviations
| RT | Rainbow trout |
| PEPT1 | Peptide transporter 1 |
| SGLT1 | Sodium–glucose/galactose transporter 1 |
| FABP2 | Fatty-acid-binding protein 2 |
| ISCs | Intestinal stem cells |
| LGR5 | Leucine-rich-repeat-containing G-protein-coupled receptor 5 |
| HOPX | Homeodomain-only protein |
| SOX9 | SRY-box 9 |
| NOTCH1 | Notch receptor 1 |
| DLL1 | Delta-like protein 1 |
| WNT3A | Wnt family member 3A |
| CBCs | Crypt base columnar cells |
| GI | Gastrointestinal |
| HRP | Horseradish peroxidase |
| DAB | 3,3′-Diaminobenzidine |
| DAPIFISH | 4′,6-diamidino-2-phenylindoleFluorescence in situ hybridization |
References
- FAO. The State of World Fisheries and Aquaculture 2020; FAO: Rome, Italy, 2020. [Google Scholar]
- Venold, F.F.; Penn, M.H.; Thorsen, J.; Gu, J.; Kortner, T.M.; Krogdahl, Å.; Bakke, A.M. Intestinal fatty acid binding protein (fabp2) in Atlantic salmon (Salmo salar): Localization and alteration of expression during development of diet induced enteritis. Comp. Biochem. Physiol. Part A Mol. Integr. Physiol. 2013, 164, 229–240. [Google Scholar] [CrossRef]
- Krogdahl, Å.; Gajardo, K.; Kortner, T.M.; Penn, M.; Gu, M.; Berge, G.M.; Bakke, A.M. Soya Saponins Induce Enteritis in Atlantic Salmon (Salmo salarL.). J. Agric. Food Chem. 2015, 63, 3887–3902. [Google Scholar] [CrossRef]
- Nelson, J.S.; Grande, T.; Wilson, M.V.H. Fishes of the World; John Wiley & Sons: Hoboken, NJ, USA, 2016; ISBN 9781118342336. [Google Scholar]
- Verdile, N.; Pasquariello, R.; Scolari, M.; Scirè, G.; Brevini, T.; Gandolfi, F. A Detailed Study of Rainbow Trout (Onchorhynchus mykiss) Intestine Revealed That Digestive and Absorptive Functions Are Not Linearly Distributed along Its Length. Animals 2020, 10, 745. [Google Scholar] [CrossRef]
- Fao Small-Scale Rainbow Trout Farming. Available online: http://www.fao.org/3/a-i2125e.html (accessed on 15 October 2020).
- Bjørgen, H.; Li, Y.; Kortner, T.M.; Krogdahl, Å.; Koppang, E.O. Anatomy, immunology, digestive physiology and microbiota of the salmonid intestine: Knowns and unknowns under the impact of an expanding industrialized production. Fish Shellfish. Immunol. 2020, 107, 172–186. [Google Scholar] [CrossRef] [PubMed]
- Aghaallaei, N.; Gruhl, F.; Schaefer, C.Q.; Wernet, T.; Weinhardt, V.; Centanin, L.; Loosli, F.; Baumbach, T.; Wittbrodt, J. Identification, visualization and clonal analysis of intestinal stem cells in fish. Development 2016, 143, 3470–3480. [Google Scholar] [CrossRef] [Green Version]
- LoKka, G.; Austb, L.; Falk, K.; Bjerkås, I.; Koppang, E.O. Intestinal morphology of the wild atlantic salmon (Salmo salar). J. Morphol. 2013, 274, 859–876. [Google Scholar] [CrossRef]
- Barker, N. Adult intestinal stem cells: Critical drivers of epithelial homeostasis and regeneration. Nat. Rev. Mol. Cell Biol. 2013, 15, 19–33. [Google Scholar] [CrossRef] [Green Version]
- Verdile, N.; Mirmahmoudi, R.; Brevini, T.; Gandolfi, F. Evolution of pig intestinal stem cells from birth to weaning. Animal 2019, 3, 1–10. [Google Scholar] [CrossRef]
- Barker, N.; van Oudenaarden, A.; Clevers, H. Identifying the Stem Cell of the Intestinal Crypt: Strategies and Pitfalls. Cell Stem Cell 2012, 11, 452–460. [Google Scholar] [CrossRef] [Green Version]
- Barker, N.; van de Wetering, M.; Clevers, H. The intestinal stem cell. Genes Dev. 2008, 22, 1856–1864. [Google Scholar] [CrossRef] [Green Version]
- Van Der Flier, L.G.; Clevers, H. Stem Cells, Self-Renewal, and Differentiation in the Intestinal Epithelium. Annu. Rev. Physiol. 2009, 71, 241–260. [Google Scholar] [CrossRef]
- Baulies, A.; Angelis, N.; Li, V.S.W. Hallmarks of intestinal stem cells. Development 2020, 147. [Google Scholar] [CrossRef]
- Li, L.; Clevers, H. Coexistence of Quiescent and Active Adult Stem Cells in Mammals. Science 2010, 327, 542–545. [Google Scholar] [CrossRef] [Green Version]
- Umar, S. Intestinal Stem Cells. Methods Mol. Biol. 2020, 12, 340–348. [Google Scholar] [CrossRef]
- Wong, M.H. Regulation of Intestinal Stem Cells. J. Investig. Dermatol. Symp. Proc. 2004, 9, 224–228. [Google Scholar] [CrossRef]
- Clevers, H.; Bevins, C.L. Paneth Cells: Maestros of the Small Intestinal Crypts. Annu. Rev. Physiol. 2013, 75, 289–311. [Google Scholar] [CrossRef]
- Li, J.; Zhang, S.; Li, R.; Lin, X.; Mi, Y.; Zhang, C. Culture and characterization of chicken small intestinal crypts. Poult. Sci. 2018, 97, 1536–1543. [Google Scholar] [CrossRef]
- Li, J.; Prochaska, M.; Maney, L.; Wallace, K.N. Development and organization of the zebrafish intestinal epithelial stem cell niche. Dev. Dyn. 2020, 249, 76–87. [Google Scholar] [CrossRef]
- Crosnier, C.; Vargesson, N.; Gschmeissner, S.; Ariza-McNaughton, L.; Morrison, A.; Lewis, J. Delta-Notch signalling controls commitment to a secretory fate in the zebrafish intestine. Development 2005, 132, 1093–1104. [Google Scholar] [CrossRef] [Green Version]
- Cheesman, S.E.; Neal, J.T.; Mittge, E.; Seredick, B.M.; Guillemin, K. Epithelial cell proliferation in the developing zebrafish intestine is regulated by the Wnt pathway and microbial signaling via Myd88. Proc. Natl. Acad. Sci. USA 2011, 108, 4570–4577. [Google Scholar] [CrossRef] [Green Version]
- Beumer, J.; Clevers, H. Cell fate specification and differentiation in the adult mammalian intestine. Nat. Rev. Mol. Cell Biol. 2020, 1–15. [Google Scholar] [CrossRef] [PubMed]
- Dempsey, P.J.; Bohin, N.; Samuelson, L.C. Notch Pathway Regulation of Intestinal Cell Fate. In Physiology of the Gastrointestinal Tract, 6th ed.; Elsevier Inc.: Amsterdam, The Netherlands, 2018; Volumes 1–2, pp. 141–183. ISBN 9780128124260. [Google Scholar]
- Li, Y.; Kortner, T.M.; Chikwati, E.M.; Munang’Andu, H.M.; Lock, E.-J.; Krogdahl, Å. Gut health and vaccination response in pre-smolt Atlantic salmon (Salmo salar) fed black soldier fly (Hermetia illucens) larvae meal. Fish Shellfish Immunol. 2019, 86, 1106–1113. [Google Scholar] [CrossRef]
- Glover, C.N.; Petri, D.; Tollefsen, K.-E.; Jørum, N.; Handy, R.D.; Berntssen, M. Assessing the sensitivity of Atlantic salmon (Salmo salar) to dietary endosulfan exposure using tissue biochemistry and histology. Aquat. Toxicol. 2007, 84, 346–355. [Google Scholar] [CrossRef]
- Wang, J.; Yan, X.; Lu, R.; Meng, X.; Nie, G. Peptide transporter 1 (PepT1) in fish: A review. Aquac. Fish. 2017, 2, 193–206. [Google Scholar] [CrossRef]
- Ostaszewska, T.; Kamaszewski, M.; Grochowski, P.; Dabrowski, K.; Verri, T.; Aksakal, E.; Szatkowska, I.; Nowak-Zyczynska, Z.; Dobosz, S. The effect of peptide absorption on PepT1 gene expression and digestive system hormones in rainbow trout (Oncorhynchus mykiss). Comp. Biochem. Physiol. Part A Mol. Integr. Physiol. 2010, 155, 107–114. [Google Scholar] [CrossRef] [PubMed]
- Romano, A.; Barca, A.; Storelli, C.; Verri, T. Teleost fish models in membrane transport research: The PEPT1(SLC15A1) H+–oligopeptide transporter as a case study. J. Physiol. 2014, 592, 881–897. [Google Scholar] [CrossRef]
- Kamalam, B.S.; Panserat, S.; Aguirre, P.; Geurden, I.; Fontagné-Dicharry, S.; Médale, F. Selection for high muscle fat in rainbow trout induces potentially higher chylomicron synthesis and PUFA biosynthesis in the intestine. Comp. Biochem. Physiol. Part A Mol. Integr. Physiol. 2013, 164, 417–427. [Google Scholar] [CrossRef]
- Terova, G.; Robaina, L.; Izquierdo, M.; Cattaneo, A.; Molinari, S.; Bernardini, G.; Saroglia, M. PepT1 mRNA expression levels in sea bream (Sparus aurata) fed different plant protein sources. SpringerPlus 2013, 2, 1–14. [Google Scholar] [CrossRef] [Green Version]
- Polakof, S.; Alvarez-Otero, R.; Soengas, J.L. Gut glucose metabolism in rainbow trout: Implications in glucose homeostasis and glucosensing capacity. Am. J. Physiol. Integr. Comp. Physiol. 2010, 299, R19–R32. [Google Scholar] [CrossRef] [Green Version]
- Subramaniam, M.; Weber, L.P.; Loewen, M.E. Intestinal electrogenic sodium-dependent glucose absorption in tilapia and trout reveal species differences inSLC5A-associated kinetic segmental segregation. Am. J. Physiol. Integr. Comp. Physiol. 2019, 316, R222–R234. [Google Scholar] [CrossRef]
- Buddington, R.K.; Krogdahl, A.; Bakke-McKellep, A.M. The intestines of carnivorous fish: Structure and functions and the relations with diet. Acta Physiol. Scandinavica. Suppl. 1997, 638, 67–80. [Google Scholar] [CrossRef]
- Ferraris, R.P.; Ahearn, G.A. Sugar and Amino Acid Transport in Fish Intestine. Comp. Biochem. Physiol. Part A Physiol. 1984, 77, 397–413. [Google Scholar] [CrossRef]
- Gehart, H.; Clevers, H. Tales from the crypt: New insights into intestinal stem cells. Nat. Rev. Gastroenterol. Hepatol. 2019, 16, 19–34. [Google Scholar] [CrossRef]
- Wallace, K.N.; Akhter, S.; Smith, E.M.; Lorent, K.; Pack, M. Intestinal growth and differentiation in zebrafish. Mech. Dev. 2005, 122, 157–173. [Google Scholar] [CrossRef]
- Lynch, J.P.; Metz, D.C.; Editors, S.; Barker, N.; Clevers, H. Basic and Clinical Reviews in Basic and Clinical Markers of Adult Stem Cells. YGAST 2010, 138, 1681–1696. [Google Scholar] [CrossRef]
- Halpern, K.B.; Massalha, H.; Zwick, R.K.; Moor, A.E.; Castillo-Azofeifa, D.; Rozenberg, M.; Farack, L.; Egozi, A.; Miller, D.R.; Averbukh, I.; et al. Lgr5+ telocytes are a signaling source at the intestinal villus tip. Nat. Commun. 2020, 11, 1–12. [Google Scholar] [CrossRef] [Green Version]
- Greicius, G.; Kabiri, Z.; Sigmundsson, K.; Liang, C.; Bunte, R.; Singh, M.K.; Virshup, D.M. PDGFRα+ pericryptal stromal cells are the critical source of Wnts and RSPO3 for murine intestinal stem cells in vivo. Proc. Natl. Acad. Sci. USA 2018, 115, E3173–E3181. [Google Scholar] [CrossRef] [Green Version]
- Kaestner, K.H. The Intestinal Stem Cell Niche: A Central Role for Foxl1-Expressing Subepithelial Telocytes. Cell. Mol. Gastroenterol. Hepatol. 2019, 8, 111–117. [Google Scholar] [CrossRef] [Green Version]
- Vannucchi, M.-G.; Traini, C.; Manetti, M.; Ibba-Manneschi, L.; Faussone-Pellegrini, M.-S. Telocytes express PDGFRα in the human gastrointestinal tract. J. Cell. Mol. Med. 2013, 17, 1099–1108. [Google Scholar] [CrossRef]
- Evangelista, S. The Telocytes: Ten Years after Their Introduction in the Scientific Literature. An Update on Their Morphology, Distribution, and Potential Roles in the Gut. Int. J. Mol. Sci. 2020, 21, 4478. [Google Scholar] [CrossRef]
- Formeister, E.J.; Sionas, A.L.; Lorance, D.K.; Barkley, C.L.; Lee, G.H.; Magness, S.T. Distinct SOX9 levels differentially mark stem/progenitor populations and enteroendocrine cells of the small intestine epithelium. Am. J. Physiol. Liver Physiol. 2009, 296, G1108–G1118. [Google Scholar] [CrossRef] [Green Version]
- Garcia-Suarez, O.; Cabo, R.; Abbate, F.; Randazzo, B.; Laurà, R.; Piccione, G.; Germanà, A.; Levanti, M. Presence and distribution of leptin and its receptor in the gut of adult zebrafish in response to feeding and fasting. Anat. Histol. Embryol. 2018, 47, 456–465. [Google Scholar] [CrossRef]
- Lueschow, S.R.; McElroy, S.J. The Paneth Cell: The Curator and Defender of the Immature Small Intestine. Front. Immunol. 2020, 11, 587. [Google Scholar] [CrossRef]
- Farin, H.F.; van Es, J.H.; Clevers, H. Redundant Sources of Wnt Regulate Intestinal Stem Cells and Promote Formation of Paneth Cells. Gastroenterology 2012, 143, 1518–1529. [Google Scholar] [CrossRef]
- Shoshkes-Carmel, M.; Wang, Y.J.; Wangensteen, K.J.; Tóth, B.; Kondo, A.; Massassa, E.E.; Itzkovitz, S.; Kaestner, K.H. Subepithelial telocytes are an important source of Wnts that supports intestinal crypts. Nature 2018, 557, 242–246. [Google Scholar] [CrossRef]
- Giorgini, E.; Randazzo, B.; Gioacchini, G.; Cardinaletti, G.; Vaccari, L.; Tibaldi, E.; Olivotto, I. New insights on the macromolecular building of rainbow trout (O. mykiss) intestine: FTIR Imaging and histological correlative study. Aquaculture 2018, 497, 1–9. [Google Scholar] [CrossRef]


| mRNA Target | Channel | Cat.N. |
|---|---|---|
| lgr5 | Channel 1 | 847731 |
| hopx | Channel 2 | 847761-C2 |
| wnt3a | Channel 2 | 847771-C2 |
| sox9 | Channel 3 | 847751-C3 |
| notch | Channel 3 | 847741-C3 |
| dll1 | Channel 3 | 853451-C3 |
Publisher’s Note: MDPI stays neutral with regard to jurisdictional claims in published maps and institutional affiliations. |
© 2020 by the authors. Licensee MDPI, Basel, Switzerland. This article is an open access article distributed under the terms and conditions of the Creative Commons Attribution (CC BY) license (http://creativecommons.org/licenses/by/4.0/).
Share and Cite
Verdile, N.; Pasquariello, R.; Brevini, T.A.L.; Gandolfi, F. The 3D Pattern of the Rainbow Trout (Oncorhynchus mykiss) Enterocytes and Intestinal Stem Cells. Int. J. Mol. Sci. 2020, 21, 9192. https://0-doi-org.brum.beds.ac.uk/10.3390/ijms21239192
Verdile N, Pasquariello R, Brevini TAL, Gandolfi F. The 3D Pattern of the Rainbow Trout (Oncorhynchus mykiss) Enterocytes and Intestinal Stem Cells. International Journal of Molecular Sciences. 2020; 21(23):9192. https://0-doi-org.brum.beds.ac.uk/10.3390/ijms21239192
Chicago/Turabian StyleVerdile, Nicole, Rolando Pasquariello, Tiziana A. L. Brevini, and Fulvio Gandolfi. 2020. "The 3D Pattern of the Rainbow Trout (Oncorhynchus mykiss) Enterocytes and Intestinal Stem Cells" International Journal of Molecular Sciences 21, no. 23: 9192. https://0-doi-org.brum.beds.ac.uk/10.3390/ijms21239192