Article

Fructose Induces Fluconazole Resistance in Candida albicans through Activation of Mdr1 and Cdr1 Transporters

Department of Biotransformation, Faculty of Biotechnology, University of Wrocław, 50-383 Wrocław, Poland
*
Author to whom correspondence should be addressed.
Int. J. Mol. Sci. 2021, 22(4), 2127; https://0-doi-org.brum.beds.ac.uk/10.3390/ijms22042127
Submission received: 2 February 2021 / Revised: 16 February 2021 / Accepted: 18 February 2021 / Published: 21 February 2021
(This article belongs to the Special Issue Host-Microbe Interactions as Key Mediators in Fungal Diseases)

Abstract

:
Candida albicans is a pathogenic fungus that is increasingly developing multidrug resistance (MDR), including resistance to azole drugs such as fluconazole (FLC). This is partially a result of the increased synthesis of membrane efflux transporters Cdr1p, Cdr2p, and Mdr1p. Although all these proteins can export FLC, only Cdr1p is expressed constitutively. In this study, the effect of elevated fructose, as a carbon source, on the MDR was evaluated. It was shown that fructose, elevated in the serum of diabetics, promotes FLC resistance. Using C. albicans strains with green fluorescent protein (GFP) tagged MDR transporters, it was determined that the FLC-resistance phenotype occurs as a result of Mdr1p activation and via the increased induction of higher Cdr1p levels. It was observed that fructose-grown C. albicans cells displayed a high efflux activity of both transporters as opposed to glucose-grown cells, which synthesize Cdr1p but not Mdr1p. Additionally, it was concluded that elevated fructose serum levels induce the de novo production of Mdr1p after 60 min. In combination with glucose, however, fructose induces Mdr1p production as soon as after 30 min. It is proposed that fructose may be one of the biochemical factors responsible for Mdr1p production in C. albicans cells.

1. Introduction

Candida albicans is an opportunistic fungal pathogen responsible for high morbidity and mortality in immunocompromised patients [1]. The most common class of antifungal drugs used for the treatment of candidiasis are azoles, which inhibit ergosterol biosynthesis by targeting cytochrome P-450 lanosterol 14α-demethylase (CYP51A1 and Erg11p) [2]. However, infections caused by C. albicans are recurrent and difficult to treat due to the ability of fungal cells to acquire a multidrug-resistant (MDR) phenotype [3]. In 2019, it was estimated that up to 20% of clinical Candida spp. isolates exhibit azole resistance [4].
One of the underlying processes responsible for MDR in C. albicans is the increased synthesis of membrane efflux transporters such as Cdr1p and Cdr2p, which belong to the ATP-Binding Cassette (ABC) family, and Mdr1p, which belongs to the Major Facilitator Superfamily (MFS) [5]. Although each transporter possesses different substrate specificities, all three can export fluconazole (FLC), the most common therapeutic anticandidal azole [5].
Candidiasis is associated with several diseases, including diabetes [6]. Nearly 50% of all Candida spp. have been identified in oral cavity samples from prediabetic patients [7]. It has been estimated that 80–90% of people with type I diabetes are carriers of Candida spp., and 70% of them are likely to develop infections of the skin and mucous membranes [8]. Type II diabetics are less likely to experience oral and mucosal Candida colonization but 10-fold more susceptible to inner organ infections [8,9]. The risk of C. albicans infection is increased in diabetic patients, partially due to increased serum glucose levels [8]. Glucose has already been described to promote the growth of C. albicans, as well as the Hog1-mediated resistance to oxidative and cationic stresses and increased resistance towards antifungal drugs [10,11,12]. We previously reported that glucose induces CDR1 gene expression in a C. albicans parental strain and induces the de novo synthesis of Cdr1p in a C. albicans cdr2Δ mutant [13].
Recent studies have reported an increase in fructose concentration in the serum of diabetes patients [14,15], as well as accompanying several oncological diseases [16]. Fructose overabsorption is a known etiological factor of diabetes mellitus type II or metabolic syndrome [17] and is reported to promote germ tube formation and the adherence of C. albicans to epithelial mucous surfaces [18]. However, to date, no investigations concerning the influence of fructose on either the antifungal resistance or MDR transporter activity in C. albicans have been reported.
In this study, we postulate that fructose promotes a FLC resistance in C. albicans due to the activation of Cdr1p and by inducing the de novo synthesis of Mdr1p. We propose that elevated serum fructose levels may be one of the factors responsible for Mdr1p production in C. albicans cells.

2. Results and Discussion

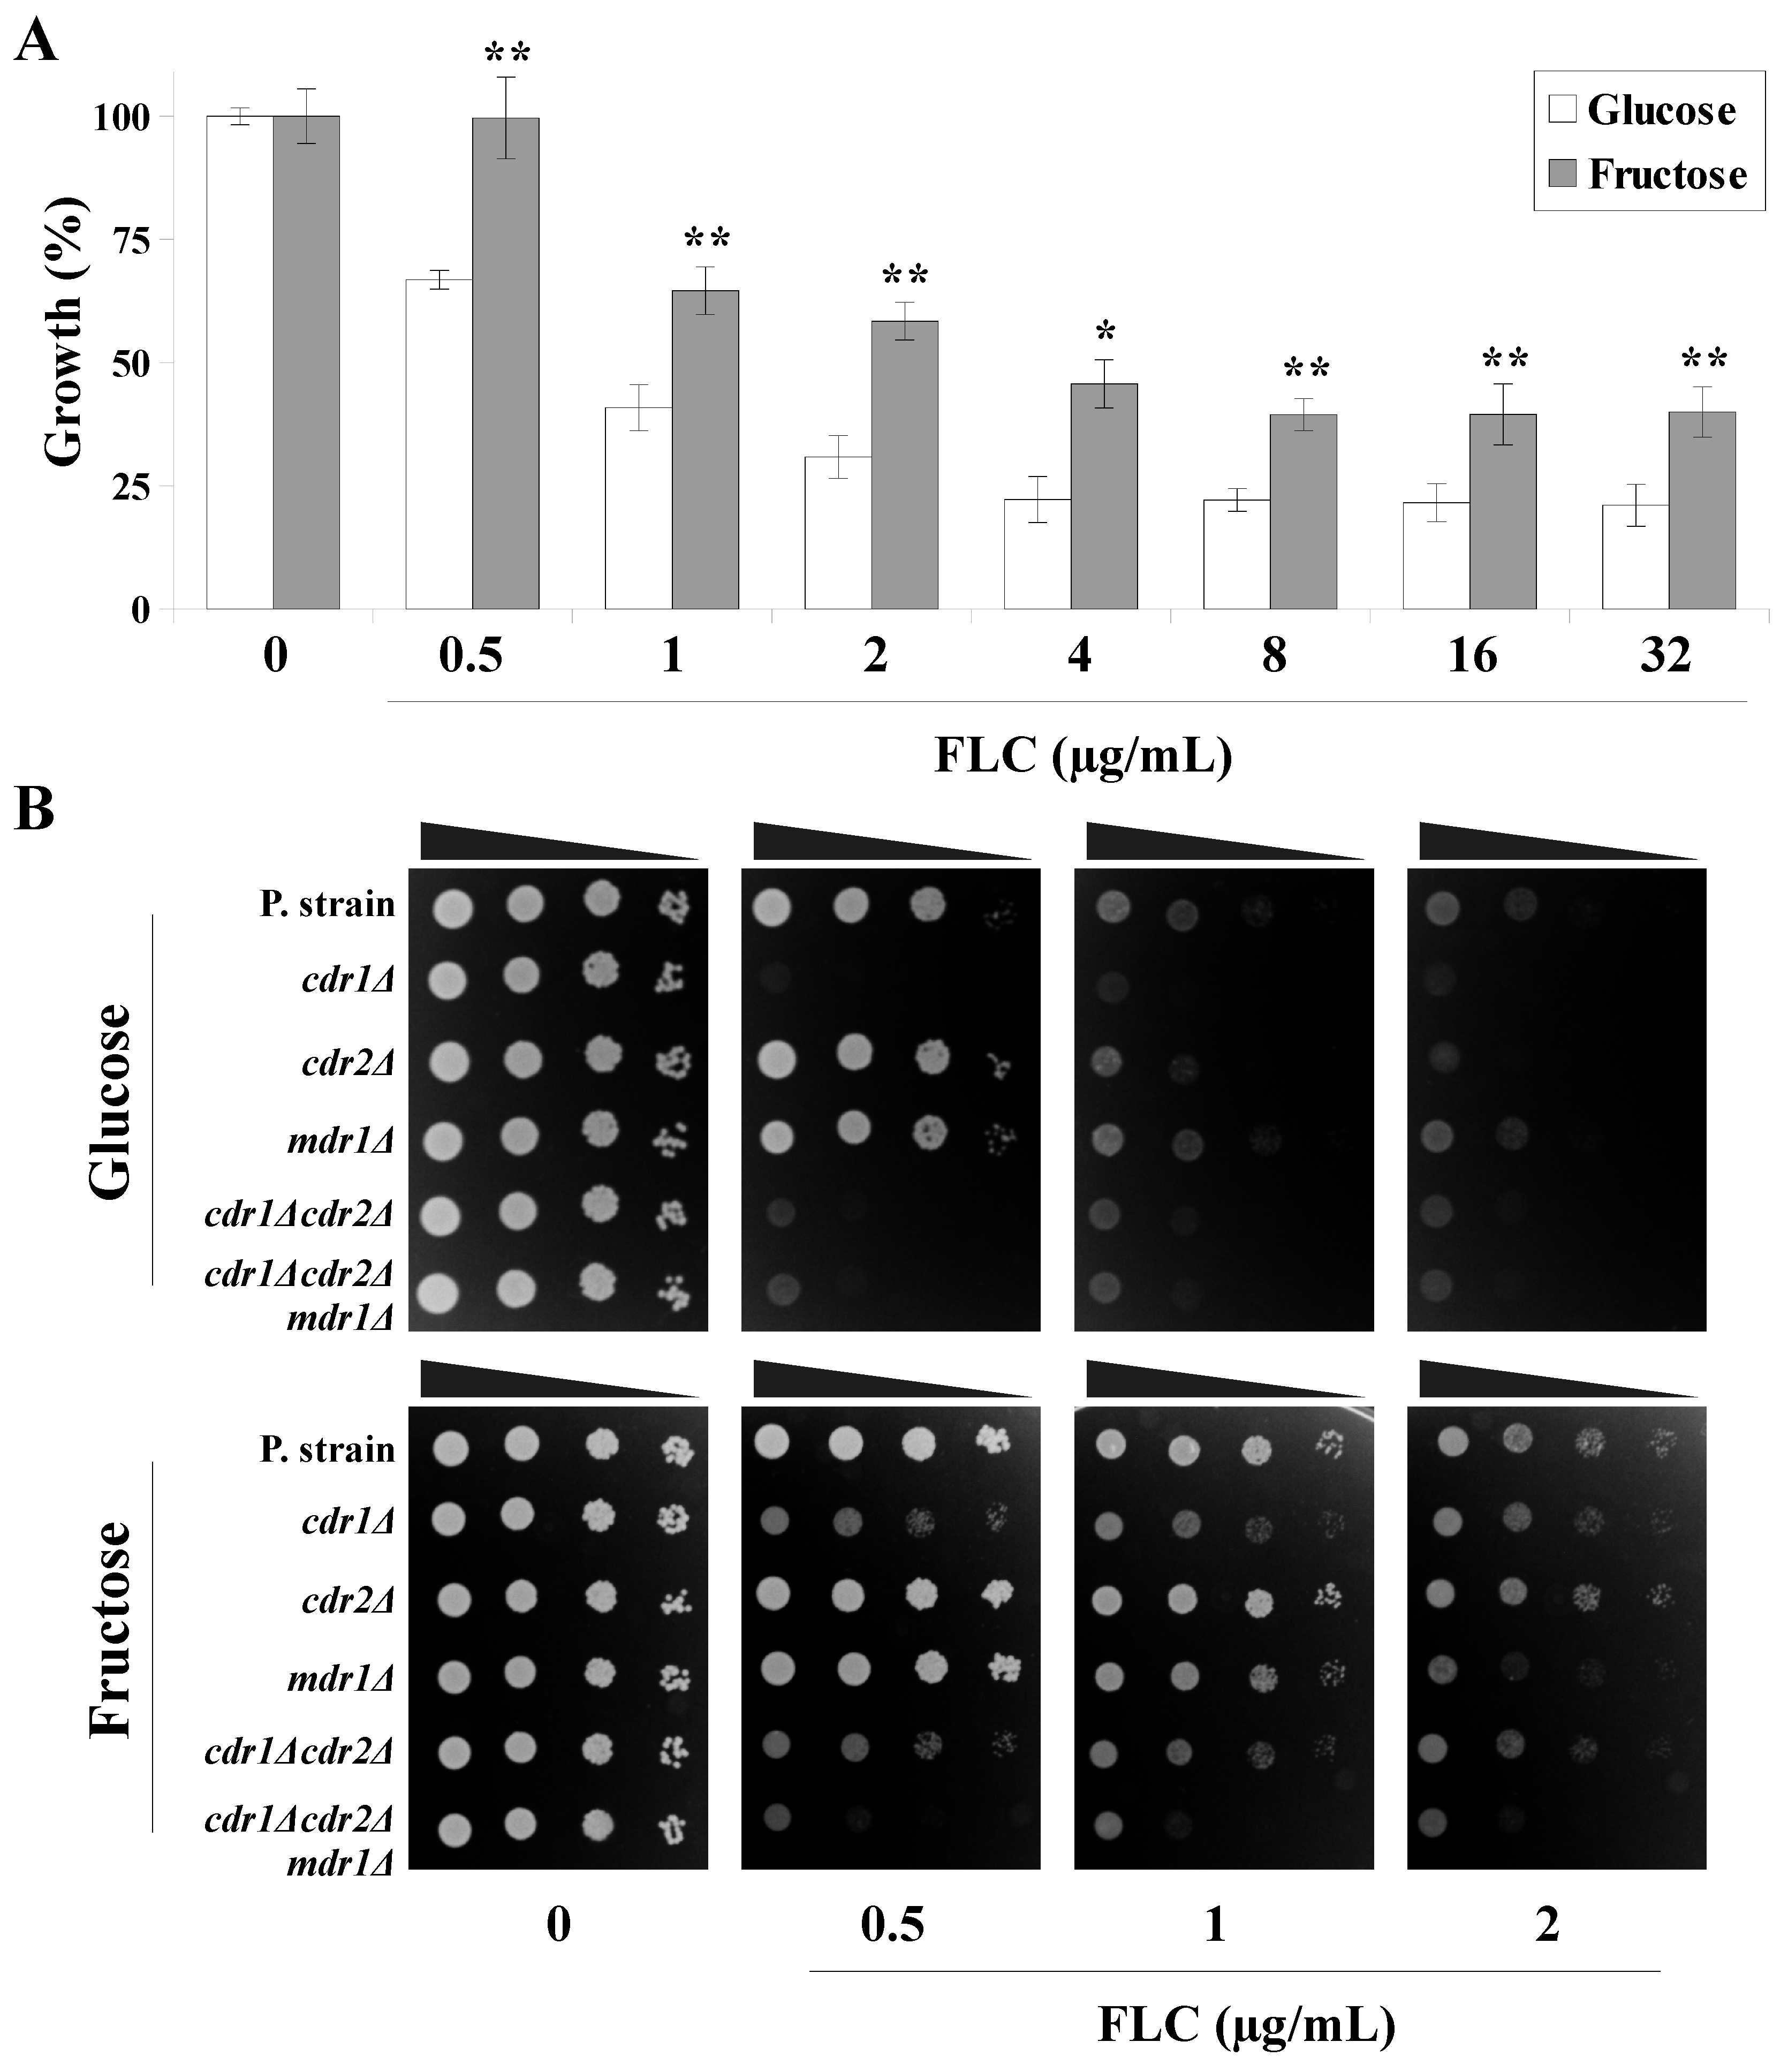
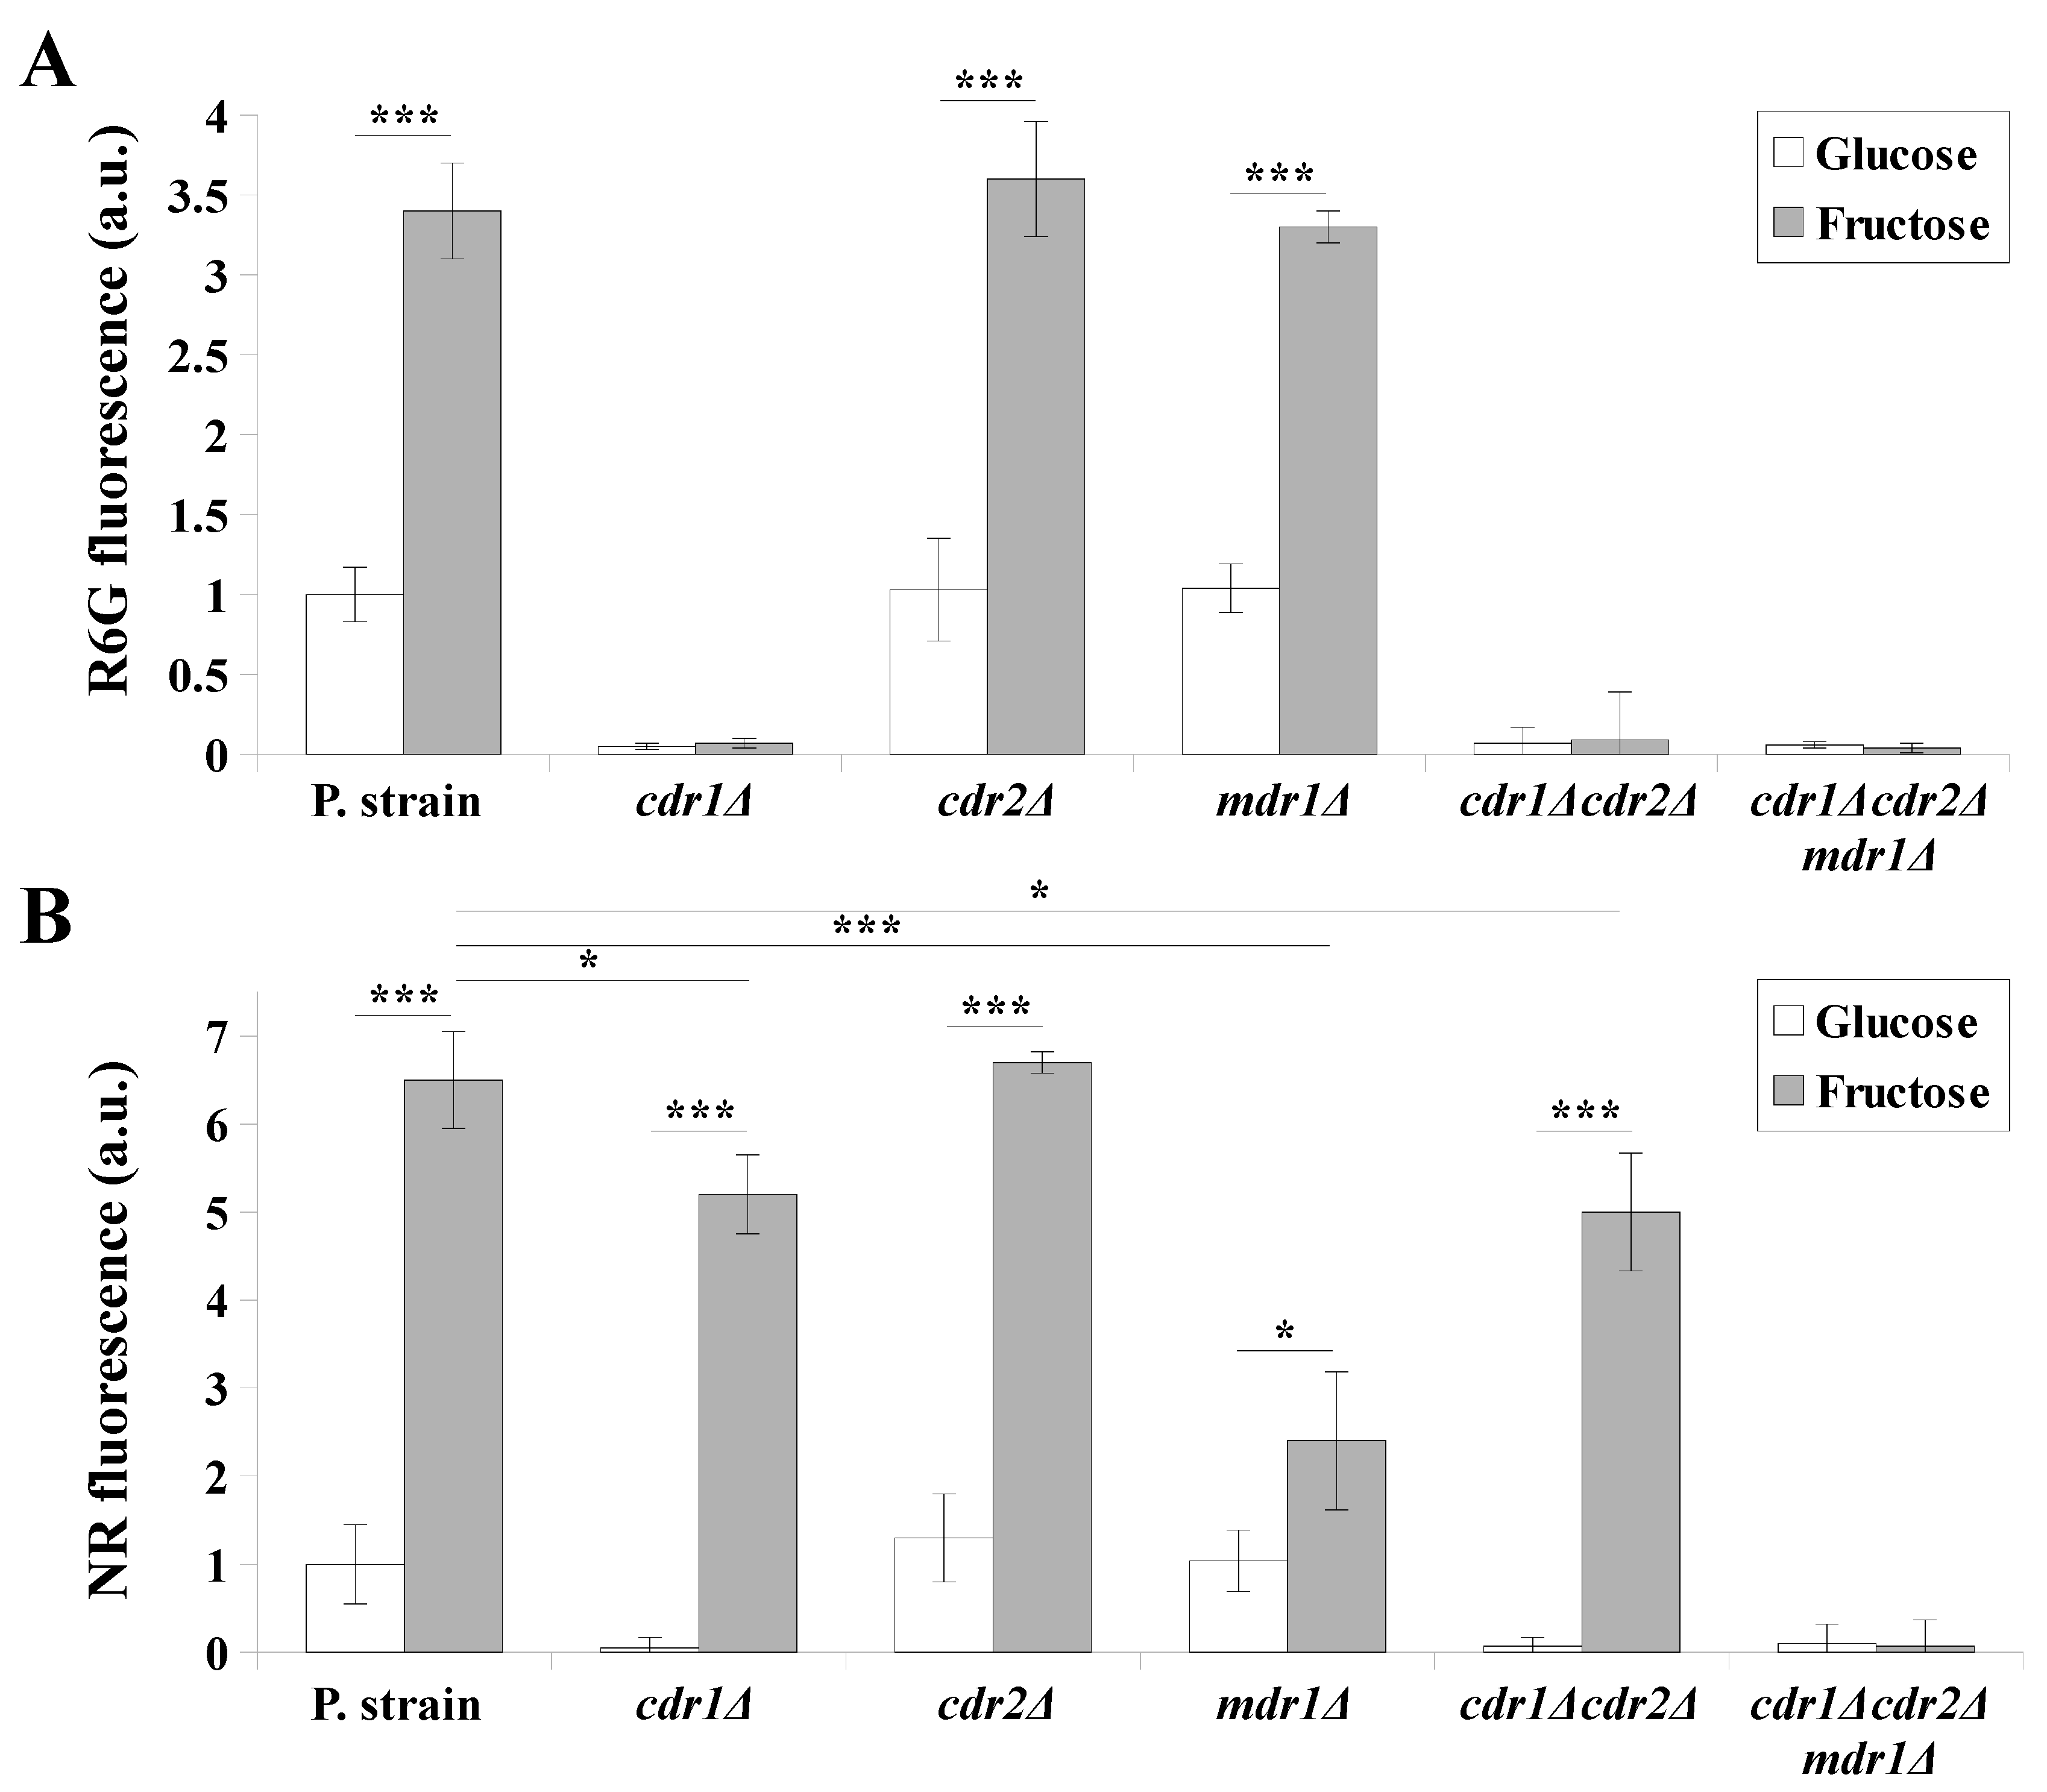
2.1. Fructose as a Carbon Source Promotes FLC Resistance and Increased Efflux Activities of Cdr1p and Mdr1p

As a Crabtree microorganism, C. albicans assimilates different carbon sources at the same time, which is an adaptation to host niches where the nutrient availability may vary [19,20,21]. Fluctuations in the availability of various carbon sources have a profound effect on the physiology of C. albicans, including changes in the gene expression, which may result in drug resistance [22]. Here, we aimed to evaluate the effect of fructose, a carbon source naturally occurring in the human oral cavity, intestines, and blood plasma [15,16,17,19], on the sensitivity of C. albicans to FLC.
Firstly, the growth of the C. albicans CAF2-1 strain in the presence of different concentrations of FLC in the YNB-based media containing glucose or fructose as a sole carbon source (Figure 1A). The growth of glucose-grown cells was inhibited ≥50% in the presence of 1-µg/mL FLC. Fructose-grown cells exhibited higher FLC tolerance, and ≥50% growth inhibition was observed only at a 4-µg/mL FLC concentration. At 8-µg/mL FLC and above, the growth of the glucose-grown cells was inhibited 80%, whereas the growth of the fructose-grown cells was inhibited only 60% (Figure 1A).
The activity of the MDR transporters is a primary factor contributing to the increased FLC tolerance among C. albicans isolates [23]. In order to determine the role of MDR transporters in the fructose-induced FLC resistance, we analyzed the growth phenotype of a set of isogenic C. albicans strains lacking one or more of the MDR transporters (Figure 1B). Clinical C. albicans strains isolated from patients treated with FLC display a high expression of all three transporters [24]; however, using standard laboratory conditions (general media and C. albicans reference strains), no gene expression or production of Cdr2p or Mdr1p are detectable [24].
In the YNB media containing glucose, the growth of parental C. albicans CAF2-1 cells was partially inhibited at 1-µg/mL FLC. Increasing the FLC concentration to 2 µg/mL further intensified this inhibition. A similar growth phenotype to that of CAF2-1 was observed in the DSY653 (cdr2Δ) and DSY465 (mdr1Δ) strains. However, only the residual growth of DSY448 (cdr1Δ), DSY654 (cdr1Δcdr2Δ), and DSY1050 (cdr1Δcdr2Δmdr1Δ) was observed, regardless of the FLC concentration used. This suggests that, in glucose-grown C. albicans cells, Cdr1p is primarily responsible for the FLC tolerance [25,26]. This is in agreement with previously published data, where deletion of the CDR1 gene vastly sensitized C. albicans towards FLC [26,27]. Under the same conditions, the deletion of CDR2 or MDR1 did not influence the FLC tolerance in C. albicans using glucose-based media [26,27]. The reason was most likely related to the fact that the gene promoters of CDR2 and MDR1 are lacking a basal expression element (BEE), which is only present within the gene promoter of CDR1 [28,29], while the synthesis of Cdr2p and Mdr1p is only induced by external factors such as azoles, fluphenazine, and β-estradiol in the case of Cdr2p or benomyl and H2O2 in the case of Mdr1p [28,29,30]. It has been reported that MDR1 expression is not directly induced by FLC [31]; thus, Mdr1p overproduction in FLC-resistant C. albicans strains might be mediated by as-yet-unknown factors.
We observed that FLC at 0.5 or 1 µg/mL did not influence the growth of the parental CAF2-1, DSY653 (cdr2Δ), and DSY465 (mdr1Δ) strains grown in the medium containing fructose (Figure 1B). The DSY448 (cdr1Δ) and DSY654 (cdr1Δcdr2Δ) strains were partially inhibited; however, only the DSY1050 (cdr1Δcdr2Δmdr1Δ) strain exhibited an almost complete growth inhibition at all FLC concentrations used. Increasing the FLC concentration to 2 µg/mL resulted in a growth inhibition in the DSY465 (mdr1Δ) strain but not in the parental CAF2-1, DSY448 (cdr1Δ), DSY653 (cdr2Δ), and DSY654 (cdr1Δcdr2Δ) strains. We therefore concluded that fructose-grown C. albicans cells are tolerant towards higher FLC concentrations, most likely due to the activation of Mdr1p, whereas, at lower FLC concentrations, an additional role of either Cdr1p or Cdr2p may be responsible.
To confirm these conclusions, we evaluated the efflux activities of MDR pumps using the same set of C. albicans strains grown in either glucose- or fructose-containing media (Figure 2). For this purpose, we used two fluorescent dyes: rhodamine 6G (R6G), which is a substrate of Cdr1p and Cdr2p but not Mdr1p, and Nile red (NR), which is a substrate of Cdr1p and Mdr1p but not Cdr2p [32]. Both the fluorescent substrates accumulate within the yeast cells and are actively removed by the transporters, which is measured as an extracellular fluorescence, and reflects the efflux activity of the transporters [32].
The efflux of R6G was observed only in the case of C. albicans strains that contain Cdr1p (CAF2-1, DSY653, and DSY465), regardless of the carbon source used (Figure 2A). However, in these strains, the R6G efflux was ~3.5-fold higher in the media containing fructose (Figure 2A). Based on these observations, we concluded that Cdr2p is probably not activated on either glucose- or fructose-containing media, and Cdr1p activity is higher in the case of fructose-grown cells.
The efflux of NR in glucose-grown cells was observed in strains expressing Cdr1p (CAF2-1, DSY653, and DSY465) a comparable level (Figure 2B) to the efflux of R6G at the same carbon source (Figure 2A). The NR efflux in fructose-grown cells was observed in all C. albicans strains except for DSY1050, which is deficient in all MDR transporters. The C. albicans strains that contain both Cdr1p and Mdr1p (CAF2-1 and DSY653) were characterized by a ~6-fold higher NR efflux when grown on the fructose-containing medium. The strains that contain Mdr1p but not Cdr1p (DSY448 and DSY654) displayed a ~5-fold higher NR efflux when grown in the fructose-containing medium. The strain lacking Mdr1p but expressing Cdr1p (DSY465) was characterized by a ~2.5-fold higher NR efflux when grown on fructose. This suggested that fructose-grown cells, despite a higher Cdr1p-dependent efflux activity, additionally feature an active Mdr1 transporter.

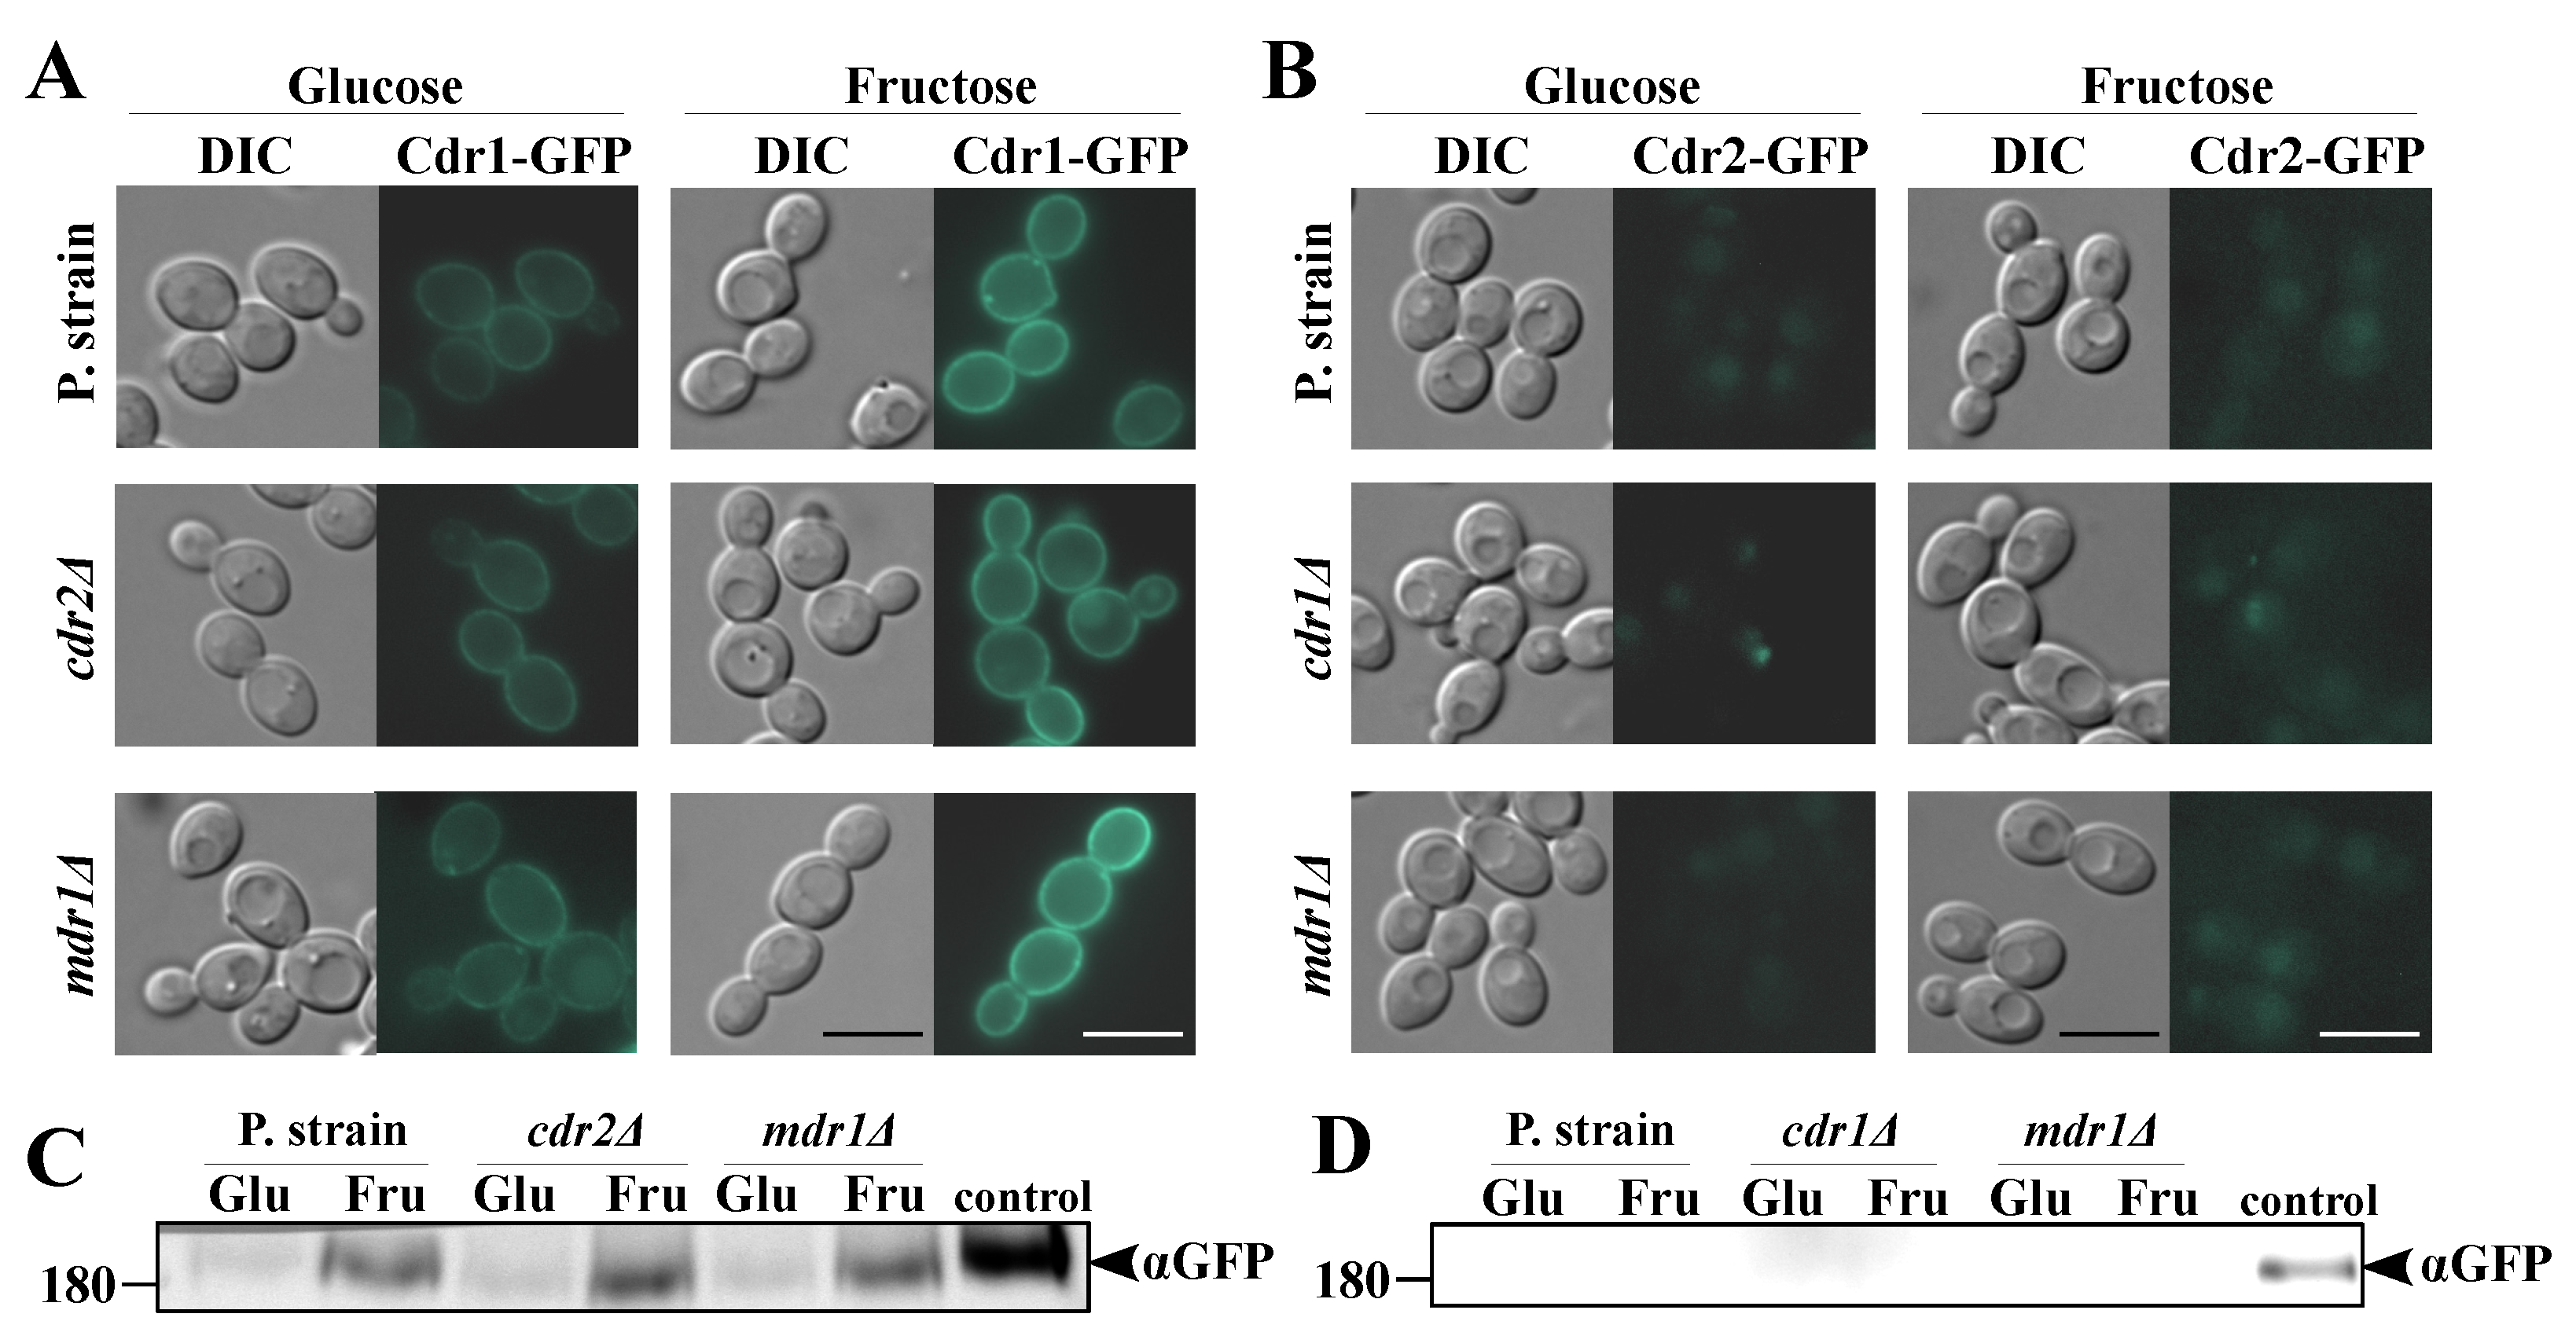
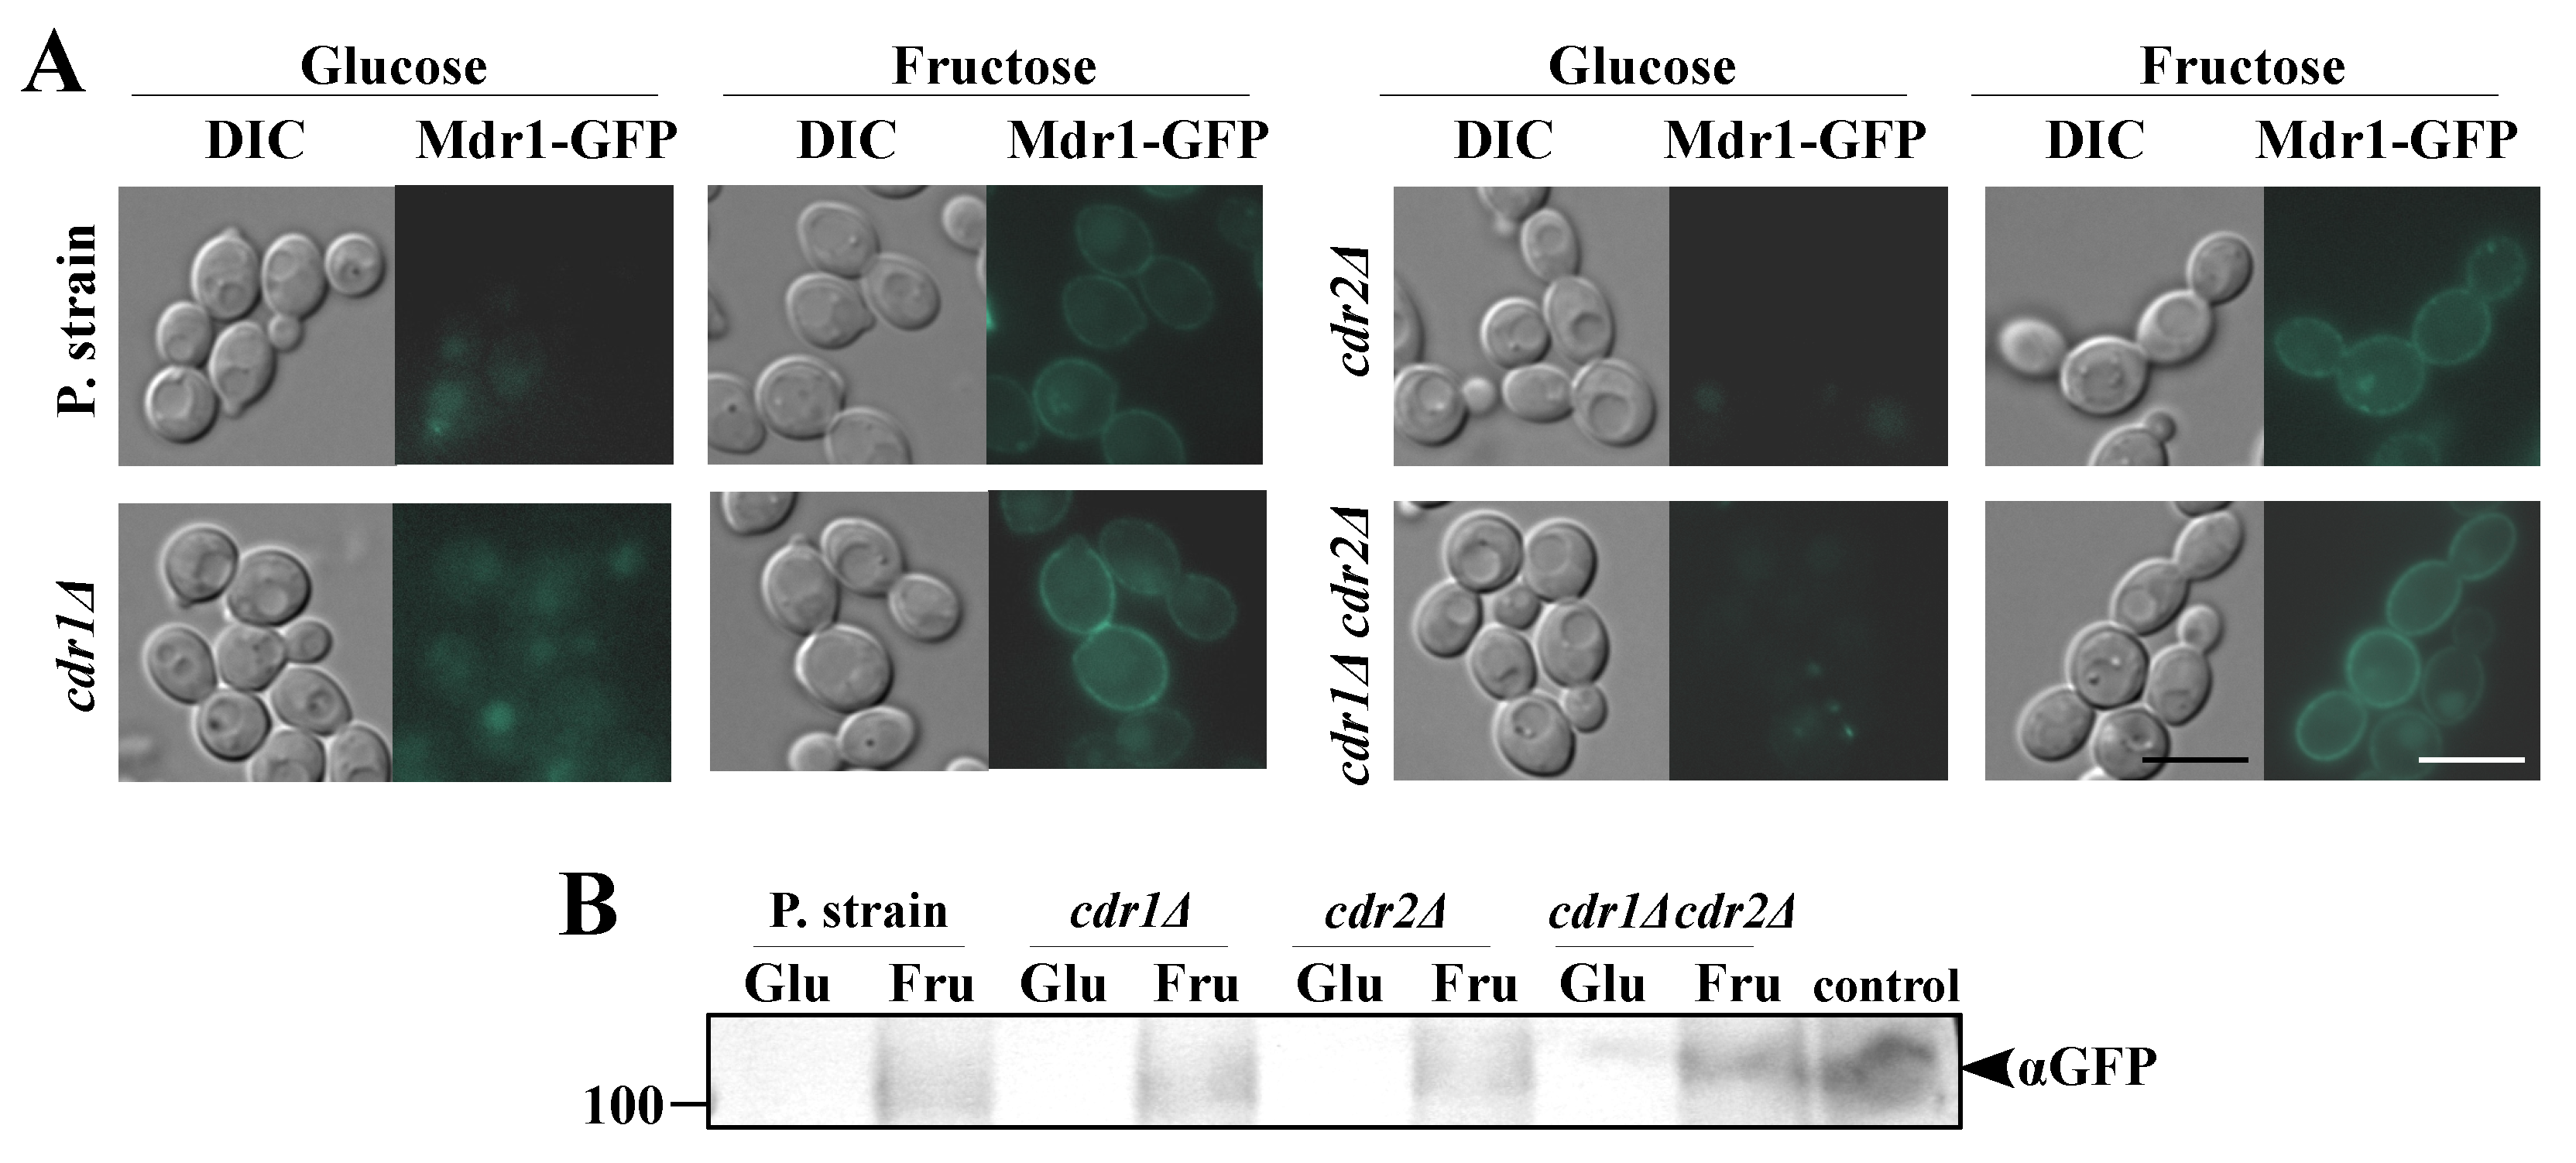
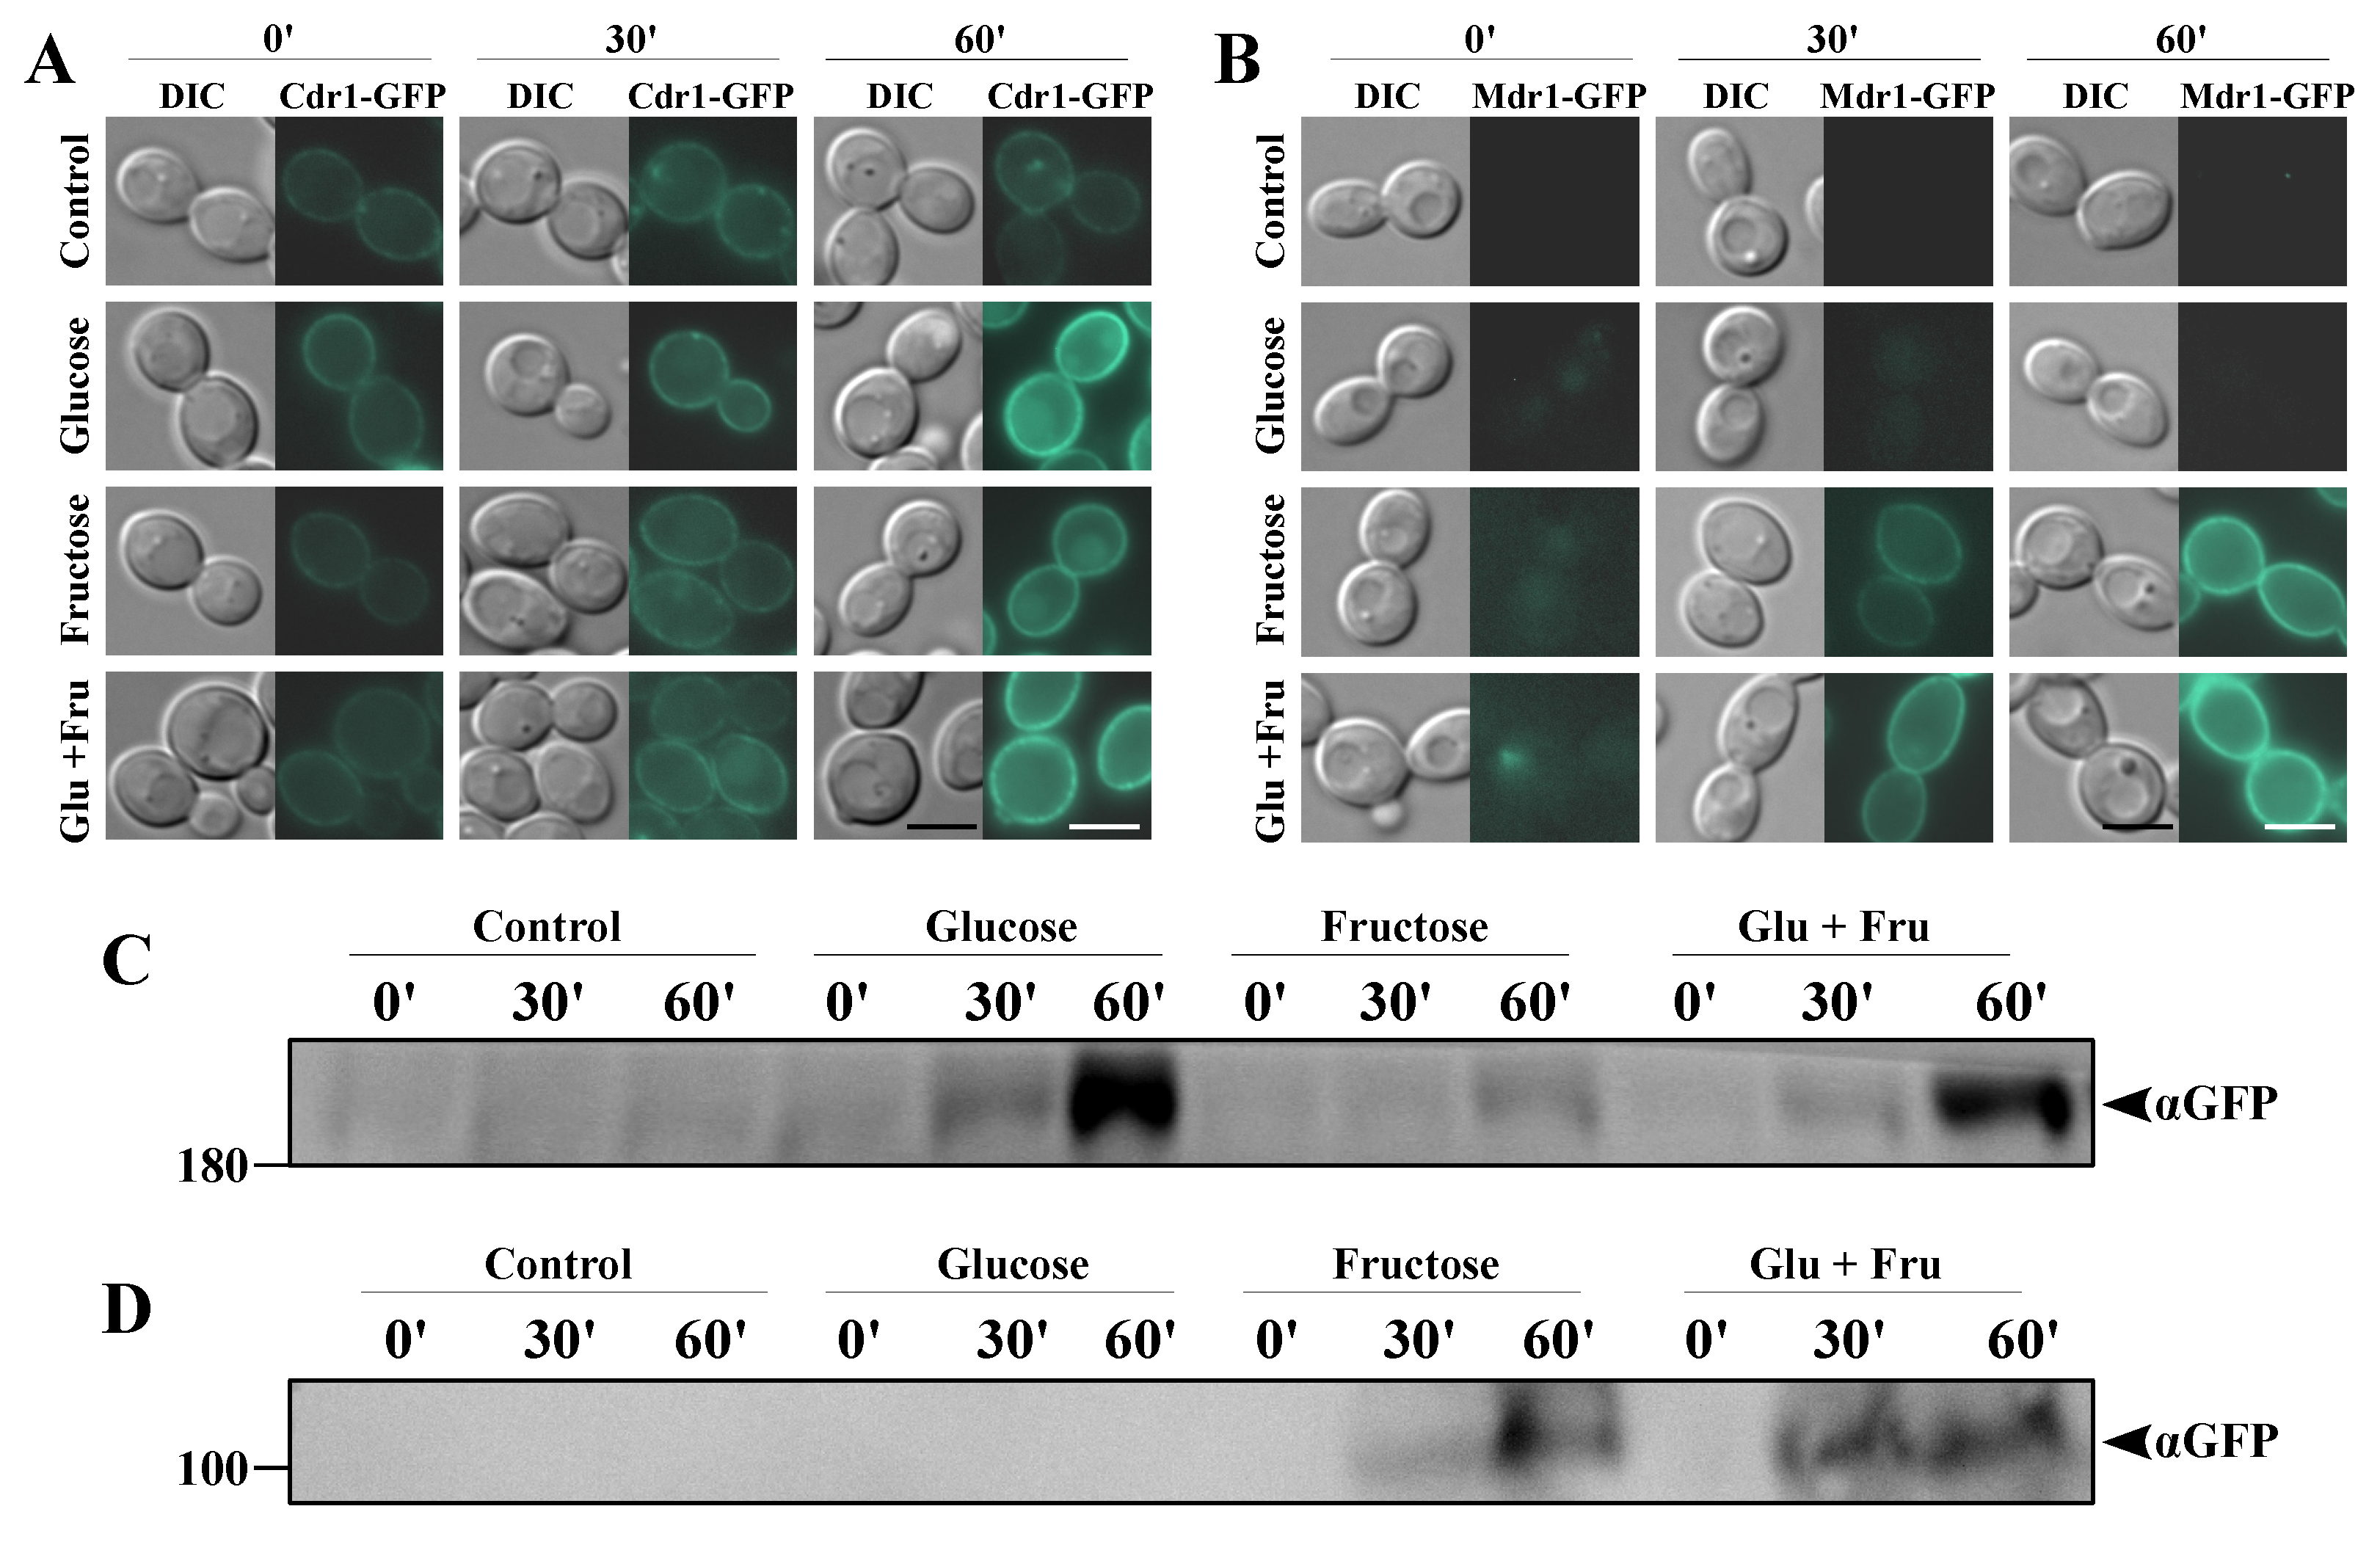
2.2. Fructose-Grown Cells Are Characterized by High Levels of Cdr1p and Mdr1p

The results described in Section 2.1, together with previous reports, suggest that, in the case of glucose-grown C. albicans cells, Cdr1p is primarily responsible for the FLC tolerance, with negligible roles played by Cdr2p or Mdr1p [26,27]. However, in C. albicans cells grown on fructose, particularly in the case of strains positive for the MDR1 gene but negative for the CDR1 gene, we observed a high FLC tolerance (Figure 1B) and high NR efflux (Figure 2B). We concluded that these observations may result from the synthesis of Mdr1p in C. albicans cells as a result of the growth in the presence of fructose. In order to confirm those conclusions, we constructed a series of GFP-tagged C. albicans strains. We labeled Cdr1p-GFP in the cdr2Δ or mdr1Δ backgrounds; Cdr2p-GFP in the cdr1Δ or mdr1Δ backgrounds; and Mdr1p-GFP in the cdr1Δ, cdr2Δ, or cdr1Δcdr2Δ backgrounds (Table 1). We performed microscopic observations of the fluorescent signal in the constructed C. albicans strains grown in either glucose or fructose media, which were further validated by Western blotting (Figure 3 and Figure 4).
The Cdr1p-GFP signal was observed in the plasma membranes of C. albicans in all the aforementioned conditions (Figure 3A). However, the Cdr1p-GFP signal was visibly stronger in fructose-grown cells than in glucose-grown cells. A Western blotting protein analysis (Figure 3C) confirmed those observations (Figure 3C). Additionally, it was concluded that the absence of detectable Cdr2p or Mdr1p does not influence the level of Cdr1p (Figure 3A). In contrast, we previously observed that the presence of glucose increased the Cdr1p levels in the C. albicans cdr2Δ strain to a greater extent than in the parental strain [13]. It must be noted that, previously, we performed only short-term glucose induction (12 or 36 min). It may therefore be concluded that short-time exposure of the C. albicans cdr2Δ strain to glucose results an increased production of Cdr1p, while, after long-term incubation with glucose, the Cdr1p protein level eventually stabilizes.
The Cdr2p-GFP signal was not detected under either of the experimental conditions (Figure 3B,D). This shows that, regardless of the carbon source (glucose or fructose), Cdr2p was not involved in either the FLC resistance (Figure 1) or R6G efflux (Figure 2A). Additionally, this explains the lack of differences in R6G efflux between the parental CAF2-1 and DSY653 (cdr2Δ) strains (Figure 2A). Additionally, we observed that the absence of Cdr1p or Mdr1p does not induce the production of Cdr2p. Kolaczkowska et al. [33] previously reported that, upon disruption of the PDR5 gene, which encodes an ABC transporter homologous of Cdr1p in Saccharomyces cerevisiae, a compensatory activation of other ABC transporters (Snq2 and Yor1) occurs. Similar observations were reported for ABC transporters of pathogenic fungus Trichophyton spp. [34]. In C. albicans, the transcriptional regulation of the CDR1 and CDR2 genes overlaps: Mrr2, Upc2, Ndt80, and Znc1 act as positive regulators [35,36], and Flo8 as a negative regulator [36] of both genes. However, our results suggest that the disruption of either C. albicans ABC transporters does not induce the production of the remaining protein (Figure 3).
Cells cultured in a medium with glucose, in contrast to those cultured with fructose, did not synthesize Mdr1p, which was the reason for the absence of the Mdr1p-GFP signal during the microscopic observations and the lack of Mdr1p detected by Western blot (Figure 4). Moreover, in the C. albicans KS073 strain, which lacks both the Cdr1 and Cdr2 proteins, we observed a more pronounced Mdr1p-GFP signal. Based on these observations, we concluded that C. albicans cells synthesize Mdr1p in the presence of fructose without any other stimulating factor (Figure 4B).
The promoter of the MDR1 gene includes a H2O2 responsive element (HRE), which induces the production of Mdr1p upon oxidative stress [37], which led us to hypothesize that the fructose metabolism might induce oxidative stress. Conversely, however, fructose has been described to exhibit a general protective effect against oxidative stress in S. cerevisiae cells [38], including a specific protection against H2O2 and reactive oxygen species (ROS) [39]. This led us to a different hypothesis. In eukaryotic cells, fructose, like glucose, is metabolized to pyruvate, which supplies energy to cells through the Krebs cycle [40]. However, fructose has been described to also be metabolized to a toxic glycolytic byproduct called methylglyoxal (MG), the elevated levels of which are responsible for hepatotoxicity in diabetic patients [40]. In Candida lusitaniae, the MG metabolism is believed to be mediated by Mgd1 and Mgd2 reductases, the expression of which is controlled by Mrr1p, which, in turn, is inducible by MG [41]. The homologous protein in C. albicans (CaMrr1p) is a major transcriptional inductor of MDR1 [42]. Thus, we hypothesize that the fructose metabolism, leading to the production of MG, might directly induce expression of the MDR1 gene and production of Mdr1p through the activation of Mrr1p.

2.3. Serum Levels of Fructose Induces de Novo Synthesis of Mdr1p and Enhanced Synthesis of Cdr1p

The concentrations of glucose and fructose in different niches of the human body—specifically, the digestive tract and bloodstream—depend mostly on dietary factors. The ingestion of sugar-rich products may lead to an increase in fructose concentration in the peripheral venous blood of up to ~0.006%, and the glucose concentration of up to ~0.2% [19,43]. Rodaki et al. [10] reported that a short-term exposure of C. albicans to 0.1% glucose induces a stress response, which includes the transcriptional activation of CDR1.
We report that C. albicans cells, grown up until the early logarithmic phase with fructose as the sole carbon source, are characterized by the presence of Mdr1p (Figure 4) and increased levels of Cdr1p (Figure 3). We aimed to investigate whether this effect occurs upon the short-term exposure of C. albicans to glucose, fructose, or both sugars in the bloodstream. To this end, we cultured the C. albicans KS052 (Cdr1p-GFP) and KS070 (Mdr1p-GFP) strains in YNBG medium until the early logarithmic phase; at which point, we induced cell starvation by incubating cells for one hour in a HEPES-NaOH buffer. The starved cells were supplemented with either glucose (0.2%), fructose (0.006%), or both sugars and analyzed for the expression of the Cdr1 and Mdr1 proteins (Figure 5).
We observed that C. albicans KS052 cells exposed to glucose or a glucose–fructose mixture are characterized by pronounced Cdr1p-GFP fluorescence in the plasma membrane (Figure 5A). Western blotting revealed an increasing Cdr1p-GFP signal proportionate to the increase in incubation time with glucose or a glucose–fructose mixture (Figure 5C). This suggests an increase in Cdr1p synthesis induced by glucose, which is in agreement with the data reported by Rodaki et al. [10] and Szczepaniak et al. [13]. However, we observed a slightly more pronounced fluorescence of Cdr1p-GFP in cells exposed to fructose, as well as a slightly increased signal seen with Western blotting (Figure 5).
We observed no Mdr1p-GFP signal at the beginning of the induction (time = 0 min), which is in agreement with the data presented in Figure 4. The exposure of the C. albicans KS070 strain to glucose did not lead to the synthesis of Mdr1p-GFP. Only exposure to fructose induced a detectable Mdr1p-GFP signal (Figure 5). Thus, it may be concluded that the exposure of C. albicans to low concentrations of fructose induces a de novo synthesis of Mdr1p after only 30 min of exposure.
We conclude that fructose as a carbon source induces FLC resistance in C. albicans in laboratory conditions in a general culture media. However, our observations may be of particular importance, as enhanced concentrations of fructose in the bloodstream persist for a much longer time than glucose (~three hours after fructose ingestion) before returning to the baseline levels [43].

3. Conclusions

These findings demonstrate that fructose as a carbon source enhances the FLC resistance in Candida albicans by two modes: the activation of Mdr1p and by inducing elevated levels of Cdr1p. We observed that fructose-grown C. albicans cells have a higher efflux activity of both transporters as opposed to glucose-grown cells, which constitutively synthesize only Cdr1p. Additionally, we concluded that the fructose serum level of 0.006% induces the de novo production of Mdr1p.

4. Materials and Methods

4.1. Chemicals

Chemicals and reagents used in this study were purchased from the following sources: sodium dodecyl sulfate (SDS), 2-deoxy-d-glucose, fluconazole (FLC), rhodamine 6G (R6G), Nile red (NR), and lithium acetate (LiAc) (Sigma-Aldrich, Poznań, Poland); commercial antibodies: mouse monoclonal anti-green fluorescent protein (αGFP) (manufacturer: Roche and distributor: Sigma-Aldrich, Poznań, Poland) and horseradish peroxidase (HRP) conjugated rabbit anti-mouse (manufacturer: GE Healthcare and distributor: Sigma-Aldrich, Poznań, Poland); d-glucose, d-fructose, bacteriological agar, HEPES, Tris, and EDTA (manufacturer: Bioshop and distributor: Lab Empire, Rzeszów, Poland); yeast nitrogen base (YNB), yeast extract (YE), peptone, and sorbitol (manufacturer: BD and distributor: Diag-med, Warszawa, Poland); nourseothricin (NAT) (Jena Bioscience, Jena, Germany); and dithiothreitol (DTT) (A&A Biotechnology, Gdynia, Poland). All chemicals were high-purity grade.

4.2. Strains and Growth Conditions

The C. albicans strains used in this study are listed in Table 1. CAF2-1, DSY448, DSY653, DSY465, DSY654, and DSY1050 were kind gifts from Professor D. Sanglard (Lausanne, Switzerland). KS052 and KS068 were previously constructed by our group, while KS053, KS054, KS064, KS065, KS070, KS073, KS074, and KS075 were constructed for the purposes of this study. Strains were pregrown at 28 °C on yeast nitrogen base glucose (YNBG) or yeast nitrogen base fructose (YNBF) media (0.67% YNB containing 2% glucose or 2% fructose, respectively) in an incubator while shaking at 120 rpm. Agar was added at a final concentration of 2% for medium solidification.
For most of the experiments, cells were grown until they reached the early logarithmic phase (8 h). Growth phases were determined as previously described [44]. Cells were centrifuged at 4500 rcf (relative centrifugal force) for 5 min; washed twice (4500 rcf, 5 min) with either phosphate-buffered saline (PBS), H2Odd, or 50-mM HEPES–NaOH buffer (pH 7.0); and resuspended in either PBS, H2Odd, or HEPES-NaOH to the indicated A600.
For the induction experiments, C. albicans suspensions in HEPES-NaOH (A600 = 1.0 in 25 mL) were incubated for 60 min at 28 °C. Subsequently, the cells were centrifuged at 4500 rcf for 5 min, washed twice (4500 rcf, 5 min) with HEPES-NaOH, and resuspended in HEPES-NaOH. Lastly, the cells were treated with glucose (0.2%), fructose (0.006%), or both sugars for either 30 or 60 min.

4.3. Plasmids and Strains Construction

Plasmid pGFP-NAT1 [47] was a generous gift from Professor S. Bates (Exeter, United Kingdom). The CDR1-GFP-NAT1 and CDR2-GFP-NAT1 cassettes were prepared as described previously [46]. Briefly, both cassettes were amplified from pGFP-NAT1 using the primer pairs C1_GFPNAT_F and C1_GFPNAT_R or C2_GFPNAT_F and C2_GFPNAT_R. The MDR1-GFP-NAT1 cassette was amplified from pGFP-NAT1 using the primer pair M1_GFPNAT_F and M1_GFPNAT_R.
C. albicans strains were transformed by electroporation with the linear gel-purified CDR1-GFP-NAT1, CDR2-GFP-NAT1, or MDR1-GFP-NAT1 cassettes according to the protocols described by Sasse et al. [48] with modifications. Briefly, C. albicans cells were cultured in YPD medium (1% YE, 1% peptone, and 2% glucose) until they reached the early stationary growth phase (16 h). Cells were then centrifuged at 4500 rcf for 5 min; washed (4500 rcf, 5 min) with H2Odd; resuspended in TE-LiAc buffer (10-mM Tris-HCl, 1-mM EDTA, and 0.1-M LiAc, pH 8); and incubated at 28 °C for 60 min with shaking at 120 rpm. Subsequently, 0.025-M DTT was added for further incubation (28 °C, 30 min, and shaking at 120 rpm). The cells were again centrifuged at 4500 rcf for 5 min; washed twice (4500 rcf, 5 min, and 4 °C) with ice-cold H2Odd; washed (4500 rcf, 5 min, and 4 °C) with ice-cold 1-M sorbitol; and concentrated in ice-cold 1-M sorbitol. Electrocompetent cells were transformed (1.8 kV, 200 Ω, and 25 uF) using a Gene Pulser II electroporator (Bio-Rad, Warsaw, Poland), washed (2500 rcf, 5 min) with 1=M sorbitol, resuspended in YPD, and incubated at 28 °C for 4 h with shaking at 120 rpm. Finally, transformed cells were selected on YPD using 200-µg/mL NAT.
The presence of the NAT1 marker was verified using the primer pair NAT1_F and NAT1_R. The correct integration of the cassette into the genomic locus was verified using the primer pairs C1NAT1_SF and GFP_N1_SR2 (for the CDR1/CDR1-GFP-NAT1 strains), C2NAT1_SF and GFP_N1_SR2 (for the CDR1/CDR1-GFP-NAT1 strains), or M1NAT1_SF and GFP-N1-SR2 (for the MDR1/MDR1-GFP-NAT1 strains). All the primers sequences are detailed in Table 2.

4.4. Percentage of Growth

To assess the effects of FLC on C. albicans growth in the presence of different carbon sources, we followed the protocol described by the Clinical and Laboratory Standards Institute (2008), 3rd ed. M27-A3 [49] with modifications. Briefly, 10-mg/mL stock solution of FLC was serially diluted in YNBG or YNBF media using 96-well sterile plates (Sarstedt, Nümbrecht, Germany). The various media compositions were then inoculated with C. albicans suspensions (final A600 = 0.01 per well) and prepared in fresh YNBG or YNBF media from 24-h YNBG cultures. After 24 h of incubation at 28 °C, A600 was measured using a ASYS UVM 340 microplate reader (Biogenet, Józefów, Poland). The percentage of growth of the C. albicans CAF2-1, DSY448, DSY653, DSY465, DSY654, and DSY1050 strains was determined by normalizing A600 to that observed under conditions without FLC.

4.5. Phenotypic Tests

PBS suspensions of C. albicans CAF2-1, DSY448, DSY653, DSY465, DSY654, and DSY1050 (A600 = 0.7), prepared from overnight YNBG cultures, were serially diluted with PBS in a range of 100 to 10−3. Next, 3 µL of each dilution were spotted onto either YNBG- or YNBF-based agar containing FLC (0.5–2 µg/mL). After cultivation for 48 h at 28 °C, the plates were photographed using a FastGene® B/G GelPic imaging box (Nippon Genetics, purchased from Abo, Gdańsk, Poland).

4.6. Efflux Activity of MDR Transporters

The efflux assay was performed according to the protocol of Szczepaniak et al. [50] with modifications. Briefly, 25-mL C. albicans suspensions (A600 = 1.0 in 25-mL HEPES-NaOH) were treated with 5-mM 2-deoxy-D-glucose and incubated at 28 °C for 60 min with shaking at 200 rpm. Subsequently, 10-μM R6G or 7-μM NR were added before further incubation at 28 °C for 90 min with shaking at 200 rpm. Following this, the cells were centrifuged at 4500 rcf for 5 min, washed twice (4500 rcf, 5 min) with HEPES-NaOH, concentrated to 2 mL in HEPES-NaOH (A600 = 10), and incubated at 28 °C for 5 min with shaking at 200 rpm. For each condition, the dye uptake was always ≥95%. Intensities of fluorescence (FIs) were measured 30 min after efflux. The assay was performed using a Cary Eclipse spectrofluorometer (Agilent Technologies, Santa Clara, CA, USA). The probes were excited at 529 nm (Ex slit = 5 nm), and emission was recorded at 553 nm (Em slit = 10 nm). IFs were normalized to 1 for the efflux activity of the control conditions (parental strain grown in YNBG).

4.7. Microscopic Studies

The CDR1-GFP, CDR2-GFP, or MDR1-GFP strains were suspended in PBS, concentrated, and observed under a Zeiss Axio Imager A2 microscope equipped with a Zeiss Axiocam 503 mono microscope camera and a Zeiss HBO100 mercury lamp (Zeiss, Poznań, Poland).

4.8. Western Blotting

Crude protein extracts from CDR1-GFP, CDR2-GFP, or MDR1-GFP strains were isolated as previously described [44,50]. Electrophoretic separation and transfer of Cdr1p-GFP was performed as previously described [50]. For Mdr1p-GFP separation, the following modification was applied: crude proteins from MDR1-GFP strains were separated on 8% SDS-polyacrylamide gels. For detection, mouse αGFP primary antibodies were used, followed by HRP-conjugated rabbit anti-mouse secondary antibodies. The remaining steps were performed as described in Reference [50].

4.9. Statistical Analysis

Unless stated otherwise, data represent the means ± standard errors from at least 3 biological replicates. Microscopic observations and Western blot analyses were performed at least in 2 independent replicates, of which the representatives were included in the figures. Statistical significance was determined using a Student’s t-test (binomial, unpaired).

Author Contributions

Conceptualization, J.S. and A.K.; methodology, investigation, funding, and writing—original draft preparation, J.S.; and writing—review and editing and supervision, A.K. All authors have read and agreed to the published version of the manuscript.

Funding

This work was supported by the National Science Centre, Poland. NCN Grants: 2017/25/N/NZ1/00050 (J.S.) and 2016/23/B/NZ1/01928 (A.K.).

Institutional Review Board Statement

Not applicable.

Informed Consent Statement

Not applicable.

Data Availability Statement

The data presented in this study are available on request from the corresponding author (J.S.).

Conflicts of Interest

The authors declare no conflict of interest.

References

  1. Dadar, M.; Tiwari, R.; Karthik, K.; Chakraborty, S.; Shahali, Y.; Dhama, K. Candida albicans - biology, molecular characterization, pathogenicity, and advances in diagnosis and control – An Update. Microb. Pathog. 2018, 117, 128–138. [Google Scholar] [CrossRef]
  2. Sanglard, D.; Francoise, I.; Parkinson, T.; Falconer, D.; Jacques, B. Candida albicans Mutations in the Ergosterol Biosynthetic Pathway and Resistance to Several Antifungal Agents. Antimicrob. Agents Chemother. 2003, 47, 2404–2412. [Google Scholar] [CrossRef] [Green Version]
  3. Beardsley, J.; Halliday, C.L.; Chen, S.C.A.; Sorrell, T.C. Responding to the emergence of antifungal drug resistance: Perspectives from the bench and the bedside. Future Microbiol. 2018, 13, 1175–1191. [Google Scholar] [CrossRef] [PubMed] [Green Version]
  4. Cortegiani, A.; Misseri, G.; Chowdhary, A. What’s new on emerging resistant Candida species. Intensive Care Med. 2019, 45, 512–515. [Google Scholar] [CrossRef] [PubMed]
  5. Cannon, R.D.; Lamping, E.; Holmes, A.R.; Niimi, K.; Baret, P.V.; Keniya, M.V.; Tanabe, K.; Niimi, M.; Goffeau, A.; Monk, B.C. Efflux-mediated antifungal drug resistance. Clin. Microbiol. Rev. 2009, 22, 291–321. [Google Scholar] [CrossRef] [PubMed] [Green Version]
  6. de Leon, E.M.; Jacober, S.J.; Sobel, J.D.; Foxman, B. Prevalence and risk factors for vaginal Candida colonization in women with type 1 and type 2 diabetes. BMC Infect. Dis. 2002, 2, 1. [Google Scholar] [CrossRef] [PubMed] [Green Version]
  7. Javed, F.; Ahmed, H.B.; Mehmood, A.; Saeed, A.; Al-Hezaimi, K.; Samaranayake, L.P. Association between glycemic status and oral Candida carriage in patients with prediabetes. Oral Surg. Oral Med. Oral Pathol. Oral Radiol. 2014, 117, 53–58. [Google Scholar] [CrossRef]
  8. Martinez, R.F.F.; Hernández-Pérez, F.; Miguel, G.F.S.; Jaimes-Aveldañez, A.; Arenas, R. Oral Candida spp carriers: Its prevalence in patients with type 2 Diabetes Mellitus. An. Bras. Dermatol. 2013, 88, 222–225. [Google Scholar] [CrossRef]
  9. Plotkin, B.J.; Paulson, D.; Chelich, A.; Jurak, D.; Cole, J.; Kasimos, J.; Burdick, J.R.; Casteel, N. Immune responsiveness in a rat model for type II diabetes (Zucker rat, fa/fa): Susceptibility to Candida albicans infection and leucocyte function. J. Med. Microbiol. 1996, 44, 277–283. [Google Scholar] [CrossRef] [Green Version]
  10. Rodaki, A.; Bohovych, I.M.; Enjalbert, B.; Young, T.; Odds, F.C.; Gow, N.A.R.; Brown, A.J.P. Glucose Promotes Stress Resistance in the Fungal Pathogen Candida albicans. Mol. Biol. Cell 2009, 20, 4845–4855. [Google Scholar] [CrossRef] [Green Version]
  11. Mandal, S.M.; Mahata, D.; Migliolo, L.; Parekh, A.; Addy, P.S.; Mandal, M.; Basak, A. Glucose directly promotes antifungal resistance in the fungal pathogen, Candida spp. J. Biol. Chem. 2014, 289, 25468–25473. [Google Scholar] [CrossRef] [Green Version]
  12. Ene, I.V.; Adya, A.K.; Wehmeier, S.; Brand, A.C.; Maccallum, D.M.; Gow, N.A.R.; Brown, A.J.P. Host carbon sources modulate cell wall architecture, drug resistance and virulence in a fungal pathogen. Cell. Microbiol. 2012, 14, 1319–1335. [Google Scholar] [CrossRef] [Green Version]
  13. Szczepaniak, J.; Łukaszewicz, M.; Krasowska, A. Estimation of Candida albicans ABC transporter behavior in real-time via fluorescence. Front. Microbiol. 2015, 6, E1382. [Google Scholar] [CrossRef] [PubMed] [Green Version]
  14. Kawasaki, T.; Akanuma, H.; Yamanouchi, T. Increased fructose concentrations in blood and urine in patients with diabetes. Diabetes Care 2002, 25, 353–357. [Google Scholar] [CrossRef] [Green Version]
  15. Kawasaki, T.; Igarashi, K.; Ogata, N.; Oka, Y.; Ichiyanagi, K.; Yamanouchi, T. Markedly increased serum and urinary fructose concentrations in diabetic patients with ketoacidosis or ketosis. Acta Diabetol. 2012, 49, 119–123. [Google Scholar] [CrossRef]
  16. Hui, H.; Huang, D.; McArthur, D.; Nissen, N.; Boros, L.G.; Heaney, A.P. Direct spectrophotometric determination of serum fructose in pancreatic cancer patients. Pancreas 2009, 38, 706–712. [Google Scholar] [CrossRef] [PubMed]
  17. Johnson, R.J.; Perez-Pozo, S.E.; Sautin, Y.Y.; Manitius, J.; Sanchez-Lozada, L.G.; Feig, D.I.; Shafiu, M.; Segal, M.; Glassock, R.J.; Shimada, M.; et al. Hypothesis: Could excessive fructose intake and uric acid cause type 2 diabetes? Endocr. Rev. 2009, 30, 96–116. [Google Scholar] [CrossRef] [Green Version]
  18. Abu-Elteen, K.H. The influence of dietary carbohydrates on in vitro adherence of four Candida species to human buccal epithelial cells. Microb. Ecol. Health Dis. 2005, 17, 156–162. [Google Scholar] [CrossRef] [Green Version]
  19. Van Ende, M.; Wijnants, S.; Van Dijck, P. Sugar sensing and signaling in Candida albicans and Candida glabrata. Front. Microbiol. 2019, 10, 1–16. [Google Scholar] [CrossRef] [PubMed]
  20. Sandai, D.; Yin, Z.; Selway, L.; Stead, D.; Walker, J.; Leach, M.D.; Bohovych, I.; Ene, I.V.; Kastora, S.; Budge, S.; et al. The Evolutionary Rewiring of Ubiquitination Targets Has Reprogrammed the Regulation of Carbon Assimilation in the Pathogenic Yeast Candida albicans. MBio 2012, 3, e00495-12. [Google Scholar] [CrossRef] [PubMed] [Green Version]
  21. Fleck, C.B.; Schöbel, F.; Brock, M. Nutrient acquisition by pathogenic fungi: Nutrient availability, pathway regulation, and differences in substrate utilization. Int. J. Med. Microbiol. 2011, 301, 400–407. [Google Scholar] [CrossRef]
  22. Chew, S.Y.; Ho, K.L.; Cheah, Y.K.; Sandai, D.; Brown, A.J.P.; Lung Than, L.T. Physiologically relevant alternative carbon sources modulate biofilm formation, cell wall architecture, and the stress and antifungal resistance of Candida glabrata. Int. J. Mol. Sci. 2019, 20, 3172. [Google Scholar] [CrossRef] [PubMed] [Green Version]
  23. Paul, S.; Moye-Rowley, W.S. Multidrug resistance in fungi: Regulation of transporter-encoding gene expression. Front. Physiol. 2014, 5, 143. [Google Scholar] [CrossRef] [PubMed] [Green Version]
  24. Wirsching, S.; Michel, S.; Morschhäuser, J. Targeted gene disruption in Candida albicans wild-type strains: The role of the MDR1 gene in fluconazole resistance of clinical Candida albicans isolates. Mol. Microbiol. 2000, 36, 856–865. [Google Scholar] [CrossRef] [Green Version]
  25. Sanglard, D.; Ischer, F.; Monod, M.; Bille, J. Cloning of Candida albicans genes conferring resistance to azole antifungal agents: Characterization of CDR2, a new multidrug ABC transporter gene. Microbiology 1997, 143, 405–416. [Google Scholar] [CrossRef] [Green Version]
  26. Sanglard, D.; Ischer, F.; Monod, M.; Bille, J. Susceptibilities of Candida albicans multidrug transporter mutants to various antifungal agents and other metabolic inhibitors. Antimicrob. Agents Chemother. 1996, 40, 2300–2305. [Google Scholar] [CrossRef] [PubMed] [Green Version]
  27. Mukherjee, P.K.; Chandra, J.; Kuhn, D.M.; Ghannoum, M.A. Mechanism of fluconazole resistance in Candida albicans biofilms: Phase-specific role of efflux pumps and membrane sterols. Infect. Immun. 2003, 71, 4333–4340. [Google Scholar] [CrossRef] [Green Version]
  28. De Micheli, M.; Bille, J.; Schueller, C.; Sanglard, D. A common drug-responsive element mediates the upregulation of the Candida albicans ABC transporters CDR1 and CDR2, two genes involved in antifungal drug resistance. Mol. Microbiol. 2002, 43, 1197–1214. [Google Scholar] [CrossRef]
  29. Rognon, B.; Kozovska, Z.; Coste, A.T.; Pardini, G.; Sanglard, D. Identification of promoter elements responsible for the regulation of MDR1 from Candida albicans, a major facilitator transporter involved in azole resistance. Microbiology 2006, 152, 3701–3722. [Google Scholar] [CrossRef] [Green Version]
  30. Karababa, M.; Coste, A.T.; Rognon, B.; Bille, J.; Sanglard, D. Comparison of gene expression profiles of Candida albicans azole-resistant clinical isolates and laboratory strains exposed to drugs inducing multidrug transporters. Antimicrob. Agents Chemother. 2004, 48, 3064–3079. [Google Scholar] [CrossRef] [PubMed] [Green Version]
  31. Feng, W.; Yang, J.; Yang, L.; Li, Q.; Zhu, X.; Xi, Z.; Qiao, Z.; Cen, W. Research of Mrr1, Cap1 and MDR1 in Candida albicans resistant to azole medications. Exp. Ther. Med. 2018, 15, 1217–1224. [Google Scholar] [CrossRef] [Green Version]
  32. Ivnitski-Steele, I.; Holmes, A.R.; Lamping, E.; Monk, B.C.; D, R.; Sklar, L.A. Identification of Nile Red as a fluorescent substrate of the Candida albicans ABC transporters Cdr1p and Cdr2p and the MFS transporter Mdr1p. Anal. Biochem. 2009, 394, 87–91. [Google Scholar] [CrossRef] [Green Version]
  33. Kolaczkowska, A.; Kolaczkowski, M.; Goffeau, A.; Moye-Rowley, W.S. Compensatory activation of the multidrug transporters Pdr5p, Snq2p, and Yor1p by Pdr1p in Saccharomyces cerevisiae. FEBS Lett. 2008, 582, 977–983. [Google Scholar] [CrossRef] [Green Version]
  34. Martins, M.P.; Franceschini, A.C.C.; Jacob, T.R.; Rossi, A.; Martinez-Rossi, N.M. Compensatory expression of multidrug-resistance genes encoding ABC transporters in dermatophytes. J. Med. Microbiol. 2016, 65, 605–610. [Google Scholar] [CrossRef] [PubMed]
  35. Nishimoto, A.T.; Zhang, Q.; Hazlett, B.; Morschhäuser, J.; David Rogers, P. Contribution of clinically derived mutations in the gene encoding the zinc cluster transcription factor Mrr2 to fluconazole antifungal resistance and CDR1 expression in Candida albicans. Antimicrob. Agents Chemother. 2019, 63, 1–12. [Google Scholar] [CrossRef] [PubMed] [Green Version]
  36. Li, W.J.; Liu, J.Y.; Shi, C.; Zhao, Y.; Meng, L.N.; Wu, F.; Xiang, M.J. FLO8 deletion leads to azole resistance by upregulating CDR1 and CDR2 in Candida albicans. Res. Microbiol. 2019, 170, 272–279. [Google Scholar] [CrossRef] [PubMed]
  37. Vogel, M.; Hartmann, T.; Köberle, M.; Treiber, M.; Autenrieth, I.B.; Schumacher, U.K. Rifampicin induces MDR1 expression in Candida albicans. J. Antimicrob. Chemother. 2008, 61, 541–547. [Google Scholar] [CrossRef] [PubMed]
  38. Semchyshyn, H.M.; Lozinska, L.M. Fructose protects baker’s yeast against peroxide stress: Potential role of catalase and superoxide dismutase. FEMS Yeast Res. 2012, 12, 761–773. [Google Scholar] [CrossRef] [Green Version]
  39. Harry, J.B.; Oliver, B.G.; Song, J.L.; Silver, P.M.; Little, J.T.; Choiniere, J.; White, T.C. Drug-induced regulation of the MDR1 promoter in Candida albicans. Antimicrob. Agents Chemother. 2005, 49, 2785–2792. [Google Scholar] [CrossRef] [Green Version]
  40. Masterjohn, C.; Park, Y.; Lee, J.; Noh, S.K.; Koo, S.I.; Bruno, R.S. Dietary fructose feeding increases adipose methylglyoxal accumulation in rats in association with low expression and activity of glyoxalase-2. Nutrients 2013, 5, 3311–3328. [Google Scholar] [CrossRef] [Green Version]
  41. Biermann, A.R.; Demers, E.G.; Hogan, D.A. Mrr1 regulation of methylglyoxal catabolism and methylglyoxal-induced fluconazole resistance in Candida lusitaniae. Mol. Microbiol. 2020. [Google Scholar] [CrossRef]
  42. Redhu, A.K.; Shah, A.H.; Prasad, R. MFS transporters of Candida species and their role in clinical drug resistance. FEMS Yeast Res. 2016, 16, 1–12. [Google Scholar] [CrossRef] [Green Version]
  43. Laughlin, M.R. Normal roles for dietary fructose in carbohydrate metabolism. Nutrients 2014, 6, 3117–3129. [Google Scholar] [CrossRef] [PubMed] [Green Version]
  44. Suchodolski, J.; Muraszko, J.; Bernat, P.; Krasowska, A. A Crucial Role for Ergosterol in Plasma Membrane Composition, Localisation, and Activity of Cdr1p and H + -ATPase in Candida albicans. Microorganisms 2019, 7, 378. [Google Scholar] [CrossRef] [PubMed] [Green Version]
  45. Fonzi, W.A.; Irwin, M.Y. Isogenic Strain Construction and Gene Mapping in Candida albicans. Genetis 1993, 134, 717–728. [Google Scholar] [CrossRef]
  46. Suchodolski, J.; Muraszko, J.; Korba, A.; Bernat, P.; Krasowska, A. Lipid composition and cell surface hydrophobicity of Candida albicans influence the efficacy of fluconazole-gentamicin treatment. Yeast 2020, 37, 117–129. [Google Scholar] [CrossRef]
  47. Milne, S.W.; Cheetham, J.; Lloyd, D.; Aves, S.; Bates, S. Cassettes for PCR-mediated gene tagging in Candida albicans utilizing nourseothricin resistance. Yeast 2011, 28, 833–841. [Google Scholar] [CrossRef]
  48. Sasse, C.; Schillig, R.; Dierolf, F.; Weyler, M.; Schneider, S.; Mogavero, S.; Rogers, P.D.; Morschhäuser, J. The transcription factor Ndt80 does not contribute to Mrr1-, Tac1-, and Upc2-mediated fluconazole resistance in Candida albicans. PLoS ONE 2011, 6, E25623. [Google Scholar] [CrossRef]
  49. CLSI Reference method for broth dilutionantifungal susceptibility testing of yeast. In Approved standard. M27-A3 28, 3rd ed.; CLSI: Annapolis Junction, MD, USA, 2008; p. 604. [CrossRef] [Green Version]
  50. Szczepaniak, J.; Cieślik, W.; Romanowicz, A.; Musioł, R.; Krasowska, A. Blocking and dislocation of Candida albicans Cdr1p transporter by styrylquinolines. Int. J. Antimicrob. Agents 2017, 50, 171–176. [Google Scholar] [CrossRef]
Figure 1. (A) Percentage of Candida albicans CAF2-1 cell growth in the presence of a range of fluconazole concentrations (FLC, 0–32 μg/mL). Cells were cultured with either yeast nitrogen base glucose (YNBG) or yeast nitrogen base fructose (YNBF) media for 24 h at 28 °C (mean ± SD, n = 3). Statistical analysis was performed by comparing the percentage growth between YNBG- and YNBF-grown cells at the same FLC concentrations (*, p < 0.05 and **, p < 0.01). (B) Growth phenotypes of C. albicans CAF2-1 (parental strain), DSY448 (cdr1Δ), DSY653 (cdr2Δ), DSY465 (mdr1Δ), DSY654 (cdr1Δcdr2Δ), and DSY1050 (cdr1Δcdr2Δmdr1Δ) strains after 48-h incubation at 28 °C. All strains were grown on either YNBG or YNBF media in the presence of a range of FLC concentrations (0–2 μg/mL).
Ijms 22 02127 g001
Figure 2. The activity of multiple drug resistance (MDR) transporters measured by (A) rhodamine 6G (R6G), or (B) Nile red (NR), efflux in C. albicans CAF2-1 (parental strain), DSY448 (cdr1Δ), DSY653 (cdr2Δ), DSY465 (mdr1Δ), DSY654 (cdr1Δcdr2Δ), and DSY1050 (cdr1Δcdr2Δmdr1Δ) strains grown in yeast nitrogen base glucose (YNBG) or yeast nitrogen base fructose (YNBF) media for 8 h at 28 °C. Fluorescence intensities (IFs) of extracellular dyes were normalized (=1 for the YNBG-grown CAF2-1 strain) (means ± SD, n = 3, a.u. – arbitrary units). Statistical analysis was performed between YNBG- and YNBF-grown cells or between different strains (*, p < 0.05, and ***, p < 0.001).
Ijms 22 02127 g002
Figure 3. Fluorescence micrographs of the subcellular localization of the (A) Cdr1p-green fluorescent protein (GFP) in the C. albicans strains, KS052 (CAF2-1 CDR1-GFP), KS053 (DSY653 CDR1-GFP), and KS054 (DSY465 CDR1-GFP) or (B) Cdr2p-GFP in the C. albicans strains KS063 (CAF2-1 CDR2-GFP), KS064 (DSY448 CDR2-GFP), and KS065 (DSY465 CDR2-GFP). Scale bar = 5 μm. (C) Immunoblot analysis of Cdr1p-GFP in C. albicans KS052, KS053, and KS054. A positive control was prepared by treating the KS052 strain with 4-µg/mL FLC for 4 h. (D) Immunoblot analysis of Cdr2p-GFP in C. albicans KS063, KS064, and KS065. A positive control was prepared by treating the KS063 strain with 20-µg/mL fluphenazine for 4 h. In all the presented experiments, the C. albicans strains were grown in yeast nitrogen base glucose (YNBG) or yeast nitrogen base fructose (YNBF) media for 8 h at 28 °C.
Ijms 22 02127 g003
Figure 4. (A) Fluorescence micrographs of the subcellular localization of Mdr1p-GFP in the C. albicans strains KS070 (CAF2-1 MDR1-GFP), KS075 (DSY448 MDR1-GFP), KS074 (DSY653 MDR1-GFP), and KS073 (DSY654 MDR1-GFP). Scale bar = 5 μm. (B) Immunoblot analysis of Mdr1p-GFP in C. albicans KS070, KS075, KS074, and KS073. A positive control was obtained by treating the KS070 strain with 3% H2O2 for 4 h. In both presented experiments, the C. albicans strains were grown in yeast nitrogen base glucose (YNBG) or yeast nitrogen base fructose (YNBF) media for 8 h at 28 °C.
Ijms 22 02127 g004
Figure 5. Fluorescence micrographs showing the subcellular localization of (A) Cdr1p-GFP in the C. albicans strain KS052 (CAF2-1 CDR1-GFP) or (B) Mdr1p-GFP in the C. albicans strain KS070 (CAF2-1 MDR1-GFP). Scale bar = 3 μm. Immunoblot analysis of (C) Cdr1p-GFP in C. albicans KS052 or (D) Mdr1-GFP in C. albicans KS070. In all the presented experiments, the C. albicans strains were grown in a yeast nitrogen base glucose (YNBG) medium for 8 h at 28 °C; starved in a HEPES-NaOH buffer for 1 h at 28 °C; and induced with 0.2% glucose, 0.006% fructose, or both sugars simultaneously (Glu + Fru) for 30 or 60 min.
Ijms 22 02127 g005
Table 1. Candida albicans Strains Used in This Study.
StrainParentDescriptionComplete GenotypeReference
CAF2-1 Parental strainura3∆::imm434/URA3[45]
DSY448CAF2-1cdr1Δura3Δ::imm434/ura3Δ::imm434
cdr1Δ::hisG/cdr1Δ::hisG-URA3-hisG
[26]
DSY653CAF2-1cdr2Δura3Δ::imm434/ura3Δ::imm434
cdr2Δ::hisG/cdr2Δ::hisG-URA3-hisG
[25]
DSY465CAF2-1mdr1Δura3Δ::imm434/ura3Δ::imm434
mdr1Δ::hisG/mdr1Δ::hisG-URA3-hisG
[26]
DSY654CAF2-1cdr1Δcdr2Δura3Δ::imm434/ura3Δ::imm434
cdr1Δ::hisG/cdr1Δ::hisG
cdr2Δ::hisG/cdr2Δ::hisG-URA3-hisG
[25]
DSY1050CAF2-1cdr1Δcdr2Δmdr1Δura3Δ::imm434/ura3Δ::imm434
cdr1Δ::hisG/cdr1Δ::hisG
cdr2Δ::hisG/cdr2Δ:: hisG
mdr1Δ::hisG/mdr1Δ::hisG-URA3-hisG
[27]
KS052CAF2-1CDR1-GFPura3Δ::imm434/URA3 CDR1/CDR1-GFP-NAT1[46]
KS053DSY653cdr2Δ CDR1-GFPura3Δ::imm434/ura3Δ::imm434
cdr2Δ::hisG/cdr2Δ::hisG-URA3-hisG
CDR1/CDR1-GFP-NAT1
This study
KS054DSY465mdr1Δ CDR1-GFPura3Δ::imm434/ura3Δ::imm434
mdr1Δ::hisG/mdr1Δ::hisG-URA3-hisG
CDR1/CDR1-GFP-NAT1
This study
KS063CAF2-1CDR2-GFPura3Δ::imm434/URA3 CDR2/CDR2-GFP-NAT1[46]
KS064DSY448cdr1Δ CDR2-GFPura3Δ::imm434/ura3Δ::imm434
cdr1Δ::hisG/cdr1Δ::hisG-URA3-hisG
CDR2/CDR2-GFP-NAT1
This study
KS065DSY465mdr1Δ CDR2-GFPura3Δ::imm434/ura3Δ::imm434
mdr1Δ::hisG/mdr1Δ::hisG-URA3-hisG
CDR2/CDR2-GFP-NAT1
This study
KS070CAF2-1MDR1-GFPura3Δ::imm434/URA3 MDR1/MDR1-GFP-NAT1This study
KS073DSY654cdr1Δcdr2ΔMDR1-GFPura3Δ::imm434/ura3Δ::imm434
cdr1Δ::hisG/cdr1Δ::hisG
cdr2Δ::hisG/cdr2Δ::hisG-URA3-hisG
MDR1/MDR1-GFP-NAT1
This study
KS074DSY653cdr2ΔMDR1-GFPura3Δ::imm434/ura3Δ::imm434
cdr2Δ::hisG/cdr2Δ::hisG-URA3-hisG
MDR1/MDR1-GFP-NAT1
This study
KS075DSY448cdr1ΔMDR1-GFPura3Δ::imm434/ura3Δ::imm434
cdr1Δ::hisG/cdr1Δ::hisG-URA3-hisG
MDR1/MDR1-GFP-NAT1
This study
Table 2. Primers Used in This Study.
PrimerSequence 5′–3′
C1_GFPNAT_FCATTCTTACGGTGATCTTTTATTGGTTAGCTAGAGTTCCAAAGGGTAACA
GAGAGAAAAAAAATAAGAAAGGTGGTGGTTCTAAAGGTGAAGAATTATT
C1_GFPNAT_RAACAACAACAATAGTCTAAAAACGTCTATTATATTTTAGACGTTTGAGA
TACCACCATGTCAAAAAACAACGTTAGTATCGAATCG ACAGC
C2_GFPNAT_FCATTCTTACTATTTTCTTTTACTGGTTGGCTAGAGTTCCAAAAGGTAATAG
AGAAAAGAAGATGAAAAAAGGTGGTGGTTCTAAAG GTGAAGAATTATT
C2_GFPNAT_RATCAAACAATCACAAATAACGTATAAATAATAATAAGAAAAAAAAAAT
ATGAATACTAATTGTAAAATAACGTTAGTATCGAATCG ACAGC
M1_GFPNAT_FTTGTTATGATTGCTATTCCAGTTTTGTTTTACTTGAACGGACCAAAGTTGA
GAGCAAGATCTAAGTATGCGGTGGTGGTTCTAAAGGTGAAGAATTATT
M1_GFPNAT_RTCAGTCCTTTTCTCTTTTTAATTATTGATTAATGTATCTATAACACGATATA
TCTATAGGAAAACAATGACGTTAGTATCGAATCGACAGC
NAT1_FGCTTATAGATACAGAACTTCTGTTCC
NAT1_RTGAAACCCATTCTTCTATAAGCATG
C1NAT1_SFTCAAGCTATGCTTTCTACTGGA
C2NAT1_SFGTATTGGCTGGTCCTAATGTG
M1NAT1_SFTATTGGTATTGTCATTGCTGCC
GFP_N1_SR2AATTCTTCACCTTTAGAACCACC
Publisher’s Note: MDPI stays neutral with regard to jurisdictional claims in published maps and institutional affiliations.

