
The Participation of the Intrinsically Disordered Regions of the bHLH-PAS Transcription Factors in Disease Development


Abstract
:1. Introduction
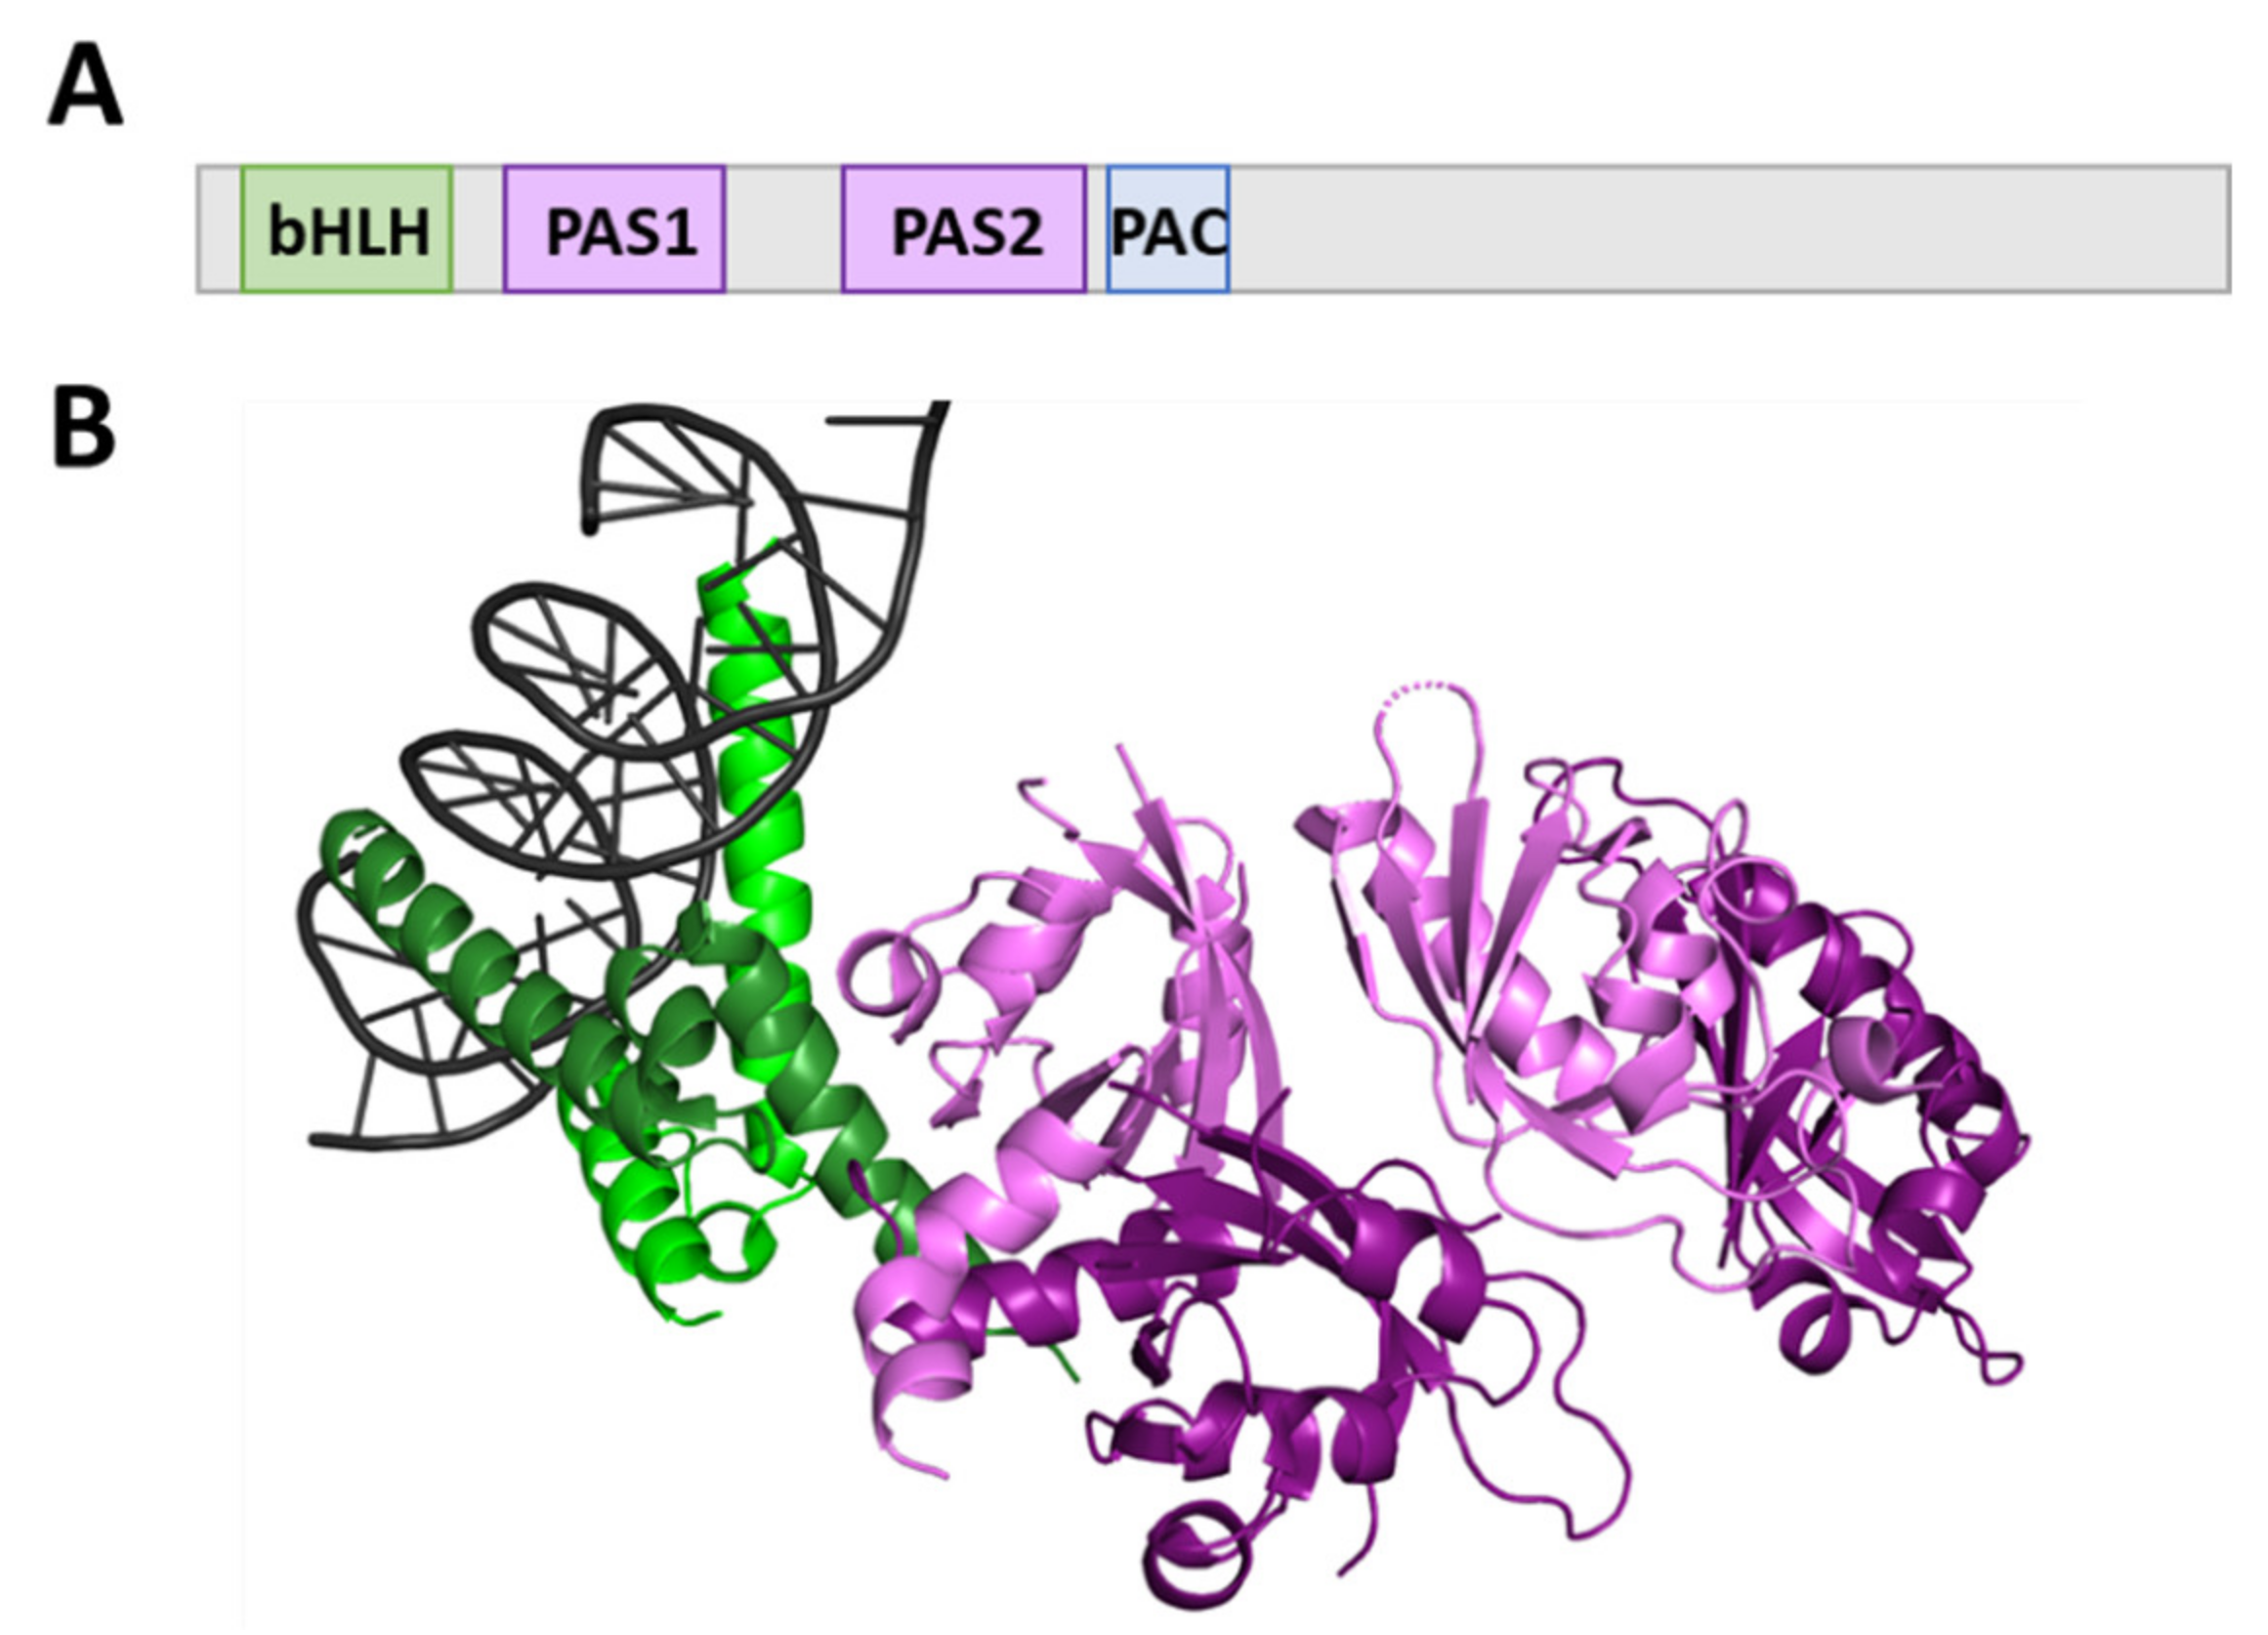
1.1. bHLH-PAS Proteins
1.2. bHLH-PAS Proteins and Diseases
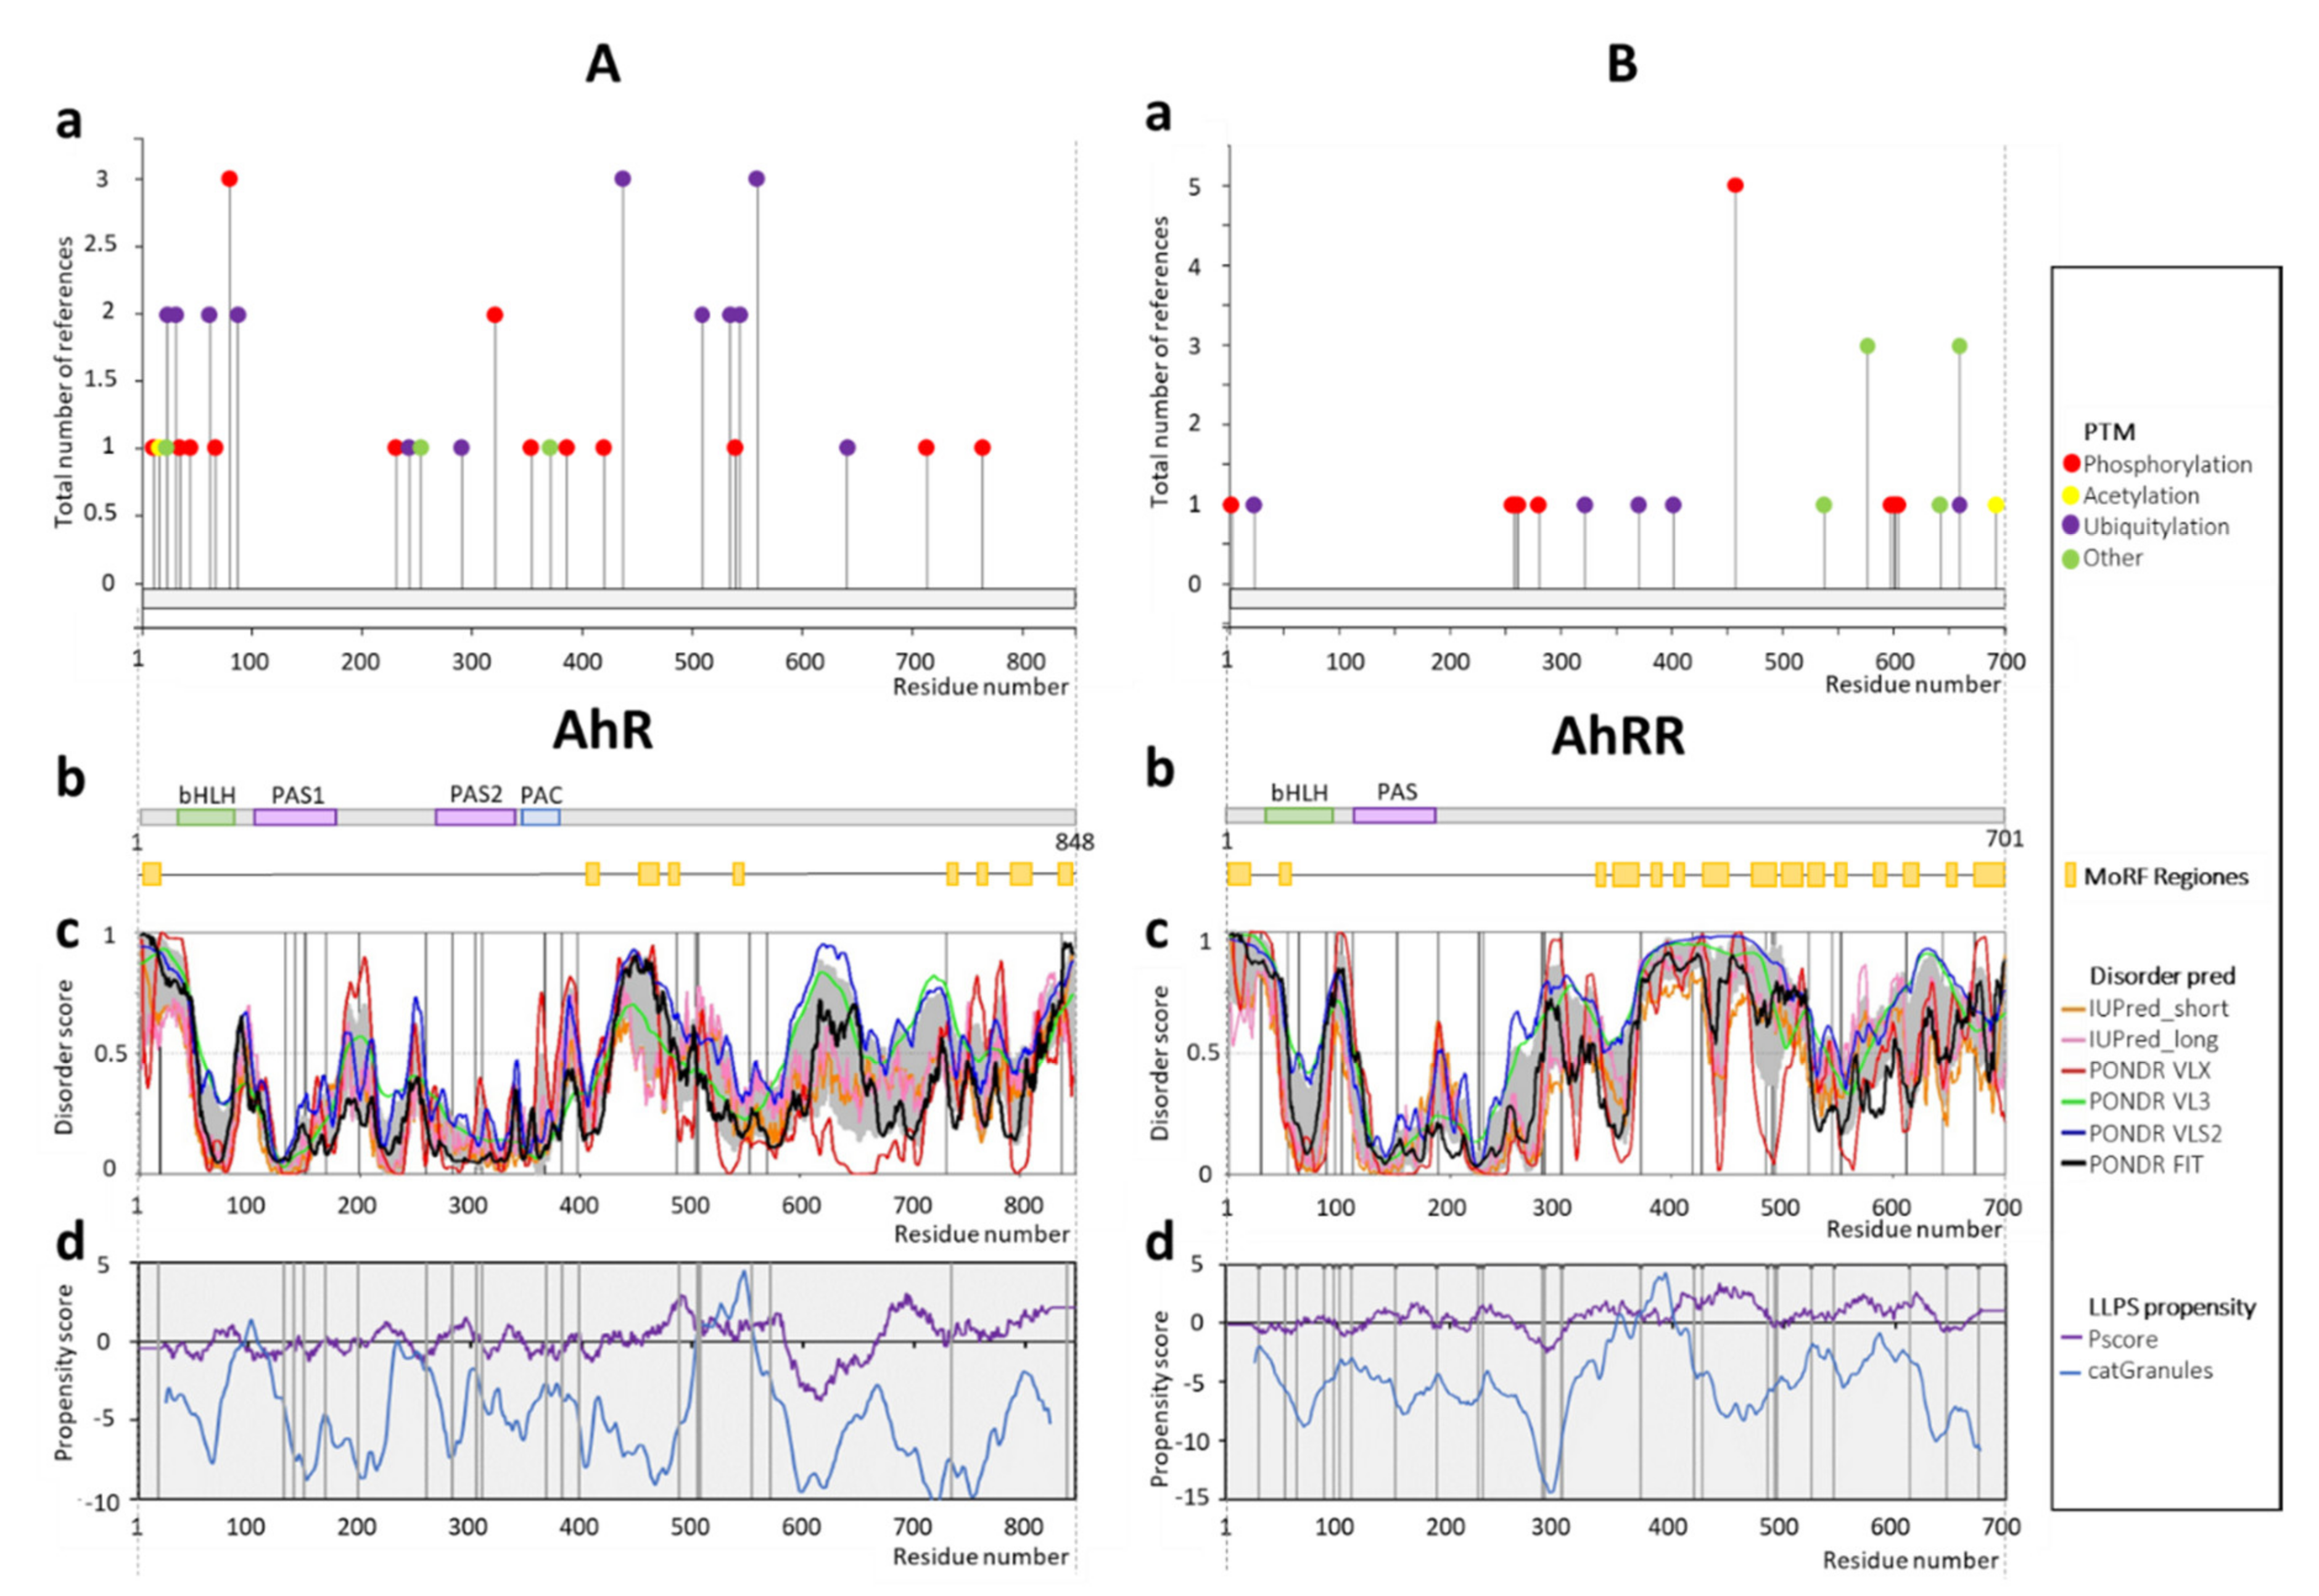
1.2.1. AhR and AhRR
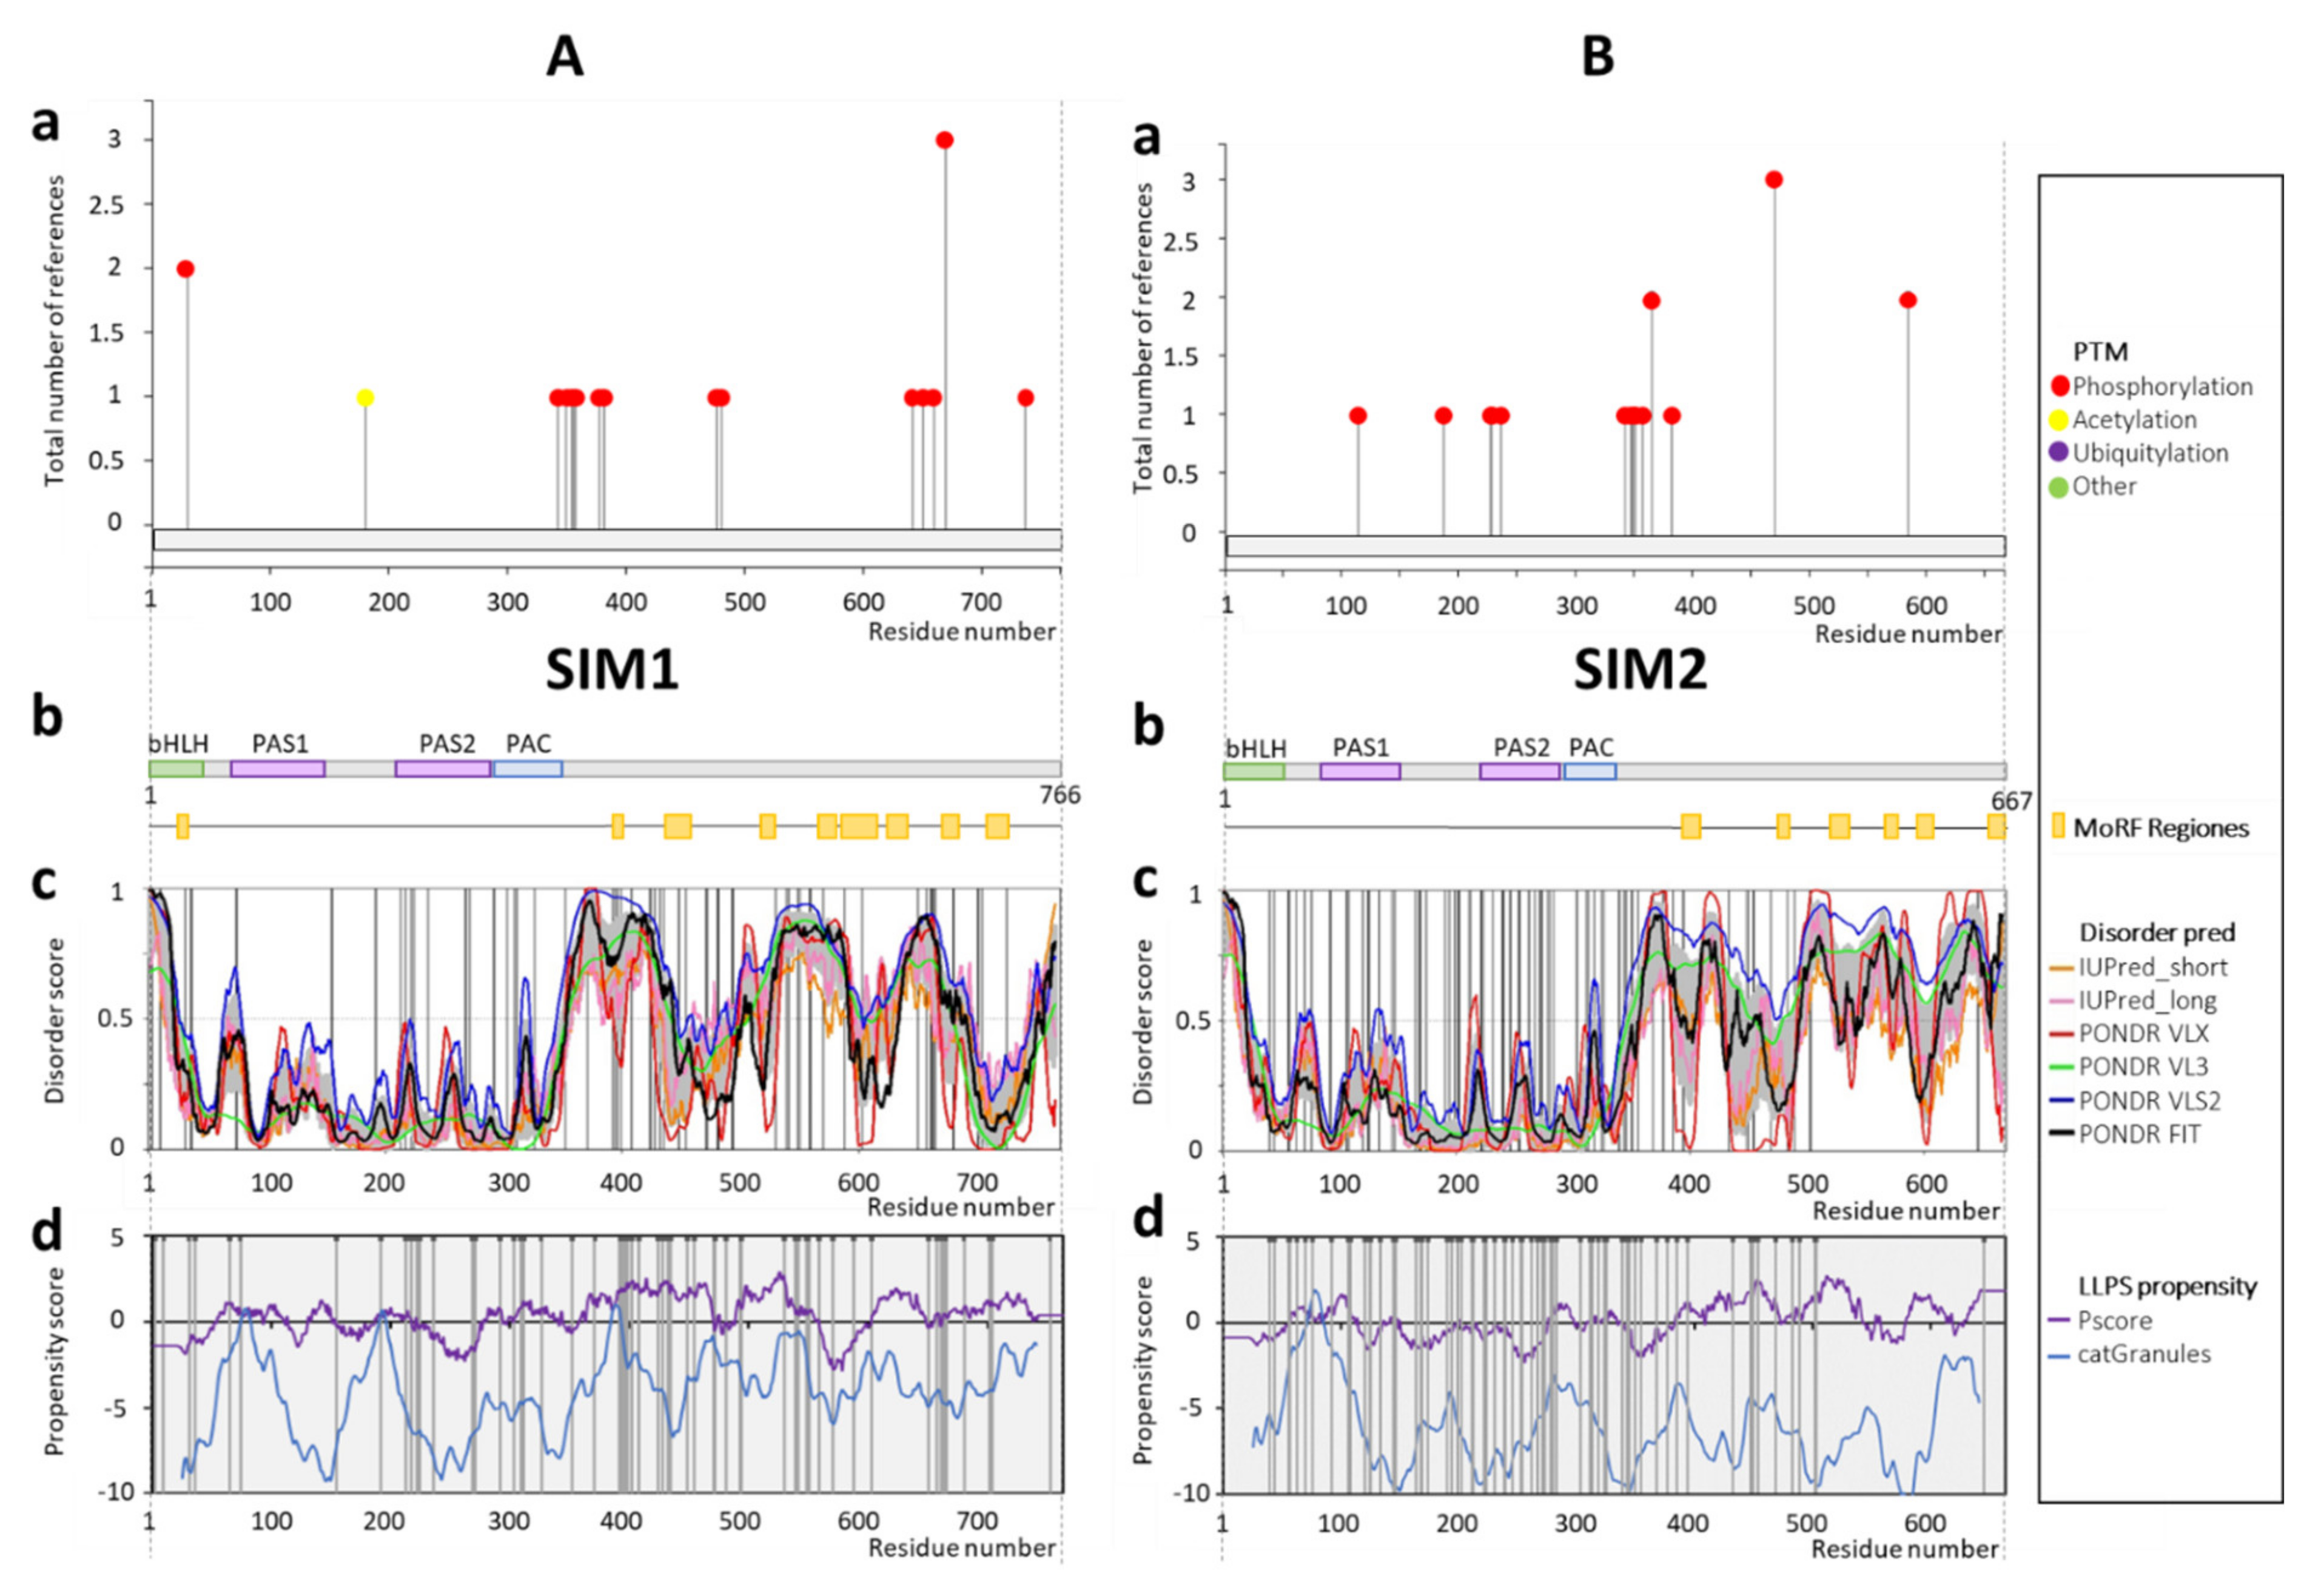
1.2.2. Single Minded Protein (SIM)
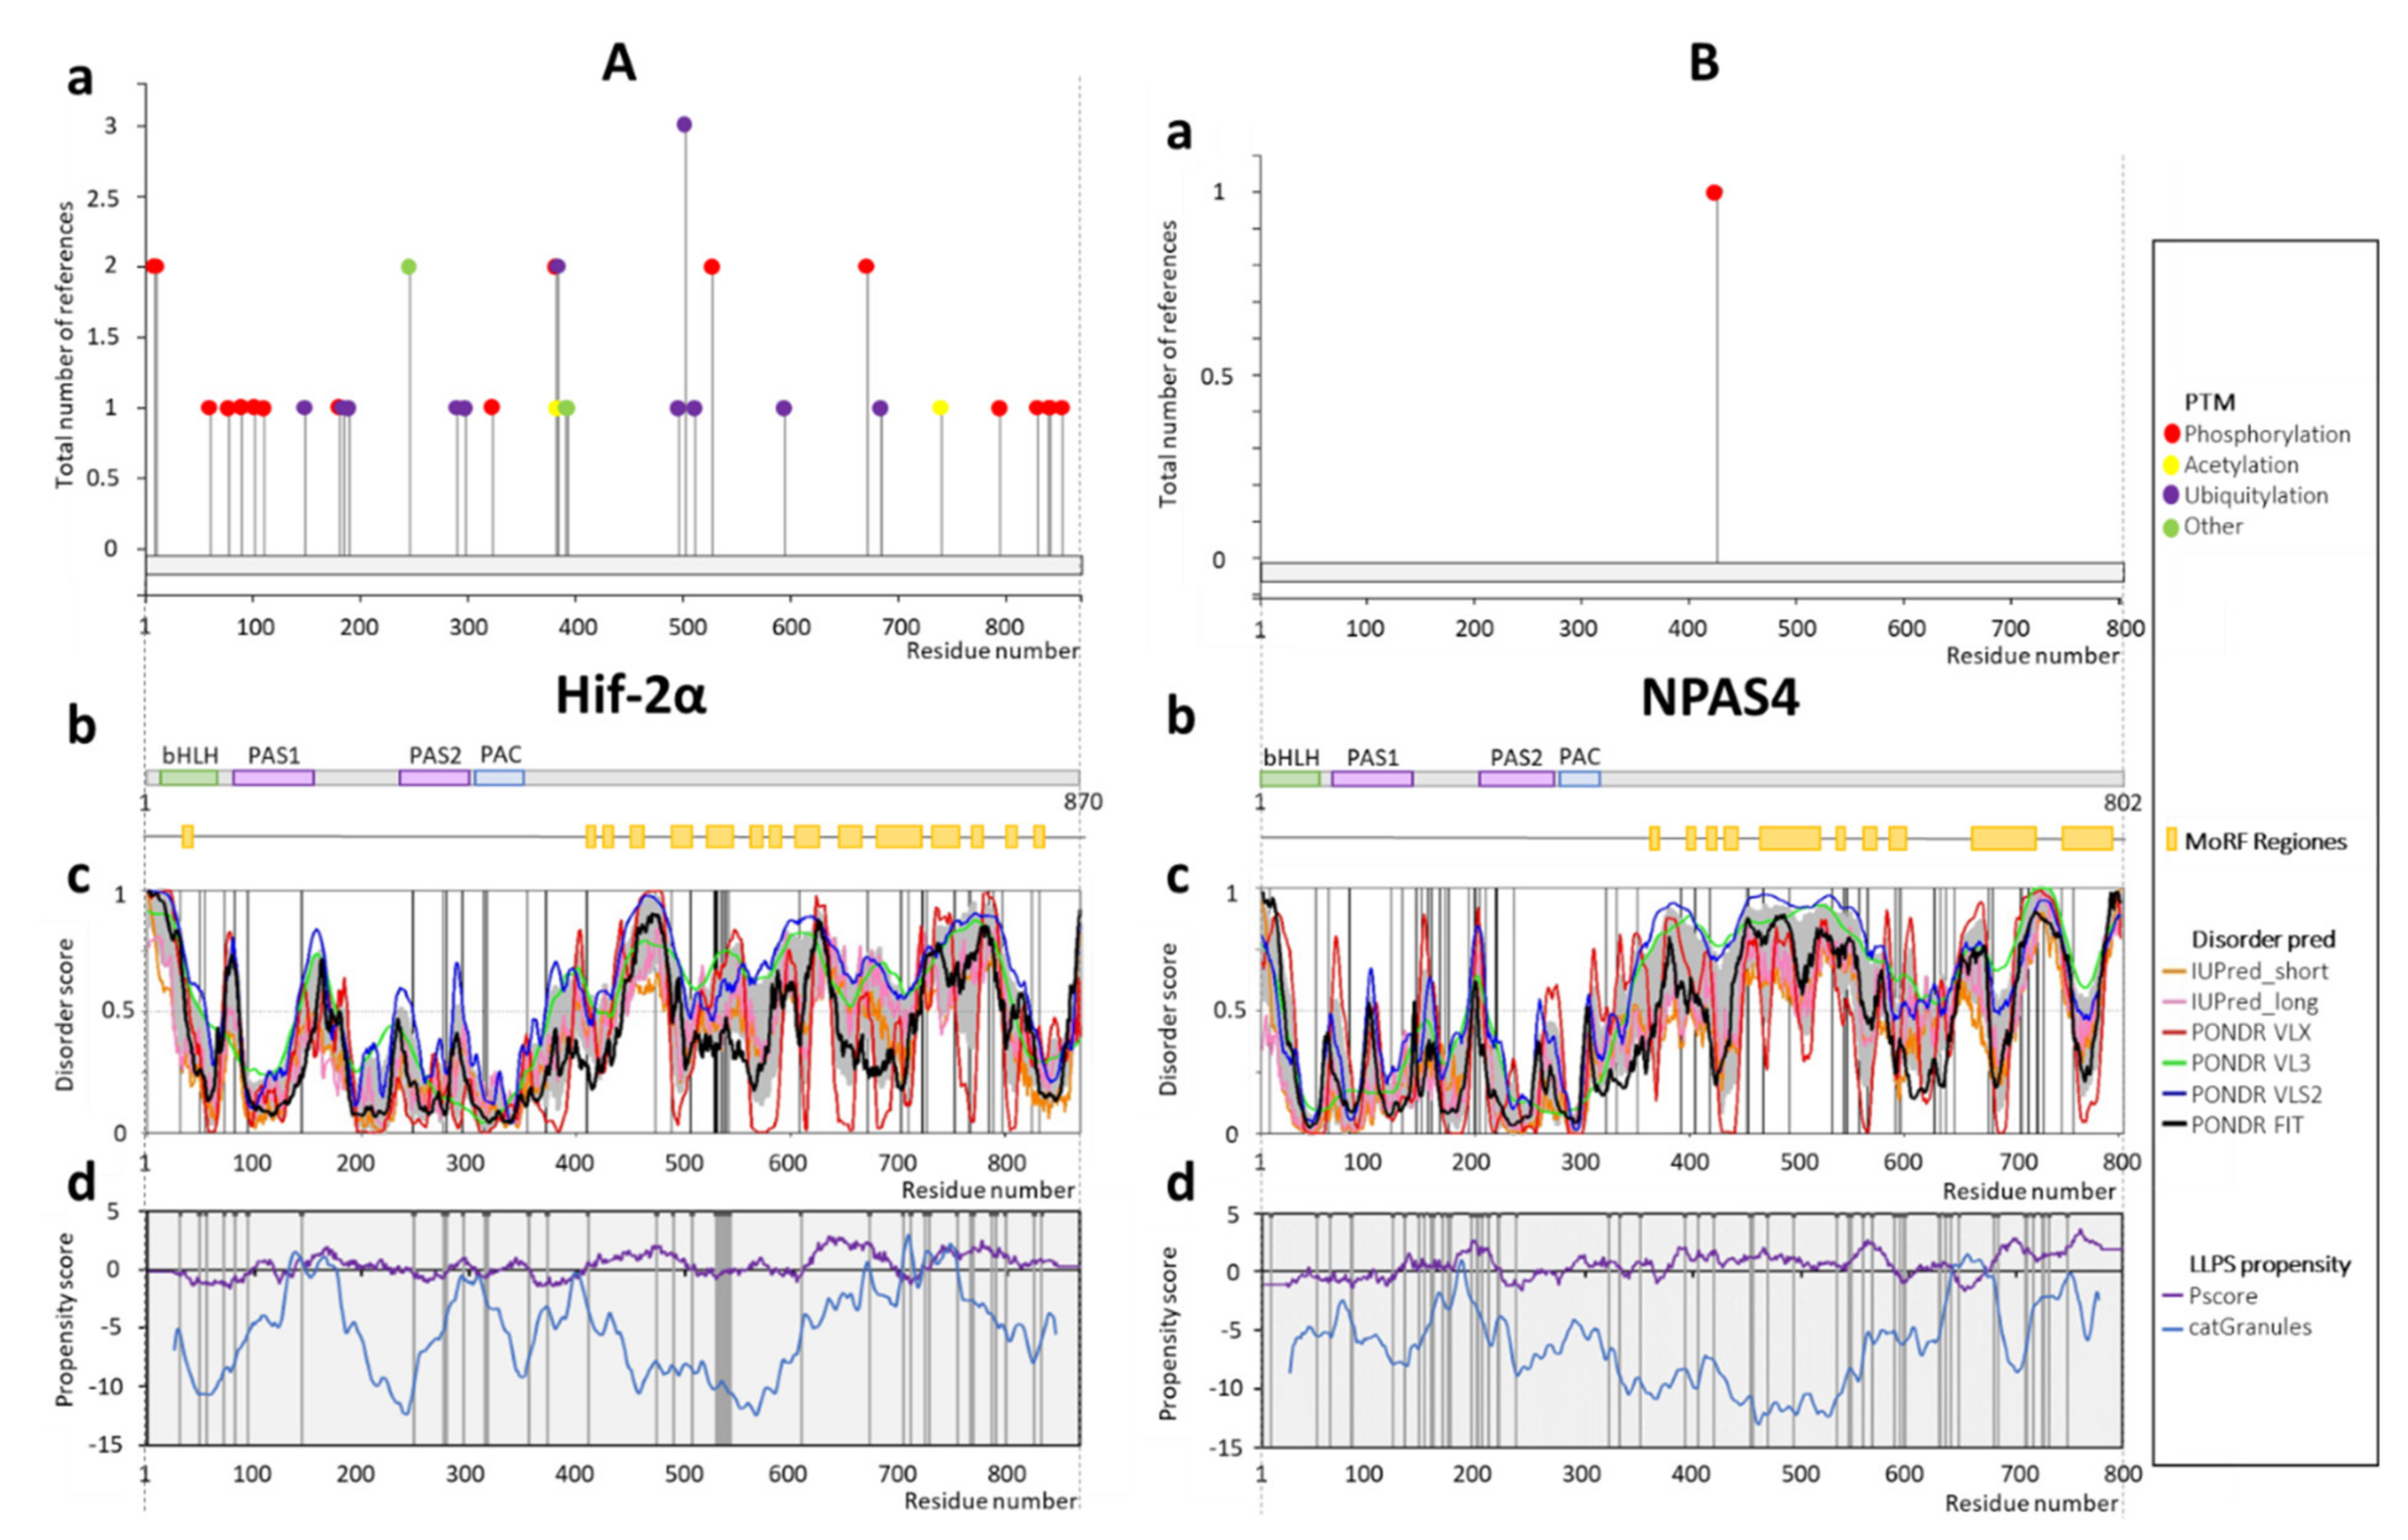
1.2.3. Hypoxia Inducible Factor 2α (Hif-2α)
1.2.4. Neuronal PAS-Domain Containing Protein 4 (NPAS4)
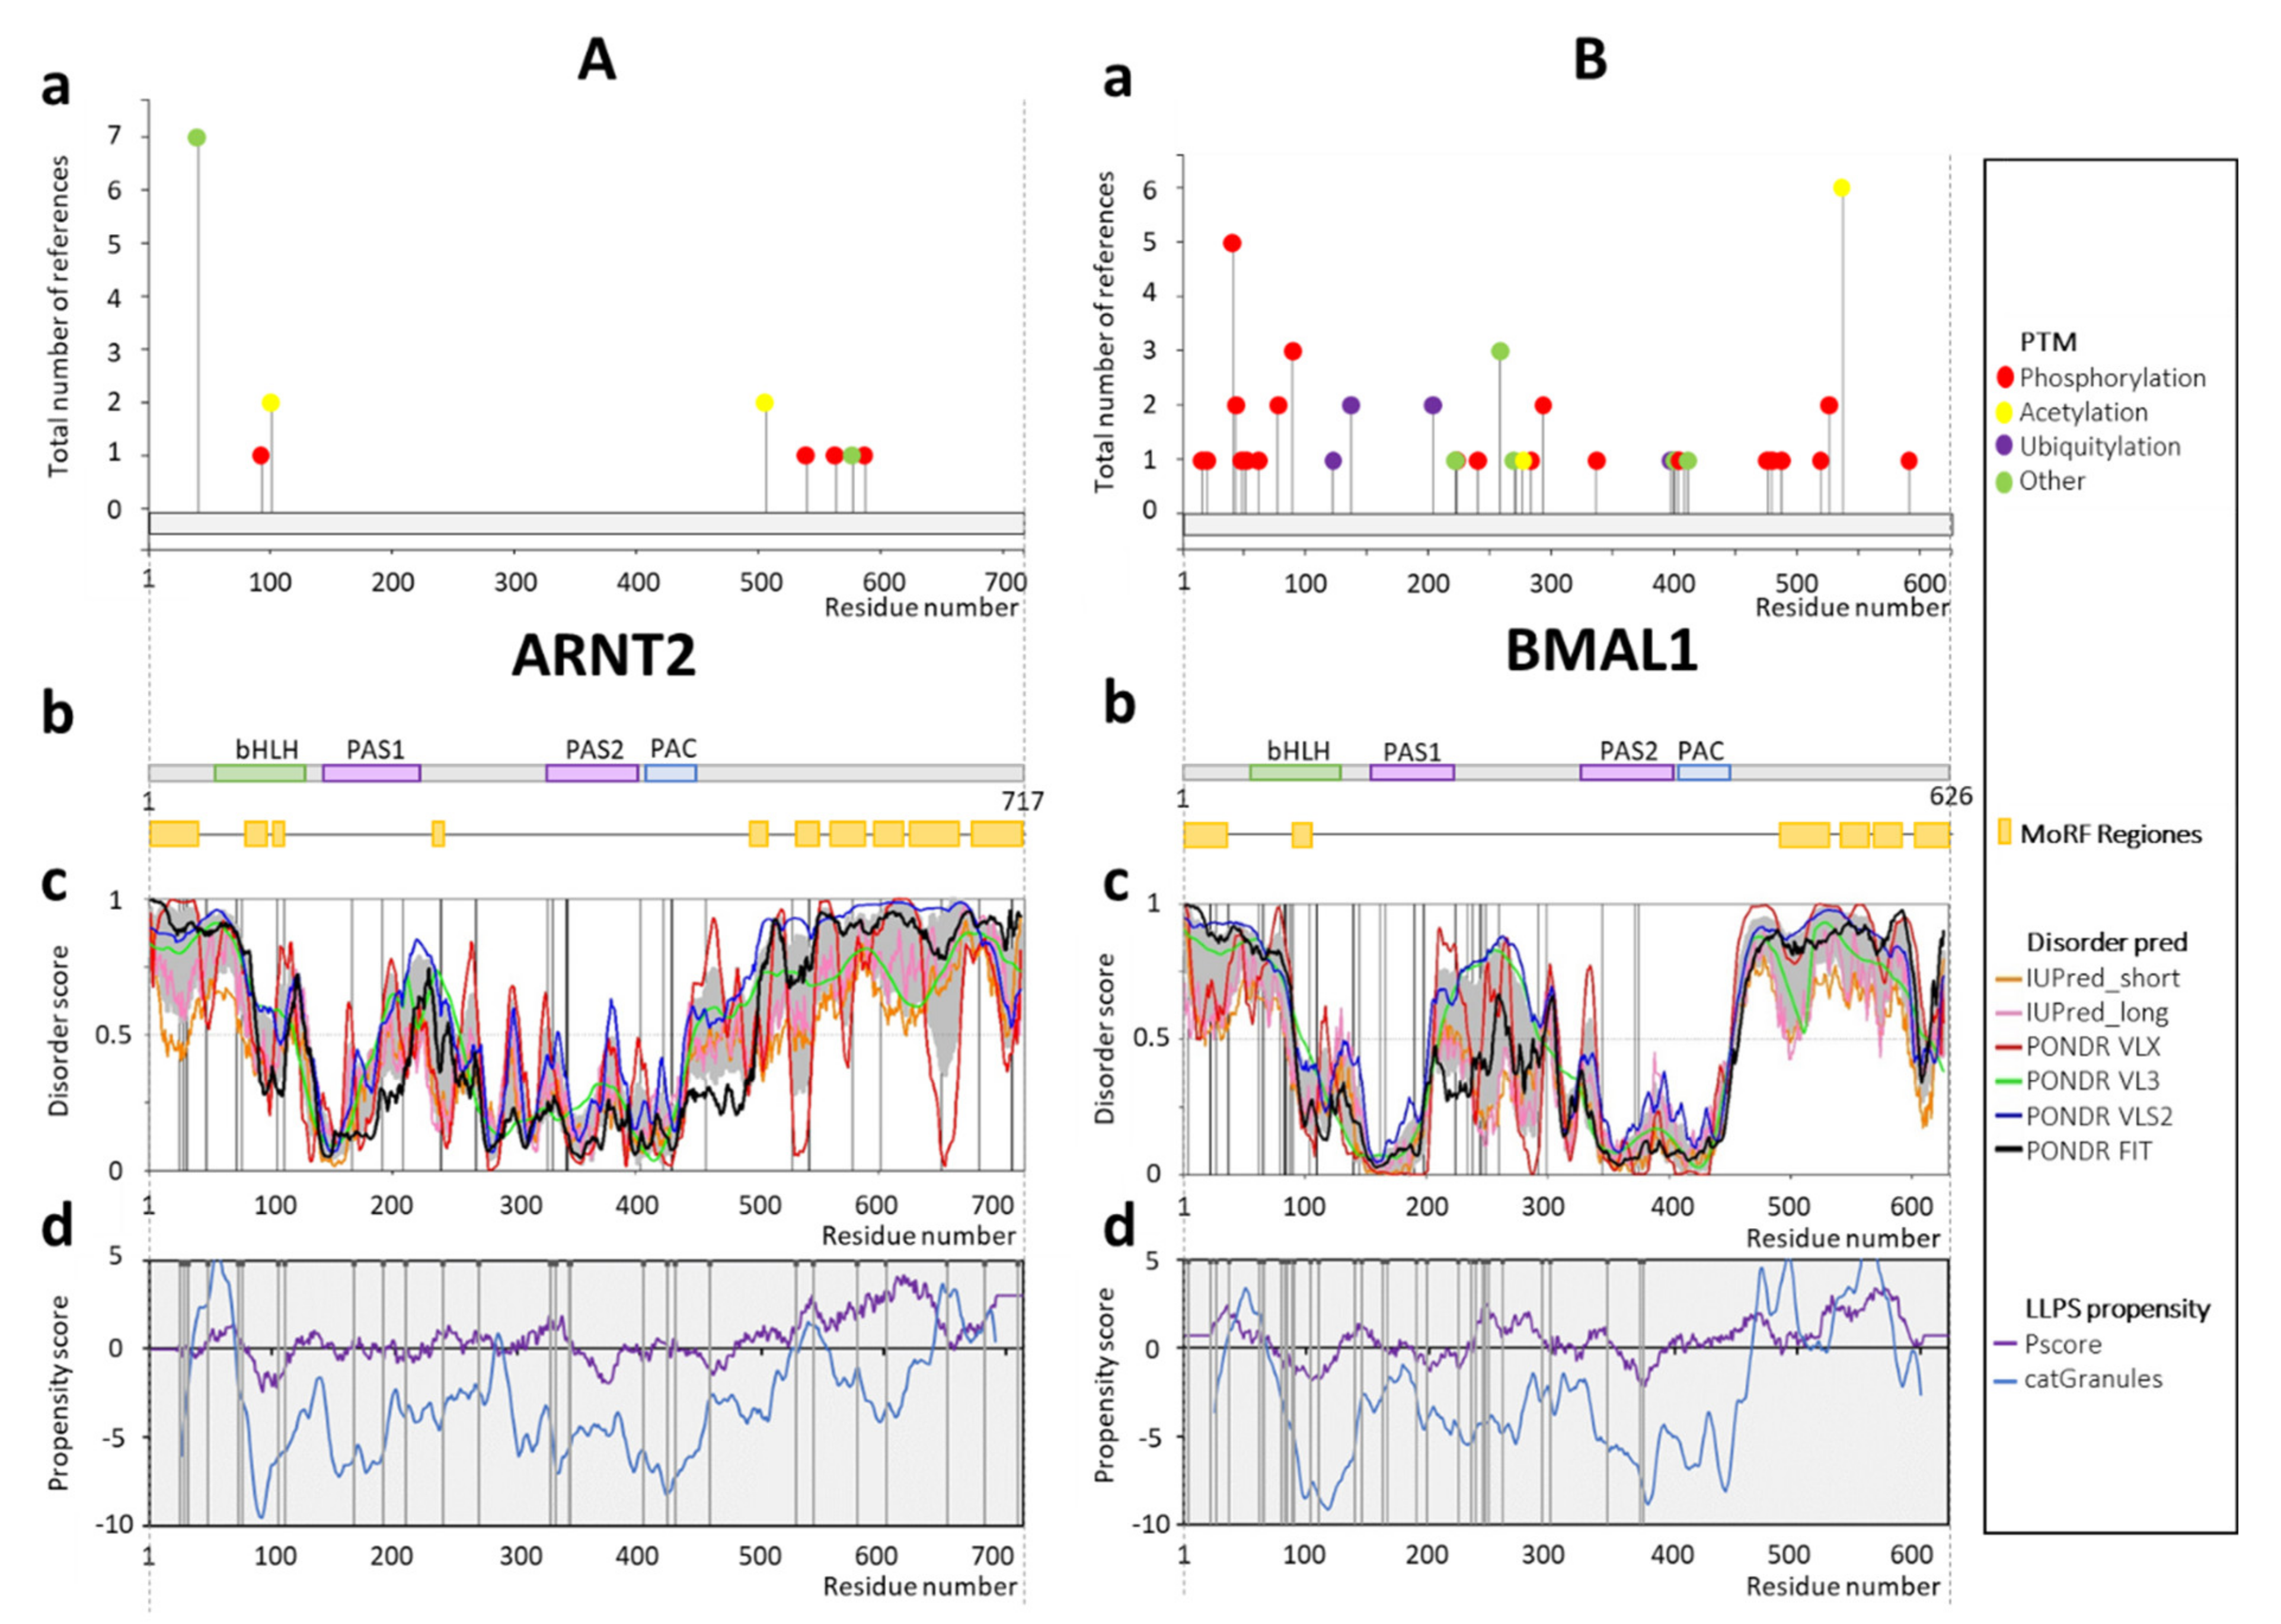
1.2.5. Aryl Hydrocarbon Receptor Nuclear Translocator 2 (ARNT2) and BMAL1
2. Results
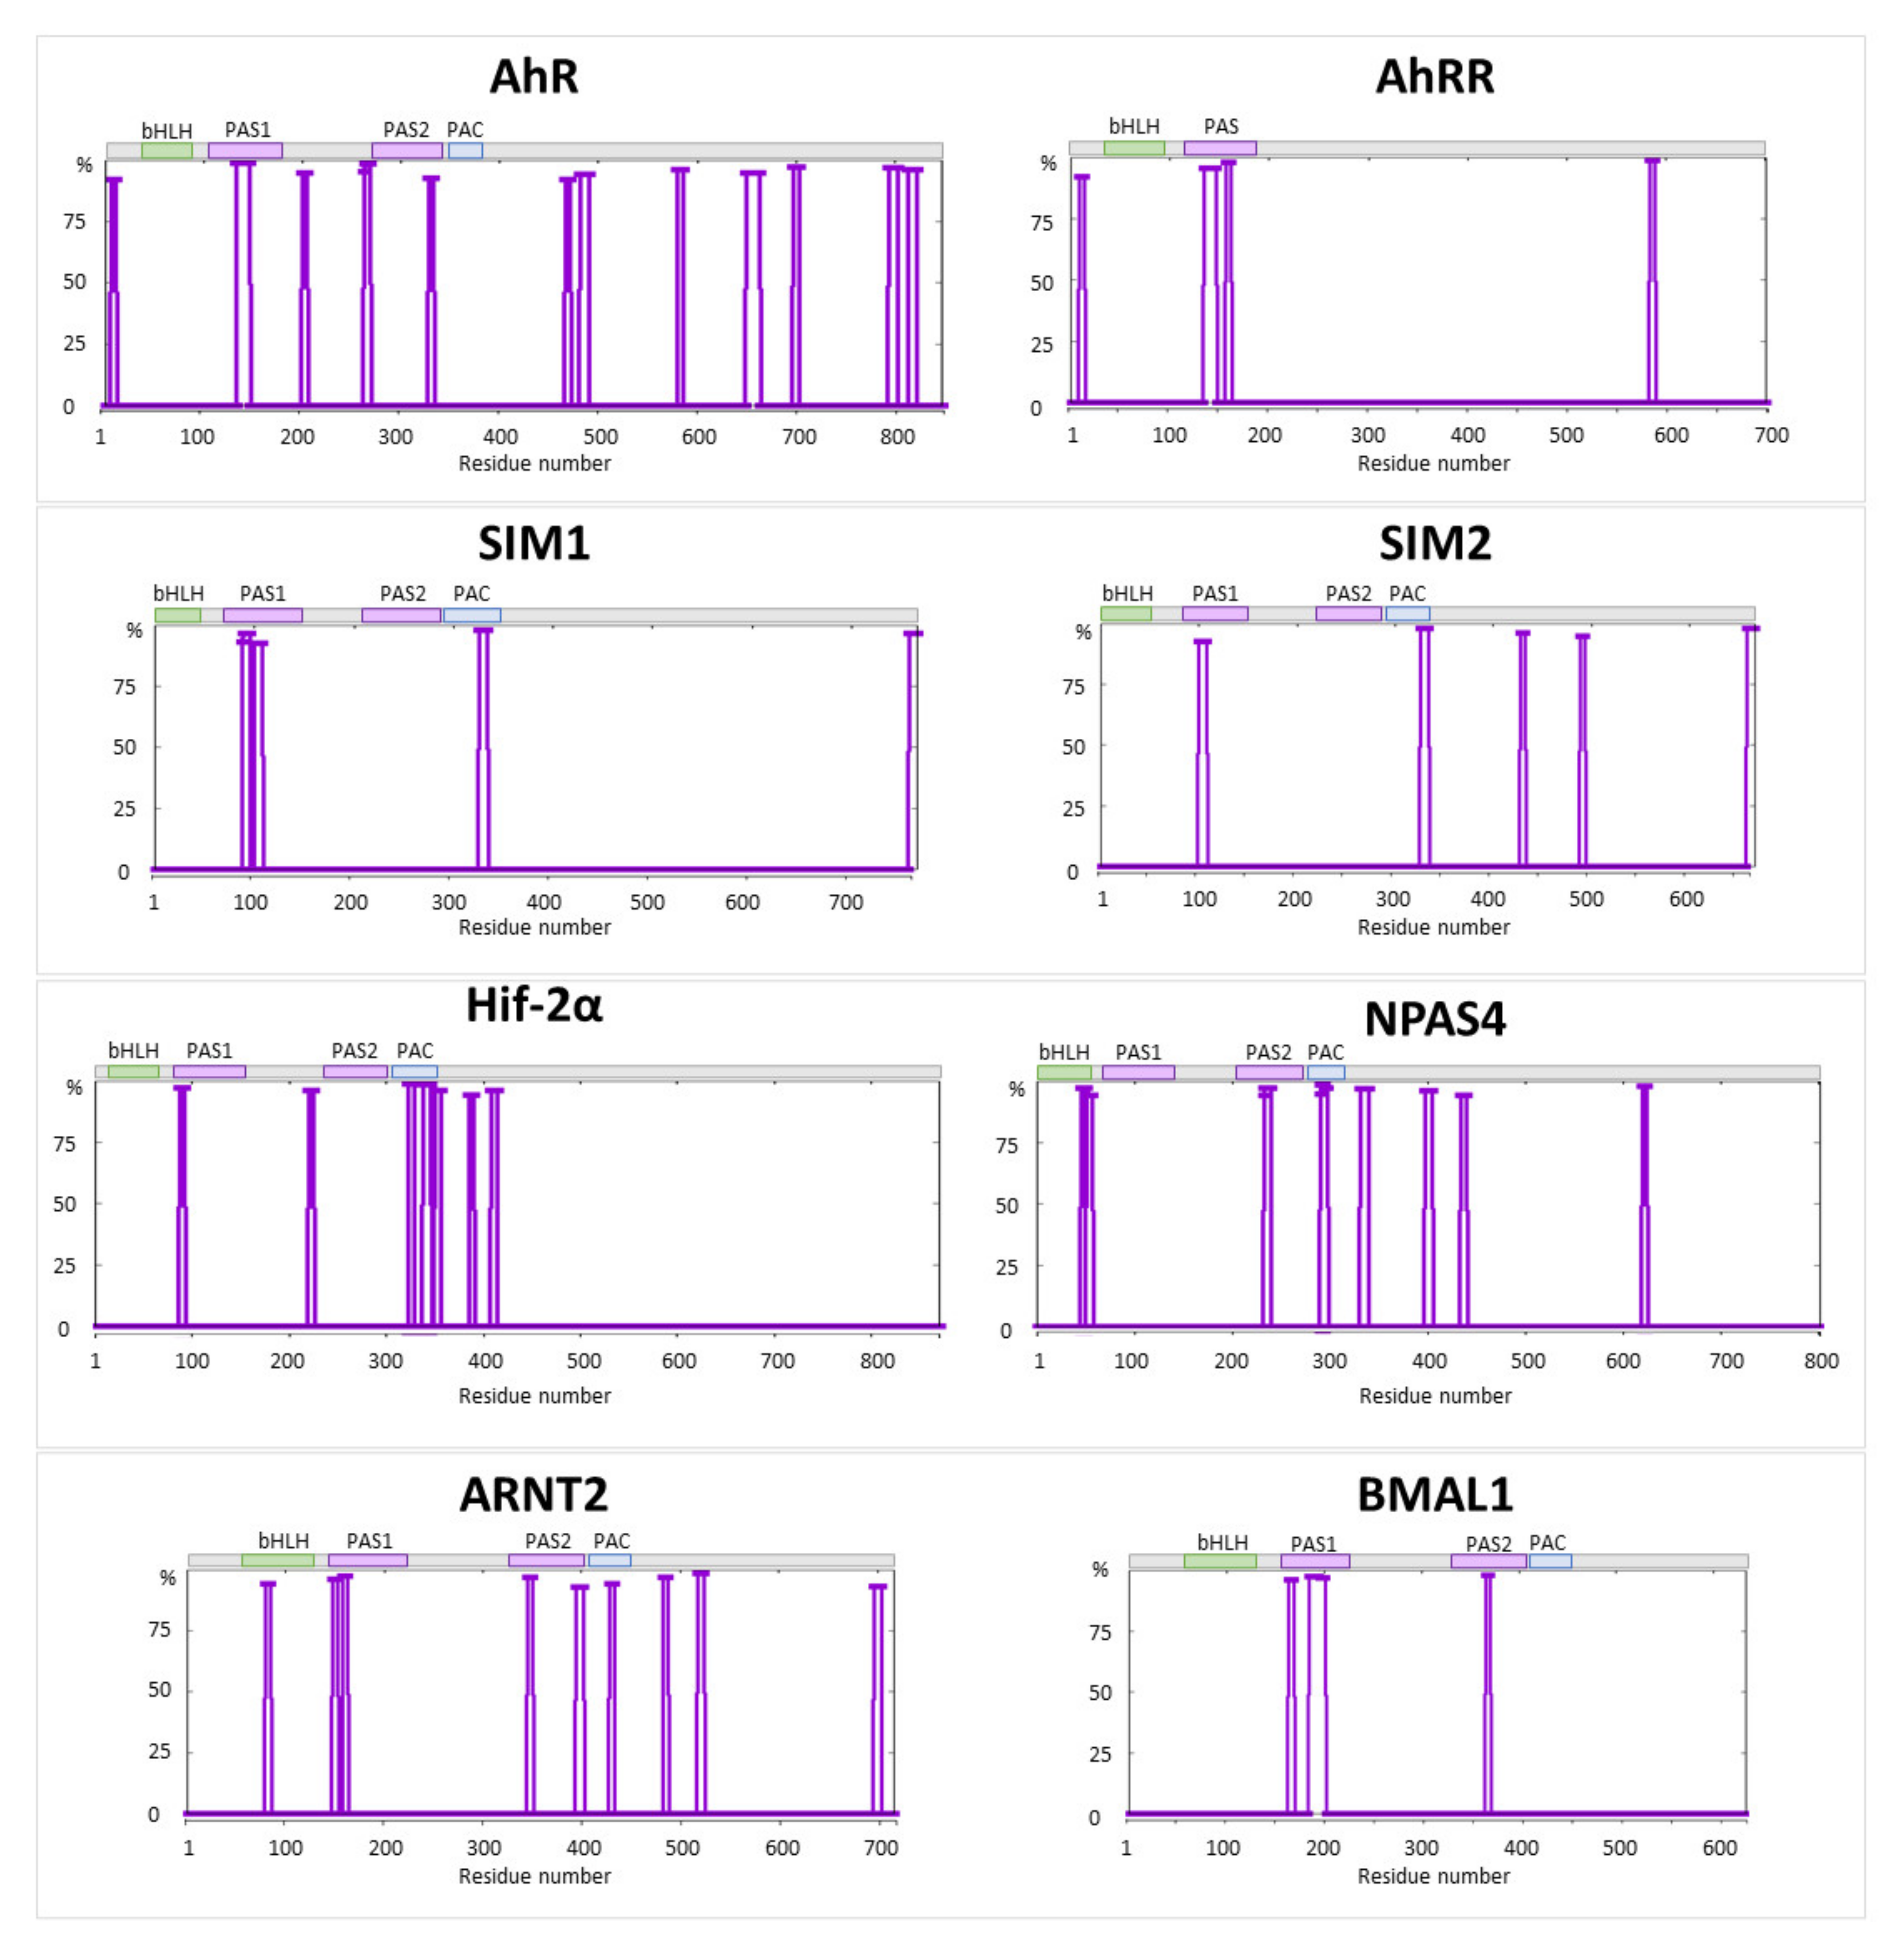
2.1. AhR and AhRR

2.2. SIM1 and SIM2

2.3. Hif-2α
2.4. NPAS4
2.5. ARNT2 and BMAL1

3. Discussion
4. Materials and Methods
5. Conclusions
Supplementary Materials
Author Contributions
Funding
Conflicts of Interest
References
- Crews, S.T. Control of cell lineage-specific development and transcription by bHLH-PAS proteins. Genes Dev. 1998, 12, 607–620. [Google Scholar] [CrossRef] [PubMed] [Green Version]
- Petrulis, J.R.; Kusnadi, A.; Ramadoss, P.; Hollingshead, B.; Perdew, G.H. The hsp90 Co-chaperone XAP2 Alters Importin β Recognition of the Bipartite Nuclear Localization Signal of the Ah Receptor and Represses Transcriptional Activity. J. Biol. Chem. 2003, 278, 2677–2685. [Google Scholar] [CrossRef] [Green Version]
- Gustafson, C.L.; Partch, C.L. Emerging Models for the Molecular Basis of Mammalian Circadian Timing. Biochemistry 2015, 54, 134–149. [Google Scholar] [CrossRef] [PubMed]
- Lee, J.-W.; Bae, S.-H.; Jeong, J.-W.; Kim, S.-H.; Kim, K.-W. Hypoxia-inducible factor (HIF-1)α: Its protein stability and biological functions. Exp. Mol. Med. 2004, 36, 1–12. [Google Scholar] [CrossRef] [PubMed]
- Ema, M.; Hirota, K.; Mimura, J.; Abe, H.; Yodoi, J.; Sogawa, K.; Poellinger, L.; Fujii-Kuriyama, Y. Molecular mechanisms of transcription activation by HLF and HIF1alpha in response to hypoxia: Their stabilization and redox signal-induced interaction with CBP/p300. EMBO J. 1999, 18, 1905–1914. [Google Scholar] [CrossRef] [Green Version]
- Fribourgh, J.L.; Partch, C.L. Assembly and function of bHLH-PAS complexes. Proc. Natl. Acad. Sci. USA 2017, 114, 5330–5332. [Google Scholar] [CrossRef] [Green Version]
- Michael, A.K.; Partch, C.L. bHLH-PAS proteins: Functional specification through modular domain architecture. OA Biochem. 2013, 1, 16. [Google Scholar] [CrossRef] [Green Version]
- Li, X.; Duan, X.; Jiang, H.; Sun, Y.; Tang, Y.; Yuan, Z.; Guo, J.; Liang, W.; Chen, L.; Yin, J.; et al. Genome-Wide Analysis of Basic/Helix-Loop-Helix Transcription Factor Family in Rice and Arabidopsis. Plant Physiol. 2006, 141, 1167–1184. [Google Scholar] [CrossRef] [PubMed] [Green Version]
- Jones, S. An overview of the basic helix-loop-helix proteins. Genome Biol. 2004, 5, 226. [Google Scholar] [CrossRef] [Green Version]
- Ponting, C.P.; Aravind, L. PAS: A multifunctional domain family comes to light. Curr. Biol. 1997, 7, R674–R677. [Google Scholar] [CrossRef] [Green Version]
- Henry, J.T.; Crosson, S. Ligand-binding PAS domains in a genomic, cellular, and structural context. Annu. Rev. Microbiol. 2011, 65, 261–286. [Google Scholar] [CrossRef] [PubMed] [Green Version]
- Kewley, R.J.; Whitelaw, M.L.; Chapman-Smith, A. The mammalian basic helix–loop–helix/PAS family of transcriptional regulators. Int. J. Biochem. Cell Biol. 2004, 36, 189–204. [Google Scholar] [CrossRef]
- Wu, D.; Rastinejad, F. Structural characterization of mammalian bHLH-PAS transcription factors. Curr. Opin. Struct. Biol. 2017, 43, 1–9. [Google Scholar] [CrossRef] [Green Version]
- Partch, C.L.; Gardner, K.H. Coactivator recruitment: A new role for PAS domains in transcriptional regulation by the bHLH-PAS family. J. Cell. Physiol. 2010, 223, 553–557. [Google Scholar] [CrossRef] [PubMed] [Green Version]
- Kolonko, M.; Greb-Markiewicz, B. bHLH–PAS Proteins: Their Structure and Intrinsic Disorder. Int. J. Mol. Sci. 2019, 20, 3653. [Google Scholar] [CrossRef] [PubMed] [Green Version]
- Uversky, V.N. Intrinsically disordered proteins in overcrowded milieu: Membrane-less organelles, phase separation, and intrinsic disorder. Curr. Opin. Struct. Biol. 2017, 44, 18–30. [Google Scholar] [CrossRef] [PubMed]
- Mirsky, A.E.; Pauling, L. On the Structure of Native, Denatured, and Coagulated Proteins. Proc. Natl. Acad. Sci. USA 1936, 22, 439–447. [Google Scholar] [CrossRef] [Green Version]
- Uversky, V.N. The Mysterious Unfoldome: Structureless, Underappreciated, Yet Vital Part of Any Given Proteome. J. Biomed. Biotechnol. 2010, 2010, 1–14. [Google Scholar] [CrossRef]
- Tompa, P. Intrinsically unstructured proteins. Trends Biochem. Sci. 2002, 27, 527–533. [Google Scholar] [CrossRef]
- Uversky, V.N.; Gillespie, J.R.; Fink, A.L. Why are “natively unfolded” proteins unstructured under physiologic conditions? Proteins 2000, 41, 415–427. [Google Scholar] [CrossRef]
- Yruela, I.; Oldfield, C.J.; Niklas, K.J.; Dunker, A.K. Evidence for a strong correlation between transcription factor protein disorder and organismic complexity. Genome Biol. Evol. 2017, 9, 1248–1265. [Google Scholar] [CrossRef]
- Uversky, V.N. Natively unfolded proteins: A point where biology waits for physics. Protein Sci. 2002, 11, 739–756. [Google Scholar] [CrossRef] [Green Version]
- Hu, G.; Wu, Z.; Uversky, V.N.; Kurgan, L. Functional analysis of human hub proteins and their interactors involved in the intrinsic disorder-enriched interactions. Int. J. Mol. Sci. 2017, 18, 1–40. [Google Scholar] [CrossRef] [Green Version]
- Vacic, V.; Oldfield, C.J.; Mohan, A.; Radivojac, P.; Cortese, M.S.; Uversky, V.N.; Dunker, A.K. Characterization of Molecular Recognition Features, MoRFs, and Their Binding Partners. J. Proteome Res. 2007, 6, 2351–2366. [Google Scholar] [CrossRef] [PubMed] [Green Version]
- Wright, P.E.; Dyson, H.J. Intrinsically disordered proteins in cellular signalling and regulation. Nat. Rev. Mol. Cell Biol. 2014, 16, 18–29. [Google Scholar] [CrossRef] [PubMed]
- Alberti, S.; Gladfelter, A.; Mittag, T. Considerations and Challenges in Studying Liquid-Liquid Phase Separation and Biomolecular Condensates. Cell 2019, 176, 419–434. [Google Scholar] [CrossRef] [PubMed] [Green Version]
- Mitrea, D.M.; Kriwacki, R.W. Phase separation in biology; functional organization of a higher order. Cell Commun. Signal. 2016, 14, 1. [Google Scholar] [CrossRef] [PubMed] [Green Version]
- Bugge, K.; Brakti, I.; Fernandes, C.B.; Dreier, J.E.; Lundsgaard, J.E.; Olsen, J.G.; Skriver, K.; Kragelund, B.B. Interactions by Disorder—A Matter of Context. Front. Mol. Biosci. 2020, 7, 1–16. [Google Scholar] [CrossRef]
- Yoo, H.; Triandafillou, C.; Drummond, D.A. Cellular sensing by phase separation: Using the process, not just the products. J. Biol. Chem. 2019, 294, 7151–7159. [Google Scholar] [CrossRef] [PubMed] [Green Version]
- Uversky, V.N. Supramolecular fuzziness of intracellular liquid droplets: Liquid–liquid phase transitions, membrane-less organelles, and intrinsic disorder. Molecules 2019, 24, 3265. [Google Scholar] [CrossRef] [PubMed] [Green Version]
- Tarczewska, A.; Greb-Markiewicz, B. The Significance of the Intrinsically Disordered Regions for the Functions of the bHLH Transcription Factors. Int. J. Mol. Sci. 2019, 20, 5306. [Google Scholar] [CrossRef] [PubMed] [Green Version]
- Boija, A.; Klein, I.A.; Sabari, B.R.; Dall’Agnese, A.; Coffey, E.L.; Zamudio, A.V.; Li, C.H.; Shrinivas, K.; Manteiga, J.C.; Hannett, N.M.; et al. Transcription Factors Activate Genes through the Phase-Separation Capacity of Their Activation Domains. Cell 2018, 175, 1842–1855.e16. [Google Scholar] [CrossRef] [PubMed] [Green Version]
- Lee, Y.; Lee, J.; Kwon, I.; Nakajima, Y.; Ohmiya, Y.; Son, G.H.; Lee, K.H.; Kim, K. Coactivation of the CLOCK-BMAL1 complex by CBP mediates resetting of the circadian clock. J. Cell Sci. 2010, 123, 3547–3557. [Google Scholar] [CrossRef] [PubMed] [Green Version]
- Uyar, B.; Weatheritt, R.J.; Dinkel, H.; Davey, N.E.; Gibson, T.J. Proteome-wide analysis of human disease mutations in short linear motifs: Neglected players in cancer? Mol. Biosyst. 2014, 10, 2626–2642. [Google Scholar] [CrossRef] [PubMed] [Green Version]
- Brangwynne, C.P.; Tompa, P.; Pappu, R.V. Polymer physics of intracellular phase transitions. Nat. Phys. 2015. [Google Scholar] [CrossRef]
- Banani, S.F.; Rice, A.M.; Peeples, W.B.; Lin, Y.; Jain, S.; Parker, R.; Rosen, M.K. Compositional Control of Phase-Separated Cellular Bodies. Cell 2016, 166, 651–663. [Google Scholar] [CrossRef] [Green Version]
- Zhao, H.; Chen, L.; Yang, T.; Feng, Y.L.; Vaziri, N.D.; Liu, B.L.; Liu, Q.Q.; Guo, Y.; Zhao, Y.Y. Aryl hydrocarbon receptor activation mediates kidney disease and renal cell carcinoma. J. Transl. Med. 2019, 17, 1–14. [Google Scholar] [CrossRef] [PubMed]
- Ikuta, T.; Namiki, T.; Fujii-Kuriyama, Y.; Kawajiri, K. AhR protein trafficking and function in the skin. Biochem. Pharmacol. 2009, 77, 588–596. [Google Scholar] [CrossRef] [PubMed]
- Neavin, D.; Liu, D.; Ray, B.; Weinshilboum, R. The Role of the Aryl Hydrocarbon Receptor (AHR) in Immune and Inflammatory Diseases. Int. J. Mol. Sci. 2018, 19, 3851. [Google Scholar] [CrossRef] [PubMed] [Green Version]
- Xue, P.; Fu, J.; Zhou, Y. The Aryl Hydrocarbon Receptor and Tumor Immunity. Front. Immunol. 2018, 9, 286. [Google Scholar] [CrossRef] [Green Version]
- Perepechaeva, M.L.; Grishanova, A.Y. The role of aryl hydrocarbon receptor (AHR) in brain tumors. Int. J. Mol. Sci. 2020, 21, 2863. [Google Scholar] [CrossRef] [PubMed] [Green Version]
- Ohtake, F.; Takeyama, K.; Matsumoto, T.; Kitagawa, H.; Yamamoto, Y.; Nohara, K.; Tohyama, C.; Krust, A.; Mimura, J.; Chambon, P.; et al. Modulation of oestrogen receptor signalling by association with the activated dioxin receptor. Nature 2003, 423, 545–550. [Google Scholar] [CrossRef] [PubMed]
- Guarnieri, T. Aryl hydrocarbon receptor connects inflammation to breast cancer. Int. J. Mol. Sci. 2020, 21, 5264. [Google Scholar] [CrossRef] [PubMed]
- Hahn, M.E.; Allan, L.L.; Sherr, D.H. Regulation of constitutive and inducible AHR signaling: Complex interactions involving the AHR repressor. Biochem. Pharmacol. 2009, 77, 485–497. [Google Scholar] [CrossRef] [PubMed] [Green Version]
- Larigot, L.; Juricek, L.; Dairou, J.; Coumoul, X. AhR signaling pathways and regulatory functions. Biochim. Open 2018, 7, 1–9. [Google Scholar] [CrossRef] [PubMed]
- Zudaire, E.; Cuesta, N.; Murty, V.; Woodson, K.; Adams, L.; Gonzalez, N.; Martínez, A.; Narayan, G.; Kirsch, I.; Franklin, W.; et al. The aryl hydrocarbon receptor repressor is a putative tumor suppressor gene in multiple human cancers. J. Clin. Investig. 2008, 118, 640–650. [Google Scholar] [CrossRef] [PubMed]
- Kim, S.H.; Choi, Y.M.; Lee, G.H.; Hong, M.A.; Lee, K.S.; Lee, B.S.; Kim, J.G.; Moon, S.Y. Association between susceptibility to advanced stage endometriosis and the genetic polymorphisms of aryl hydrocarbon receptor repressor and glutathione-S-transferase T1 genes. Hum. Reprod. 2007, 22, 1866–1870. [Google Scholar] [CrossRef] [PubMed] [Green Version]
- Tsuchiya, M.; Katoh, T.; Motoyama, H.; Sasaki, H.; Tsugane, S.; Ikenoue, T. Analysis of the AhR, ARNT, and AhRR gene polymorphisms: Genetic contribution to endometriosis susceptibility and severity. Fertil. Steril. 2005, 84, 454–458. [Google Scholar] [CrossRef] [PubMed]
- Vogel, C.F.A.; Haarmann-stemmann, T. ScienceDirect Toxicology The aryl hydrocarbon receptor repressor—More than a simple feedback inhibitor of AhR signaling: Clues for its role in inflammation and cancer. Curr. Opin. Toxicol. 2017, 2, 109–119. [Google Scholar] [CrossRef] [PubMed] [Green Version]
- Woods, S.L.; Whitelaw, M.L. Differential Activities of Murine Single Minded 1 (SIM1) and SIM2 on a Hypoxic Response Element. J. Biol. Chem. 2002, 277, 10236–10243. [Google Scholar] [CrossRef] [Green Version]
- Moffett, P.; Reece, M.; Pelletier, J. The murine Sim-2 gene product inhibits transcription by active repression and functional interference. Mol. Cell. Biol. 1997, 17, 4933–4947. [Google Scholar] [CrossRef] [PubMed] [Green Version]
- Moffett, P.; Pelletier, J. Different transcriptional properties of mSim-1 and mSim-2. FEBS Lett. 2000, 466, 80–86. [Google Scholar] [CrossRef] [Green Version]
- Blackburn, P.R.; Sullivan, A.E.; Gerassimou, A.G.; Kleinendorst, L.; Bersten, D.C.; Cooiman, M.; Harris, K.G.; Wierenga, K.J.; Klee, E.W.; van Gerpen, J.A.; et al. Functional Analysis of the SIM1 Variant p.G715V in 2 Patients With Obesity. J. Clin. Endocrinol. Metab. 2020, 105. [Google Scholar] [CrossRef] [PubMed]
- Holder, J.L.; Butte, N.F.; Zinn, A.R. Profound obesity associated with a balanced translocation that disrupts the SIM1 gene. Hum. Mol. Genet. 2000, 9, 101–108. [Google Scholar] [PubMed]
- Michaud, J.L.; Boucher, F.; Melnyk, A.; Gauthier, F.; Goshu, E.; Lévy, E.; Mitchell, G.A.; Himms-Hagen, J.; Fan, C.M. Sim1 haploinsufficiency causes hyperphagia, obesity and reduction of the paraventricular nucleus of the hypothalamus. Hum. Mol. Genet. 2001, 10, 1465–1473. [Google Scholar] [CrossRef]
- Bonnefond, A.; Raimondo, A.; Stutzmann, F.; Ghoussaini, M.; Ramachandrappa, S.; Bersten, D.C.; Durand, E.; Vatin, V.; Balkau, B.; Lantieri, O.; et al. Loss-of-function mutations in SIM1 contribute to obesity and Prader-Willi-like features. J. Clin. Investig. 2013, 123, 3037–3041. [Google Scholar] [CrossRef] [PubMed] [Green Version]
- Kublaoui, B.M.; Holder, J.L.; Tolson, K.P.; Gemelli, T.; Zinn, A.R. SIM1 Overexpression Partially Rescues Agouti Yellow and Diet-Induced Obesity by Normalizing Food Intake. Endocrinology 2006, 147, 4542–4549. [Google Scholar] [CrossRef] [PubMed]
- Yang, C.; Gagnon, D.; Vachon, P.; Tremblay, A.; Levy, E.; Massie, B.; Michaud, J.L. Adenoviral-mediated modulation of Sim1 expression in the paraventricular nucleus affects food intake. J. Neurosci. 2006, 26, 7116–7120. [Google Scholar] [CrossRef] [PubMed]
- Camuzi, D.; de Amorim, Í.S.S.; Ribeiro Pinto, L.F.; Oliveira Trivilin, L.; Mencalha, A.L.; Soares Lima, S.C. Regulation Is in the Air: The Relationship between Hypoxia and Epigenetics in Cancer. Cells 2019, 8, 300. [Google Scholar] [CrossRef] [PubMed] [Green Version]
- Tian, H.; McKnight, S.L.; Russell, D.W. Endothelial PAS domain protein 1 (EPAS1), a transcription factor selectively expressed in endothelial cells. Genes Dev. 1997, 11, 72–82. [Google Scholar] [CrossRef] [Green Version]
- Wu, D.; Potluri, N.; Lu, J.; Kim, Y.; Rastinejad, F. Structural integration in hypoxia-inducible factors. Nature 2015, 524, 303–308. [Google Scholar] [CrossRef] [PubMed]
- Chen, J.W.; Romero, P.; Uversky, V.N.; Dunker, A.K. Conservation of intrinsic disorder in protein domains and families: I. A database of conserved predicted disordered regions. J. Proteome Res. 2006, 5, 879–887. [Google Scholar] [CrossRef] [Green Version]
- Percy, M.J. A Gain-of-Function Mutation in the HIF2A Gene in Familial Erythrocytosis. Engl. J. Med. 2008, 23, 1–7. [Google Scholar]
- Taylor, S.E.; Bagnall, J.; Mason, D.; Levy, R.; Fernig, D.G.; See, V. Differential sub-nuclear distribution of hypoxia-inducible factors (HIF)-1 and -2 alpha impacts on their stability and mobility. Open Biol. 2016, 6, 160195. [Google Scholar] [CrossRef] [Green Version]
- Gkotinakou, I.-M.; Befani, C.; Simos, G.; Liakos, P. ERK1/2 phosphorylates HIF-2α and regulates its activity by controlling its CRM1-dependent nuclear shuttling. J. Cell Sci. 2019, 132, jcs225698. [Google Scholar] [CrossRef] [PubMed] [Green Version]
- Smythies, J.A.; Sun, M.; Masson, N.; Salama, R.; Simpson, P.D.; Murray, E.; Neumann, V.; Cockman, M.E.; Choudhry, H.; Ratcliffe, P.J.; et al. Inherent DNA-binding specificities of the HIF-1α and HIF-2α transcription factors in chromatin. EMBO Rep. 2019, 20, e46401. [Google Scholar] [CrossRef] [PubMed]
- Hussein, K.; Percy, M.; McMullin, M.F. Clinical utility gene card for: Familial erythrocytosis. Eur. J. Hum. Genet. 2012, 20, 593. [Google Scholar] [CrossRef] [PubMed] [Green Version]
- Ooe, N.; Saito, K.; Mikami, N.; Nakatuka, I.; Kaneko, H. Identification of a Novel Basic Helix-Loop-Helix-PAS Factor, NXF, Reveals a Sim2 Competitive, Positive Regulatory Role in Dendritic-Cytoskeleton Modulator Drebrin Gene Expression. Mol. Cell. Biol. 2003, 24, 608–616. [Google Scholar] [CrossRef] [PubMed] [Green Version]
- Sabatini, P.V.; Krentz, N.A.J.; Zarrouki, B.; Westwell-Roper, C.Y.; Nian, C.; Uy, R.A.; Shapiro, A.M.J.; Poitout, V.; Lynn, F.C. Npas4 Is a novel activity-Regulated cytoprotective factor in pancreatic β-Cells. Diabetes 2013, 62, 2808–2820. [Google Scholar] [CrossRef] [PubMed] [Green Version]
- Sabatini, P.V.; Lynn, F.C. All-encomPASsing regulation of β-cells: PAS domain proteins in β-cell dysfunction and diabetes. Trends Endocrinol. Metab. 2015, 26, 49–57. [Google Scholar] [CrossRef] [PubMed]
- Furukawa-Hibi, Y.; Yun, J.; Nagai, T.; Yamada, K. Transcriptional suppression of the neuronal PAS domain 4 (Npas4) gene by stress via the binding of agonist-bound glucocorticoid receptor to its promoter. J. Neurochem. 2012, 123, 866–875. [Google Scholar] [CrossRef] [PubMed]
- Wang, D.; Ren, M.; Guo, J.; Yang, G.; Long, X.; Hu, R.; Shen, W.; Wang, X.; Zeng, K.; Chapouthier, G. The inhibitory effects of Npas4 on seizures in pilocarpine-induced epileptic rats. PLoS ONE 2014, 9, e115801. [Google Scholar] [CrossRef]
- Choy, F.C.; Klarić, T.S.; Koblar, S.A.; Lewis, M.D. The Role of the Neuroprotective Factor Npas4 in Cerebral Ischemia. Int. J. Mol. Sci. 2015, 16, 29011–29028. [Google Scholar] [CrossRef] [PubMed] [Green Version]
- Choy, F.C.; Klarić, T.S.; Leong, W.K.; Koblar, S.A.; Lewis, M.D. Reduction of the neuroprotective transcription factor Npas4 results in increased neuronal necrosis, inflammation and brain lesion size following ischaemia. J. Cereb. Blood Flow Metab. 2016, 36, 1449–1463. [Google Scholar] [CrossRef] [PubMed] [Green Version]
- Ramamoorthi, K.; Fropf, R.; Belfort, G.M.; Fitzmaurice, H.L.; McKinney, R.M.; Neve, R.L.; Otto, T.; Lin, Y. Npas4 Regulates a Transcriptional Program in CA3 Required for Contextual Memory Formation. Science 2011, 334, 1669–1675. [Google Scholar] [CrossRef] [Green Version]
- Ploski, J.E.; Monsey, M.S.; Nguyen, T.; DiLeone, R.J.; Schafe, G.E. The Neuronal PAS Domain Protein 4 (Npas4) Is Required for New and Reactivated Fear Memories. PLoS ONE 2011, 6, e23760. [Google Scholar] [CrossRef] [PubMed] [Green Version]
- Fan, W.; Long, Y.; Lai, Y.; Wang, X.; Chen, G.; Zhu, B. NPAS4 Facilitates the Autophagic Clearance of Endogenous Tau in Rat Cortical Neurons. J. Mol. Neurosci. 2016, 58, 401–410. [Google Scholar] [CrossRef]
- Esser, J.S.; Charlet, A.; Schmidt, M.; Heck, S.; Allen, A.; Lother, A.; Epting, D.; Patterson, C.; Bode, C.; Moser, M. The neuronal transcription factor NPAS4 is a strong inducer of sprouting angiogenesis and tip cell formation. Cardiovasc. Res. 2017, 113, 222–223. [Google Scholar] [CrossRef] [PubMed]
- Gerhard, D.S.; Wagner, L.; Feingold, E.A.; Shenmen, C.M.; Grouse, L.H.; Schuler, G.; Klein, S.L.; Old, S.; Rasooly, R.; Good, P. The status, quality, and expansion of the NIH full-length cDNA project. Genome Res. 2004, 14, 2121–2127. [Google Scholar] [PubMed] [Green Version]
- Ooe, N.; Saito, K.; Kaneko, H. Characterization of functional heterodimer partners in brain for a bHLH-PAS factor NXF. Biochim. Biophys. Acta 2009, 1789, 192–197. [Google Scholar] [CrossRef] [PubMed]
- Sullivan, A.E.; Peet, D.J.; Whitelaw, M.L. MAGED1 is a novel regulator of a select subset of bHLH PAS transcription factors. FEBS J. 2016, 283, 3488–3502. [Google Scholar] [CrossRef] [PubMed]
- Shepard, R.; Heslin, K.; Hagerdorn, P.; Coutellier, L. Downregulation of Npas4 in parvalbumin interneurons and cognitive deficits after neonatal NMDA receptor blockade: Relevance for schizophrenia. Transl. Psychiatry 2019, 9. [Google Scholar] [CrossRef] [PubMed] [Green Version]
- Michaud, J.L.; Derossi, C.; May, N.R.; Holdener, B.C.; Fan, C.M. ARNT2 acts as the dimerization partner of SIM1 for the development of the hypothalamus. Mech. Dev. 2000, 90, 253–261. [Google Scholar] [CrossRef]
- Sharma, N.; Pollina, E.A.; Nagy, M.A.; Yap, E.L.; DiBiase, F.A.; Hrvatin, S.; Hu, L.; Lin, C.; Greenberg, M.E. ARNT2 Tunes Activity-Dependent Gene Expression through NCoR2-Mediated Repression and NPAS4-Mediated Activation. Neuron 2019, 102, 390–406.e9. [Google Scholar] [CrossRef] [Green Version]
- Okur, Z.; Scheiffele, P. The Yin and Yang of Arnt2 in Activity-Dependent Transcription. Neuron 2019, 102, 270–272. [Google Scholar] [CrossRef] [PubMed] [Green Version]
- Dougherty, E.J.; Pollenz, R.S. 2.13 ARNT: A Key bHLH/PAS Regulatory Protein across Multiple Pathways. In Comprehensive Toxicology; Elsevier: Amsterdam, The Netherlands, 2010. [Google Scholar]
- Aitola, M.H.; Pelto-Huikko, M.T. Expression of Arnt and Arnt2 mRNA in developing murine tissues. J. Histochem. Cytochem. 2003, 51, 41–54. [Google Scholar] [CrossRef] [Green Version]
- Hirose, K.; Morita, M.; Ema, M.; Mimura, J.; Hamada, H.; Fujii, H.; Saijo, Y.; Gotoh, O.; Sogawa, K.; Fujii-Kuriyama, Y. cDNA cloning and tissue-specific expression of a novel basic helix-loop-helix/PAS factor (Arnt2) with close sequence similarity to the aryl hydrocarbon receptor nuclear translocator (Arnt). Mol. Cell. Biol. 1996, 16, 1706–1713. [Google Scholar] [CrossRef] [PubMed] [Green Version]
- Webb, E.A.; Almutair, A.; Kelberman, D.; Bacchelli, C.; Chanudet, E.; Lescai, F.; Andoniadou, C.L.; Banyan, A.; Alsawaid, A.; Alrifai, M.T.; et al. ARNT2 mutation causes hypopituitarism, post-natal microcephaly, visual and renal anomalies. Brain 2013, 136, 3096–3105. [Google Scholar] [CrossRef] [Green Version]
- Woods, C.G. Human microcephaly. Curr. Opin. Neurobiol. 2004, 14, 112–117.e7. [Google Scholar] [CrossRef] [PubMed]
- Turer, E.E.; Miguel, M.S.; Wang, K.-w.; McAlpine, W.; Ou, F.; Li, X.; Tang, M.; Zang, Z.; Wang, J.; Hayse, B.; et al. A viable hypomorphic Arnt2 mutation causes hyperphagic obesity, diabetes and hepatic steatosis. DMM Dis. Model. Mech. 2018, 11. [Google Scholar] [CrossRef] [PubMed] [Green Version]
- Bogeas, A.; Morvan-Dubois, G.; El-Habr, E.A.; Lejeune, F.X.; Defrance, M.; Narayanan, A.; Kuranda, K.; Burel-Vandenbos, F.; Sayd, S.; Delaunay, V.; et al. Changes in chromatin state reveal ARNT2 at a node of a tumorigenic transcription factor signature driving glioblastoma cell aggressiveness. Acta Neuropathol. 2018, 135, 267–283. [Google Scholar] [CrossRef] [PubMed] [Green Version]
- Koike, N.; Yoo, S.H.; Huang, H.C.; Kumar, V.; Lee, C.; Kim, T.K.; Takahashi, J.S. Transcriptional architecture and chromatin landscape of the core circadian clock in mammals. Science 2012, 338, 349–354. [Google Scholar] [CrossRef] [PubMed] [Green Version]
- Gustafson, C.L.; Parsley, N.C.; Asimgil, H.; Lee, H.W.; Ahlbach, C.; Michael, A.K.; Xu, H.; Williams, O.L.; Davis, T.L.; Liu, A.C.; et al. A Slow Conformational Switch in the BMAL1 Transactivation Domain Modulates Circadian Rhythms. Mol. Cell 2017, 66, 447–457. [Google Scholar] [CrossRef] [PubMed] [Green Version]
- Zheng, X.; Zhao, X.; Zhang, Y.; Tan, H.; Qiu, B.; Ma, T.; Zeng, J.; Tao, D.; Liu, Y.; Lu, Y.; et al. RAE1 promotes BMAL1 shuttling and regulates degradation and activity of CLOCK: BMAL1 heterodimer. Cell Death Dis. 2019, 10. [Google Scholar] [CrossRef]
- Tamaru, T.; Hirayama, J.; Isojima, Y.; Nagai, K.; Norioka, S.; Takamatsu, K.; Sassone-Corsi, P. CK2α phosphorylates BMAL1 to regulate the mammalian clock. Nat. Struct. Mol. Biol. 2009, 16, 446–448. [Google Scholar] [CrossRef] [PubMed]
- Lipton, J.O.; Yuan, E.D.; Boyle, L.M.; Ebrahimi-Fakhari, D.; Kwiatkowski, E.; Nathan, A.; Güttler, T.; Davis, F.; Asara, J.M.; Sahin, M. The Circadian Protein BMAL1 Regulates Translation in Response to S6K1-Mediated Phosphorylation. Cell 2015, 161, 1138–1151. [Google Scholar] [CrossRef] [PubMed] [Green Version]
- Geyfman, M.; Kumar, V.; Liu, Q.; Ruiz, R.; Gordon, W.; Espitia, F.; Cam, E.; Millar, S.E.; Smyth, P.; Ihler, A.; et al. Brain and muscle Arnt-like protein-1 (BMAL1) controls circadian cell proliferation and susceptibility to UVB-induced DNA damage in the epidermis. Proc. Natl. Acad. Sci. USA 2012, 109, 11758–11763. [Google Scholar] [CrossRef] [PubMed] [Green Version]
- Hornbeck, P.V.; Zhang, B.; Murray, B.; Kornhauser, J.M.; Latham, V.; Skrzypek, E. PhosphoSitePlus, 2014: Mutations, PTMs and recalibrations. Nucleic Acids Res. 2015, 43, D512–D520. [Google Scholar] [CrossRef] [Green Version]
- Dosztányi, Z.; Mészáros, B.; Simon, I. ANCHOR: Web server for predicting protein binding regions in disordered proteins. Bioinformatics 2009, 25, 2745–2746. [Google Scholar] [CrossRef] [Green Version]
- Ganesan, K.; Kulandaisamy, A.; Binny Priya, S.; Michael Gromiha, M. HuVarbase: A human variant database with comprehensive information at gene and protein levels. PLoS ONE 2019, 14, e0210475. [Google Scholar] [CrossRef] [PubMed] [Green Version]
- Bolognesi, B.; Gotor, N.L.; Dhar, R.; Cirillo, D.; Baldrighi, M.; Tartaglia, G.G.; Lehner, B. A concentration-dependent liquid phase separation can cause toxicity upon increased protein expression. Cell Rep. 2016, 16, 222–231. [Google Scholar] [CrossRef] [PubMed] [Green Version]
- Vernon, R.M.; Chong, P.A.; Tsang, B.; Kim, T.H.; Bah, A.; Farber, P.; Lin, H.; Forman-Kay, J.D. Pi-Pi contacts are an overlooked protein feature relevant to phase separation. eLife 2018, 7. [Google Scholar] [CrossRef] [PubMed]
- Mohan, A.; Oldfield, C.J.; Radivojac, P.; Vacic, V.; Cortese, M.S.; Dunker, A.K.; Uversky, V.N. Analysis of Molecular Recognition Features (MoRFs). J. Mol. Biol. 2006, 362, 1043–1059. [Google Scholar] [CrossRef] [PubMed]
- Blom, N.; Gammeltoft, S.; Brunak, S. Sequence and structure-based prediction of eukaryotic protein phosphorylation sites. J. Mol. Biol. 1999, 294, 1351–1362. [Google Scholar] [CrossRef] [PubMed]
- Fowler, T.; Sen, R.; Roy, A.L. Regulation of primary response genes. Mol. Cell 2011, 44, 348–360. [Google Scholar] [CrossRef] [PubMed] [Green Version]
- Greenberg, M.E.; Hermanowski, A.L.; Ziff, E.B. Effect of protein synthesis inhibitors on growth factor activation of c-fos, c-myc, and actin gene transcription. Mol. Cell. Biol. 1986, 6, 1050–1057. [Google Scholar] [CrossRef] [PubMed] [Green Version]
- Hirayama, J.; Sahar, S.; Grimaldi, B.; Tamaru, T.; Takamatsu, K.; Nakahata, Y.; Sassone-Corsi, P. CLOCK-mediated acetylation of BMAL1 controls circadian function. Nature 2007, 450, 1086–1090. [Google Scholar] [CrossRef] [PubMed]
- Louros, N.; Konstantoulea, K.; De Vleeschouwer, M.; Ramakers, M.; Schymkowitz, J.; Rousseau, F. WALTZ-DB 2.0: An updated database containing structural information of experimentally determined amyloid-forming peptides. Nucl. Acids Res. 2020, 48, D389–D393. [Google Scholar] [CrossRef] [PubMed]
- Wang, C.; Uversky, V.N.; Kurgan, L. Disordered nucleiome: Abundance of intrinsic disorder in the DNA- and RNA-binding proteins in 1121 species from Eukaryota, Bacteria and Archaea. Proteomics 2016, 16, 1486–1498. [Google Scholar] [CrossRef]
- Luoma, L.M.; Berry, F.B. Molecular analysis of NPAS3 functional domains and variants. BMC Mol. Biol. 2018, 19, 14. [Google Scholar] [CrossRef] [PubMed]
- Nucifora, L.G.; Wu, Y.C.; Lee, B.J.; Sha, L.; Margolis, R.L.; Ross, C.A.; Sawa, A.; Nucifora, F.C., Jr. A Mutation in NPAS3 That Segregates with Schizophrenia in a Small Family Leads to Protein Aggregation. Mol. Neuropsychiatry 2016, 2, 133–144. [Google Scholar] [CrossRef] [Green Version]
- Avni, A.; Swasthi, H.M.; Majumdar, A.; Mukhopadhyay, S. Intrinsically Disordered Proteins in the Formation of Functional Amyloids from Bacteria to Humans. Prog. Mol. Biol. Transl. Sci. 2019, 166, 109–143. [Google Scholar] [CrossRef]
- Uemura, E.; Niwa, T.; Minami, S.; Takemoto, K.; Fukuchi, S.; Machida, K.; Imataka, H.; Ueda, T.; Ota, M.; Taguchi, H. Large-scale aggregation analysis of eukaryotic proteins reveals an involvement of intrinsically disordered regions in protein folding. Sci. Rep. 2018, 8, 1–11. [Google Scholar] [CrossRef] [Green Version]
- Camilloni, C.; Sala, B.M.; Sormanni, P.; Porcari, R.; Corazza, A.; De Rosa, M.; Zanini, S.; Barbiroli, A.; Esposito, G.; Bolognesi, M.; et al. Rational design of mutations that change the aggregation rate of a protein while maintaining its native structure and stability. Sci. Rep. 2016, 6, 1–11. [Google Scholar] [CrossRef] [PubMed] [Green Version]
- Bowler, E.; Wang, Z.; Ewing, R.M. How do oncoprotein mutations rewire protein-protein interaction networks? Expert Rev. Proteomics 2015, 12, 449–455. [Google Scholar] [CrossRef] [Green Version]
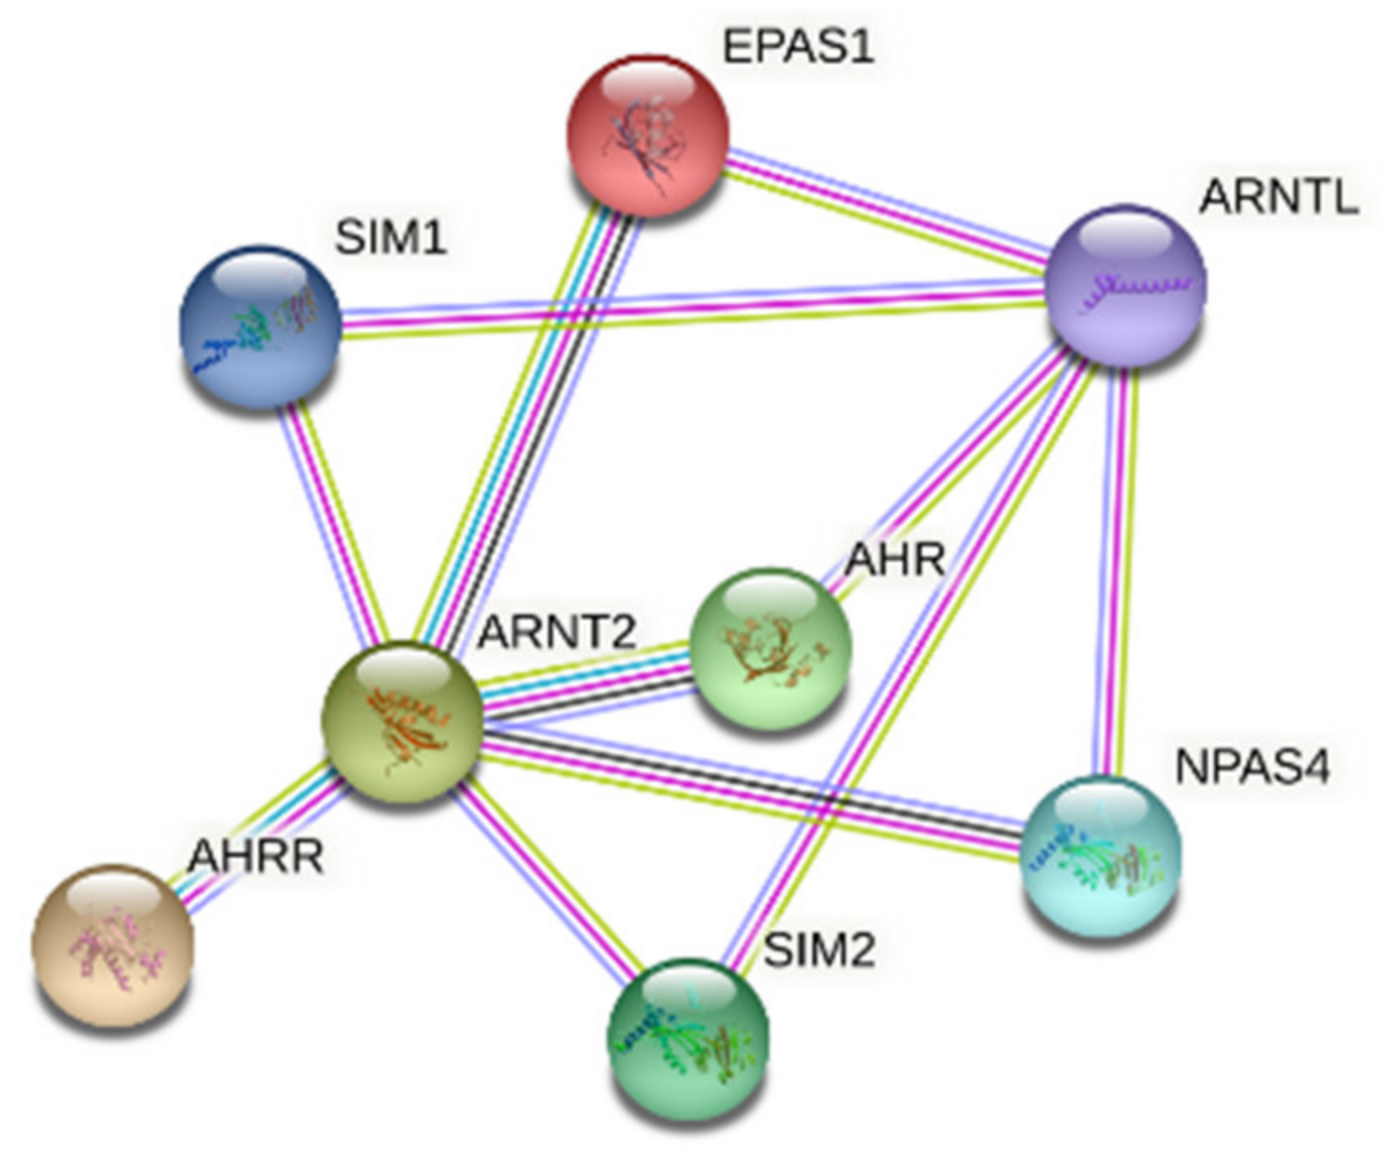
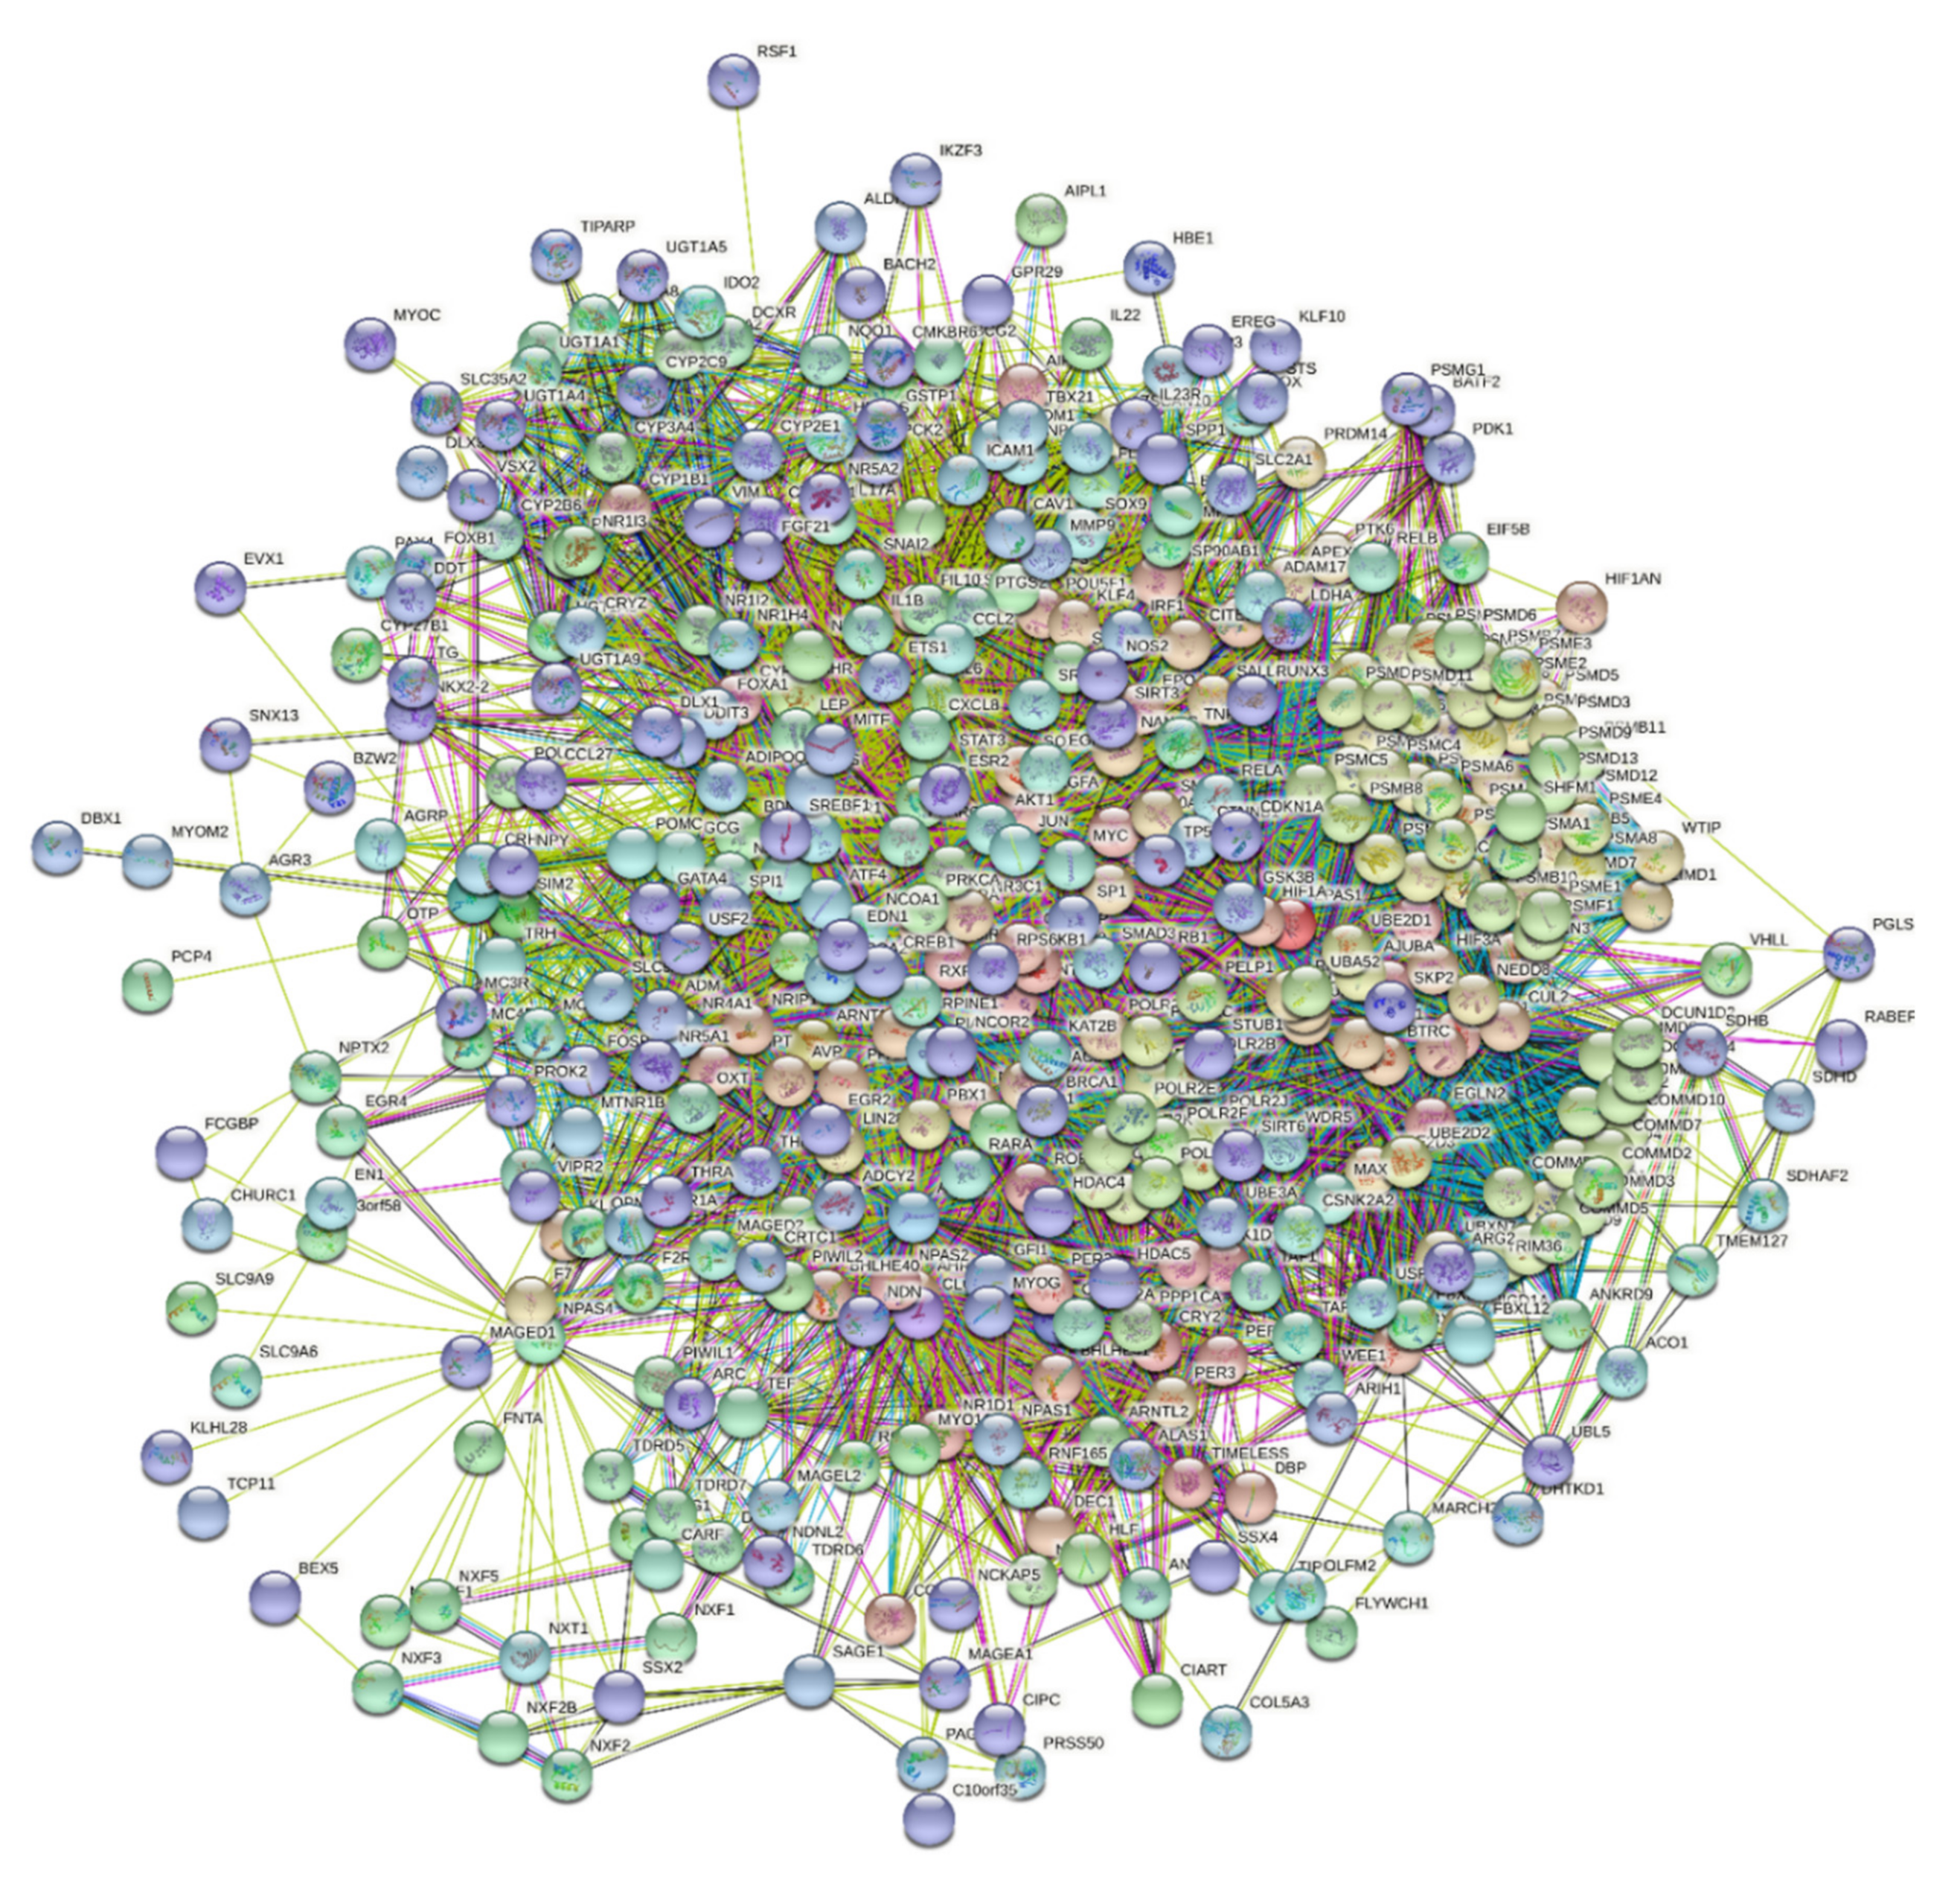
- Szklarczyk, D.; Gable, A.L.; Lyon, D.; Junge, A.; Wyder, S.; Huerta-Cepas, J.; Simonovic, M.; Doncheva, N.T.; Morris, J.H.; Bork, P.; et al. STRING v11: Protein-protein association networks with increased coverage, supporting functional discovery in genome-wide experimental datasets. Nucleic Acids Res. 2019, 47, D607–D613. [Google Scholar] [CrossRef] [PubMed] [Green Version]
- Dyson, H.J.; Wright, P.E. Coupling of folding and binding for unstructured proteins. Curr. Opin. Struct. Biol. 2002, 12, 54–60. [Google Scholar] [CrossRef]
- Wong, E.T.C.; So, V.; Guron, M.; Kuechler, E.R.; Malhis, N.; Bui, J.M.; Gsponer, J. Protein–protein interactions mediated by intrinsically disordered protein regions are enriched in missense mutations. Biomolecules 2020, 10, 1097. [Google Scholar] [CrossRef]
- Sharma, N.; Fonin, A.V.; Shpironok, O.G.; Silonov, S.A.; Turoverov, K.K.; Uversky, V.N.; Kuznetsova, I.M.; Giri, R. Folding perspectives of an intrinsically disordered transactivation domain and its single mutation breaking the folding propensity. Int. J. Biol. Macromol. 2020, 155, 1359–1372. [Google Scholar] [CrossRef] [PubMed]
- Huang, Q.; Chang, J.; Cheung, M.K.; Nong, W.; Li, L.; Lee, M.T.; Kwan, H.S. Human proteins with target sites of multiple post-translational modification types are more prone to be involved in disease. J. Proteome Res. 2014, 13, 2735–2748. [Google Scholar] [CrossRef] [PubMed]
- Greb-Markiewicz, B.; Kolonko, M. Subcellular Localization Signals of bHLH-PAS Proteins: Their Significance, Current State of Knowledge and Future Perspectives. Int. J. Mol. Sci. 2019, 20, 4746. [Google Scholar] [CrossRef] [PubMed] [Green Version]
- Greb-Markiewicz, B.; Zarębski, M.; Ożyhar, A. Multiple sequences orchestrate subcellular trafficking of neuronal PAS domain-containing protein 4 (NPAS4). J. Biol. Chem. 2018, 29, 11255–11270. [Google Scholar] [CrossRef] [PubMed] [Green Version]
- Jans, D.A.; Hübner, S. Regulation of protein transport to the nucleus: Central role of phosphorylation. Physiol. Rev. 1996, 76, 651–685. [Google Scholar] [CrossRef]
- Sawyer, I.A.; Bartek, J.; Dundr, M. Phase separated microenvironments inside the cell nucleus are linked to disease and regulate epigenetic state, transcription and RNA processing. Semin. Cell Dev. Biol. 2018, 90, 94–103. [Google Scholar] [CrossRef] [PubMed]
- Wang, Z.; Zhang, H. Phase Separation, Transition, and Autophagic Degradation of Proteins in Development and Pathogenesis. Trends Cell Biol. 2019, 29, 417–427. [Google Scholar] [CrossRef]
- Molliex, A.; Temirov, J.; Lee, J.; Coughlin, M.; Kanagaraj, A.P.; Kim, H.J.; Mittag, T.; Taylor, J.P. Phase Separation by Low Complexity Domains Promotes Stress Granule Assembly and Drives Pathological Fibrillization. Cell 2015, 163, 123–133. [Google Scholar] [CrossRef] [PubMed] [Green Version]
- Banani, S.F.; Lee, H.O.; Hyman, A.A.; Rosen, M.K. Biomolecular condensates: Organizers of cellular biochemistry. Nat. Rev. Mol. Cell Biol. 2017, 18, 285–298. [Google Scholar] [CrossRef] [PubMed]
- Oates, M.E.; Romero, P.; Ishida, T.; Ghalwash, M.; Mizianty, M.J.; Xue, B.; Dosztányi, Z.; Uversky, V.N.; Obradovic, Z.; Kurgan, L.; et al. D2P2: Database of disordered protein predictions. Nucleic Acids Res. 2013, 41, 508–516. [Google Scholar] [CrossRef] [PubMed] [Green Version]
- Romero, P.; Obradovic, Z.; Li, X.; Garner, E.C.; Brown, C.J.; Dunker, A.K. Sequence complexity of disordered protein. Proteins 2001, 42, 38–48. [Google Scholar] [CrossRef]
- Peng, K.; Radivojac, P.; Vucetic, S.; Dunker, A.K.; Obradović, Z. Length-dependent prediction of protein intrinsic disorder. BMC Bioinformatics 2006, 7, 208. [Google Scholar] [CrossRef] [PubMed] [Green Version]
- Peng, K.; Vucetic, S.; Radivojac, P.; Brown, C.J.; Dunker, A.K.; Obradovic, Z. Optimizing long intrinsic disorder predictors with protein evolutionary information. J. Bioinform. Comput. Biol. 2005, 3, 35–60. [Google Scholar] [CrossRef] [PubMed]
- Xue, B.; Dunbrack, R.L.; Williams, R.W.; Dunker, A.K.; Uversky, V.N. PONDR-FIT: A meta-predictor of intrinsically disordered amino acids. Biochim. Biophys. Acta 2010, 1804, 996–1010. [Google Scholar] [CrossRef] [PubMed] [Green Version]
- Dosztanyi, Z.; Csizmok, V.; Tompa, P.; Simon, I. IUPred: Web server for the prediction of intrinsically unstructured regions of proteins based on estimated energy content. Bioinformatics 2005, 21, 3433–3434. [Google Scholar] [CrossRef] [PubMed] [Green Version]
- Mészáros, B.; Erdös, G.; Dosztányi, Z. IUPred2A: Context-dependent prediction of protein disorder as a function of redox state and protein binding. Nucl. Acids Res. 2018, 46, W329–W337. [Google Scholar] [CrossRef]
- Peng, Z.-L.; Kurgan, L. Comprehensive Comparative Assessment of In-Silico Predictors of Disordered Regions. Curr. Protein Pept. Sci. 2012, 13, 6–18. [Google Scholar] [CrossRef] [PubMed] [Green Version]
- Fan, X.; Kurgan, L. Accurate prediction of disorder in protein chains with a comprehensive and empirically designed consensus. J. Biomol. Struct. Dyn. 2014, 32, 448–464. [Google Scholar] [CrossRef]
- Prilusky, J.; Felder, C.E.; Zeev-Ben-Mordehai, T.; Rydberg, E.H.; Man, O.; Beckmann, J.S.; Silman, I.; Sussman, J.L. FoldIndex: A simple tool to predict whether a given protein sequence is intrinsically unfolded. Bioinformatics 2005, 21, 3435–3438. [Google Scholar] [CrossRef]
- Campen, A.; Williams, R.; Brown, C.; Meng, J.; Uversky, V.; Dunker, A. TOP-IDP-Scale: A New Amino Acid Scale Measuring Propensity for Intrinsic Disorder. Protein Pept. Lett. 2008, 15, 956–963. [Google Scholar] [CrossRef] [Green Version]
- Oldfield, C.J.; Cheng, Y.; Cortese, M.S.; Romero, P.; Uversky, V.N.; Dunker, A.K. Coupled folding and binding with α-helix-forming molecular recognition elements. Biochemistry 2005, 44, 12454–12470. [Google Scholar] [CrossRef] [PubMed]
- Cheng, Y.; Oldfield, C.J.; Meng, J.; Romero, P.; Uversky, V.N.; Dunker, A.K. Mining α-helix-forming molecular recognition features (α-MoRFs) with cross species sequence alignments. Biochemistry 2007, 46, 13468–13477. [Google Scholar] [CrossRef] [PubMed] [Green Version]
- Disfani, F.M.; Hsu, W.L.; Mizianty, M.J.; Oldfield, C.J.; Xue, B.; Keith Dunker, A.; Uversky, V.N.; Kurgan, L. MoRFpred, a computational tool for sequence-based prediction and characterization of short disorder-to-order transitioning binding regions in proteins. Bioinformatics 2012, 28, 75–83. [Google Scholar] [CrossRef] [Green Version]


| No. | Gene Name | Protein Mutation | Disorder Score | Close Post = Translational Modifications (PTMs) | LLPS |
|---|---|---|---|---|---|
| 1 | AHR | P18L | 0.81 ± 0.17 | S12p, K17ac, K24ac,ub,sm | |
| 2 | AHR | D132N | 0.03 ± 0.03 | ||
| 3 | AHR | T141N | 0.08 ± 0.06 | + | |
| 4 | AHR | Q150K | 0.14 ± 0.10 | + | |
| 5 | AHR | E169K | 0.20 ± 0.09 | +local | |
| 6 | AHR | T199P | 0.43 ± 0.19 | + | |
| 7 | AHR | P260L | 0.24 ± 0.11 | K254sm | |
| 8 | AHR | N284H | 0.15 ± 0.08 | K292ub | + |
| 9 | AHR | R305K | 0.12 ± 0.06 | + | |
| 10 | AHR | T311I | 0.18 ± 0.10 | Y322p | |
| 11 | AHR | R368C | 0.22 ± 0.15 | + | |
| 12 | AHR | Q383H | 0.39 ± 0.18 | T387p | |
| 13 | AHR | R398Q | 0.45 ± 0.10 | + | |
| 14 | AHR | E488K | 0.48 ± 0.17 | ++ | |
| 15 | AHR | N505S | 0.51 ± 0.10 | K510ub | ++ |
| 16 | AHR | T507I | 0.55 ± 0.14 | K510ub | ++ |
| 17 | AHR | R554K | 0.24 ± 0.08 | K560ub | + |
| 18 | AHR | V570I | 0.24 ± 0.09 | K560ub | |
| 19 | AHR | S733F | 0.58 ± 0.15 | ||
| 20 | AHR | P838S | 0.69 ± 0.07 | + | |
| No. | Gene Name | Protein Mutation | Disorder Score | Close PTMs | LLPS |
| 1 | AHRR | V29M | 0.90 ± 0.07 | K24ub | + |
| 2 | AHRR | S53G | 0.37 ± 0.19 | ||
| 3 | AHRR | S63F | 0.22 ± 0.19 | + | |
| 4 | AHRR | Q88R | 0.44 ± 0.22 | + | |
| 5 | AHRR | A96V | 0.72 ± 0.10 | + | |
| 6 | AHRR | P102S | 0.76 ± 0.14 | + | |
| 7 | AHRR | A112V | 0.45 ± 0.15 | + | |
| 8 | AHRR | T152M | 0.08 ± 0.08 | + | |
| 9 | AHRR | P189A | 0.43 ± 0.16 | ||
| 10 | AHRR | I226V | 0.04 ± 0.05 | +local | |
| 11 | AHRR | R230C | 0.05 ± 0.06 | ||
| 12 | AHRR | P283S | 0.45 ± 0.22 | S281p | + |
| 13 | AHRR | R285W | 0.52 ± 0.20 | S281p | + |
| 14 | AHRR | A300T | 0.63 ± 0.21 | K322ub | + |
| 15 | AHRR | A301V | 0.53 ± 0.18 | K322ub | + |
| 16 | AHRR | A371T | 0.77 ± 0.07 | K371ub | ++ |
| 17 | AHRR | T419I | 0.92 ± 0.03 | K402ub | |
| 18 | AHRR | G427E | 0.92 ± 0.06 | ||
| 19 | AHRR | R485W | 0.65 ± 0.26 | ||
| 20 | AHRR | R491W | 0.66 ± 0.28 | ||
| 21 | AHRR | R491Q | 0.66 ± 0.28 | ||
| 22 | AHRR | G494S | 0.63 ± 0.27 | ||
| 23 | AHRR | T524M | 0.57 ± 0.10 | K538sm | |
| 24 | AHRR | C545F | 0.43 ± 0.10 | K538sm | + |
| 25 | AHRR | V553M | 0.30 ± 0.12 | K577sm | + |
| 26 | AHRR | G612S | 0.49 ± 0.22 | T605p | |
| 27 | AHRR | D645H | 0.54 ± 0.24 | R643m | + |
| 28 | AHRR | A674S | 0.68 ± 0.13 | K660ub,sm | |
| No. | Gene Name | Protein Mutation | Disorder Score | Close PTMs | LLPS |
| 1 | SIM1 | E3D | 0.88 ± 0.13 | +local | |
| 2 | SIM1 | R10W | 0.81 ± 0.13 | ||
| 3 | SIM1 | S31L | 0.28 ± 0.10 | S31p | + |
| 4 | SIM1 | Q36P | 0.27 ± 0.12 | + | |
| 5 | SIM1 | G65D | 0.36 ± 0.13 | ||
| 6 | SIM1 | D74Y | 0.40 ± 0.17 | +local | |
| 7 | SIM1 | E155K | 0.13 ± 0.10 | + | |
| 8 | SIM1 | R192H | 0.08 ± 0.08 | K181ac | + |
| 9 | SIM1 | R192C | 0.08 ± 0.08 | K181ac | + |
| 10 | SIM1 | V213M | 0.17 ± 0.12 | ||
| 11 | SIM1 | L217P | 0.23 ± 0.17 | ||
| 12 | SIM1 | V222I | 0.22 ± 0.14 | +local | |
| 13 | SIM1 | E224K | 0.19 ± 0.13 | +local | |
| 14 | SIM1 | A236T | 0.06 ± 0.06 | ||
| 15 | SIM1 | H268Q | 0.08 ± 0.06 | + | |
| 16 | SIM1 | H268Y | 0.08 ± 0.06 | + | |
| 17 | SIM1 | G271S | 0.08 ± 0.07 | + | |
| 18 | SIM1 | T292N | 0.07 ± 0.05 | +local | |
| 19 | SIM1 | G303S | 0.03 ± 0.02 | + | |
| 20 | SIM1 | S309G | 0.10 ± 0.06 | ||
| 21 | SIM1 | A311V | 0.12 ± 0.07 | +local | |
| 22 | SIM1 | V326I | 0.17 ± 0.10 | S343p | + |
| 23 | SIM1 | P352T | 0.47 ± 0.12 | S343p, S350p, S355p, Y356p, S358p | + |
| 24 | SIM1 | A371V | 0.84 ± 0.14 | S378p | ++ |
| 25 | SIM1 | G392R | 0.73 ± 0.14 | S382p | +local |
| 26 | SIM1 | H394Y | 0.71 ± 0.16 | S382p | + |
| 27 | SIM1 | E396D | 0.67 ± 0.19 | S382p | + |
| 28 | SIM1 | E399K | 0.68 ± 0.21 | S382p | |
| 29 | SIM1 | H402Y | 0.73 ± 0.16 | +local | |
| 30 | SIM1 | G408R | 0.81 ± 0.09 | ||
| 31 | SIM1 | D424N | 0.75 ± 0.10 | + | |
| 32 | SIM1 | S428F | 0.63 ± 0.16 | + | |
| 33 | SIM1 | A432T | 0.56 ± 0.20 | + | |
| 34 | SIM1 | A435T | 0.49 ± 0.19 | + | |
| 35 | SIM1 | G448C | 0.28 ± 0.14 | ||
| 36 | SIM1 | S454L | 0.28 ± 0.14 | + | |
| 37 | SIM1 | R471Q | 0.28 ± 0.10 | Y477p | |
| 38 | SIM1 | C472W | 0.28 ± 0.11 | Y477p, T481p | |
| 39 | SIM1 | T481M | 0.32 ± 0.12 | T481p | +local |
| 40 | SIM1 | R493C | 0.43 ± 0.10 | ||
| 41 | SIM1 | A494T | 0.43 ± 0.09 | ||
| 42 | SIM1 | E530K | 0.66 ± 0.18 | ||
| 43 | SIM1 | P539R | 0.83 ± 0.07 | +local | |
| 44 | SIM1 | S541L | 0.83 ± 0.08 | ||
| 45 | SIM1 | R548Q | 0.85 ± 0.06 | ||
| 46 | SIM1 | R550C | 0.84 ± 0.06 | ||
| 47 | SIM1 | H559Q | 0.78 ± 0.12 | +local | |
| 48 | SIM1 | A570G | 0.77 ± 0.09 | + | |
| 49 | SIM1 | P588L | 0.69 ± 0.09 | ||
| 50 | SIM1 | S603F | 0.36 ± 0.18 | ||
| 51 | SIM1 | N650Y | 0.75 ± 0.12 | S642p, S651p | |
| 52 | SIM1 | R657W | 0.76 ± 0.13 | S651p, S660p | + |
| 53 | SIM1 | P661L | 0.75 ± 0.13 | S660p, S670p | +local |
| 54 | SIM1 | S663L | 0.70 ± 0.19 | S660p, S670p | +local |
| 55 | SIM1 | R665C | 0.67 ± 0.17 | S660p, S670p | |
| 56 | SIM1 | S680L | 0.43 ± 0.16 | S670p | |
| 57 | SIM1 | S701C | 0.22 ± 0.13 | ||
| 58 | SIM1 | Q704H | 0.16 ± 0.11 | ||
| 59 | SIM1 | Q704L | 0.16 ± 0.11 | ||
| 60 | SIM1 | E725K | 0.17 ± 0.11 | + | |
| No. | Gene Name | Protein Mutation | Disorder Score | Close PTMs | LLLPS |
| 1 | SIM2 | A40V | 0.22 ± 0.08 | + | |
| 2 | SIM2 | R44G | 0.15 ± 0.05 | + | |
| 3 | SIM2 | F56L | 0.15 ± 0.07 | ++ | |
| 4 | SIM2 | P57S | 0.16 ± 0.08 | ++ | |
| 5 | SIM2 | A63V | 0.29 ± 0.10 | + | |
| 6 | SIM2 | A70T | 0.33 ± 0.13 | + | |
| 7 | SIM2 | V76I | 0.36 ± 0.14 | +local | |
| 8 | SIM2 | V92F | 0.05 ± 0.02 | ||
| 9 | SIM2 | E106K | 0.17 ± 0.06 | S115p | |
| 10 | SIM2 | A108T | 0.18 ± 0.08 | S115p | |
| 11 | SIM2 | T120M | 0.18 ± 0.09 | S115p | |
| 12 | SIM2 | I124M | 0.23 ± 0.06 | S115p | |
| 13 | SIM2 | Y125H | 0.27 ± 0.07 | S115p | |
| 14 | SIM2 | D134N | 0.28 ± 0.12 | + | |
| 15 | SIM2 | P145L | 0.24 ± 0.09 | +local | |
| 16 | SIM2 | H147Y | 0.24 ± 0.10 | +local | |
| 17 | SIM2 | M164I | 0.08 ± 0.06 | + | |
| 18 | SIM2 | L168F | 0.08 ± 0.06 | + | |
| 19 | SIM2 | A169V | 0.09 ± 0.06 | ++ | |
| 20 | SIM2 | G174S | 0.09 ± 0.07 | Y188p | |
| 21 | SIM2 | K190N | 0.05 ± 0.05 | Y188p | |
| 22 | SIM2 | Y194H | 0.05 ± 0.05 | Y188p | |
| 23 | SIM2 | S199Y | 0.05 ± 0.06 | Y188p | + |
| 24 | SIM2 | D202N | 0.04 ± 0.04 | + | |
| 25 | SIM2 | V211G | 0.14 ± 0.15 | +local | |
| 26 | SIM2 | A212V | 0.15 ± 0.17 | Y228p, S229p | + |
| 27 | SIM2 | A221T | 0.19 ± 0.13 | Y228p, S229p | |
| 28 | SIM2 | T223I | 0.16 ± 0.10 | Y228p, S229p | + |
| 29 | SIM2 | M231I | 0.05 ± 0.04 | Y228p, S229p | +local |
| 30 | SIM2 | D239Y | 0.05 ± 0.04 | S237p | + |
| 31 | SIM2 | L240P | 0.05 ± 0.04 | S237p | + |
| 32 | SIM2 | D246N | 0.10 ± 0.07 | S237p | + |
| 33 | SIM2 | T253M | 0.22 ± 0.15 | + | |
| 34 | SIM2 | G254R | 0.24 ± 0.13 | ++ | |
| 35 | SIM2 | E262K | 0.15 ± 0.13 | + | |
| 36 | SIM2 | H267Y | 0.07 ± 0.05 | + | |
| 37 | SIM2 | G271D | 0.06 ± 0.05 | ++ | |
| 38 | SIM2 | D273N | 0.07 ± 0.06 | + | |
| 39 | SIM2 | R278C | 0.04 ± 0.04 | ||
| 40 | SIM2 | A280T | 0.04 ± 0.03 | ||
| 41 | SIM2 | L283V | 0.06 ± 0.04 | +local | |
| 42 | SIM2 | G303S | 0.06 ± 0.04 | ||
| 43 | SIM2 | A311V | 0.17 ± 0.14 | ||
| 44 | SIM2 | V313A | 0.23 ± 0.13 | ||
| 45 | SIM2 | R318L | 0.31 ± 0.20 | ||
| 46 | SIM2 | R318H | 0.31 ± 0.20 | ||
| 47 | SIM2 | C324Y | 0.21 ± 0.07 | ||
| 48 | SIM2 | C324F | 0.21 ± 0.07 | ||
| 49 | SIM2 | V326M | 0.17 ± 0.06 | ||
| 50 | SIM2 | V326G | 0.17 ± 0.06 | ||
| 51 | SIM2 | E339K | 0.23 ± 0.12 | S343p | + |
| 52 | SIM2 | S343Y | 0.33 ± 0.12 | S343p | + |
| 53 | SIM2 | E345K | 0.37 ± 0.12 | S343p, S348p, T349p | + |
| 54 | SIM2 | A350S | 0.41 ± 0.18 | S348p, T349p, A350p, S352p | + |
| 55 | SIM2 | S355F | 0.54 ± 0.11 | S348p, T349p, A350p, S352p, 3T58p | + |
| 56 | SIM2 | K368N | 0.79 ± 0.15 | T358p, T366p | + |
| 57 | SIM2 | M377I | 0.78 ± 0.14 | T366p | |
| 58 | SIM2 | P385H | 0.61 ± 0.16 | T383p | |
| 59 | SIM2 | F394S | 0.51 ± 0.24 | T383p | + |
| 60 | SIM2 | T433M | 0.44 ± 0.20 | + | |
| 61 | SIM2 | P448S | 0.33 ± 0.23 | + | |
| 62 | SIM2 | D450N | 0.35 ± 0.22 | ||
| 63 | SIM2 | F454S | 0.38 ± 0.21 | ||
| 64 | SIM2 | Q469P | 0.32 ± 0.17 | S471p | |
| 65 | SIM2 | L483M | 0.28 ± 0.22 | ||
| 66 | SIM2 | C489G | 0.30 ± 0.22 | +local | |
| 67 | SIM2 | S502W | 0.78 ± 0.12 | ||
| 68 | SIM2 | S503Y | 0.79 ± 0.13 | ||
| 69 | SIM2 | T646P | 0.78 ± 0.13 | + | |
| No. | Gene Name | Protein Mutation | Disorder Score | Close PTMs | LLPS |
| 1 | Hif-2α | T31M | 0.60 ± 0.33 | ||
| 2 | Hif-2α | S49Y | 0.39 ± 0.13 | +local | |
| 3 | Hif-2α | S55F | 0.25 ± 0.17 | S62p, S79p | + |
| 4 | Hif-2α | S72L | 0.44 ± 0.11 | S62p, S79p | + |
| 5 | Hif-2α | E82K | 0.54 ± 0.18 | S79p, Y91p | + |
| 6 | Hif-2α | A94T | 0.16 ± 0.06 | Y91p, T103p | |
| 7 | Hif-2α | R144C | 0.47 ± 0.13 | K150ub | + |
| 8 | Hif-2α | H248N | 0.23 ± 0.15 | R247m | +local |
| 9 | Hif-2α | S276L | 0.17 ± 0.07 | ++ | |
| 10 | Hif-2α | E279V | 0.19 ± 0.06 | + | |
| 11 | Hif-2α | Q294H | 0.29 ± 0.16 | K291ub | |
| 12 | Hif-2α | G314E | 0.11 ± 0.08 | T324p | |
| 13 | Hif-2α | V317M | 0.06 ± 0.04 | T324p | |
| 14 | Hif-2α | S355F | 0.29 ± 0.07 | ||
| 15 | Hif-2α | S372N | 0.28 ± 0.16 | S383p, K385ac | ++ |
| 16 | Hif-2α | A410T | 0.45 ± 0.10 | K392ub, K394sm | + |
| 17 | Hif-2α | S474T | 0.84 ± 0.13 | +local | |
| 18 | Hif-2α | Y489H | 0.56 ± 0.18 | K497ub | +local |
| 19 | Hif-2α | M507T | 0.40 ± 0.12 | K497ub | +local |
| 20 | Hif-2α | L529P | 0.55 ± 0.12 | T528p | |
| 21 | Hif-2α | A530V | 0.52 ± 0.14 | T528p | |
| 22 | Hif-2α | A530T | 0.52 ± 0.14 | T528p | |
| 23 | Hif-2α | A530E | 0.52 ± 0.14 | T528p | |
| 24 | Hif-2α | P531L | 0.53 ± 0.14 | T528p | + |
| 25 | Hif-2α | P531S | 0.53 ± 0.14 | T528p | + |
| 26 | Hif-2α | Y532C | 0.54 ± 0.13 | T528p | +local |
| 27 | Hif-2α | M535V | 0.58 ± 0.12 | T528p | |
| 28 | Hif-2α | M535T | 0.58 ± 0.12 | T528p | |
| 29 | Hif-2α | G537R | 0.56 ± 0.13 | T528p | |
| 30 | Hif-2α | G537W | 0.56 ± 0.13 | T528p | |
| 31 | Hif-2α | D539Y | 0.58 ± 0.12 | T528p | |
| 32 | Hif-2α | F540L | 0.60 ± 0.10 | ||
| 33 | Hif-2α | L542R | 0.56 ± 0.18 | ||
| 34 | Hif-2α | F608L | 0.60 ± 0.19 | K595ub | +local |
| 35 | Hif-2α | S672Y | 0.57 ± 0.15 | S672p | + |
| 36 | Hif-2α | S703A | 0.43 ± 0.15 | + | |
| 37 | Hif-2α | R710Q | 0.40 ± 0.16 | + | |
| 38 | Hif-2α | S723N | 0.69 ± 0.08 | ++ | |
| 39 | Hif-2α | P727L | 0.64 ± 0.10 | K741ac | + |
| 40 | Hif-2α | D753E | 0.68 ± 0.12 | K741ac | +local |
| 41 | Hif-2α | T766P | 0.64 ± 0.25 | ||
| 42 | Hif-2α | N768T | 0.65 ± 0.28 | ||
| 43 | Hif-2α | P785T | 0.84 ± 0.08 | +local | |
| 44 | Hif-2α | I789V | 0.80 ± 0.10 | S795p | |
| 45 | Hif-2α | R798G | 0.58 ± 0.13 | S795p | |
| 46 | Hif-2α | R825Q | 0.33 ± 0.20 | S830p | |
| 47 | Hif-2α | E832D | 0.27 ± 0.11 | S830p, T840p | |
| No. | Gene Name | Protein Mutation | Disorder Score | Close PTMs | LLPS |
| 1 | NPAS4 | A8T | 0.70 ± 0.17 | ||
| 2 | NPAS4 | R51H | 0. 05 ± 0.03 | +local | |
| 3 | NPAS4 | A63V | 0.24 ± 0.13 | ||
| 4 | NPAS4 | P82H | 0.12 ± 0.10 | +local | |
| 5 | NPAS4 | G83S | 0.12 ± 0.09 | + | |
| 6 | NPAS4 | D121N | 0.13 ± 0.06 | ||
| 7 | NPAS4 | R132H | 0.21 ± 0.08 | + | |
| 8 | NPAS4 | R145C | 0.28 ± 0.09 | ||
| 9 | NPAS4 | R150L | 0.36 ± 0.20 | + | |
| 10 | NPAS4 | S156F | 0.43 ± 0.19 | + | |
| 11 | NPAS4 | R159C | 0.39 ± 0.18 | ++ | |
| 12 | NPAS4 | V167M | 0.24 ± 0.07 | + | |
| 13 | NPAS4 | R172Q | 0.16 ± 0.09 | +local | |
| 14 | NPAS4 | A175T | 0.16 ± 0.11 | ||
| 15 | NPAS4 | P194S | 0.41 ± 0.13 | + | |
| 16 | NPAS4 | P194L | 0.41 ± 0.13 | + | |
| 17 | NPAS4 | P199H | 0.67 ± 0.07 | +local | |
| 18 | NPAS4 | R200H | 0.67 ± 0.08 | +local | |
| 19 | NPAS4 | G204D | 0.65 ± 0.16 | + | |
| 20 | NPAS4 | A210V | 0.40 ± 0.10 | ||
| 21 | NPAS4 | S219N | 0.18 ± 0.15 | ||
| 22 | NPAS4 | R220H | 0.16 ± 0.15 | +local | |
| 23 | NPAS4 | I236V | 0.10 ± 0.10 | ||
| 24 | NPAS4 | L322I | 0.35 ± 0.10 | + | |
| 25 | NPAS4 | Q332K | 0.43 ± 0.12 | ||
| 26 | NPAS4 | L351I | 0.59 ± 0.13 | +local | |
| 27 | NPAS4 | R392Q | 0.65 ± 0.21 | +local | |
| 28 | NPAS4 | P405L | 0.63 ± 0.16 | ||
| 29 | NPAS4 | D419N | 0.60 ± 0.16 | T423p, T427p | |
| 30 | NPAS4 | S453C | 0.80 ± 0.10 | +local | |
| 31 | NPAS4 | L455F | 0.83 ± 0.09 | ||
| 32 | NPAS4 | Q469H | 0.71 ± 0.19 | ||
| 33 | NPAS4 | S493L | 0.80 ± 0.10 | ||
| 34 | NPAS4 | P533S | 0.79 ± 0.11 | + | |
| 35 | NPAS4 | P533L | 0.79 ± 0.11 | + | |
| 36 | NPAS4 | S544N | 0.71 ± 0.15 | ||
| 37 | NPAS4 | Q547H | 0.75 ± 0.12 | + | |
| 38 | NPAS4 | T558I | 0.60 ± 0.22 | + | |
| 39 | NPAS4 | T587M | 0.56 ± 0.13 | ||
| 40 | NPAS4 | G566E | 0.48 ± 0.24 | ||
| 41 | NPAS4 | A592V | 0.36 ± 0.15 | + | |
| 42 | NPAS4 | R595W | 0.35 ± 0.16 | + | |
| 43 | NPAS4 | P597S | 0.41 ± 0.13 | + | |
| 44 | NPAS4 | E628G | 0.43 ± 0.11 | ++ | |
| 45 | NPAS4 | Q629H | 0.42 ± 0.11 | ++ | |
| 46 | NPAS4 | R634H | 0.47 ± 0.13 | ++ | |
| 47 | NPAS4 | I639V | 0.49 ± 0.11 | ++ | |
| 48 | NPAS4 | D647N | 0.59 ± 0.07 | ++ | |
| 49 | NPAS4 | P679L | 0.54 ± 0.14 | ||
| 50 | NPAS4 | S683I | 0.41 ± 0.16 | + | |
| 51 | NPAS4 | T708M | 0.71 ± 0.13 | + | |
| 52 | NPAS4 | V710M | 0.73 ± 0.13 | + | |
| 53 | NPAS4 | D716N | 0.85 ± 0.09 | + | |
| 54 | NPAS4 | E724K | 0.92 ± 0.07 | + | |
| 55 | NPAS4 | E725K | 0.94 ± 0.06 | + | |
| 56 | NPAS4 | D730N | 0.95 ± 0.05 | + | |
| 57 | NPAS4 | S747F | 0.76 ± 0.08 | + | |
| No. | Gene Name | Protein Mutation | Disorder Score | Close PTMs | LLPS |
| 1 | ARNT2 | A25T | 0.76 ± 0.18 | + | |
| 2 | ARNT2 | A28V | 0.76 ± 0.19 | ++ | |
| 3 | ARNT2 | G31R | 0.78 ± 0.18 | ++ | |
| 4 | ARNT2 | R47C | 0.78 ± 0.14 | R42m | + |
| 5 | ARNT2 | E72K | 0.78 ± 0.14 | ||
| 6 | ARNT2 | R76W | 0.71 ± 0.12 | +local | |
| 7 | ARNT2 | I105V | 0.47 ± 0.13 | S94p, K102ac | |
| 8 | ARNT2 | V110I | 0.51 ± 0.16 | K102ac | + |
| 9 | ARNT2 | V167I | 0.30 ± 0.14 | ||
| 10 | ARNT2 | D191G | 0.44 ± 0.09 | +local | |
| 11 | ARNT2 | R209Q | 0.48 ± 0.15 | ||
| 12 | ARNT2 | R240K | 0.37 ± 0.20 | +local | |
| 13 | ARNT2 | P269S | 0.41 ± 0.12 | + | |
| 14 | ARNT2 | M328I | 0.36 ± 0.13 | +local | |
| 15 | ARNT2 | S332L | 0.30 ± 0.06 | + | |
| 16 | ARNT2 | S343F | 0.22 ± 0.08 | +local | |
| 17 | ARNT2 | D344N | 0.21 ± 0.08 | +local | |
| 18 | ARNT2 | D344G | 0.21 ± 0.08 | +local | |
| 19 | ARNT2 | R404C | 0.18 ± 0.13 | ||
| 20 | ARNT2 | P423S | 0.15 ± 0.11 | +local | |
| 21 | ARNT2 | Y430N | 0.15 ± 0.08 | + | |
| 22 | ARNT2 | S458L | 0.52 ± 0.15 | + | |
| 23 | ARNT2 | P529S | 0.62 ± 0.21 | S540p | + |
| 24 | ARNT2 | H543R | 0.58 ± 0.21 | S540p | + |
| 25 | ARNT2 | P579S | 0.80 ± 0.11 | R578m, S588p | +local |
| 26 | ARNT2 | T602M | 0.84 ± 0.11 | S588p | +local |
| 27 | ARNT2 | R652Q | 0.65 ± 0.28 | ||
| 28 | ARNT2 | V683L | 0.87 ± 0.04 | ||
| 29 | ARNT2 | G710A | 0.63 ± 0.16 | ||
| No. | Gene Name | Protein Mutation | Disorder Score | Close PTMs | LLPS |
| 1 | BMAL1 | Q4L | 0.88 ± 0.12 | ||
| 2 | BMAL1 | D22N | 0.74 ± 0.15 | S17p | ++ |
| 3 | BMAL1 | S27Y | 0.74 ± 0.14 | S17p, T21p | ++ |
| 4 | BMAL1 | R37C | 0.76 ± 0.14 | S42p, T44p | + |
| 5 | BMAL1 | R37H | 0.76 ± 0.14 | S42p, T44p | + |
| 6 | BMAL1 | E62Q | 0.78 ± 0.08 | T52p, Y63p | +local |
| 7 | BMAL1 | E65K | 0.77 ± 0.07 | Y63p | |
| 8 | BMAL1 | H66P | 0.76 ± 0.07 | Y63p | |
| 9 | BMAL1 | I80F | 0.76 ± 0.11 | S78p, S90p | +local |
| 10 | BMAL1 | R83Q | 0.69 ± 0.13 | S78p, S90p | +local |
| 11 | BMAL1 | R84H | 0.68 ± 0.11 | S78p, S90p | +local |
| 12 | BMAL1 | R85Q | 0.65 ± 0.14 | S78p, S90p | +local |
| 13 | BMAL1 | M88I | 0.58 ± 0.15 | S78p, S90p | |
| 14 | BMAL1 | S90I | 0.50 ± 0.12 | S90p | |
| 15 | BMAL1 | A104T | 0.29 ± 0.10 | + | |
| 16 | BMAL1 | D110Y | 0.30 ± 0.07 | + | |
| 17 | BMAL1 | T140S | 0.23 ± 0.13 | K138ub | + |
| 18 | BMAL1 | D145N | 0.17 ± 0.12 | K138ub | + |
| 19 | BMAL1 | D145E | 0.17 ± 0.12 | K138ub | + |
| 20 | BMAL1 | V162I | 0.03 ± 0.02 | + | |
| 21 | BMAL1 | R166G | 0.05 ± 0.03 | + | |
| 22 | BMAL1 | Q190E | 0.123 ± 0.08 | ||
| 23 | BMAL1 | P198L | 0.19 ± 0.10 | K205ub | +local |
| 24 | BMAL1 | T224S | 0.58 ± 0.18 | K223ub, T224p | + |
| 25 | BMAL1 | P234H | 0.54 ± 0.17 | K223ub, T224p | |
| 26 | BMAL1 | R238Q | 0.49 ± 0.21 | S241p | +local |
| 27 | BMAL1 | R244Q | 0.47 ± 0.24 | S241p | |
| 28 | BMAL1 | S246C | 0.48 ± 0.24 | S241p | |
| 29 | BMAL1 | C249R | 0.50 ± 0.29 | S241p, K259sm | |
| 30 | BMAL1 | V260A | 0.60 ± 0.22 | K259sm | + |
| 31 | BMAL1 | P292T | 0.41 ± 0.16 | T294p | + |
| 32 | BMAL1 | D299Y | 0.58 ± 0.06 | T294p | + |
| 33 | BMAL1 | A345T | 0.12 ± 0.05 | S337p | |
| 34 | BMAL1 | S372L | 0.08 ± 0.08 | + | |
| 35 | BMAL1 | E375G | 0.08 ± 0.06 | + |
Publisher’s Note: MDPI stays neutral with regard to jurisdictional claims in published maps and institutional affiliations. |
© 2021 by the authors. Licensee MDPI, Basel, Switzerland. This article is an open access article distributed under the terms and conditions of the Creative Commons Attribution (CC BY) license (http://creativecommons.org/licenses/by/4.0/).
Share and Cite
Kolonko-Adamska, M.; Uversky, V.N.; Greb-Markiewicz, B. The Participation of the Intrinsically Disordered Regions of the bHLH-PAS Transcription Factors in Disease Development. Int. J. Mol. Sci. 2021, 22, 2868. https://0-doi-org.brum.beds.ac.uk/10.3390/ijms22062868
Kolonko-Adamska M, Uversky VN, Greb-Markiewicz B. The Participation of the Intrinsically Disordered Regions of the bHLH-PAS Transcription Factors in Disease Development. International Journal of Molecular Sciences. 2021; 22(6):2868. https://0-doi-org.brum.beds.ac.uk/10.3390/ijms22062868
Chicago/Turabian StyleKolonko-Adamska, Marta, Vladimir N. Uversky, and Beata Greb-Markiewicz. 2021. "The Participation of the Intrinsically Disordered Regions of the bHLH-PAS Transcription Factors in Disease Development" International Journal of Molecular Sciences 22, no. 6: 2868. https://0-doi-org.brum.beds.ac.uk/10.3390/ijms22062868