
Integration of Data from Liquid–Liquid Phase Separation Databases Highlights Concentration and Dosage Sensitivity of LLPS Drivers

 , , , and
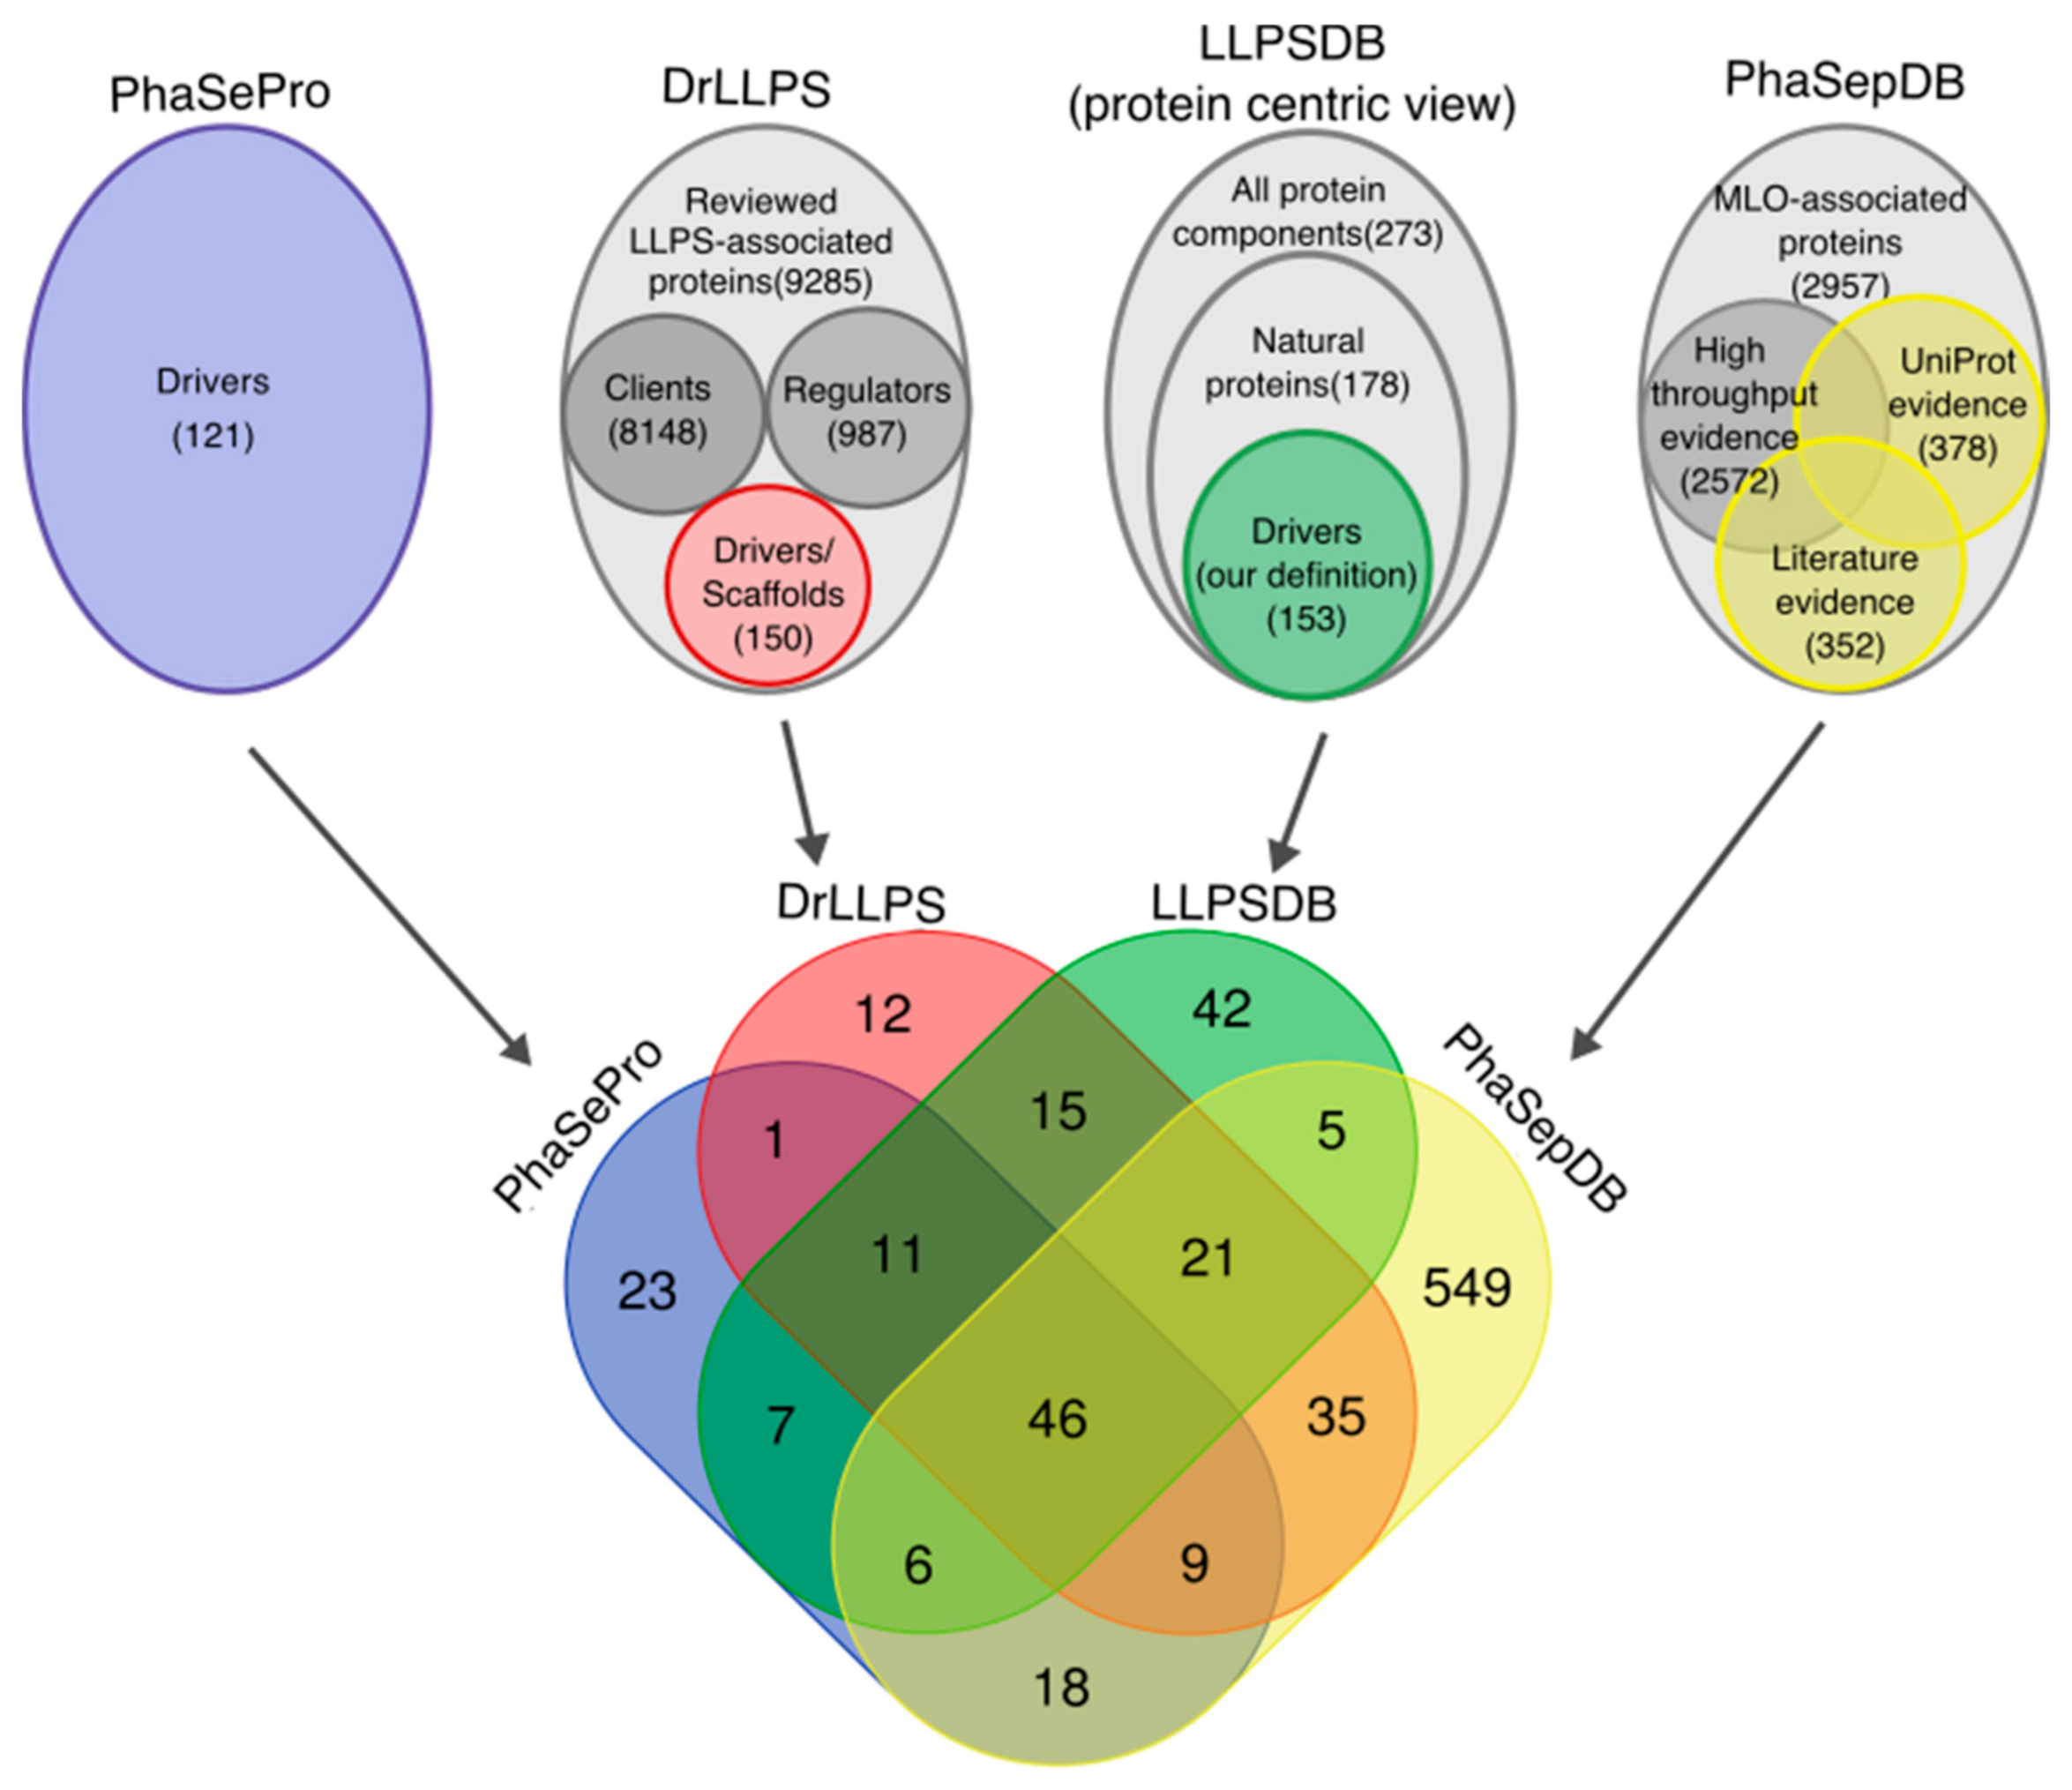
Abstract
:1. Introduction
2. Results and Discussion
2.1. Interpretation of LLPS Experiments to Define the Roles of Proteins in the Formation and Integrity of MLOs
2.2. Four LLPS Databases
2.3. Data Consolidation across LLPS Databases Reveals Inconsistencies in Protein Annotations
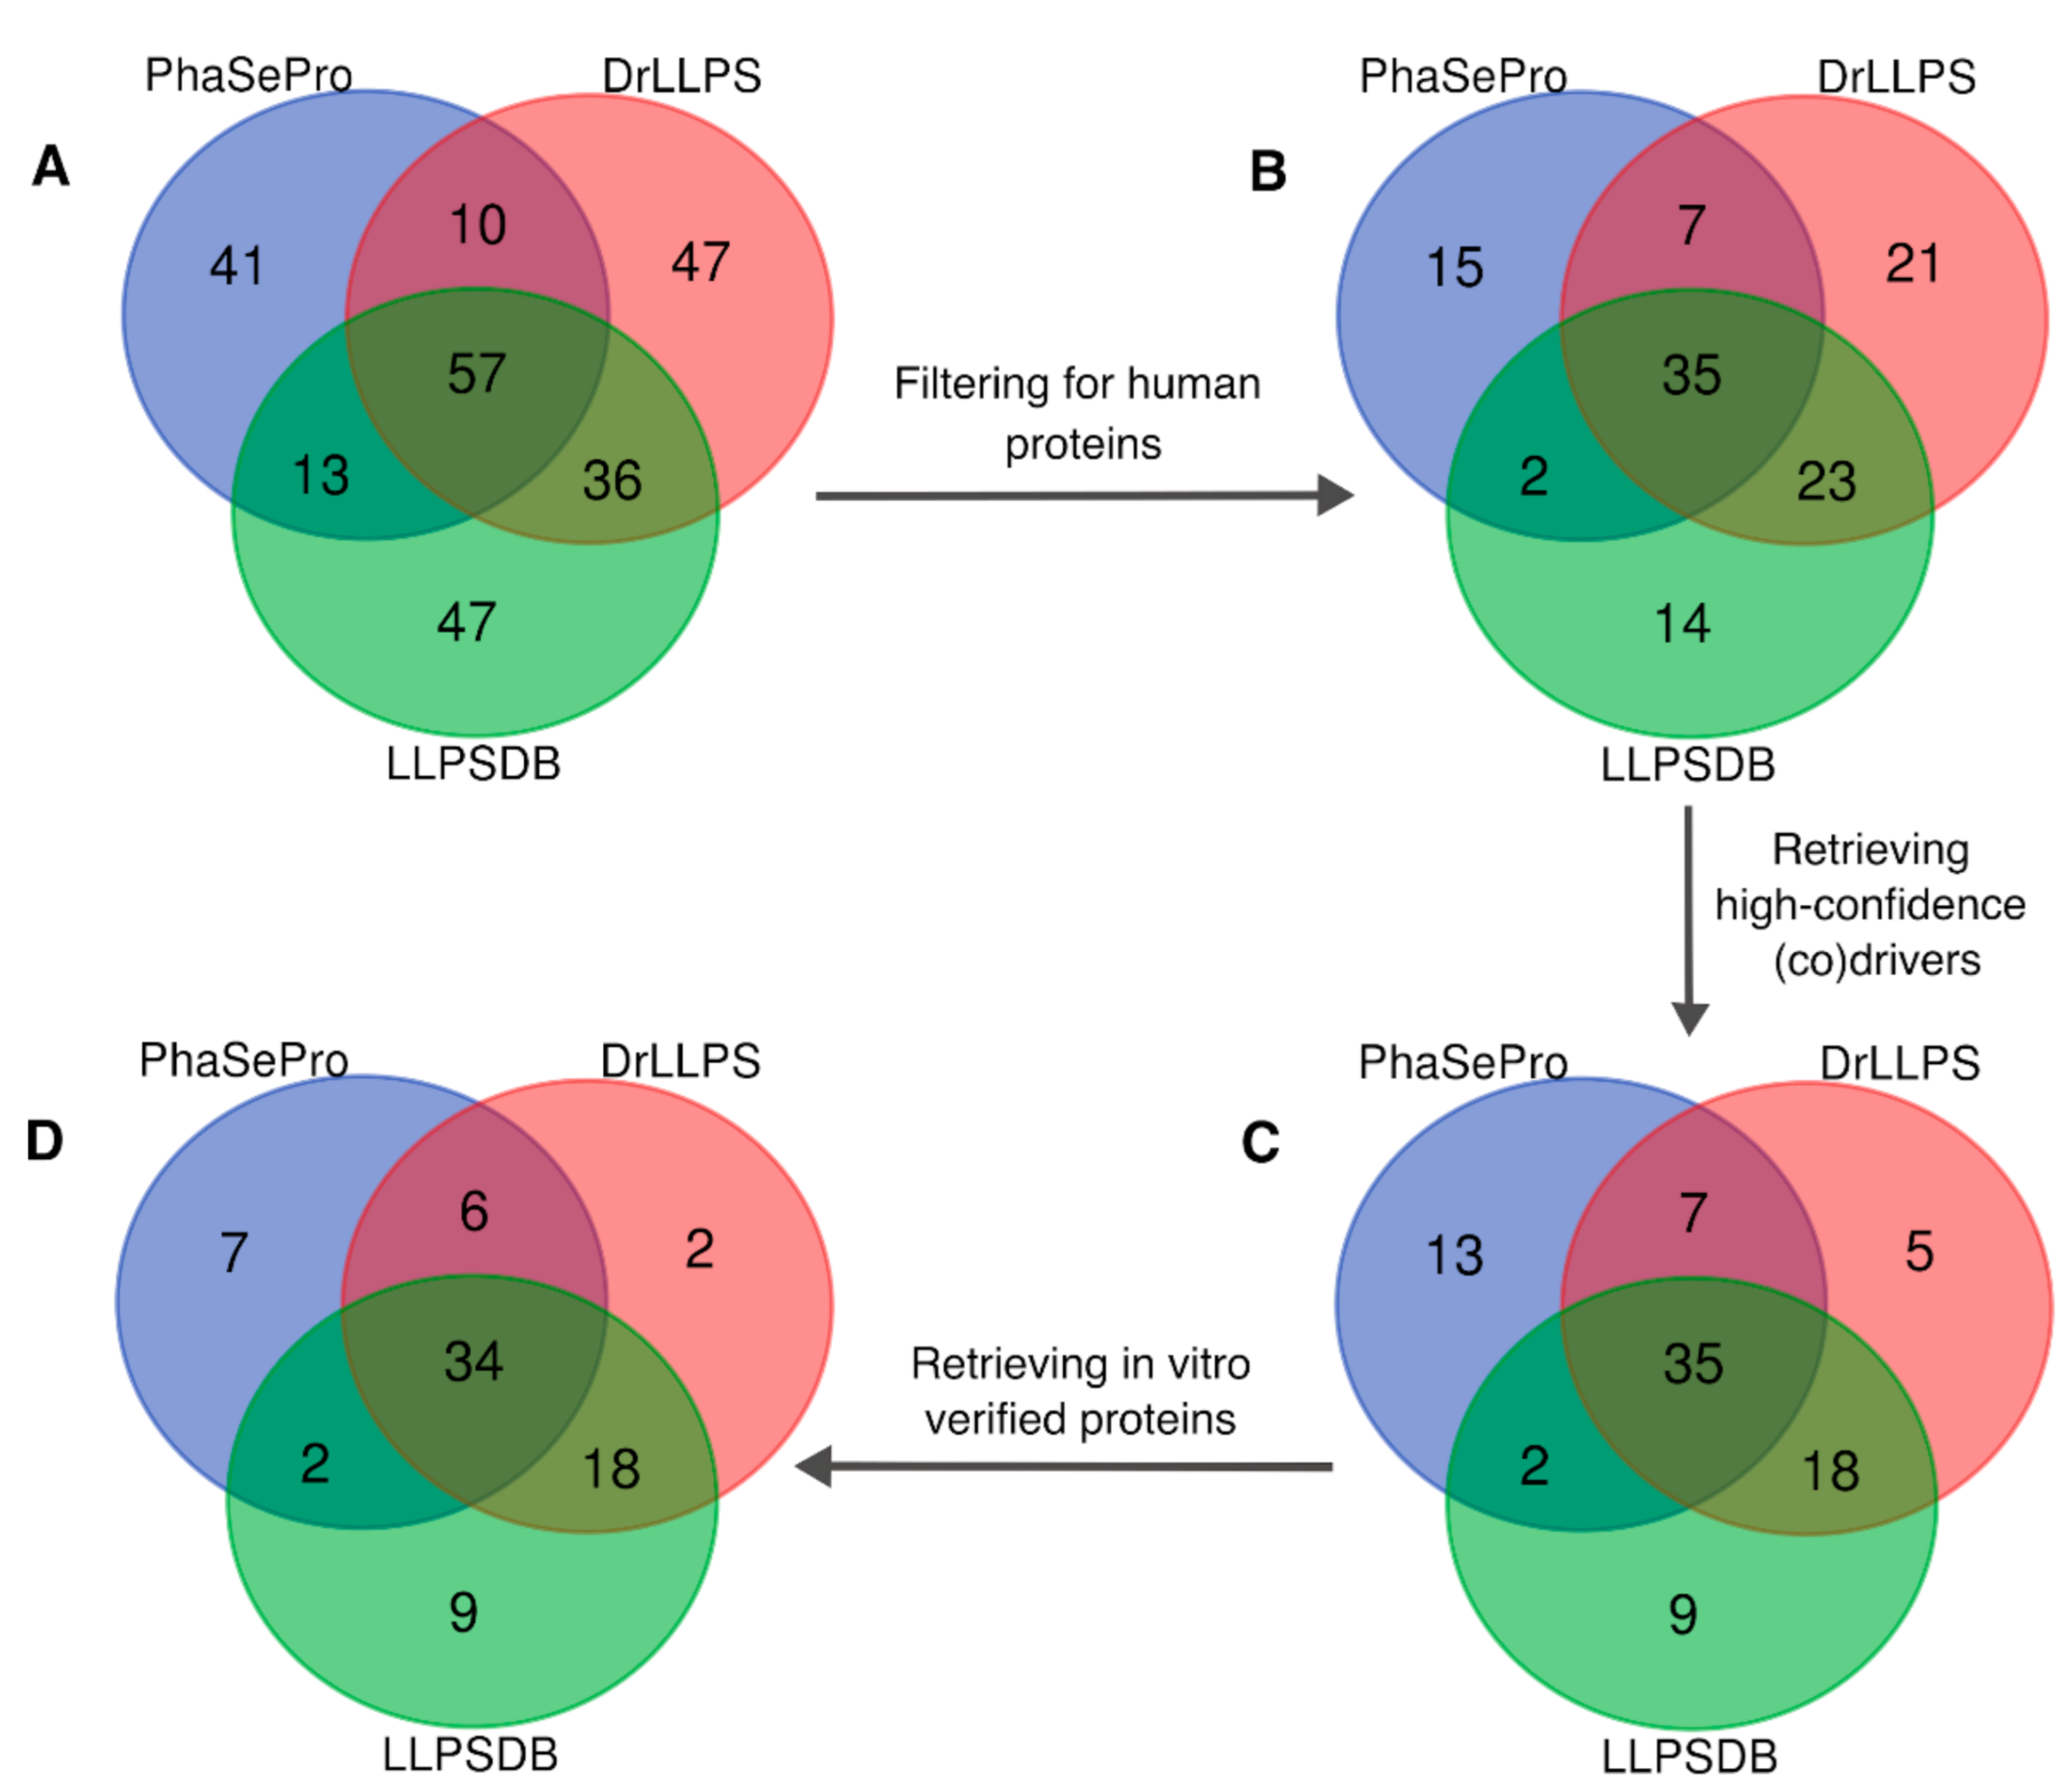
2.4. A Consolidated Dataset of Human LLPS Driver Proteins
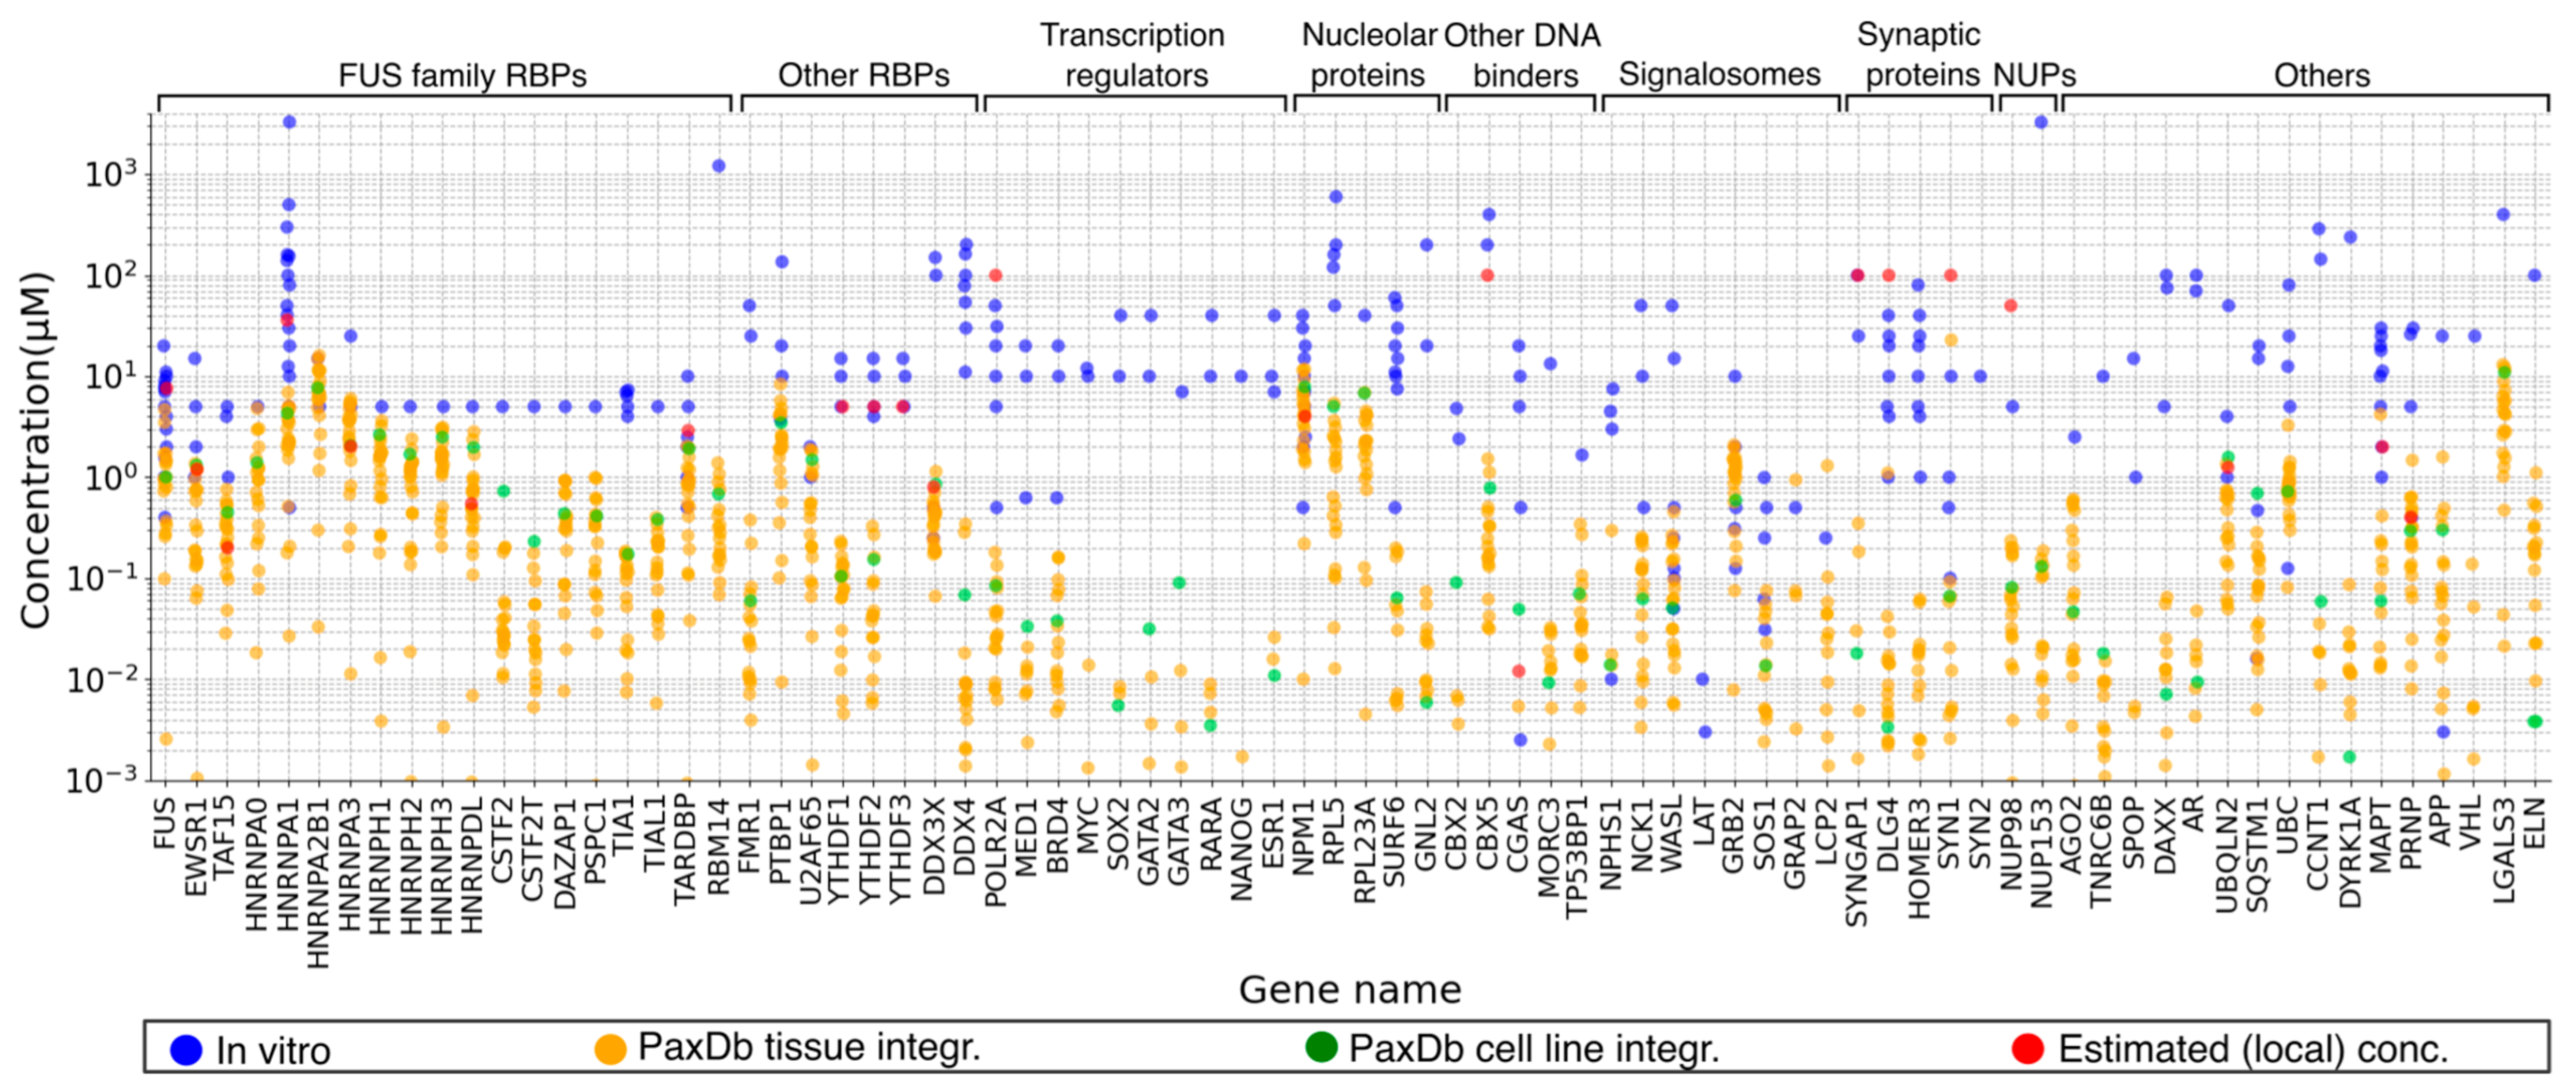
2.5. Concentrations of LLPS Driver Proteins
2.6. Protein Concentrations: An Elusive Parameter in Both In Vitro and In Vivo LLPS Studies
2.6.1. Uncertainties Associated with Current Cellular Protein Abundance Measures
2.6.2. Local Concentrations of LLPS Driver Proteins in Cellular Niches Define Their Phase Diagrams, but What about Measuring Them?
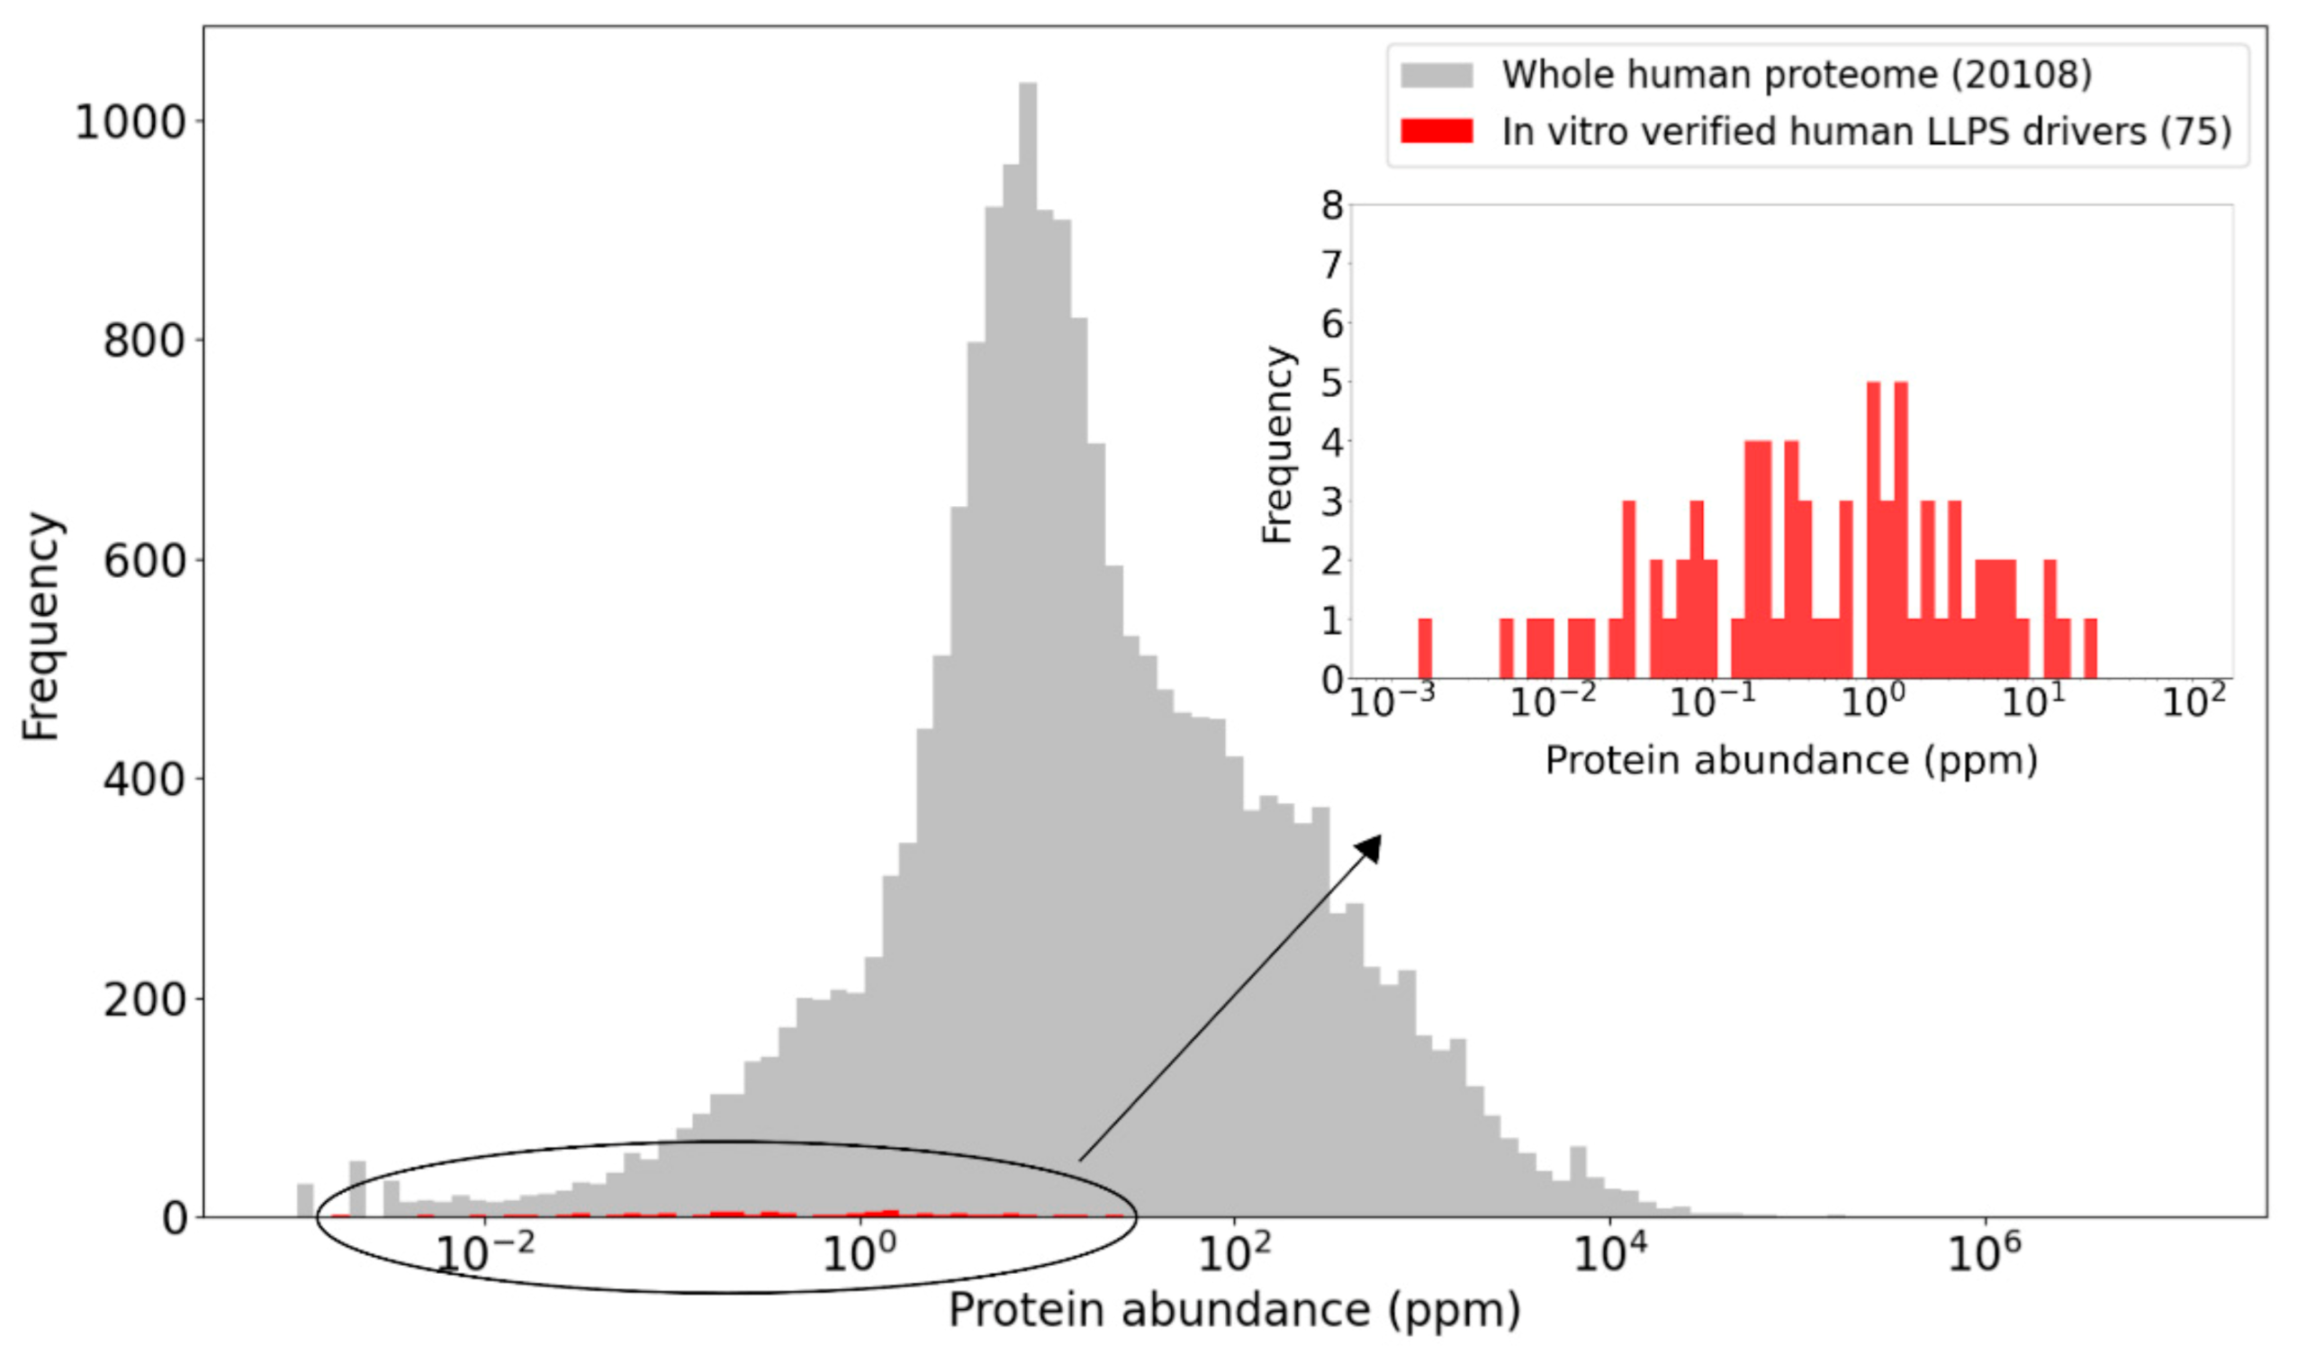
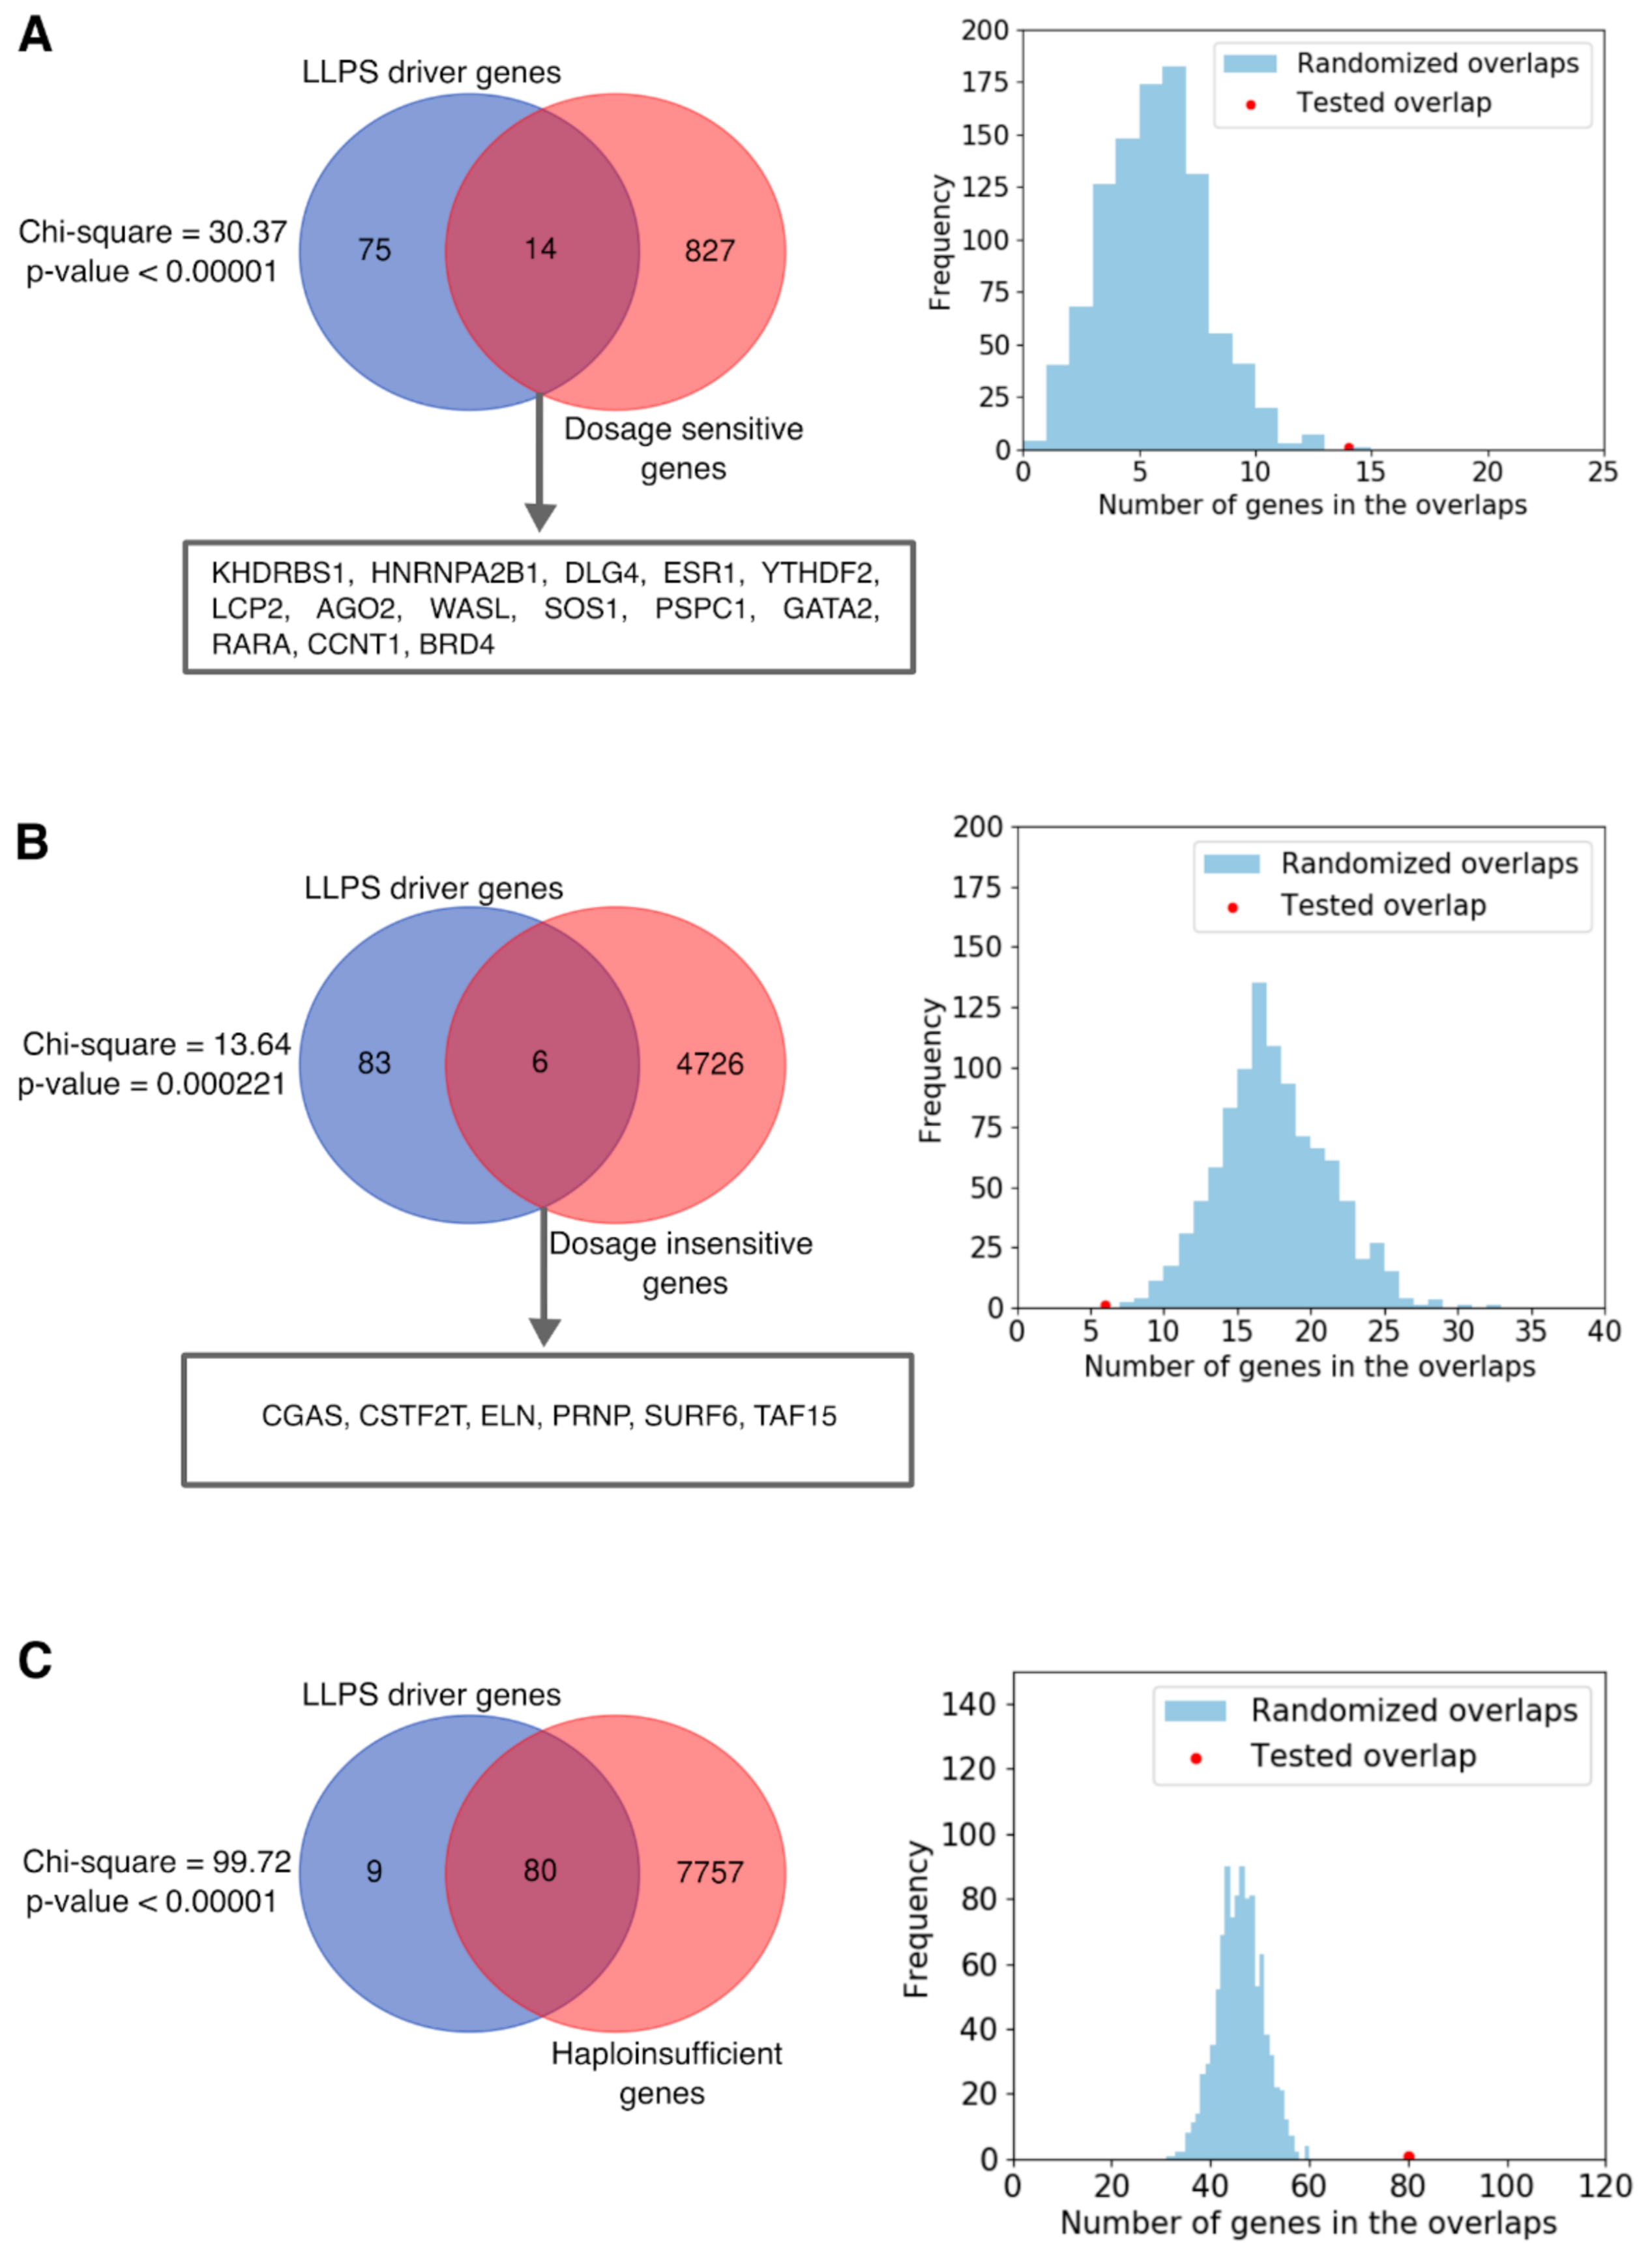
2.7. Dosage Sensitivity of LLPS Driver Genes
3. Methods
3.1. Analysis of the Overlap between LLPS Databases
3.2. Consolidation of the Human LLPS Driver Protein Dataset
3.3. Obtaining, Converting, and Comparing Protein Concentration and Cellular Abundance Values from Different Sources
3.4. Dosage Sensitivity Enrichment Analyses
3.5. Data Analysis and Representation Software Tools
4. Conclusions
Supplementary Materials
Author Contributions
Funding
Institutional Review Board Statement
Informed Consent Statement
Data Availability Statement
Conflicts of Interest
References
- Falahati, H.; Haji-Akbari, A. Thermodynamically driven assemblies and liquid–liquid phase separations in biology. Soft Matter. 2019, 15, 1135–1154. [Google Scholar] [CrossRef] [Green Version]
- Alberti, S. The wisdom of crowds: Regulating cell function through condensed states of living matter. J. Cell Sci. 2017, 130, 2789–2796. [Google Scholar] [CrossRef] [Green Version]
- Alberti, S.; Gladfelter, A.; Mittag, T. Considerations and Challenges in Studying Liquid-Liquid Phase Separation and Biomolecular Condensates. Cell. 2019, 176, 419–434. [Google Scholar] [CrossRef] [PubMed] [Green Version]
- Pancsa, R.; Schad, E.; Tantos, A.; Tompa, P. Emergent functions of proteins in non-stoichiometric supramolecular assemblies. Biochim Biophys Acta Proteins Proteom. 2019. [Google Scholar] [CrossRef] [Green Version]
- Li, X.-H.; Chavali, P.L.; Pancsa, R.; Chavali, S.; Babu, M.M. Function and Regulation of Phase-Separated Biological Condensates. Biochemistry 2018, 57, 2452–2461. [Google Scholar] [CrossRef] [PubMed]
- Banani, S.F.; Lee, H.O.; Hyman, A.A.; Rosen, M.K. Biomolecular condensates: Organizers of cellular biochemistry. Nat. Rev. Mol. Cell Biol. 2017, 285–298. [Google Scholar] [CrossRef]
- Al-Husini, N.; Tomares, D.T.; Bitar, O.; Childers, W.S.; Schrader, J.M. α-Proteobacterial RNA Degradosomes Assemble Liquid-Liquid Phase-Separated RNP Bodies. Mol. Cell. 2018, 71, 1027–1039.e14. [Google Scholar] [CrossRef] [Green Version]
- Nikolic, J.; Le Bars, R.; Lama, Z.; Scrima, N.; Lagaudrière-Gesbert, C.; Gaudin, Y.; Blondel, D. Negri bodies are viral factories with properties of liquid organelles. Nat. Commun. 2017, 8, 58. [Google Scholar] [CrossRef] [PubMed] [Green Version]
- Hamill, D.R.; Severson, A.F.; Carter, J.C.; Bowerman, B. Centrosome maturation and mitotic spindle assembly in C. elegans require SPD-5, a protein with multiple coiled-coil domains. Dev. Cell. 2002, 3, 673–684. [Google Scholar] [CrossRef] [Green Version]
- Zeng, M.; Shang, Y.; Araki, Y.; Guo, T.; Huganir, R.L.; Zhang, M. Phase Transition in Postsynaptic Densities Underlies Formation of Synaptic Complexes and Synaptic Plasticity. Cell 2016, 166, 1163–1175.e12. [Google Scholar] [CrossRef] [Green Version]
- Sheu-Gruttadauria, J.; MacRae, I.J. Phase Transitions in the Assembly and Function of Human miRISC. Cell 2018, 73, 946–957.e16. [Google Scholar] [CrossRef] [PubMed]
- Nott, T.J.; Craggs, T.D.; Baldwin, A.J. Membraneless organelles can melt nucleic acid duplexes and act as biomolecular filters. Nat. Chem. 2016, 8, 569–575. [Google Scholar] [CrossRef] [PubMed]
- Lee, C.F.; Brangwynne, C.P.; Gharakhani, J.; Hyman, A.A.; Jülicher, F. Spatial organization of the cell cytoplasm by position-dependent phase separation. Phys. Rev. Lett. 2013, 111, 088101. [Google Scholar] [CrossRef] [Green Version]
- Mészáros, B.; Erdős, G.; Szabó, B.; Schád, É.; Tantos, Á.; Abukhairan, R.; Horváth, T.; Murvai, N.; Kovács, O.P.; Kovács, M.; et al. PhaSePro: The database of proteins driving liquid-liquid phase separation. Nucleic Acids Res. 2020, 48, D360–D367. [Google Scholar] [CrossRef]
- Azaldegui, C.A.; Vecchiarelli, A.G.; Biteen, J.S. The emergence of phase separation as an organizing principle in bacteria. Biophys. J. 2020. [Google Scholar] [CrossRef]
- Strom, A.R.; Brangwynne, C.P. The liquid nucleome—phase transitions in the nucleus at a glance. J. Cell Sci. 2019, 132. [Google Scholar] [CrossRef] [Green Version]
- Brangwynne, C.P.; Eckmann, C.R.; Courson, D.S.; Rybarska, A.; Hoege, C.; Gharakhani, J.; Jülicher, F.; Hyman, A.A. Germline P granules are liquid droplets that localize by controlled dissolution/condensation. Science 2009, 324, 1729–1732. [Google Scholar] [CrossRef] [PubMed]
- Brangwynne, C.P.; Mitchison, T.J.; Hyman, A.A. Active liquid-like behavior of nucleoli determines their size and shape in Xenopus laevis oocytes. Proc. Natl. Acad. Sci. USA 2011, 108, 4334–4339. [Google Scholar] [CrossRef] [PubMed] [Green Version]
- Mitrea, D.M.; Chandra, B.; Ferrolino, M.C.; Gibbs, E.B.; Tolbert, M.; White, M.R.; Kriwacki, R.W. Methods for Physical Characterization of Phase-Separated Bodies and Membrane-less Organelles. J. Mol. Biol. 2018, 430, 4773–4805. [Google Scholar] [CrossRef] [PubMed]
- Shin, Y.; Brangwynne, C.P. Liquid phase condensation in cell physiology and disease. Science 2017, 357. [Google Scholar] [CrossRef] [Green Version]
- Murakami, T.; Qamar, S.; Lin, J.Q.; Schierle, G.S.K.; Rees, E.; Miyashita, A.; Costa, A.R.; Dodd, R.B.; Chan, F.T.; Michel, C.H.; et al. ALS/FTD Mutation-Induced Phase Transition of FUS Liquid Droplets and Reversible Hydrogels into Irreversible Hydrogels Impairs RNP Granule Function. Neuron 2015, 88, 678–690. [Google Scholar] [CrossRef] [Green Version]
- Guo, L.; Kim, H.J.; Wang, H.; Monaghan, J.; Freyermuth, F.; Sung, J.C.; O’Donovan, K.; Fare, C.M.; Diaz, Z.; Singh, N.; et al. Nuclear-Import Receptors Reverse Aberrant Phase Transitions of RNA-Binding Proteins with Prion-like Domains. Cell 2018, 173, 677–692.e20. [Google Scholar] [CrossRef] [PubMed] [Green Version]
- Alberti, S.; Hyman, A.A. Biomolecular condensates at the nexus of cellular stress, protein aggregation disease and ageing. Nat. Rev. Mol. Cell Biol. 2021, 22, 196–213. [Google Scholar] [CrossRef] [PubMed]
- Zbinden, A.; Pérez-Berlanga, M.; De Rossi, P.; Polymenidou, M. Phase Separation and Neurodegenerative Diseases: A Disturbance in the Force. Dev. Cell. 2020, 55, 45–68. [Google Scholar] [CrossRef] [PubMed]
- Alberti, S.; Dormann, D. Liquid-Liquid Phase Separation in Disease. Annu. Rev. Genet. 2019, 53, 171–194. [Google Scholar] [CrossRef] [Green Version]
- Gui, X.; Luo, F.; Li, Y.; Zhou, H.; Qin, Z.; Liu, Z.; Gu, J.; Xie, M.; Zhao, K.; Dai, B.; et al. Structural basis for reversible amyloids of hnRNPA1 elucidates their role in stress granule assembly. Nat. Commun. 2019, 10, 2006. [Google Scholar] [CrossRef] [Green Version]
- Patel, A.; Lee, H.O.; Jawerth, L.; Maharana, S.; Jahnel, M.; Hein, M.Y.; Stoynov, S.; Mahamid, J.; Saha, S.; Franzmann, T.M.; et al. A Liquid-to-Solid Phase Transition of the ALS Protein FUS Accelerated by Disease Mutation. Cell 2015, 162, 1066–1077. [Google Scholar] [CrossRef] [Green Version]
- Mann, J.R.; Gleixner, A.M.; Mauna, J.C.; Gomes, E.; DeChellis-Marks, M.R.; Needham, P.G.; Copley, K.E.; Hurtle, B.; Portz, B.; Pyles, N.J.; et al. RNA Binding Antagonizes Neurotoxic Phase Transitions of TDP-43. Neuron 2019, 102, 321–338.e8. [Google Scholar] [CrossRef] [Green Version]
- Han, T.W.; Kato, M.; Xie, S.; Wu, L.C.; Mirzaei, H.; Pei, J.; Chen, M.; Xie, Y.; Allen, J.; Xiao, G.; et al. Cell-free formation of RNA granules: Bound RNAs identify features and components of cellular assemblies. Cell 2012, 149, 768–779. [Google Scholar] [CrossRef] [Green Version]
- Chen, Y.-C.M.; Kappel, C.; Beaudouin, J.; Eils, R.; Spector, D.L. Live cell dynamics of promyelocytic leukemia nuclear bodies upon entry into and exit from mitosis. Mol. Biol Cell. 2008, 19, 3147–3162. [Google Scholar] [CrossRef] [Green Version]
- Kostylev, M.A.; Tuttle, M.D.; Lee, S.; Klein, L.E.; Takahashi, H.; Cox, T.O.; Gunther, E.C.; Zilm, K.W.; Strittmatter, S.M. Liquid and Hydrogel Phases of PrP Linked to Conformation Shifts and Triggered by Alzheimer’s Amyloid-β Oligomers. Mol. Cell. 2018, 72, 426–443.e12. [Google Scholar] [CrossRef] [PubMed] [Green Version]
- Boeynaems, S.; Alberti, S.; Fawzi, N.L.; Mittag, T.; Polymenidou, M.; Rousseau, F.; Schymkowitz, J.; Shorter, J.; Wolozin, B.; Bosch, L.V.D.; et al. Protein Phase Separation: A New Phase in Cell Biology. Trends Cell Biol. 2018, 28, 420–435. [Google Scholar] [CrossRef] [PubMed] [Green Version]
- Mittag, T.; Parker, R. Multiple Modes of Protein–Protein Interactions Promote RNP Granule Assembly. J. Mol. Biol. 2018, 430, 4636–4649. [Google Scholar] [CrossRef] [PubMed]
- Roden, C.; Gladfelter, A.S. RNA contributions to the form and function of biomolecular condensates. Nat. Rev. Mol. Cell Biol. 2020. [Google Scholar] [CrossRef] [PubMed]
- Langdon, E.M.; Qiu, Y.; Niaki, A.G.; McLaughlin, G.A.; Weidmann, C.A.; Gerbich, T.M.; Smith, J.A.; Crutchley, J.M.; Termini, C.M.; Weeks, K.M.; et al. mRNA structure determines specificity of a polyQ-driven phase separation. Science 2018, 360, 922–927. [Google Scholar] [CrossRef] [Green Version]
- Zhang, H.; Elbaum-Garfinkle, S.; Langdon, E.M.; Taylor, N.; Occhipinti, P.; Bridges, A.A.; Brangwynne, C.P.; Gladfelter, A.S. RNA Controls PolyQ Protein Phase Transitions. Mol. Cell. 2015, 60, 220–230. [Google Scholar] [CrossRef] [PubMed] [Green Version]
- Hanazawa, M.; Yonetani, M.; Sugimoto, A. PGL proteins self associate and bind RNPs to mediate germ granule assembly in C. elegans. J. Cell Biol. 2011, 192, 929–937. [Google Scholar] [CrossRef] [PubMed] [Green Version]
- Tsang, B.; Arsenault, J.; Vernon, R.M.; Lin, H.; Sonenberg, N.; Wang, L.-Y.; Bah, A.; Forman-Kay, J.D. Phosphoregulated FMRP phase separation models activity-dependent translation through bidirectional control of mRNA granule formation. Proc. Natl. Acad. Sci. USA 2019, 116, 4218–4227. [Google Scholar] [CrossRef] [Green Version]
- Wang, J.; Choi, J.-M.; Holehouse, A.S.; Lee, H.O.; Zhang, X.; Jahnel, M.; Maharana, S.; Lemaitre, R.; Pozniakovsky, A.; Drechsel, D.; et al. A Molecular Grammar Governing the Driving Forces for Phase Separation of Prion-like RNA Binding Proteins. Cell 2018, 174, 688–699.e16. [Google Scholar] [CrossRef] [Green Version]
- Vernon, R.M.; Chong, P.A.; Tsang, B.; Kim, T.H.; Bah, A.; Farber, P.; Lin, H.; Forman-Kay, J.D. Pi-Pi contacts are an overlooked protein feature relevant to phase separation. Elife 2018, 7. [Google Scholar] [CrossRef]
- Bratek-Skicki, A.; Pancsa, R.; Meszaros, B.; Van Lindt, J.; Tompa, P. A guide to regulation of the formation of biomolecular condensates. FEBS J. 2020, 287, 1924–1935. [Google Scholar] [CrossRef] [PubMed] [Green Version]
- Yoo, H.; Triandafillou, C.; Drummond, D.A. Cellular sensing by phase separation: Using the process, not just the products. J. Biol. Chem. 2019, 294, 7151–7159. [Google Scholar] [CrossRef] [Green Version]
- Söding, J.; Zwicker, D.; Sohrabi-Jahromi, S.; Boehning, M.; Kirschbaum, J. Mechanisms for Active Regulation of Biomolecular Condensates. Trends Cell Biol. 2020, 30, 4–14. [Google Scholar] [CrossRef]
- Owen, I.; Shewmaker, F. The Role of Post-Translational Modifications in the Phase Transitions of Intrinsically Disordered Proteins. Int. J. Mol. Sci. 2019, 20, 5501. [Google Scholar] [CrossRef] [Green Version]
- Snead, W.T.; Gladfelter, A.S. The Control Centers of Biomolecular Phase Separation: How Membrane Surfaces, PTMs, and Active Processes Regulate Condensation. Mol. Cell. 2019, 76, 295–305. [Google Scholar] [CrossRef]
- Willadsen, K.; Mohamad, N.; Bodén, M. NSort/DB: An intranuclear compartment protein database. Genom. Proteom. Bioinform. 2012, 10, 226–229. [Google Scholar] [CrossRef] [PubMed] [Green Version]
- Nunes, C.; Mestre, I.; Marcelo, A.; Koppenol, R.; Matos, C.A.; Nóbrega, C. MSGP: The first database of the protein components of the mammalian stress granules. Database. 2019, 2019. [Google Scholar] [CrossRef] [PubMed] [Green Version]
- Youn, J.-Y.; Dyakov, B.J.; Zhang, J.; Knight, J.D.; Vernon, R.M.; Forman-Kay, J.D.; Gingras, A.-C. Properties of Stress Granule and P-Body Proteomes. Mol. Cell. 2019, 76, 286–294. [Google Scholar] [CrossRef] [PubMed]
- Li, Q.; Peng, X.; Li, Y.; Tang, W.; Zhu, J.A.; Huang, J.; Qi, Y.; Zhang, Z. LLPSDB: A database of proteins undergoing liquid-liquid phase separation in vitro. Nucleic Acids Res. 2020, 48, D320–D327. [Google Scholar] [CrossRef]
- Ning, W.; Guo, Y.; Lin, S.; Mei, B.; Wu, Y.; Jiang, P.; Tan, X.; Zhang, W.; Chen, G.; Peng, D.; et al. DrLLPS: A data resource of liquid-liquid phase separation in eukaryotes. Nucleic Acids Res. 2020, 48, D288–D295. [Google Scholar] [CrossRef]
- You, K.; Huang, Q.; Yu, C.; Shen, B.; Sevilla, C.; Shi, M.; Hermjakob, H.; Chen, Y.; Li, T. PhaSepDB: A database of liquid-liquid phase separation related proteins. Nucleic Acids Res. 2020, 48, D354–D359. [Google Scholar] [CrossRef] [PubMed]
- Li, Q.; Wang, X.; Dou, Z.; Yang, W.; Huang, B.; Lou, J.; Zhang, Z. Protein Databases Related to Liquid-Liquid Phase Separation. Int. J. Mol. Sci. 2020, 21, 6796. [Google Scholar] [CrossRef]
- Pancsa, R.; Vranken, W.; Mészáros, B. Computational resources for identifying and describing proteins driving liquid-liquid phase separation. Brief. Bioinform. 2021. [Google Scholar] [CrossRef] [PubMed]
- Turinsky, A.L.; Razick, S.; Turner, B.; Donaldson, I.M.; Wodak, S.J. Literature curation of protein interactions: Measuring agreement across major public databases. Database 2010, 2010, baq026. [Google Scholar] [CrossRef] [Green Version]
- Turinsky, A.L.; Razick, S.; Turner, B.; Donaldson, I.M.; Wodak, S.J. Interaction databases on the same page. Nat. Biotechnol. 2011, 29, 391–393. [Google Scholar] [CrossRef]
- Sudeep, B.; Ditlev, J.A.; Hui, E.; Xing, W.; Banjade, S.; Okrut, J.; King, D.S.; Taunton, J.; Rosen, M.K.; Vale, R.D. Phase separation of signaling molecules promotes T cell receptor signal transduction. Science 2016, 352, 595–599. [Google Scholar]
- Mitrea, D.M.; A Cika, J.; Guy, C.S.; Ban, D.; Banerjee, P.R.; Stanley, C.B.; Nourse, A.; A Deniz, A.; Kriwacki, R.W. Nucleophosmin integrates within the nucleolus via multi-modal interactions with proteins displaying R-rich linear motifs and rRNA. Elife 2016, 5. [Google Scholar] [CrossRef]
- Bouchard, J.J.; Otero, J.H.; Scott, D.C.; Szulc, E.; Martin, E.W.; Sabri, N.; Granata, D.; Marzahn, M.R.; Lindorff-Larsen, K.; Salvatella, X.; et al. Cancer Mutations of the Tumor Suppressor SPOP Disrupt the Formation of Active, Phase-Separated Compartments. Mol. Cell. 2018, 72, 19–36.e8. [Google Scholar] [CrossRef] [Green Version]
- Banani, S.F.; Rice, A.M.; Peeples, W.B.; Lin, Y.; Jain, S.; Parker, R.; Rosen, M.K. Compositional Control of Phase-Separated Cellular Bodies. Cell 2016, 166, 651–663. [Google Scholar] [CrossRef] [Green Version]
- Bolognesi, B.; Gotor, N.L.; Dhar, R.; Cirillo, D.; Baldrighi, M.; Tartaglia, G.G.; Lehner, B. A Concentration-Dependent Liquid Phase Separation Can Cause Toxicity upon Increased Protein Expression. Cell Rep. 2016, 16, 222–231. [Google Scholar] [CrossRef] [Green Version]
- Cinar, S.; Cinar, H.; Chan, H.S.; Winter, R. Pressure-Sensitive and Osmolyte-Modulated Liquid-Liquid Phase Separation of Eye-Lens γ-Crystallins. J. Am. Chem Soc. 2019, 141, 7347–7354. [Google Scholar] [CrossRef]
- Kato, M.; Han, T.W.; Xie, S.; Shi, K.; Du, X.; Wu, L.C.; Mirzaei, H.; Goldsmith, E.J.; Longgood, J.; Pei, J.; et al. Cell-free formation of RNA granules: Low complexity sequence domains form dynamic fibers within hydrogels. Cell 2012, 149, 753–767. [Google Scholar] [CrossRef] [PubMed] [Green Version]
- Boija, A.; Klein, I.A.; Sabari, B.R.; Dall’Agnese, A.; Coffey, E.L.; Zamudio, A.V.; Li, C.H.; Shrinivas, K.; Manteiga, J.C.; Hannett, N.M.; et al. Transcription Factors Activate Genes through the Phase-Separation Capacity of Their Activation Domains. Cell 2018, 175, 1842–1855.e16. [Google Scholar] [CrossRef] [PubMed] [Green Version]
- Ying, Y.; Wang, X.-J.; Vuong, C.K.; Lin, C.-H.; Damianov, A.; Black, D.L. Splicing Activation by Rbfox Requires Self-Aggregation through Its Tyrosine-Rich Domain. Cell 2017, 170, 312–323.e10. [Google Scholar] [CrossRef] [Green Version]
- Lin, Y.; Protter, D.S.W.; Rosen, M.K.; Parker, R. Formation and Maturation of Phase-Separated Liquid Droplets by RNA-Binding Proteins. Mol. Cell. 2015, 60, 208–219. [Google Scholar] [CrossRef] [Green Version]
- Wang, M.; Herrmann, C.J.; Simonovic, M.; Szklarczyk, D.; von Mering, C. Version 4.0 of PaxDb: Protein abundance data, integrated across model organisms, tissues, and cell-lines. Proteomics 2015, 15, 3163–3168. [Google Scholar] [CrossRef] [Green Version]
- Milo, R. What is the total number of protein molecules per cell volume? A call to rethink some published values. Bioessays 2013, 35, 1050–1055. [Google Scholar] [CrossRef] [Green Version]
- Hennig, S.; Kong, G.; Mannen, T.; Sadowska, A.; Kobelke, S.; Blythe, A.; Knott, G.J.; Iyer, K.S.; Ho, D.; Newcombe, E.A.; et al. Prion-like domains in RNA binding proteins are essential for building subnuclear paraspeckles. J. Cell Biol. 2015, 210, 529–539. [Google Scholar] [CrossRef]
- Milles, S.; Lemke, E.A. Single molecule study of the intrinsically disordered FG-repeat nucleoporin 153. Biophys. J. 2011, 101, 1710–1719. [Google Scholar] [CrossRef] [Green Version]
- Lu, H.; Yu, D.; Hansen, A.S.; Ganguly, S.; Liu, R.; Heckert, A.; Darzacq, X.; Zhou, Q. Phase-separation mechanism for C-terminal hyperphosphorylation of RNA polymerase II. Nature 2018, 558, 318–323. [Google Scholar] [CrossRef]
- Lee, H.Y.; Kim, E.G.; Jung, H.R.; Jung, J.W.; Kim, H.B.; Cho, J.W.; Kim, K.M.; Yi, E.C. Refinements of LC-MS/MS Spectral Counting Statistics Improve Quantification of Low Abundance Proteins. Sci. Rep. 2019, 9, 13653. [Google Scholar] [CrossRef] [Green Version]
- Lundgren, D.H.; Hwang, S.-I.; Wu, L.; Han, D.K. Role of spectral counting in quantitative proteomics. Expert Rev. Proteom. 2010, 7, 39–53. [Google Scholar] [CrossRef]
- Smaczniak, C.; Li, N.; Boeren, S.; America, T.; Van Dongen, W.; Goerdayal, S.S.; De Vries, S.; Angenent, G.C.; Kaufmann, K. Proteomics-based identification of low-abundance signaling and regulatory protein complexes in native plant tissues. Nat. Protoc. 2012, 7, 2144–2158. [Google Scholar] [CrossRef] [PubMed]
- Stergachis, A.B.; MacLean, B.; Lee, K.; Stamatoyannopoulos, J.A.; MacCoss, M.J. Rapid empirical discovery of optimal peptides for targeted proteomics. Nat. Methods 2011, 8, 1041–1043. [Google Scholar] [CrossRef] [Green Version]
- Alfonso-Garrido, J.; Garcia-Calvo, E.; Luque-Garcia, J.L. Sample preparation strategies for improving the identification of membrane proteins by mass spectrometry. Anal. Bioanal Chem. 2015, 407, 4893–4905. [Google Scholar] [CrossRef]
- Zeng, M.; Bai, G.; Zhang, M. Anchoring high concentrations of SynGAP at postsynaptic densities via liquid-liquid phase separation. Small GTPases 2019, 10, 296–304. [Google Scholar] [CrossRef]
- Ding, C.; Chan, D.W.; Liu, W.; Liu, M.; Li, D.; Song, L.; Li, C.; Jin, J.; Malovannaya, A.; Jung, S.Y.; et al. Proteome-wide profiling of activated transcription factors with a concatenated tandem array of transcription factor response elements. Proc. Natl. Acad. Sci. USA 2013, 110, 6771–6776. [Google Scholar] [CrossRef] [Green Version]
- Wierer, M.; Mann, M. Proteomics to study DNA-bound and chromatin-associated gene regulatory complexes. Hum. Mol. Genet. 2016, 25, R106–R114. [Google Scholar] [CrossRef]
- Trinidad, J.C.; Thalhammer, A.; Specht, C.G.; Lynn, A.J.; Baker, P.R.; Schoepfer, R.; Burlingame, A.L. Quantitative analysis of synaptic phosphorylation and protein expression. Mol. Cell Proteom. 2008, 7, 684–696. [Google Scholar] [CrossRef] [Green Version]
- Collins, M.O.; Yu, L.; Coba, M.P.; Husi, H.; Campuzano, I.; Blackstock, W.P.; Choudhary, J.S.; Grant, S.G.N. Proteomic analysis of in vivo phosphorylated synaptic proteins. J. Biol. Chem. 2005, 280, 5972–5982. [Google Scholar] [CrossRef] [Green Version]
- Levy, E.D.; Kowarzyk, J.; Michnick, S.W. High-resolution mapping of protein concentration reveals principles of proteome architecture and adaptation. Cell Rep. 2014, 7, 1333–1340. [Google Scholar] [CrossRef] [Green Version]
- Boisvert, F.-M.; Lam, Y.W.; Lamont, D.; Lamond, A.I. A quantitative proteomics analysis of subcellular proteome localization and changes induced by DNA damage. Mol. Cell Proteom. 2010, 9, 457–470. [Google Scholar] [CrossRef] [Green Version]
- Gatto, L.; Breckels, L.M.; Lilley, K.S. Assessing sub-cellular resolution in spatial proteomics experiments. Curr. Opin. Chem. Biol. 2019, 48, 123–149. [Google Scholar] [CrossRef]
- Holt, C.E.; Martin, K.C.; Schuman, E.M. Local translation in neurons: Visualization and function. Nat. Struct. Mol. Biol. 2019, 26, 557–566. [Google Scholar] [CrossRef] [PubMed]
- Cajigas, I.J.; Tushev, G.; Will, T.J.; tom Dieck, S.; Fuerst, N.; Schuman, E.M. The local transcriptome in the synaptic neuropil revealed by deep sequencing and high-resolution imaging. Neuron 2012, 74, 453–466. [Google Scholar] [CrossRef] [Green Version]
- Wilhelm, B.G.; Mandad, S.; Truckenbrodt, S.; Kröhnert, K.; Schäfer, C.; Rammner, B.; Koo, S.J.; Classen, G.A.; Krauss, M.; Haucke, V.; et al. Composition of isolated synaptic boutons reveals the amounts of vesicle trafficking proteins. Science 2014, 344, 1023–1028. [Google Scholar] [CrossRef] [Green Version]
- Sugiyama, Y.; Kawabata, I.; Sobue, K.; Okabe, S. Determination of absolute protein numbers in single synapses by a GFP-based calibration technique. Nat. Methods 2005, 2, 677–684. [Google Scholar] [CrossRef]
- Weatheritt, R.J.; Gibson, T.J.; Babu, M.M. Asymmetric mRNA localization contributes to fidelity and sensitivity of spatially localized systems. Nat. Struct. Mol. Biol. 2014, 21, 833–839. [Google Scholar] [CrossRef] [Green Version]
- Tari, M.; Manceau, V.; de Matha Salone, J.; Kobayashi, A.; Pastré, D.; Maucuer, A. U2AF assemblies drive sequence-specific splice site recognition. EMBO Rep. 2019, 20, e47604. [Google Scholar] [CrossRef]
- Ries, R.J.; Zaccara, S.; Klein, P.; Olarerin-George, A.; Namkoong, S.; Pickering, B.F.; Patil, D.P.; Kwak, H.; Lee, J.H.; Jaffrey, S.R. mA enhances the phase separation potential of mRNA. Nature 2019, 571, 424–428. [Google Scholar] [CrossRef] [PubMed]
- Wang, M.; Tao, X.; Jacob, M.D.; Bennett, C.A.; Ho, J.D.; Gonzalgo, M.L.; Audas, T.E.; Lee, S. Stress-Induced Low Complexity RNA Activates Physiological Amyloidogenesis. Cell Rep. 2018, 24, 1713–1721.e4. [Google Scholar] [CrossRef] [Green Version]
- Boehning, M.; Dugast-Darzacq, C.; Rankovic, M.; Hansen, A.S.; Yu, T.; Marie-Nelly, H.; McSwiggen, D.T.; Kokic, G.; Dailey, G.M.; Cramer, P.; et al. RNA polymerase II clustering through carboxy-terminal domain phase separation. Nat. Struct. Mol. Biol. 2018, 25, 833–840. [Google Scholar] [CrossRef]
- Zhang, Y.; Bertulat, B.; Tencer, A.H.; Ren, X.; Wright, G.M.; Black, J.; Cardoso, M.C.; Kutateladze, T.G. MORC3 Forms Nuclear Condensates through Phase Separation. iScience 2019, 17, 182–189. [Google Scholar] [CrossRef] [Green Version]
- Nair, S.J.; Yang, L.; Meluzzi, D.; Oh, S.; Yang, F.; Friedman, M.J.; Wang, S.; Suter, T.; Alshareedah, I.; Gamliel, A.; et al. Phase separation of ligand-activated enhancers licenses cooperative chromosomal enhancer assembly. Nat. Struct. Mol. Biol. 2019, 26, 193–203. [Google Scholar] [CrossRef] [PubMed]
- Schmidt, H.B.; Görlich, D. Nup98 FG domains from diverse species spontaneously phase-separate into particles with nuclear pore-like permselectivity. Elife 2015, 4. [Google Scholar] [CrossRef]
- Shrinivas, K.; Sabari, B.R.; Coffey, E.L.; Klein, I.A.; Boija, A.; Zamudio, A.V.; Schuijers, J.; Hannett, N.M.; Sharp, P.A.; Young, R.A.; et al. Enhancer Features that Drive Formation of Transcriptional Condensates. Mol. Cell. 2019, 75, 549–561.e7. [Google Scholar] [CrossRef]
- Xie, Y.; Sun, J.; Han, X.; Turšić-Wunder, A.; Toh, J.D.W.; Hong, W.; Gao, Y.-G.; Miao, Y. Polarisome scaffolder Spa2-mediated macromolecular condensation of Aip5 for actin polymerization. Nat. Commun. 2019, 10, 5078. [Google Scholar] [CrossRef] [PubMed] [Green Version]
- Trivedi, P.; Palomba, F.; Niedzialkowska, E.; Digman, M.A.; Gratton, E.; Stukenberg, P.T. The inner centromere is a biomolecular condensate scaffolded by the chromosomal passenger complex. Nat. Cell Biol. 2019, 21, 1127–1137. [Google Scholar] [CrossRef] [Green Version]
- Maharana, S.; Wang, J.; Papadopoulos, D.K.; Richter, D.; Pozniakovsky, A.; Poser, I.; Bickle, M.; Rizk, S.; Guillén-Boixet, J.; Franzmann, T.M.; et al. RNA buffers the phase separation behavior of prion-like RNA binding proteins. Science 2018, 360, 918–921. [Google Scholar] [CrossRef] [PubMed] [Green Version]
- Riback, J.A.; Zhu, L.; Ferrolino, M.C.; Tolbert, M.; Mitrea, D.M.; Sanders, D.W.; Wei, M.-T.; Kriwacki, R.W.; Brangwynne, C.P. Composition-dependent thermodynamics of intracellular phase separation. Nature 2020, 581, 209–214. [Google Scholar] [CrossRef]
- Beutel, O.; Maraspini, R.; Pombo-García, K.; Martin-Lemaitre, C.; Honigmann, A. Phase Separation of Zonula Occludens Proteins Drives Formation of Tight Junctions. Cell 2019, 179, 923–936.e11. [Google Scholar] [CrossRef] [PubMed]
- Milovanovic, D.; Wu, Y.; Bian, X.; De Camilli, P. A liquid phase of synapsin and lipid vesicles. Science 2018, 361, 604–607. [Google Scholar] [CrossRef] [Green Version]
- Zhang, Y.; Li, Z.; Chen, N.; Huang, Y.; Huang, S. Phase separation of Arabidopsis EMB1579 controls transcription, mRNA splicing, and development. PLoS Biol. 2020, 18, e3000782. [Google Scholar] [CrossRef] [PubMed]
- Rebane, A.A.; Ziltener, P.; LaMonica, L.C.; Bauer, A.H.; Zheng, H.; López-Montero, I.; Pincet, F.; Rothman, J.E.; Ernst, A.M. Liquid-liquid phase separation of the Golgi matrix protein GM130. FEBS Lett. 2020, 594, 1132–1144. [Google Scholar] [CrossRef] [Green Version]
- Chatterjee, M.; Pollard, T.D. The Functionally Important N-Terminal Half of Fission Yeast Mid1p Anillin Is Intrinsically Disordered and Undergoes Phase Separation. Biochemistry 2019, 58, 3031–3041. [Google Scholar] [CrossRef] [PubMed]
- Cook, P.R. The organization of replication and transcription. Science 1999, 284, 1790–1795. [Google Scholar] [CrossRef] [Green Version]
- Larson, A.G.; Elnatan, D.; Keenen, M.M.; Trnka, M.J.; Johnston, J.B.; Burlingame, A.L.; Agard, D.A.; Redding, S.; Narlikar, G.J. Liquid droplet formation by HP1α suggests a role for phase separation in heterochromatin. Nature 2017, 547, 236–240. [Google Scholar] [CrossRef] [PubMed] [Green Version]
- Molliex, A.; Temirov, J.; Lee, J.; Coughlin, M.; Kanagaraj, A.P.; Kim, H.J.; Mittag, T.; Taylor, J.P. Phase separation by low complexity domains promotes stress granule assembly and drives pathological fibrillization. Cell 2015, 163, 123–133. [Google Scholar] [CrossRef] [Green Version]
- Kaur, T.; Alshareedah, I.; Wang, W.; Ngo, J.; Moosa, M.M.; Banerjee, P.R. Molecular Crowding Tunes Material States of Ribonucleoprotein Condensates. Biomolecules 2019, 9, 71. [Google Scholar] [CrossRef] [Green Version]
- Walter, H.; Brooks, D.E. Phase separation in cytoplasm, due to macromolecular crowding, is the basis for microcompartmentation. FEBS Lett. 1995, 361, 135–139. [Google Scholar] [CrossRef] [Green Version]
- Sabari, B.R.; Dall’Agnese, A.; Boija, A.; Klein, I.A.; Coffey, E.L.; Shrinivas, K.; Abraham, B.J.; Hannett, N.M.; Zamudio, A.V.; Manteiga, J.C.; et al. Coactivator condensation at super-enhancers links phase separation and gene control. Science 2018, 361. [Google Scholar] [CrossRef] [Green Version]
- Strom, A.R.; Emelyanov, A.V.; Mir, M.; Fyodorov, D.V.; Darzacq, X.; Karpen, G.H. Phase separation drives heterochromatin domain formation. Nature 2017, 547, 241–245. [Google Scholar] [CrossRef]
- Wang, L.; Gao, Y.; Zheng, X.; Liu, C.; Dong, S.; Li, R.; Zhang, G.; Wei, Y.; Qu, H.; Li, Y.; et al. Histone Modifications Regulate Chromatin Compartmentalization by Contributing to a Phase Separation Mechanism. Mol. Cell. 2019, 76, 646–659.e6. [Google Scholar] [CrossRef]
- Du, M.; Chen, Z.J. DNA-induced liquid phase condensation of cGAS activates innate immune signaling. Science 2018, 361, 704–709. [Google Scholar] [CrossRef] [PubMed] [Green Version]
- Dao, T.P.; Kolaitis, R.-M.; Kim, H.J.; O’Donovan, K.; Martyniak, B.; Colicino, E.; Hehnly, H.; Taylor, J.P.; Castañeda, C.A. Ubiquitin Modulates Liquid-Liquid Phase Separation of UBQLN2 via Disruption of Multivalent Interactions. Mol. Cell. 2018, 69, 965–978.e6. [Google Scholar] [CrossRef] [Green Version]
- Gao, Y.; Pei, G.; Li, D.; Li, R.; Shao, Y.; Zhang, Q.C.; Li, P. Multivalent mA motifs promote phase separation of YTHDF proteins. Cell Res. 2019, 29, 767–769. [Google Scholar] [CrossRef] [PubMed]
- Schütz, S.; Nöldeke, E.R.; Sprangers, R. A synergistic network of interactions promotes the formation of in vitro processing bodies and protects mRNA against decapping. Nucleic Acids Res. 2017, 45, 6911–6922. [Google Scholar] [CrossRef] [Green Version]
- Banjade, S.; Wu, Q.; Mittal, A.; Peeples, W.B.; Pappu, R.V.; Rosen, M.K. Conserved interdomain linker promotes phase separation of the multivalent adaptor protein Nck. Proc. Natl. Acad. Sci. USA 2015, 112, E6426–E6435. [Google Scholar] [CrossRef] [PubMed] [Green Version]
- Li, P.; Banjade, S.; Cheng, H.-C.; Kim, S.; Chen, B.; Guo, L.; Llaguno, M.C.; Hollingsworth, J.V.; King, D.S.; Banani, S.F.; et al. Phase transitions in the assembly of multivalent signalling proteins. Nature 2012, 483, 336–340. [Google Scholar] [CrossRef] [PubMed]
- Gsponer, J.; Futschik, M.E.; Teichmann, S.A.; Babu, M.M. Tight Regulation of Unstructured Proteins: From Transcript Synthesis to Protein Degradation. Science 2008, 1365–1368. [Google Scholar] [CrossRef] [Green Version]
- Vavouri, T.; Semple, J.I.; Garcia-Verdugo, R.; Lehner, B. Intrinsic protein disorder and interaction promiscuity are widely associated with dosage sensitivity. Cell 2009, 138, 198–208. [Google Scholar] [CrossRef] [Green Version]
- Ni, Z.; Zhou, X.-Y.; Aslam, S.; Niu, D.-K. Characterization of Human Dosage-Sensitive Transcription Factor Genes. Front. Genet. 2019, 10, 1208. [Google Scholar] [CrossRef] [PubMed] [Green Version]
- The UniProt Consortium. UniProt: The universal protein knowledgebase. Nucleic Acids Res. 2017, 45, D158–D169. [Google Scholar] [CrossRef] [PubMed] [Green Version]
- Lek, M.; Karczewski, K.J.; Minikel, E.V.; Samocha, K.E.; Banks, E.; Fennell, T.; O’Donnell-Luria, A.H.; Ware, J.S.; Hill, A.J.; Cummings, B.B.; et al. Analysis of protein-coding genetic variation in 60,706 humans. Nature 2016, 536, 285–291. [Google Scholar] [CrossRef] [Green Version]
- Shihab, H.A.; Rogers, M.F.; Campbell, C.; Gaunt, T.R. HIPred: An integrative approach to predicting haploinsufficient genes. Bioinformatics 2017, 33, 1751–1757. [Google Scholar] [CrossRef] [Green Version]
- Makino, T.; McLysaght, A. Ohnologs in the human genome are dosage balanced and frequently associated with disease. Proc. Natl. Acad. Sci. USA 2010, 107, 9270–9274. [Google Scholar] [CrossRef] [Green Version]
- Rice, A.M.; McLysaght, A. Dosage sensitivity is a major determinant of human copy number variant pathogenicity. Nat. Commun. 2017, 8, 14366. [Google Scholar] [CrossRef] [PubMed]
- Lambert, S.A.; Jolma, A.; Campitelli, L.F.; Das, P.K.; Yin, Y.; Albu, M.; Chen, X.; Taipale, J.; Hughes, T.R.; Weirauch, M.T. The Human Transcription Factors. Cell 2018, 175, 598–599. [Google Scholar] [CrossRef] [PubMed] [Green Version]
- Gutierrez, M.G.; Malmstadt, N. Human serotonin receptor 5-HT(1A) preferentially segregates to the liquid disordered phase in synthetic lipid bilayers. J. Am. Chem Soc. 2014, 136, 13530–13533. [Google Scholar] [CrossRef] [Green Version]
- Dubreuil, B.; Matalon, O.; Levy, E.D. Protein Abundance Biases the Amino Acid Composition of Disordered Regions to Minimize Non-functional Interactions. J. Mol. Biol. 2019, 431, 4978–4992. [Google Scholar] [CrossRef]
- Wiśniewski, J.R.; Hein, M.Y.; Cox, J.; Mann, M. A “proteomic ruler” for protein copy number and concentration estimation without spike-in standards. Mol. Cell Proteom. 2014, 13, 3497–3506. [Google Scholar] [CrossRef] [PubMed] [Green Version]
- Harami, G.M.; Kovács, Z.J.; Pancsa, R.; Pálinkás, J.; Baráth, V.; Tárnok, K.; Málnási-Csizmadia, A.; Kovács, M. Phase separation by ssDNA binding protein controlled via protein-protein and protein-DNA interactions. Proc. Natl. Acad. Sci. USA 2020, 117, 26206–26217. [Google Scholar] [CrossRef]
- Cai, D.; Feliciano, D.; Dong, P.; Flores, E.; Gruebele, M.; Porat-Shliom, N.; Sukenik, S.; Liu, Z.; Lippincott-Schwartz, J. Phase separation of YAP reorganizes genome topology for long-term YAP target gene expression. Nat. Cell Biol. 2019, 21, 1578–1589. [Google Scholar] [CrossRef]
- Woodruff, J.B.; Ferreira Gomes, B.; Widlund, P.O.; Mahamid, J.; Honigmann, A.; Hyman, A.A. The Centrosome Is a Selective Condensate that Nucleates Microtubules by Concentrating Tubulin. Cell 2017, 169, 1066–1077.e10. [Google Scholar] [CrossRef] [PubMed] [Green Version]
- Lu, Y.; Wu, T.; Gutman, O.; Lu, H.; Zhou, Q.; Henis, Y.I.; Luo, K. Phase separation of TAZ compartmentalizes the transcription machinery to promote gene expression. Nat. Cell Biol. 2020, 22, 453–464. [Google Scholar] [CrossRef]
- Nott, T.J.; Petsalaki, E.; Farber, P.; Jervis, D.; Fussner, E.; Plochowietz, A.; Craggs, T.D.; Bazett-Jones, D.P.; Pawson, T.; Forman-Kay, J.D.; et al. Phase transition of a disordered nuage protein generates environmentally responsive membraneless organelles. Mol. Cell. 2015, 57, 936–947. [Google Scholar] [CrossRef] [Green Version]


Publisher’s Note: MDPI stays neutral with regard to jurisdictional claims in published maps and institutional affiliations. |
© 2021 by the authors. Licensee MDPI, Basel, Switzerland. This article is an open access article distributed under the terms and conditions of the Creative Commons Attribution (CC BY) license (http://creativecommons.org/licenses/by/4.0/).
Share and Cite
Farahi, N.; Lazar, T.; Wodak, S.J.; Tompa, P.; Pancsa, R. Integration of Data from Liquid–Liquid Phase Separation Databases Highlights Concentration and Dosage Sensitivity of LLPS Drivers. Int. J. Mol. Sci. 2021, 22, 3017. https://0-doi-org.brum.beds.ac.uk/10.3390/ijms22063017
Farahi N, Lazar T, Wodak SJ, Tompa P, Pancsa R. Integration of Data from Liquid–Liquid Phase Separation Databases Highlights Concentration and Dosage Sensitivity of LLPS Drivers. International Journal of Molecular Sciences. 2021; 22(6):3017. https://0-doi-org.brum.beds.ac.uk/10.3390/ijms22063017
Chicago/Turabian StyleFarahi, Nazanin, Tamas Lazar, Shoshana J. Wodak, Peter Tompa, and Rita Pancsa. 2021. "Integration of Data from Liquid–Liquid Phase Separation Databases Highlights Concentration and Dosage Sensitivity of LLPS Drivers" International Journal of Molecular Sciences 22, no. 6: 3017. https://0-doi-org.brum.beds.ac.uk/10.3390/ijms22063017