
Candidate Alzheimer’s Disease Biomarker miR-483-5p Lowers TAU Phosphorylation by Direct ERK1/2 Repression

 , , and
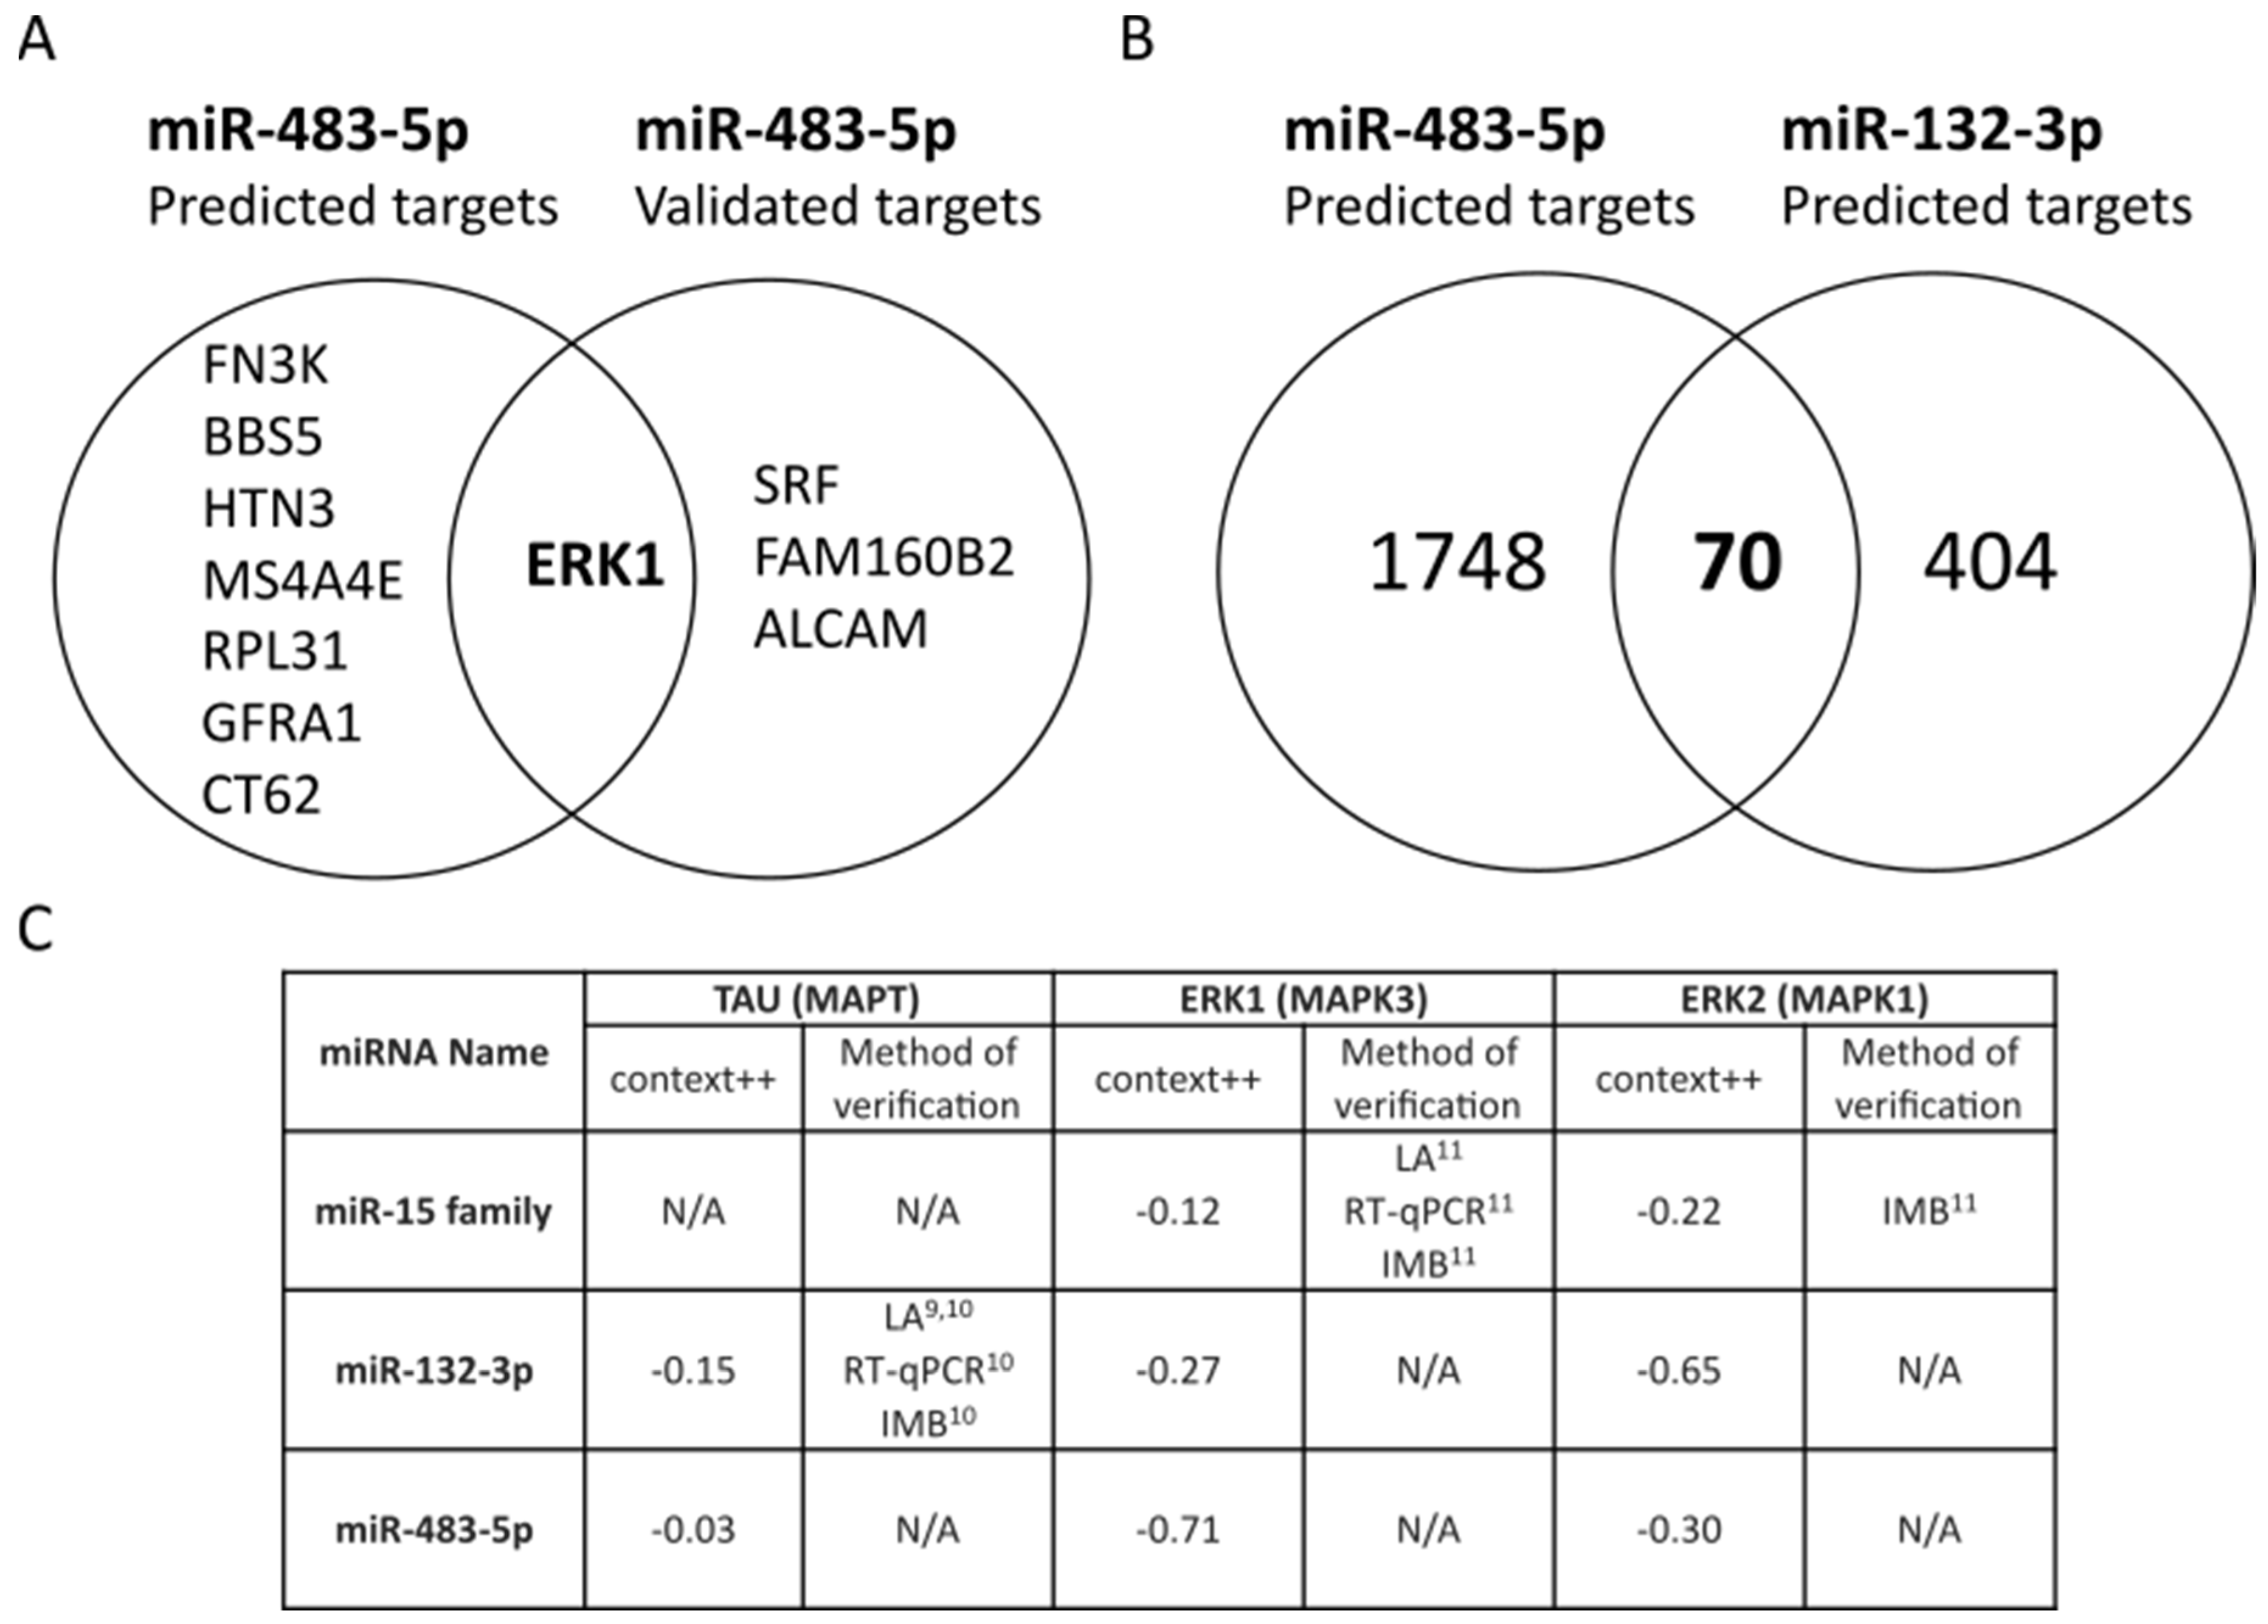
Abstract
:1. Introduction
2. Results
2.1. miR-483-5p Predicted to Target TAU, ERK1 and ERK2 Involved in Neurofibrillary Tangles (NFTs) Pathology in AD
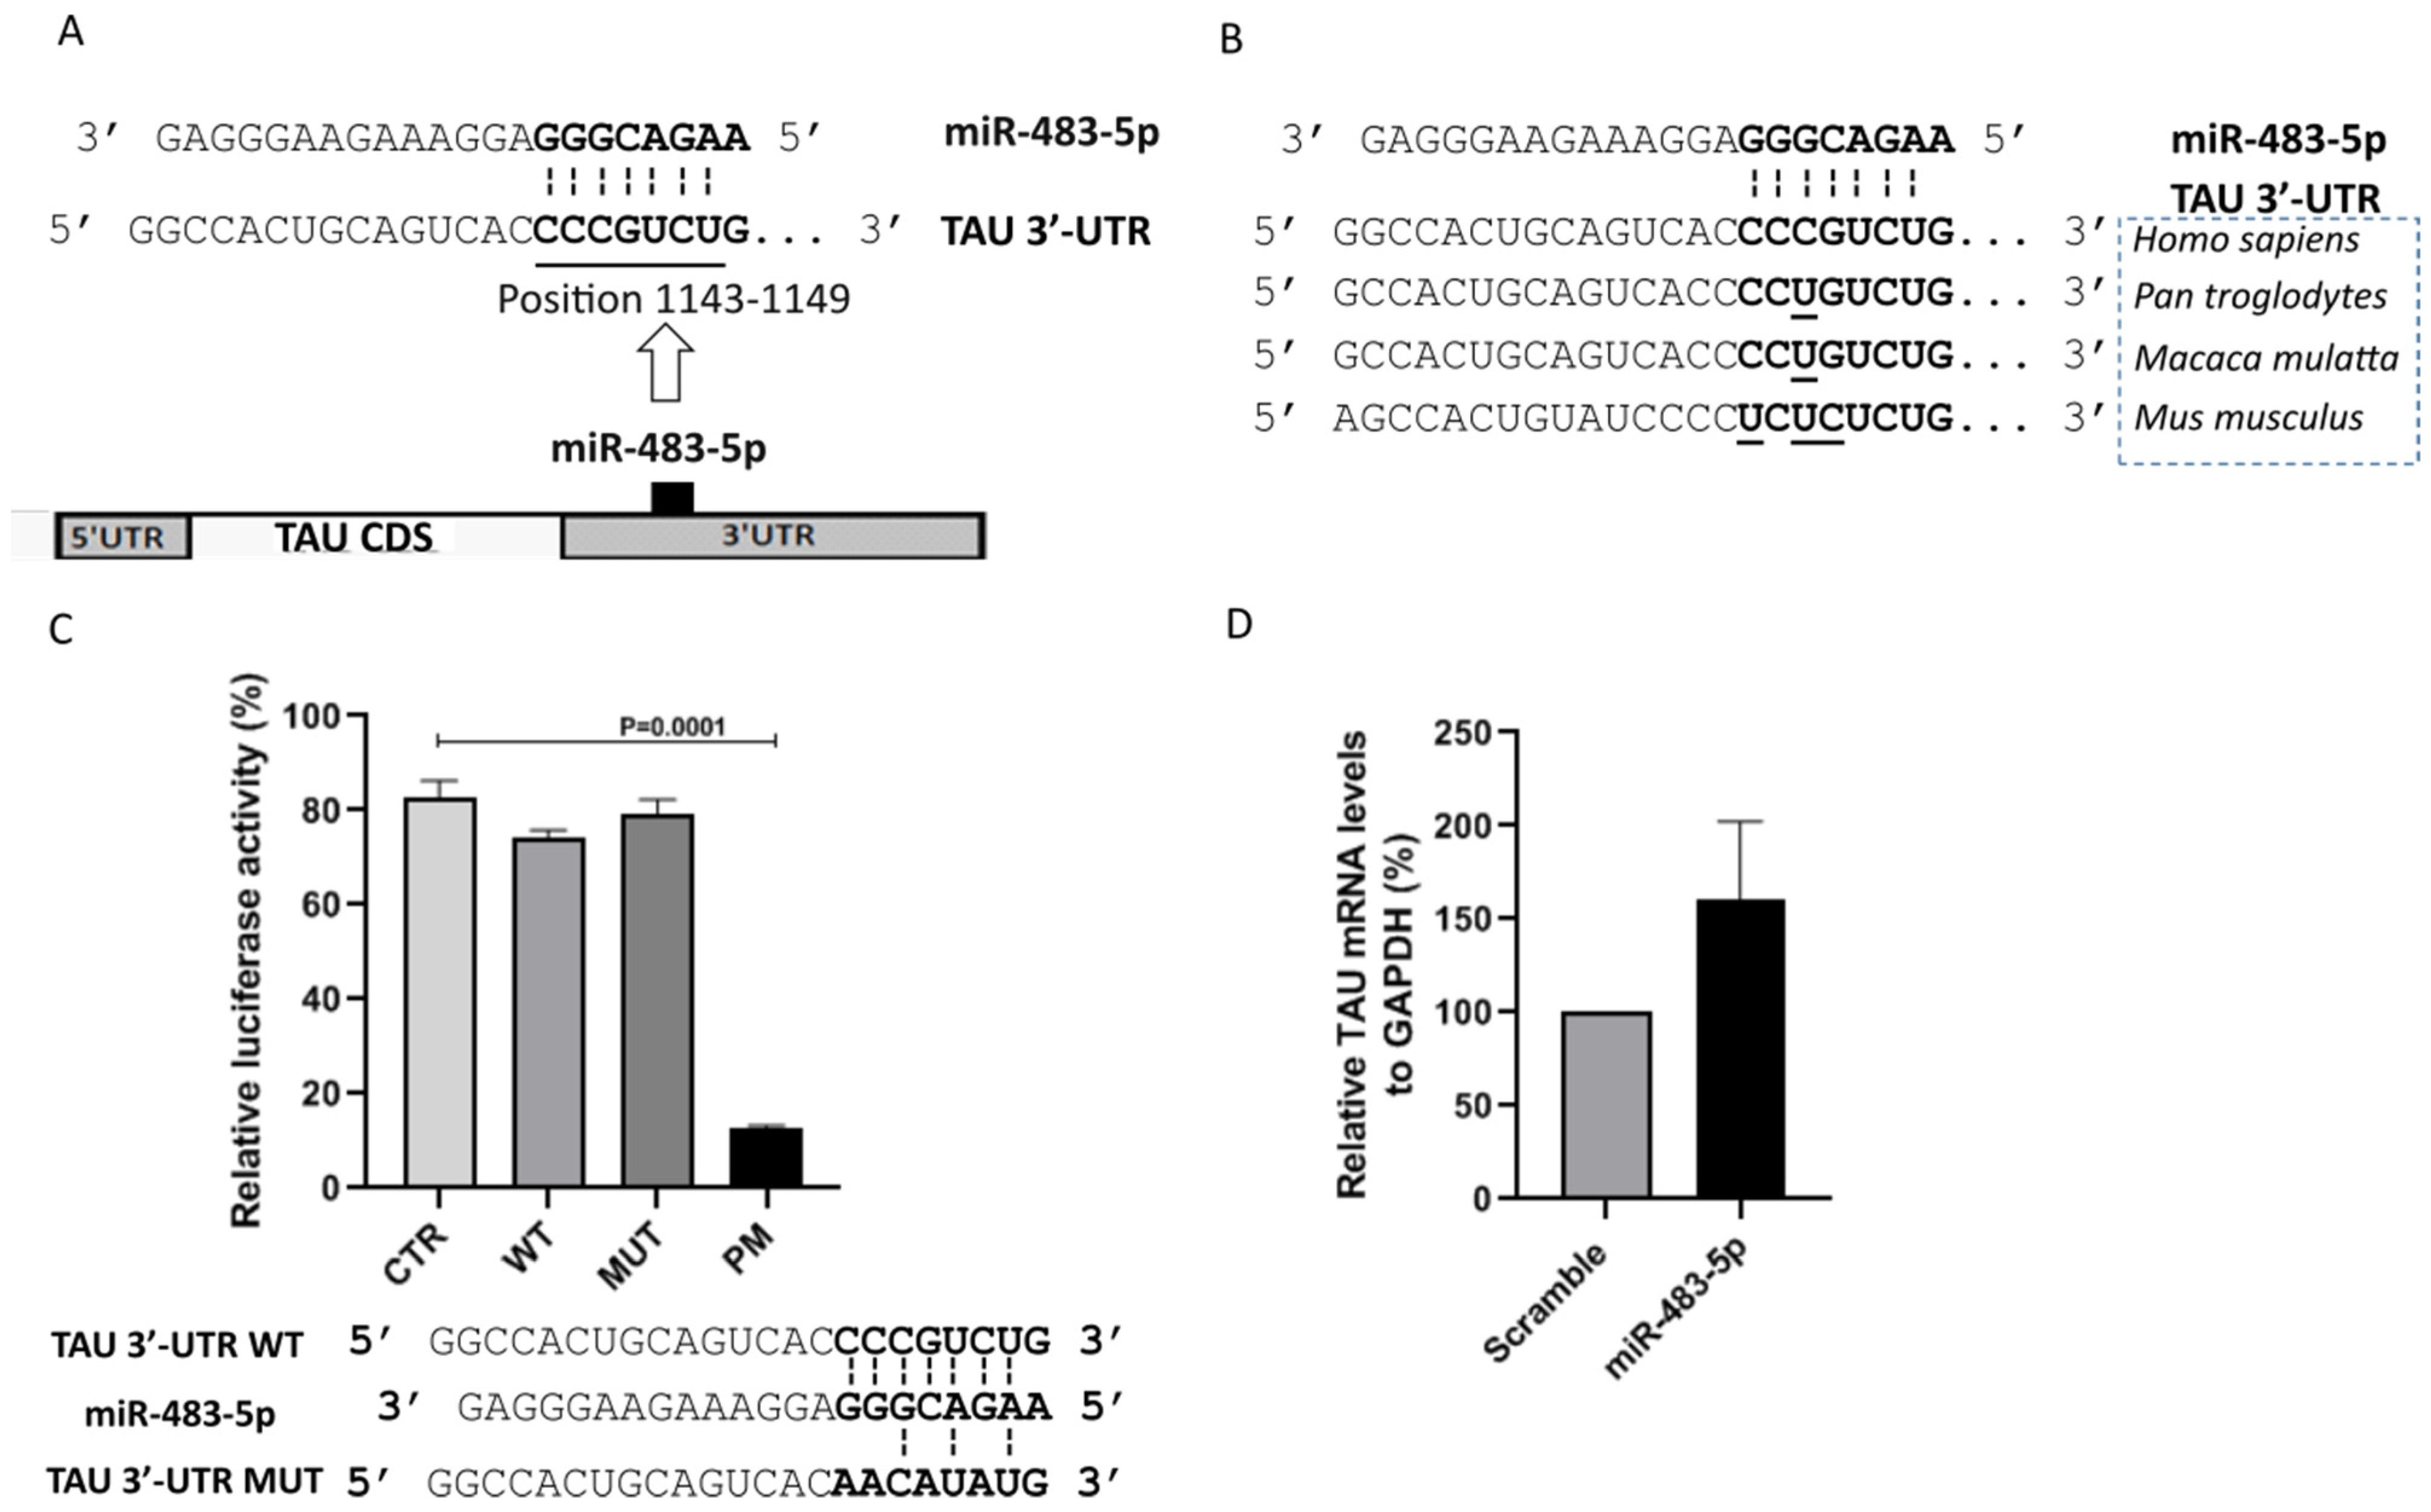
2.2. miR-483-5p Does Not Bind to TAU mRNA
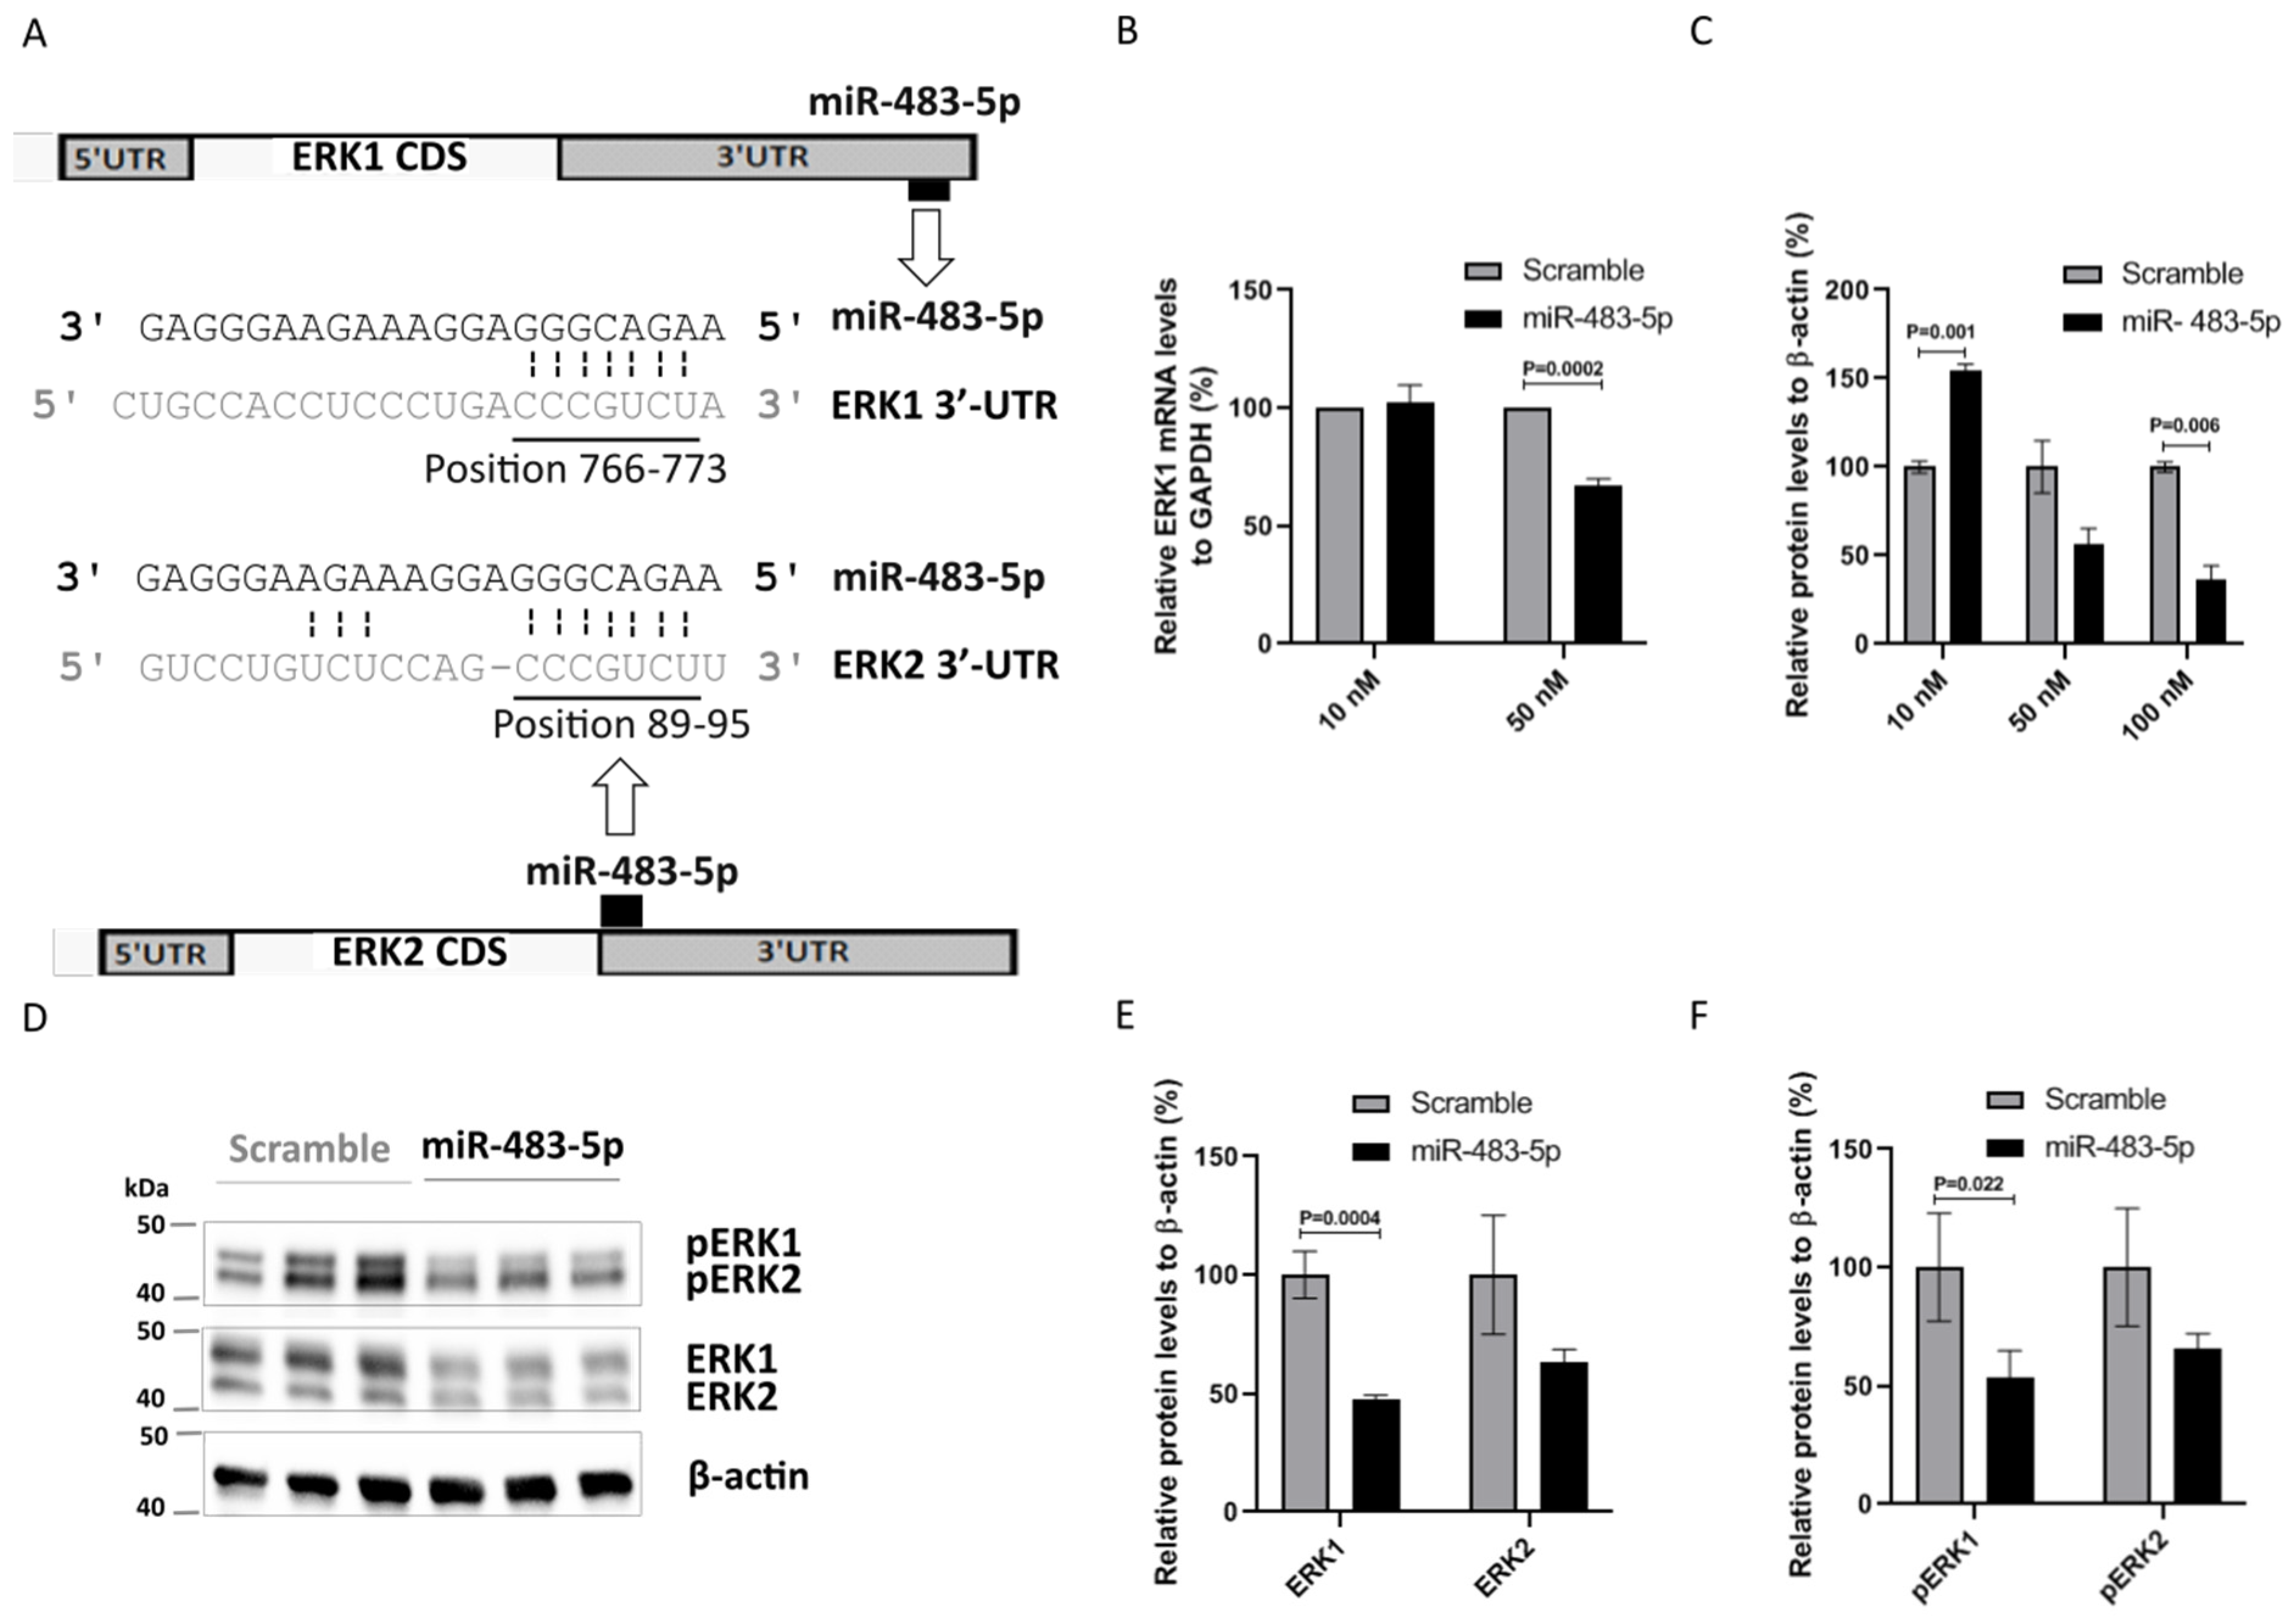
2.3. miR-483-5p Binds to ERK1 mRNA and Represses Its Expression in HEK293 Cells
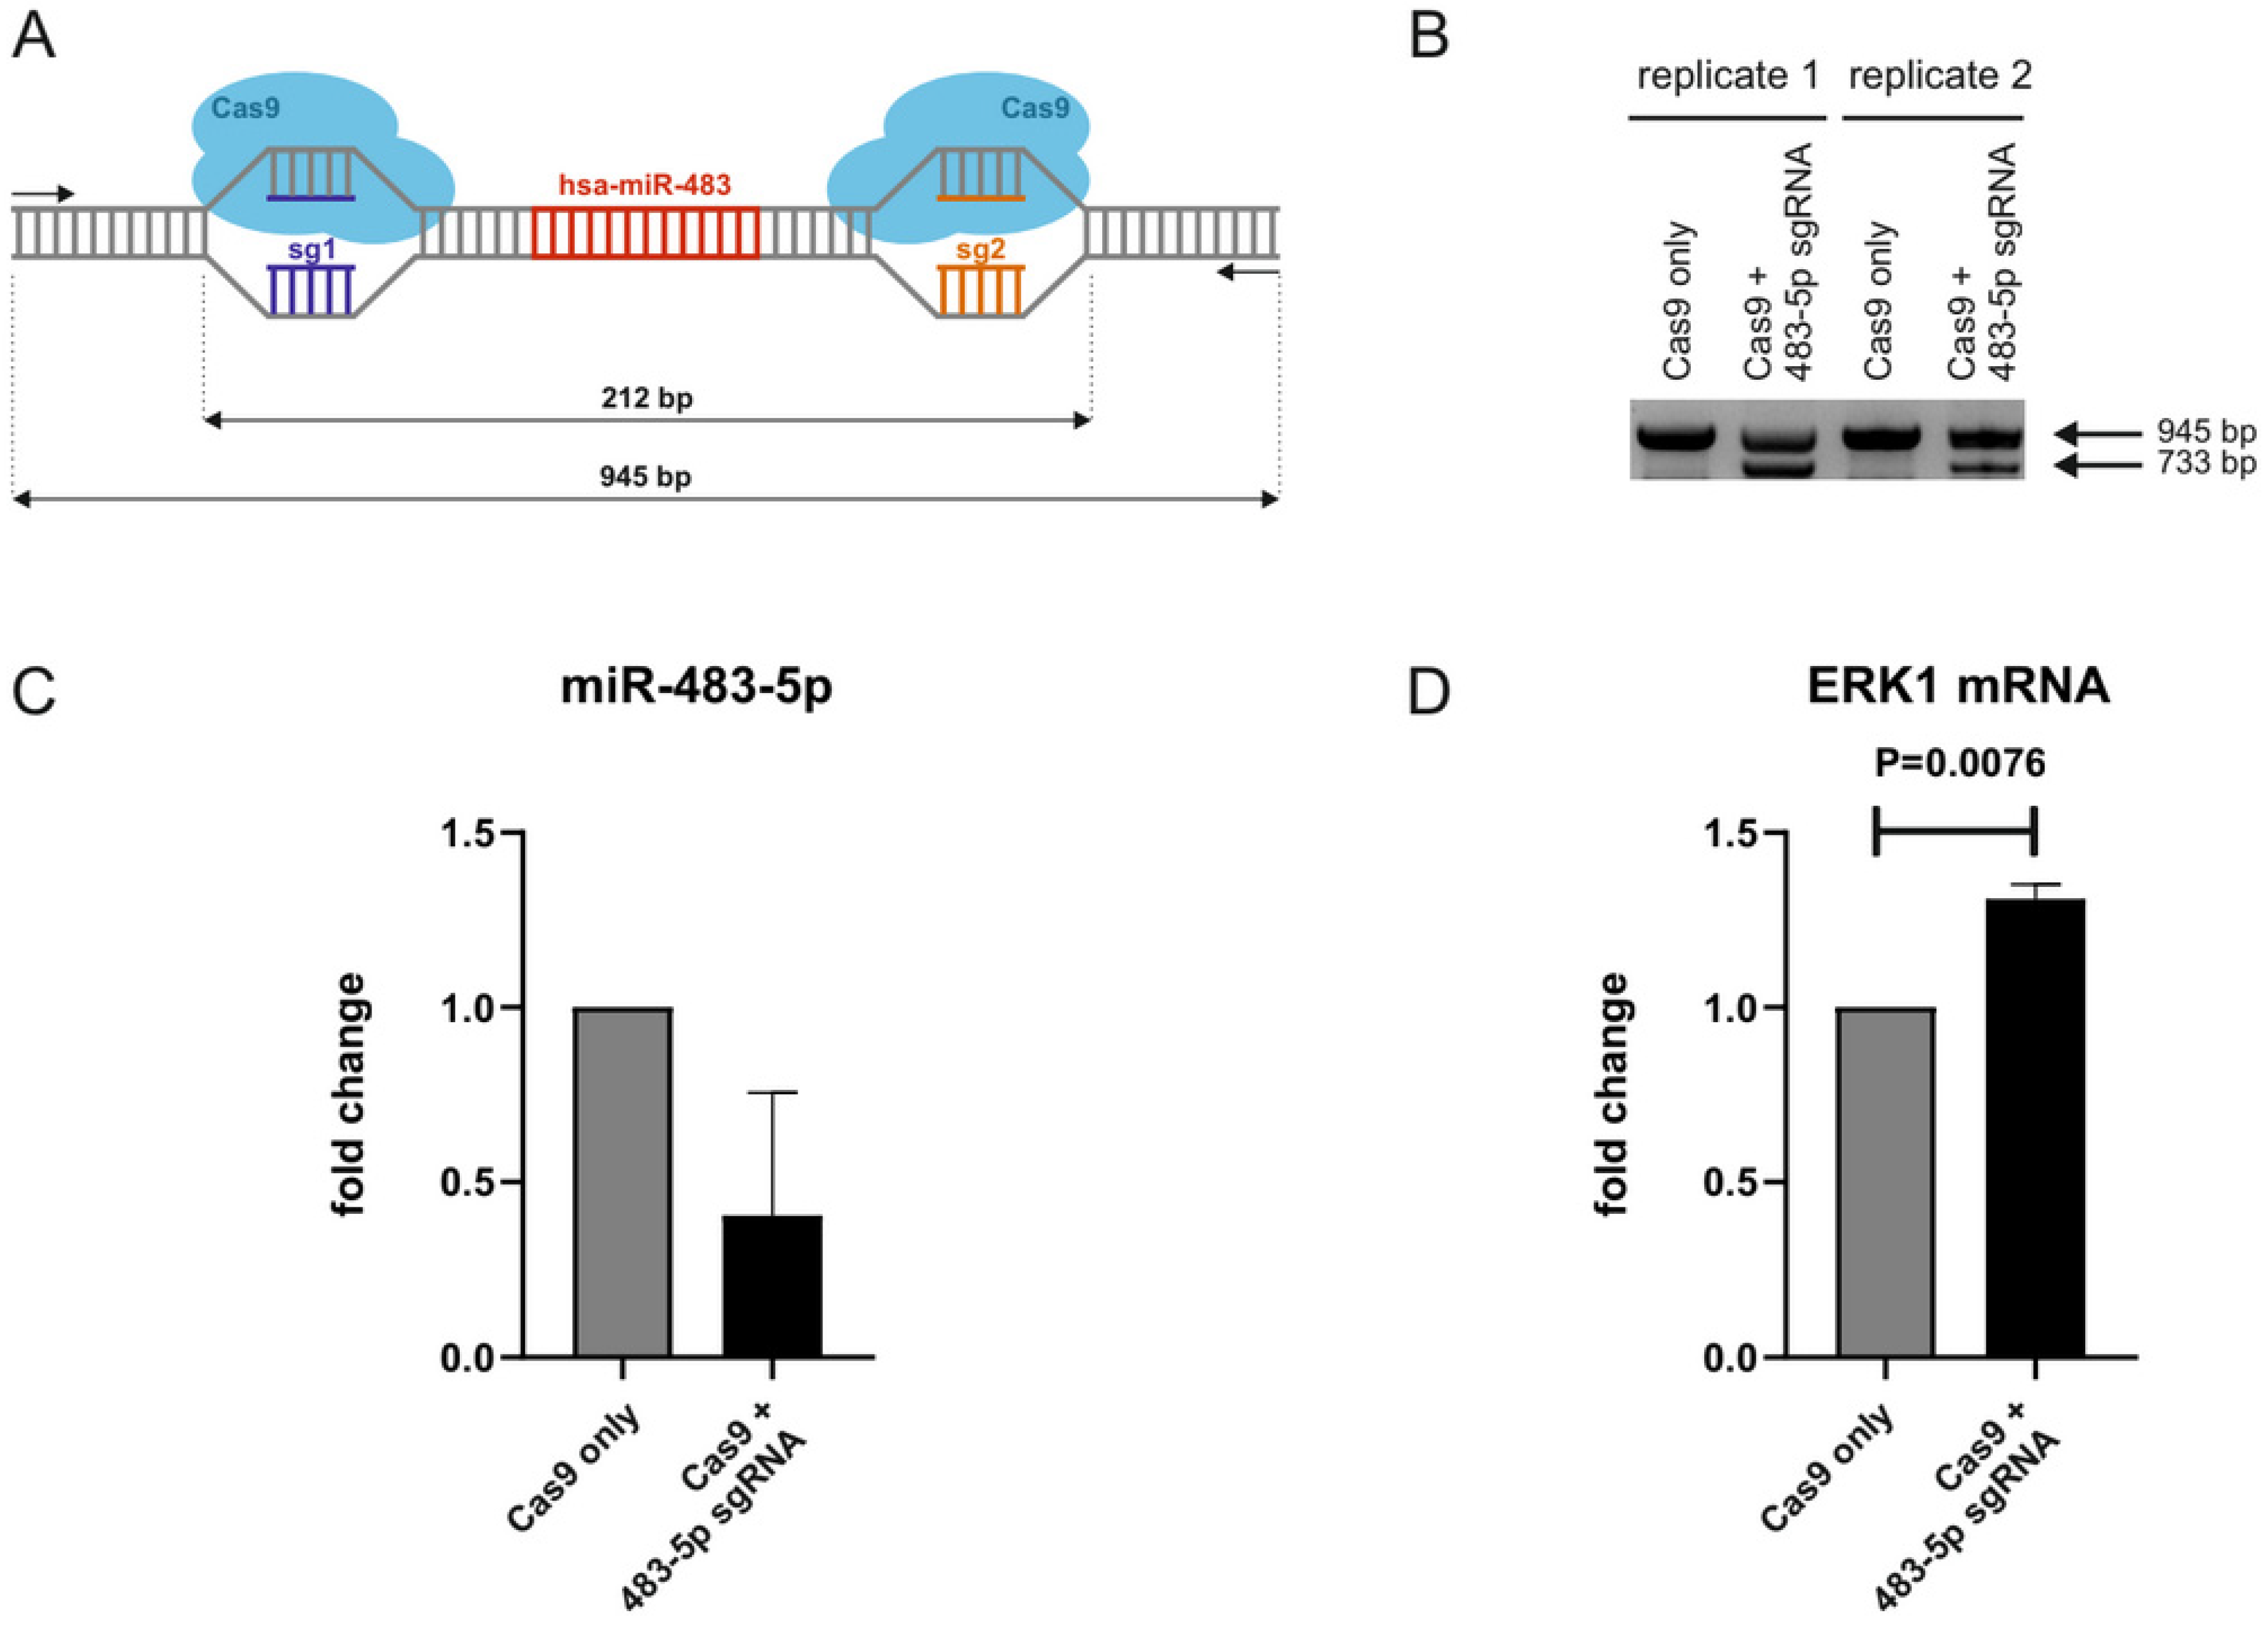
2.4. CRISPR/Cas9-Mediated Genomic Deletion of miR-483-5p from Neonatal Fibroblasts Increases ERK1 mRNA Levels
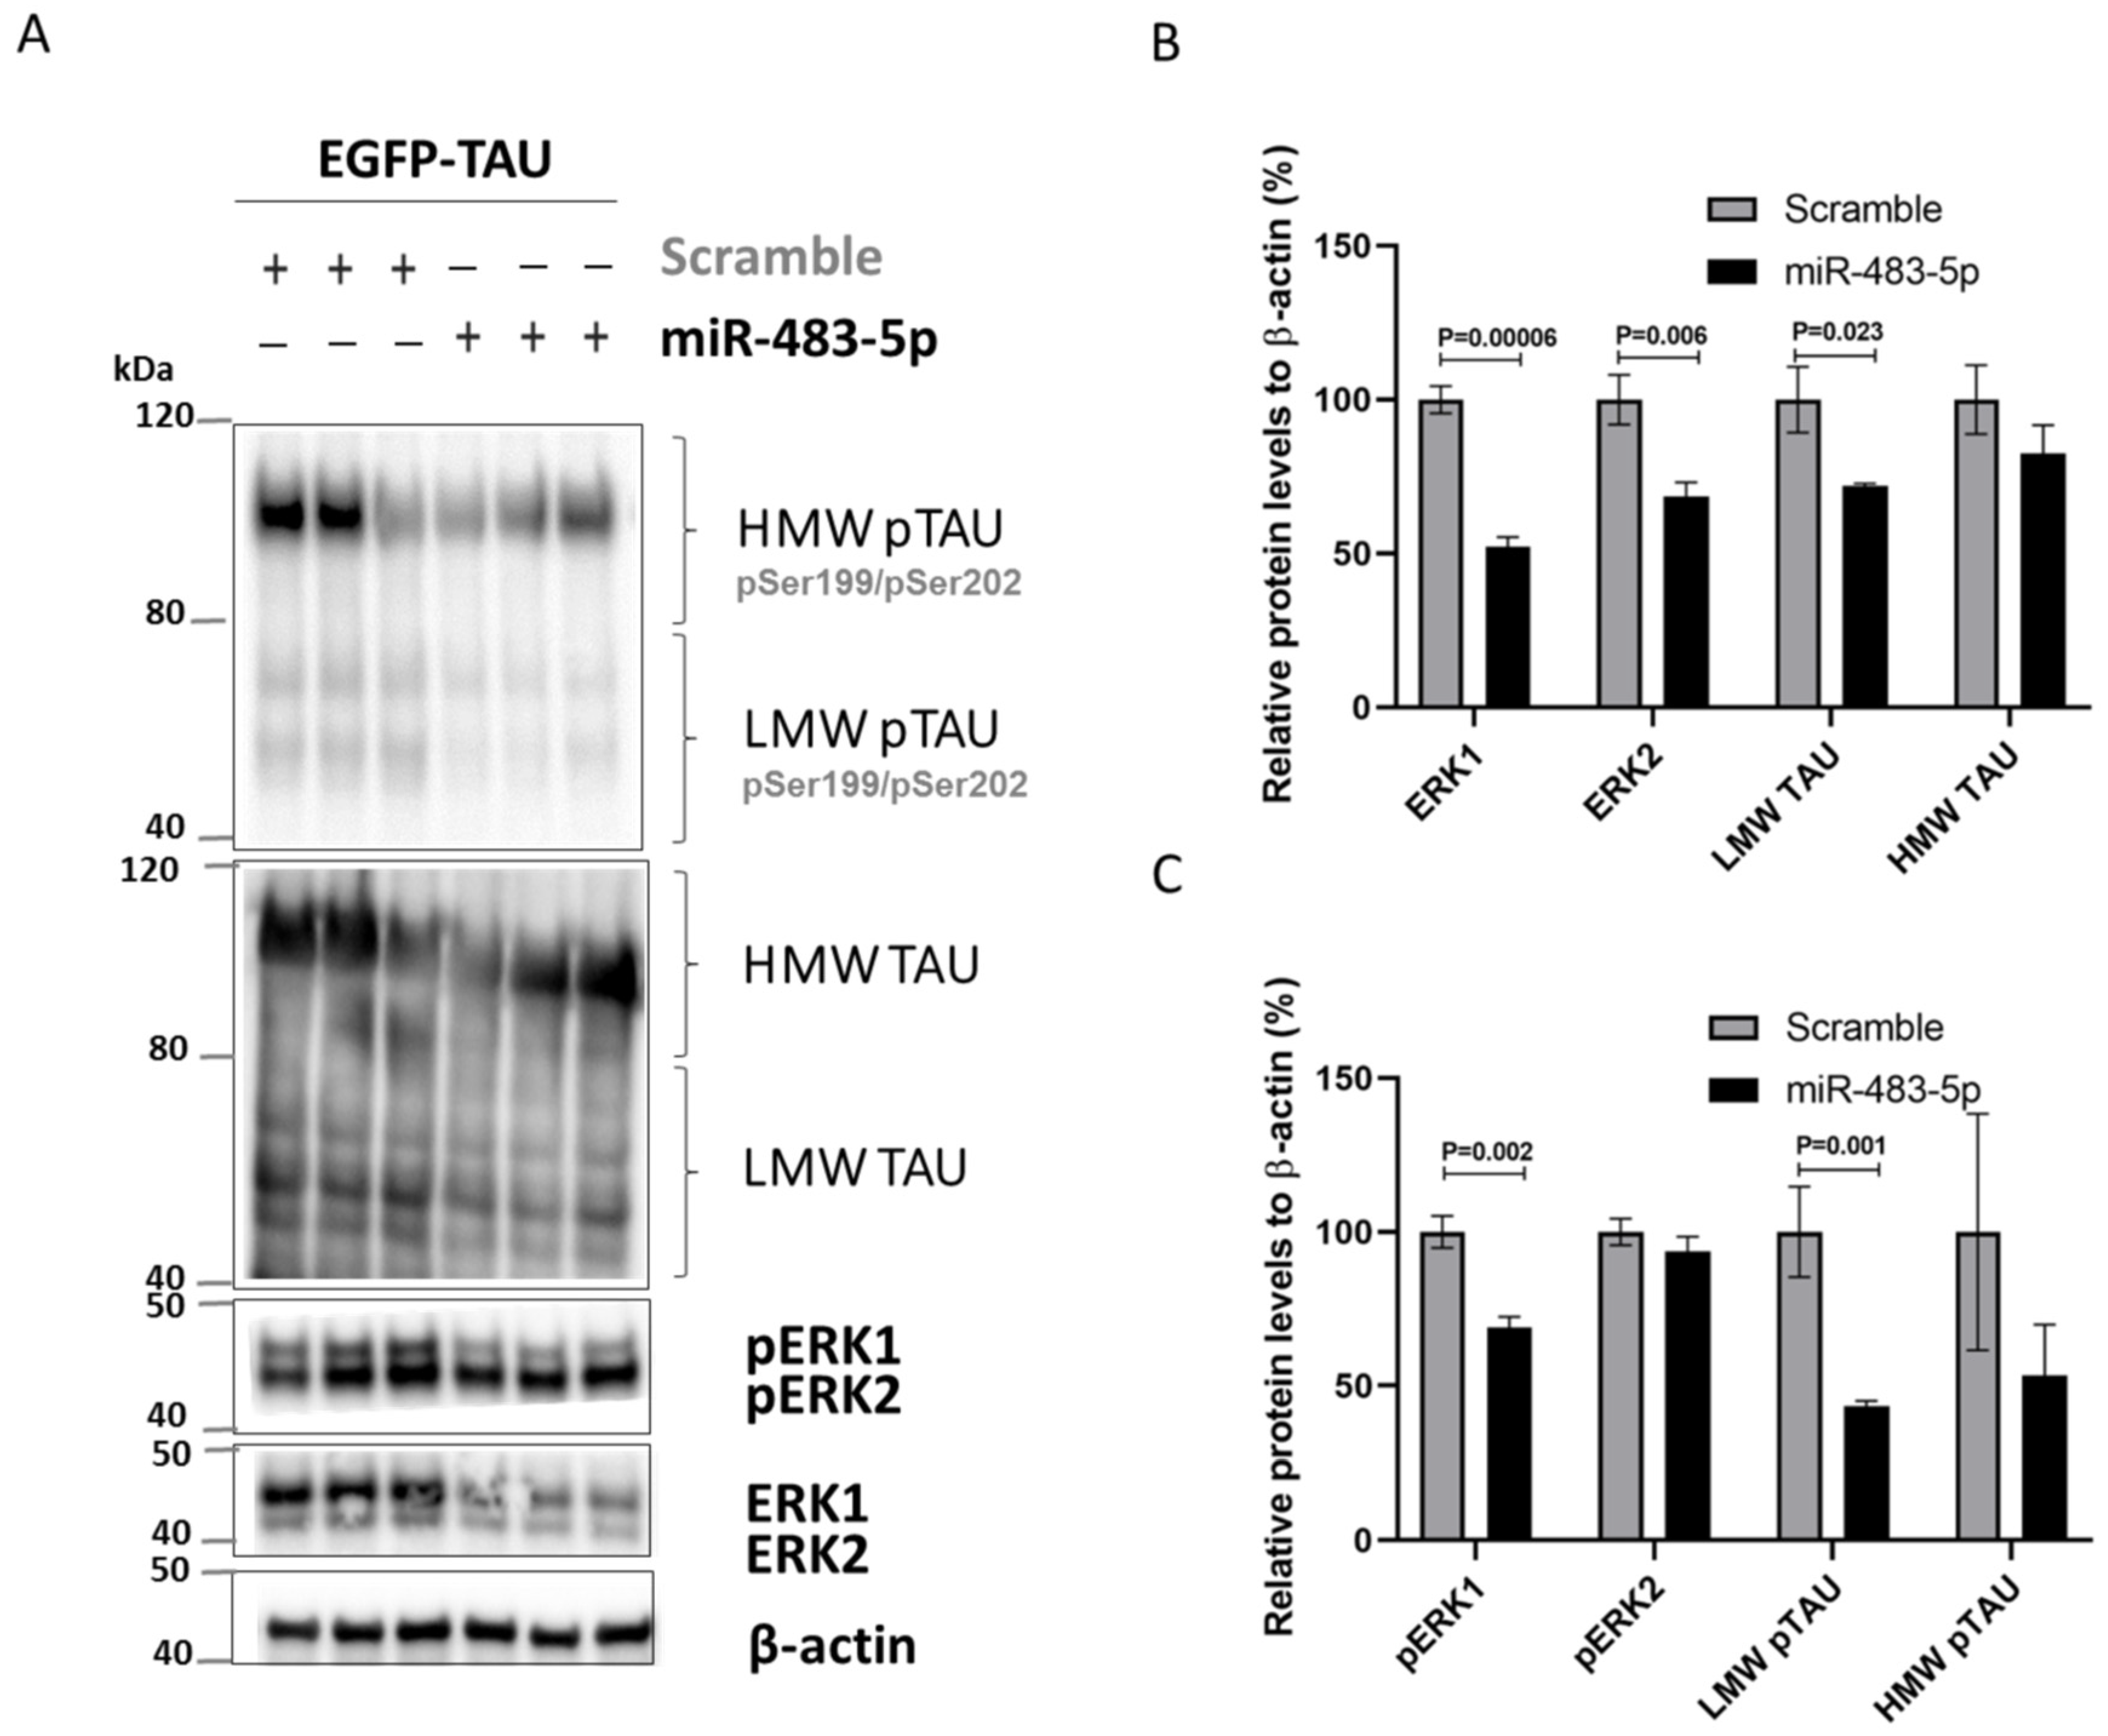
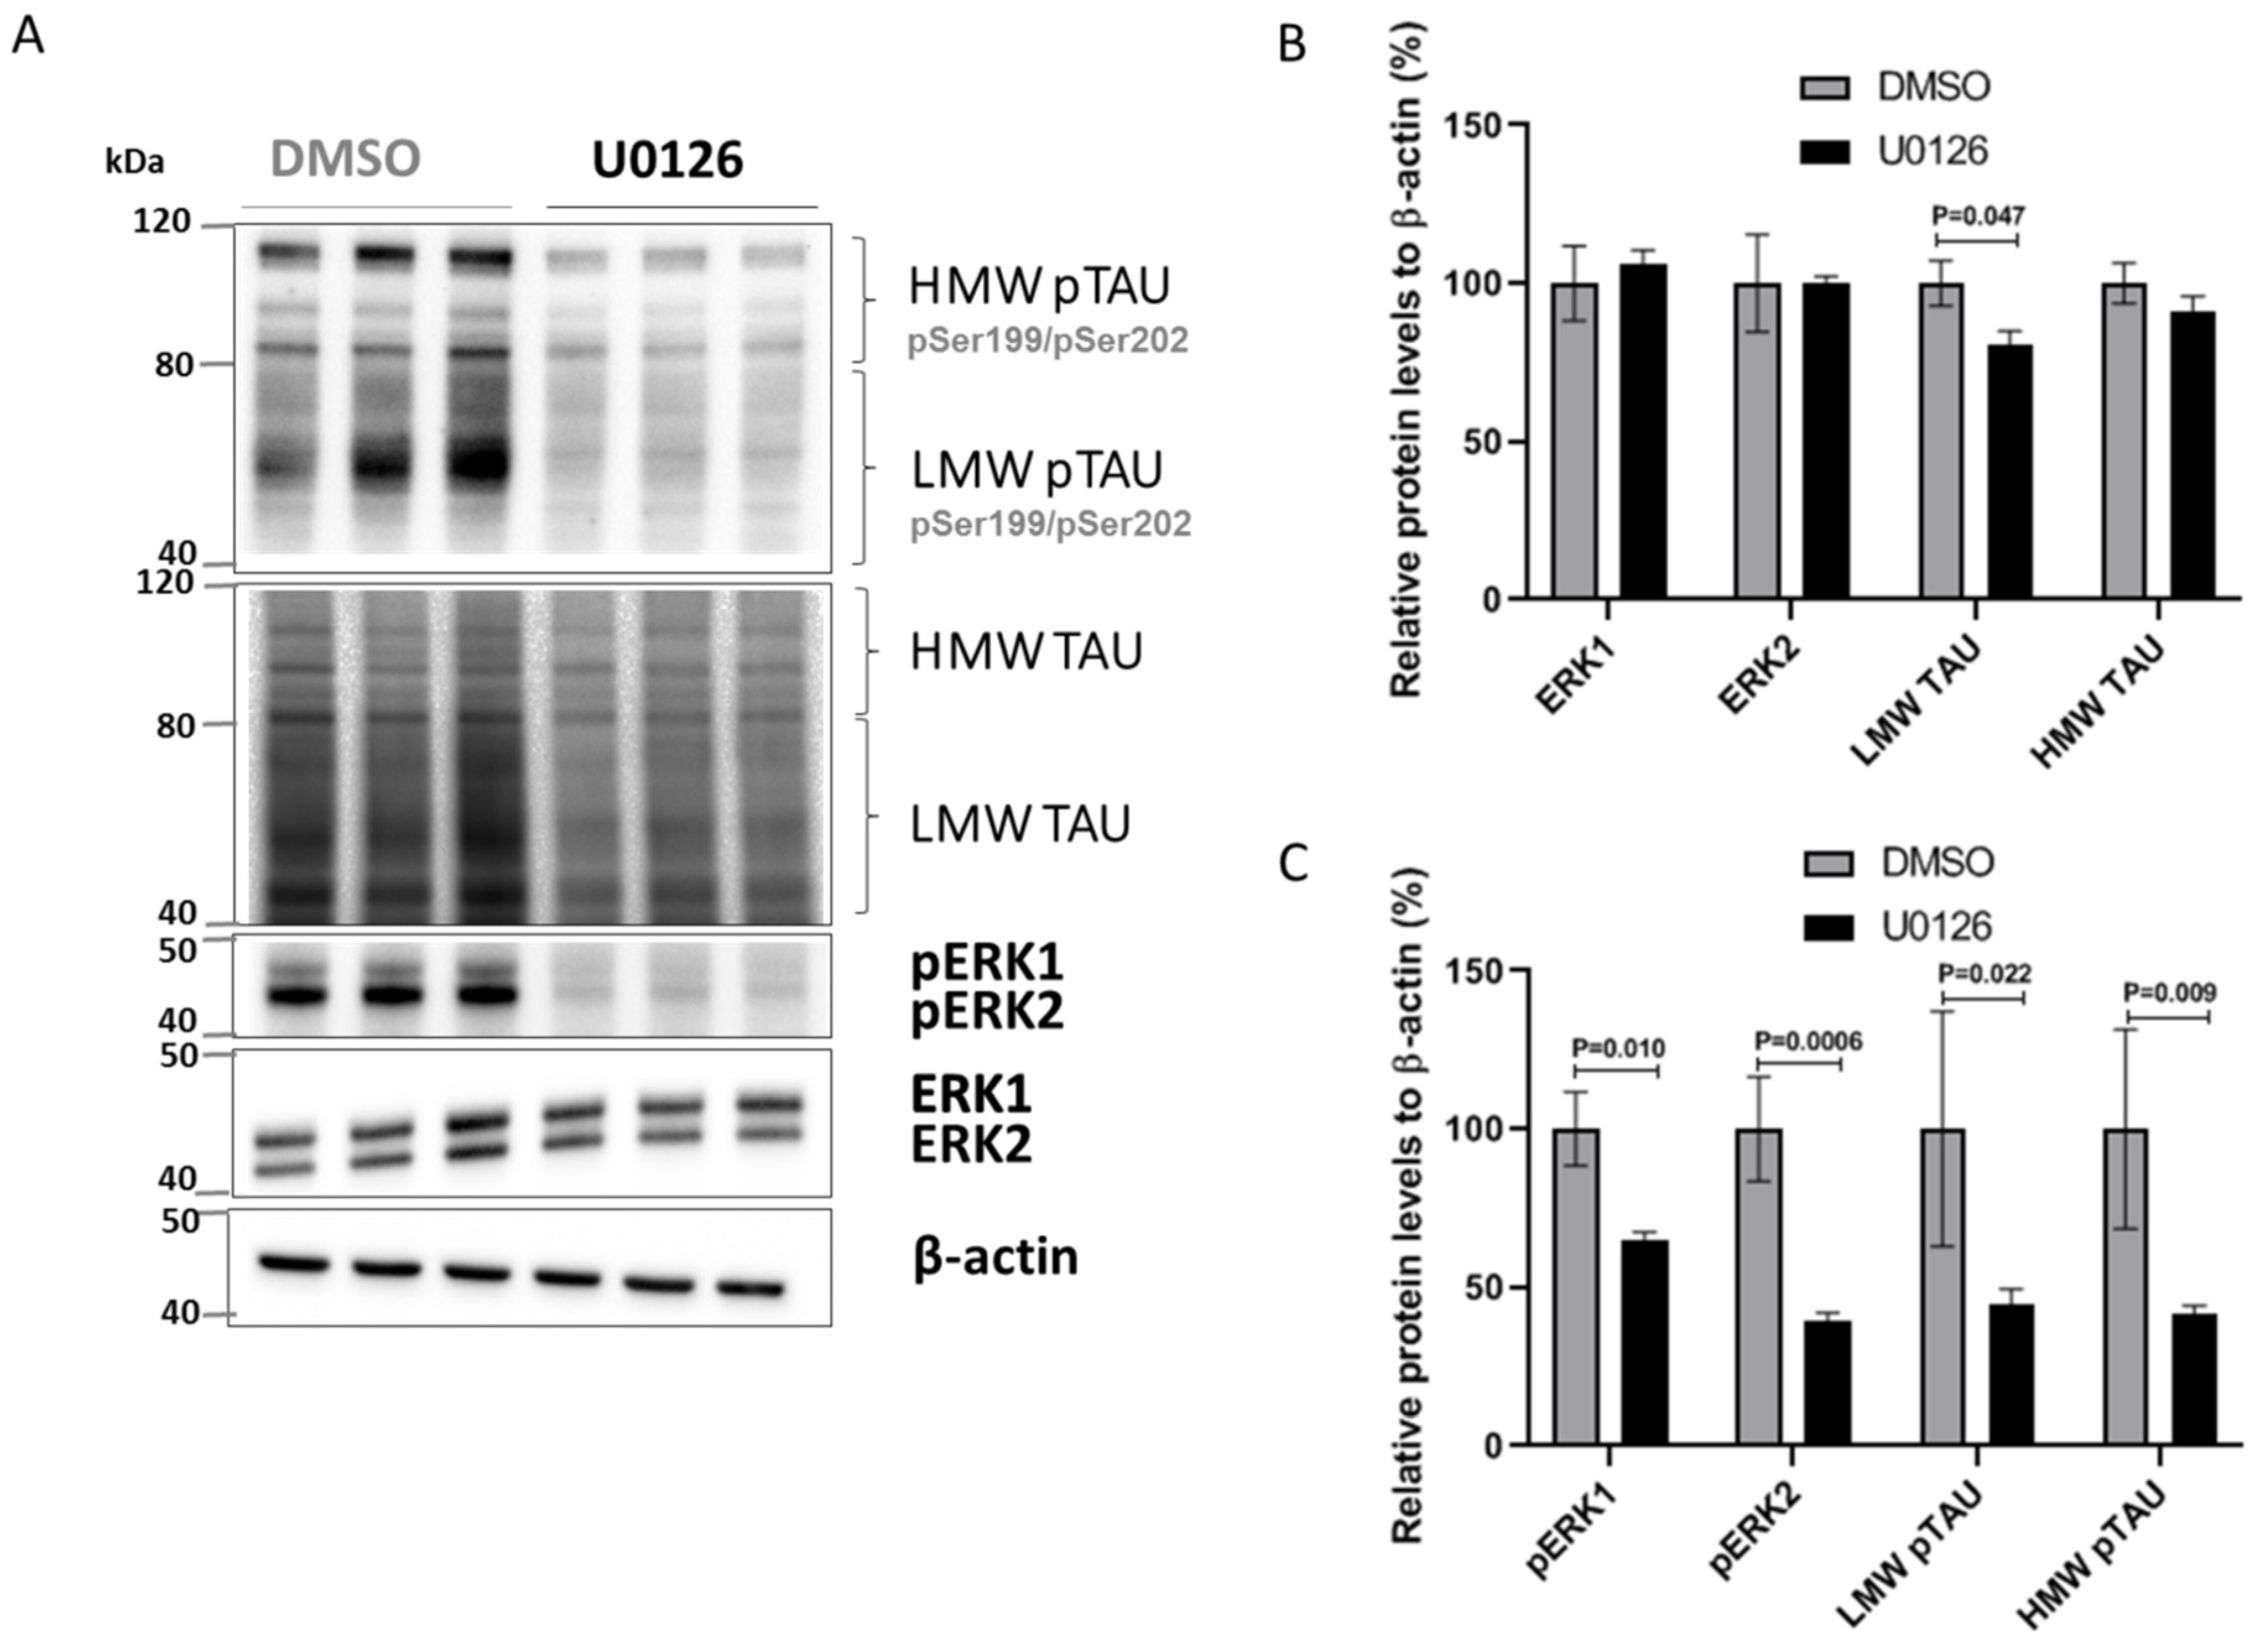
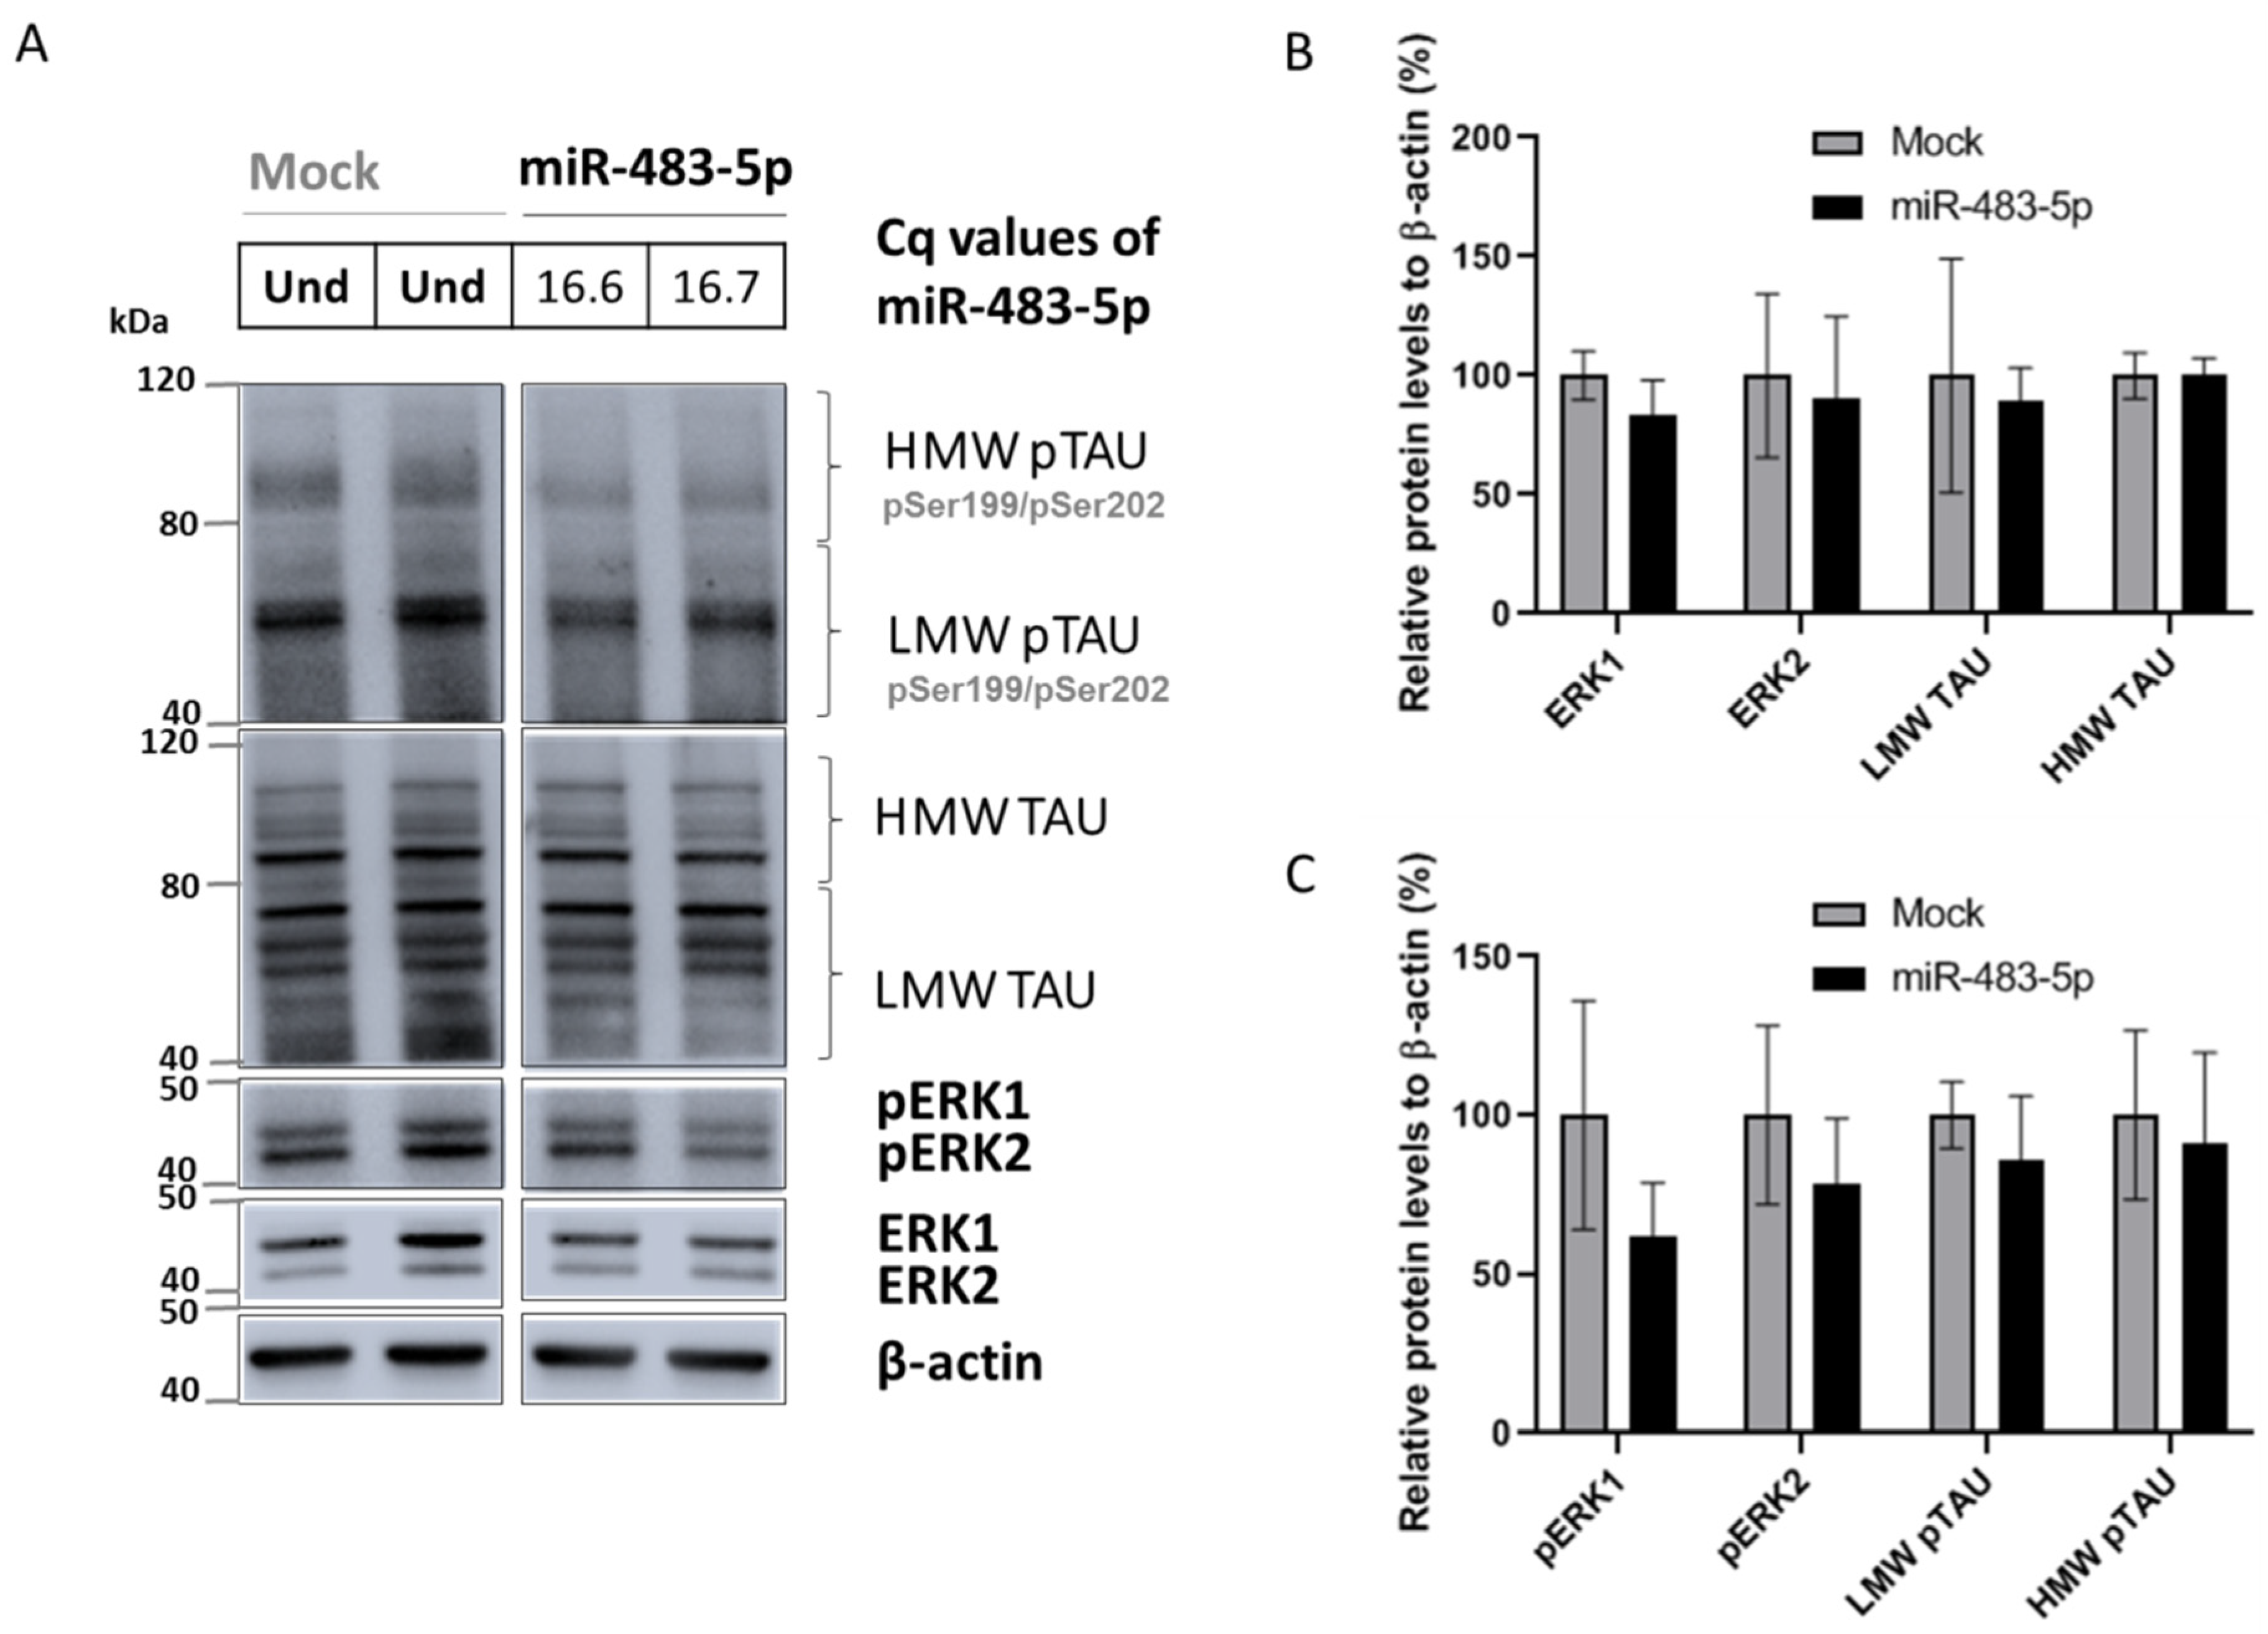
2.5. miR-483-5p-Mediated Reduction in pERK1/2 Decreases pTAU in HEK293 and SK-N-MC Cells
3. Discussion
4. Materials and Methods
4.1. Cell Culture and Transfection
4.2. Single Guide RNA (sgRNA) Design and Cloning
4.3. Sorting and Genotyping of CRISPR/Cas9 Knocked-Out Neonatal Fibroblasts
4.4. RNA Isolation and RT-qPCR
4.5. Immunoblotting
4.6. Luciferase Reporter Assay
4.7. Software and Statistical Analysis
5. Conclusions
Supplementary Materials
Author Contributions
Funding
Institutional Review Board Statement
Informed Consent Statement
Data Availability Statement
Acknowledgments
Conflicts of Interest
References
- Prince, M.; Ali, G.C.; Guerchet, M.; Prina, A.M.; Albanese, E.; Wu, Y.T. Recent global trends in the prevalence and incidence of dementia, and survival with dementia. Alzheimers Res. Ther. 2016, 8, 1–13. [Google Scholar] [CrossRef] [Green Version]
- Hurd, M.D.; Martorell, P.; Delavande, A.; Mullen, K.J.; Langa, K.M. Monetary Costs of Dementia in the United States. N. Engl. J. Med. 2013, 368, 1326–1334. [Google Scholar] [CrossRef] [Green Version]
- Panza, F.; Lozupone, M.; Logroscino, G.; Imbimbo, B.P. A critical appraisal of amyloid-β-targeting therapies for Alzheimer disease. Nat. Rev. Neurol. 2019, 15, 73–88. [Google Scholar] [CrossRef]
- Congdon, E.E.; Sigurdsson, E.M. Tau-targeting therapies for Alzheimer disease. Nat. Rev. Neurol. 2018, 14, 399–415. [Google Scholar] [CrossRef]
- Jack, C.R.; Bennett, D.A.; Blennow, K.; Carrillo, M.C.; Dunn, B.; Haeberlein, S.B.; Holtzman, D.M.; Jagust, W.; Jessen, F.; Karlawish, J.; et al. Contributors, NIA-AA Research Framework: Toward a biological definition of Alzheimer’s disease. Alzheimers Dement. 2018, 14, 535–562. [Google Scholar] [CrossRef]
- Dunn, A.R.; O’Connell, K.M.; Kaczorowski, C.C. Gene-by-environment interactions in Alzheimer’s disease and Parkinson’s disease. Neurosci. Biobehav. Rev. 2019, 103, 73–80. [Google Scholar] [CrossRef]
- Bartel, D.P. Metazoan MicroRNAs. Cell 2018, 173, 20–51. [Google Scholar] [CrossRef] [Green Version]
- Sierksma, A.; Lu, A.; Salta, E.; Eynden, E.V.; Callaerts-Vegh, Z.; D’Hooge, R.; Blum, D.; Buée, L.; Fiers, M.; De Strooper, B. Deregulation of neuronal miRNAs induced by amyloid-β or TAU pathology. Mol. Neurodegener. 2018, 13, 1–15. [Google Scholar] [CrossRef] [Green Version]
- Lau, P.; Bossers, K.; Janky, R.; Salta, E.; Frigerio, C.S.; Barbash, S.; Rothman, R.; Sierksma, A.S.; Thathiah, A.; Greenberg, D.; et al. Alteration of the microRNA network during the progression of Alzheimer’s disease. EMBO Mol. Med. 2013, 5, 1613–1634. [Google Scholar] [CrossRef] [Green Version]
- Smith, P.; Hernandez-Rapp, J.; Jolivette, F.; Lecours, C.; Bisht, K.; Goupil, C.; Dorval, V.; Parsi, S.; Morin, F.; Planel, E.; et al. miR-132/212 deficiency impairs tau metabolism and promotes pathological aggregation in vivo. Hum. Mol. Genet. 2015, 24, 6721–6735. [Google Scholar] [CrossRef] [Green Version]
- Hébert, S.S.; Papadopoulou, A.S.; Smith, P.; Galas, M.C.; Planel, E.; Silahtaroglu, A.N.; Sergeant, N.; Buée, L.; De Strooper, B. Genetic ablation of Dicer in adult forebrain neurons results in abnormal tau hyperphosphorylation and neuro-degeneration. Hum. Mol. Genet. 2010, 19, 3959–3969. [Google Scholar] [CrossRef] [PubMed] [Green Version]
- Bien-Ly, N.; Boswell, C.A.; Jeet, S.; Beach, T.G.; Hoyte, K.; Luk, W.; Shihadeh, V.; Ulufatu, S.; Foreman, O.; Lu, Y.; et al. Lack of Widespread BBB Disruption in Alzheimer’s Disease Models: Focus on Therapeutic Antibodies. Neuron 2015, 88, 289–297. [Google Scholar] [CrossRef] [PubMed] [Green Version]
- Bayraktar, R.; Van Roosbroeck, K.; Calin, G.A. Cell-to-cell communication: microRNAs as hormones. Mol. Oncol. 2017, 11, 1673–1686. [Google Scholar] [CrossRef] [Green Version]
- Nagaraj, S.; Zoltowska, K.M.; Laskowska-Kaszub, K.; Wojda, U. microRNA diagnostic panel for Alzheimer’s disease and epigenetic trade-off between neurodegeneration and cancer. Ageing Res. Rev. 2019, 49, 125–143. [Google Scholar] [CrossRef] [PubMed]
- Millan, M.J. Linking deregulation of non-coding RNA to the core pathophysiology of Alzheimer’s disease: An integrative review. Prog. Neurobiol. 2017, 156, 1–68. [Google Scholar] [CrossRef]
- Takousis, P.; Sadlon, A.; Schulz, J.; Wohlers, I.; Dobricic, V.; Middleton, L.; Lill, C.M.; Perneczky, R.; Bertram, L. Differential expression of microRNAs in Alzheimer’s disease brain, blood, and cerebrospinal fluid. Alzheimers Dement. 2019, 15, 1468–1477. [Google Scholar] [CrossRef]
- Nagaraj, S.; Laskowska-Kaszub, K.; Dębski, K.J.; Wojsiat, J.; Dąbrowski, M.; Gabryelewicz, T.; Kuźnicki, J.; Wojda, U. Profile of 6 microRNA in blood plasma distinguish early stage Alzheimer’s disease patients from non-demented subjects. Oncotarget 2017, 8, 16122–16143. [Google Scholar] [CrossRef] [Green Version]
- Agarwal, V.; Bell, G.W.; Nam, J.-W.; Bartel, D.P. Predicting effective microRNA target sites in mammalian mRNAs. eLife 2015, 4, e05005. [Google Scholar] [CrossRef]
- Chou, C.H.; Shrestha, S.; Yang, C.D.; Chang, N.W.; Lin, Y.L.; Liao, K.W.; Huang, W.C.; Sun, T.H.; Tu, S.J.; Lee, W.H.; et al. miRTarBase update 2018: A resource for experimentally validated microRNA-target interactions. Nucleic Acids Res. 2018, 46, D296–D302. [Google Scholar] [CrossRef]
- Wang, Y.; Veremeyko, T.; Wong, A.; El Fatimy, R.; Wei, Z.; Cai, W.; Krichevsky, A. Downregulation of miR-132/212 impairs S-nitrosylation balance and induces tau phosphorylation in Alzheimer’s disease. Neurobiol. Aging 2017, 51, 156–166. [Google Scholar] [CrossRef]
- Salta, E.; De Strooper, B. microRNA-132: A key noncoding RNA operating in the cellular phase of Alzheimer’s disease. FASEB J. 2017, 31, 424–433. [Google Scholar] [CrossRef]
- Salta, E.; Sierksma, A.; Vanden Eynden, E.; De Strooper, B. miR-132 loss de-represses ITPKB and aggravates amyloid and TAU pathology in Alzheimer’s brain. EMBO Mol. Med. 2016, 8, 1005–1018. [Google Scholar] [CrossRef]
- Wong, H.K.; Veremeyko, T.; Patel, N.; Lemere, C.A.; Walsh, D.M.; Esau, C.; Vanderburg, C.; Krichevsky, A.M. De-repression of FOXO3a death axis by microRNA-132 and -212 causes neuronal apoptosis in Alzheimer’s disease. Hum. Mol. Genet. 2013, 22, 3077–3092. [Google Scholar] [CrossRef] [Green Version]
- El Fatimy, R.; Li, S.; Chen, Z.; Mushannen, T.; Gongala, S.; Wei, Z.; Balu, D.T.; Rabinovsky, R.; Cantlon, A.; Elkhal, A.; et al. MicroRNA-132 provides neuroprotection for tauopathies via multiple signaling pathways. Acta Neuropathol. 2018, 136, 537–555. [Google Scholar] [CrossRef] [Green Version]
- Hernandez-Rapp, J.; Smith, P.Y.; Filali, M.; Goupil, C.; Planel, E.; Magill, S.T.; Goodman, R.H.; Hébert, S.S. Memory formation and retention are affected in adult miR-132/212 knockout mice. Behav. Brain Res. 2015, 287, 15–26. [Google Scholar] [CrossRef] [PubMed]
- Wang, L.; Shi, M.; Hou, S.; Ding, B.; Liu, L.; Ji, X.; Zhang, J.; Deng, Y. MiR-483-5p suppresses the proliferation of glioma cells via directly targeting ERK1. FEBS Lett. 2012, 586, 1312–1317. [Google Scholar] [CrossRef] [Green Version]
- Chen, K.; He, H.; Xie, Y.; Zhao, L.; Zhao, S.; Wan, X.; Yang, W.; Mo, Z. miR-125a-3p and miR-483-5p promote adipogenesis via suppressing the RhoA/ROCK1/ERK1/2 pathway in multiple symmetric lipomatosis. Sci. Rep. 2015, 5, 11909. [Google Scholar] [CrossRef] [Green Version]
- Hao, Y.; Yuan, H.; Yu, H. Downregulation of miR-483-5p decreases hypoxia-induced injury in human cardiomyocytes by targeting MAPK3. Cell. Mol. Biol. Lett. 2020, 25, 1–12. [Google Scholar] [CrossRef] [Green Version]
- Panwar, B.; Omenn, G.S.; Guan, Y. miRmine: A Database of Human miRNA Expression Profiles. Bioinformatics 2017, 33, 1554–1560. [Google Scholar] [CrossRef] [Green Version]
- Colucci-D’Amato, L.; Perrone-Capano, C.; Di Porzio, U. Chronic activation of ERK and neurodegenerative diseases. BioEssays 2003, 25, 1085–1095. [Google Scholar] [CrossRef]
- Li, C.; Götz, J. Somatodendritic accumulation of Tau in Alzheimer’s disease is promoted by Fyn-mediated local protein translation. EMBO J. 2017, 36, 3120–3138. [Google Scholar] [CrossRef]
- Han, K.; Gennarino, V.A.; Lee, Y.; Pang, K.; Hashimoto-Torii, K.; Choufani, S.; Raju, C.S.; Oldham, M.C.; Weksberg, R.; Rakic, P.; et al. Human-specific regulation of MeCP2 levels in fetal brains by microRNA miR-483-5p. Genes Dev. 2013, 27, 485–490. [Google Scholar] [CrossRef] [Green Version]
- Landgraf, P.; Rusu, M.; Sheridan, R.; Sewer, A.; Iovino, N.; Aravin, A.; Pfeffer, S.; Rice, A.; Kamphorst, A.O.; Landthaler, M.; et al. A Mammalian microRNA Expression Atlas Based on Small RNA Library Sequencing. Cell 2007, 129, 1401–1414. [Google Scholar] [CrossRef] [Green Version]
- Ma, N.; Wang, X.; Qiao, Y.; Li, F.; Hui, Y.; Zou, C.; Jin, J.; Lv, G.; Peng, Y.; Wang, L.; et al. Coexpression of an intronic microRNA and its host gene reveals a potential role for miR-483-5p as an IGF2 partner. Mol. Cell. Endocrinol. 2011, 333, 96–101. [Google Scholar] [CrossRef]
- Cianfarani, S. Insulin-like growth factor-II: New roles for an old actor. Front. Endocrinol. 2012, 3, 118. [Google Scholar] [CrossRef] [Green Version]
- Heywood, W.E.; Galimberti, D.; Bliss, E.; Sirka, E.; Paterson, R.W.; Magdalinou, N.K.; Carecchio, M.; Reid, E.; Heslegrave, A.; Fenoglio, C.; et al. Identification of novel CSF biomarkers for neurodegeneration and their validation by a high-throughput multiplexed targeted proteomic assay. Mol. Neurodegener. 2015, 10, 64. [Google Scholar] [CrossRef] [Green Version]
- Åberg, D.; Johansson, P.; Isgaard, J.; Wallin, A.; Johansson, J.O.; Andreasson, U.; Blennow, K.; Zetterberg, H.; Åberg, N.D.; Svensson, J. Increased Cerebrospinal Fluid Level of Insulin-like Growth Factor-II in Male Patients with Alzheimer’s Disease. J. Alzheimers Dis. 2015, 48, 637–646. [Google Scholar] [CrossRef] [PubMed]
- Martín-Montañez, E.; Millon, C.; Boraldi, F.; Garcia-Guirado, F.; Pedraza, C.; Lara, E.; Santin, L.; Pavia, J.; Garcia-Fernandez, M. IGF-II promotes neuroprotection and neuroplasticity recovery in a long-lasting model of oxidative damage induced by glucocorticoids. Redox Biol. 2017, 13, 69–81. [Google Scholar] [CrossRef] [Green Version]
- Suh, H.-S.; Zhao, M.-L.; Derico, L.; Choi, N.; Lee, S.C. Insulin-like growth factor 1 and 2 (IGF1, IGF2) expression in human microglia: Differential regulation by inflammatory mediators. J. Neuroinflamm. 2013, 10, 37. [Google Scholar] [CrossRef] [Green Version]
- Iwamoto, T.; Ouchi, Y. Emerging evidence of insulin-like growth factor 2 as a memory enhancer: A unique animal model of cognitive dysfunction with impaired adult neurogenesis. Rev. Neurosci. 2014, 25, 559–574. [Google Scholar] [CrossRef]
- Pardo, M.; Cheng, Y.; Sitbon, Y.; Lowell, J.; Grieco, S.; Worthen, R.; Desse, S.; Barreda-Diaz, A. Insulin growth factor 2 (IGF2) as an emergent target in psychiatric and neurological disorders. Review. Neurosci. Res. 2019, 149, 1–13. [Google Scholar] [CrossRef]
- Ruiz-Perera, L.M.; Schneider, L.; Windmöller, B.A.; Müller, J.; Greiner, J.F.W.; Kaltschmidt, C.; Kaltschmidt, B. NF-κB p65 directs sex-specific neuroprotection in human neurons. Sci. Rep. 2018, 8, 16012. [Google Scholar] [CrossRef]
- Liu, M.; Roth, A.; Yu, M.; Morris, R.; Bersani, F.; Rivera, M.N.; Lu, J.; Shioda, T.; Vasudevan, S.; Ramaswamy, S.; et al. The IGF2 intronic miR-483 selectively enhances transcription from IGF2 fetal promoters and enhances tumorigenesis. Genes Dev. 2013, 27, 2543–2548. [Google Scholar] [CrossRef] [Green Version]
- Shih, R.H.; Wang, C.Y.; Yang, C.M. NF-kappaB Signaling Pathways in Neurological Inflammation: A Mini Review. Front. Mol. Neurosci. 2015, 8, 77. [Google Scholar] [CrossRef] [Green Version]
- Kellar, D.; Craft, S. Brain insulin resistance in Alzheimer’s disease and related disorders: Mechanisms and therapeutic approaches. Lancet Neurol. 2020, 19, 758–766. [Google Scholar] [CrossRef]
- Leng, F.; Edison, P. Neuroinflammation and microglial activation in Alzheimer disease: Where do we go from here? Nat. Rev. Neurol. 2021, 17, 157–172. [Google Scholar] [CrossRef]
- Alford, S.; Patel, D.; Perakakis, N.; Mantzoros, C.S. Obesity as a risk factor for Alzheimer’s disease: Weighing the evidence. Obes. Rev. 2018, 19, 269–280. [Google Scholar] [CrossRef] [PubMed]
- Jayaraman, A.; Pike, C.J. Alzheimer’s Disease and Type 2 Diabetes: Multiple Mechanisms Contribute to Interactions. Curr. Diabetes Rep. 2014, 14, 1–9. [Google Scholar] [CrossRef] [PubMed] [Green Version]
- Zhao, Y.; Jaber, V.; Alexandrov, P.N.; Vergallo, A.; Lista, S.; Hampel, H.; Lukiw, W.J. microRNA-Based Biomarkers in Alzheimer’s Disease (AD). Front. Neurosci. 2020, 14, 585432. [Google Scholar] [CrossRef]
- Pan, Q.; Kuang, X.; Cai, S.; Wang, X.; Du, D.; Wang, J.; Wang, Y.; Chen, Y.; Bihl, J.; Chen, Y.; et al. miR-132-3p priming enhances the effects of mesenchymal stromal cell-derived exosomes on ameliorating brain ischemic injury. Stem Cell Res. Ther. 2020, 11, 1–17. [Google Scholar] [CrossRef]
- Boscher, E.; Hernandez-Rapp, J.; Petry, S.; Keraudren, R.; Rainone, S.; Loiselle, A.; Goupil, C.; Turgeon, A.; St-Amour, I.; Planel, E.; et al. Advances and Challenges in Understanding MicroRNA Function in Tauopathies: A Case Study of miR-132/212. Front. Neurol. 2020, 11, 578720. [Google Scholar] [CrossRef]
- Hadar, A.; Milanesi, E.; Walczak, M.; Puzianowska-Kuźnicka, M.; Kuźnicki, J.; Squassina, A.; Niola, P.; Chillotti, C.; Attems, J.; Gozes, I.; et al. SIRT1, miR-132 and miR-212 link human longevity to Alzheimer’s Disease. Sci. Rep. 2018, 8, 1–10. [Google Scholar] [CrossRef]
- Joilin, G.; Guévremont, D.; Ryan, B.; Claudianos, C.; Cristino, A.S.; Abraham, W.C.; Williams, J.M. Rapid regulation of microRNA following induction of long-term potentiation in vivo. Front. Mol. Neurosci. 2014, 7, 98. [Google Scholar] [CrossRef] [PubMed] [Green Version]
- Lee, S.-T.; Chu, K.; Jung, K.-H.; Kim, J.H.; Huh, J.-Y.; Yoon, H.; Park, D.-K.; Lim, J.-Y.; Kim, J.-M.; Jeon, D.; et al. miR-206 regulates brain-derived neurotrophic factor in Alzheimer disease model. Ann. Neurol. 2012, 72, 269–277. [Google Scholar] [CrossRef] [PubMed]
- Parsi, S.; Smith, P.Y.; Goupil, C.; Dorval, V.; Hébert, S.S. Preclinical Evaluation of miR-15/107 Family Members as Multifactorial Drug Targets for Alzheimer’s Disease. Mol. Ther. Nucleic Acids 2015, 4, e256. [Google Scholar] [CrossRef] [PubMed]
- Pillai, R.S.; Bhattacharyya, S.N.; Artus, C.G.; Zoller, T.; Cougot, N.; Basyuk, E.; Bertrand, E.; Filipowicz, W. Inhibition of Translational Initiation by Let-7 MicroRNA in Human Cells. Science 2005, 309, 1573–1576. [Google Scholar] [CrossRef] [PubMed] [Green Version]
- Huang, H.Y.; Lin, Y.C.; Li, J.; Huang, K.Y.; Shrestha, S.; Hong, H.C.; Tang, Y.; Chen, Y.G.; Jin, C.N.; Yu, Y.; et al. miRTarBase 2020: Updates to the experimentally validated microRNA-target interaction database. Nucleic Acids Res. 2020, 48, D148–D154. [Google Scholar] [CrossRef] [Green Version]
- Wu, J.; Wang, B.; Zhou, J.; Ji, F. MicroRNA target gene prediction of ischemic stroke by using variational Bayesian inference for Gauss mixture model. Exp. Ther. Med. 2019, 17, 2734–2740. [Google Scholar] [CrossRef] [PubMed] [Green Version]
- Jacinta-Fernandes, A.; Xavier, J.M.; Magno, R.; Lage, J.G.; Maia, A.T. Allele-specific miRNA-binding analysis identifies candidate target genes for breast cancer risk. NPJ Genom. Med. 2020, 5, 4. [Google Scholar] [CrossRef] [Green Version]
- Lee, Y.J.; Kim, V.; Muth, D.C.; Witwer, K.W. Validated MicroRNA Target Databases: An Evaluation. Drug Dev. Res. 2015, 76, 389–396. [Google Scholar] [CrossRef] [Green Version]
- Livak, K.J.; Schmittgen, T.D. Analysis of relative gene expression data using real-time quantitative PCR and the 2(-Delta Delta C(T)) Method. Methods 2001, 25, 402–408. [Google Scholar] [CrossRef] [PubMed]
- Koscianska, E.; Baev, V.; Skreka, K.; Oikonomaki, K.; Rusinov, V.; Tabler, M.; Kalantidis, K. Prediction and preliminary validation of oncogene regulation by miRNAs. BMC Mol. Biol. 2007, 8, 1–14. [Google Scholar] [CrossRef] [PubMed] [Green Version]
- Schindelin, J.; Arganda-Carreras, I.; Frise, E.; Kaynig, V.; Longair, M.; Pietzsch, T.; Preibisch, S.; Rueden, C.; Saalfeld, S.; Schmid, B.; et al. Fiji: An open-source platform for biological-image analysis. Nat. Methods 2012, 9, 676–682. [Google Scholar] [CrossRef] [PubMed] [Green Version]


Publisher’s Note: MDPI stays neutral with regard to jurisdictional claims in published maps and institutional affiliations. |
© 2021 by the authors. Licensee MDPI, Basel, Switzerland. This article is an open access article distributed under the terms and conditions of the Creative Commons Attribution (CC BY) license (https://creativecommons.org/licenses/by/4.0/).
Share and Cite
Nagaraj, S.; Want, A.; Laskowska-Kaszub, K.; Fesiuk, A.; Vaz, S.; Logarinho, E.; Wojda, U. Candidate Alzheimer’s Disease Biomarker miR-483-5p Lowers TAU Phosphorylation by Direct ERK1/2 Repression. Int. J. Mol. Sci. 2021, 22, 3653. https://0-doi-org.brum.beds.ac.uk/10.3390/ijms22073653
Nagaraj S, Want A, Laskowska-Kaszub K, Fesiuk A, Vaz S, Logarinho E, Wojda U. Candidate Alzheimer’s Disease Biomarker miR-483-5p Lowers TAU Phosphorylation by Direct ERK1/2 Repression. International Journal of Molecular Sciences. 2021; 22(7):3653. https://0-doi-org.brum.beds.ac.uk/10.3390/ijms22073653
Chicago/Turabian StyleNagaraj, Siranjeevi, Andrew Want, Katarzyna Laskowska-Kaszub, Aleksandra Fesiuk, Sara Vaz, Elsa Logarinho, and Urszula Wojda. 2021. "Candidate Alzheimer’s Disease Biomarker miR-483-5p Lowers TAU Phosphorylation by Direct ERK1/2 Repression" International Journal of Molecular Sciences 22, no. 7: 3653. https://0-doi-org.brum.beds.ac.uk/10.3390/ijms22073653