
Molecular Topology for the Search of New Anti-MRSA Compounds

 , ,
, ,  and
and
Abstract
:1. Introduction
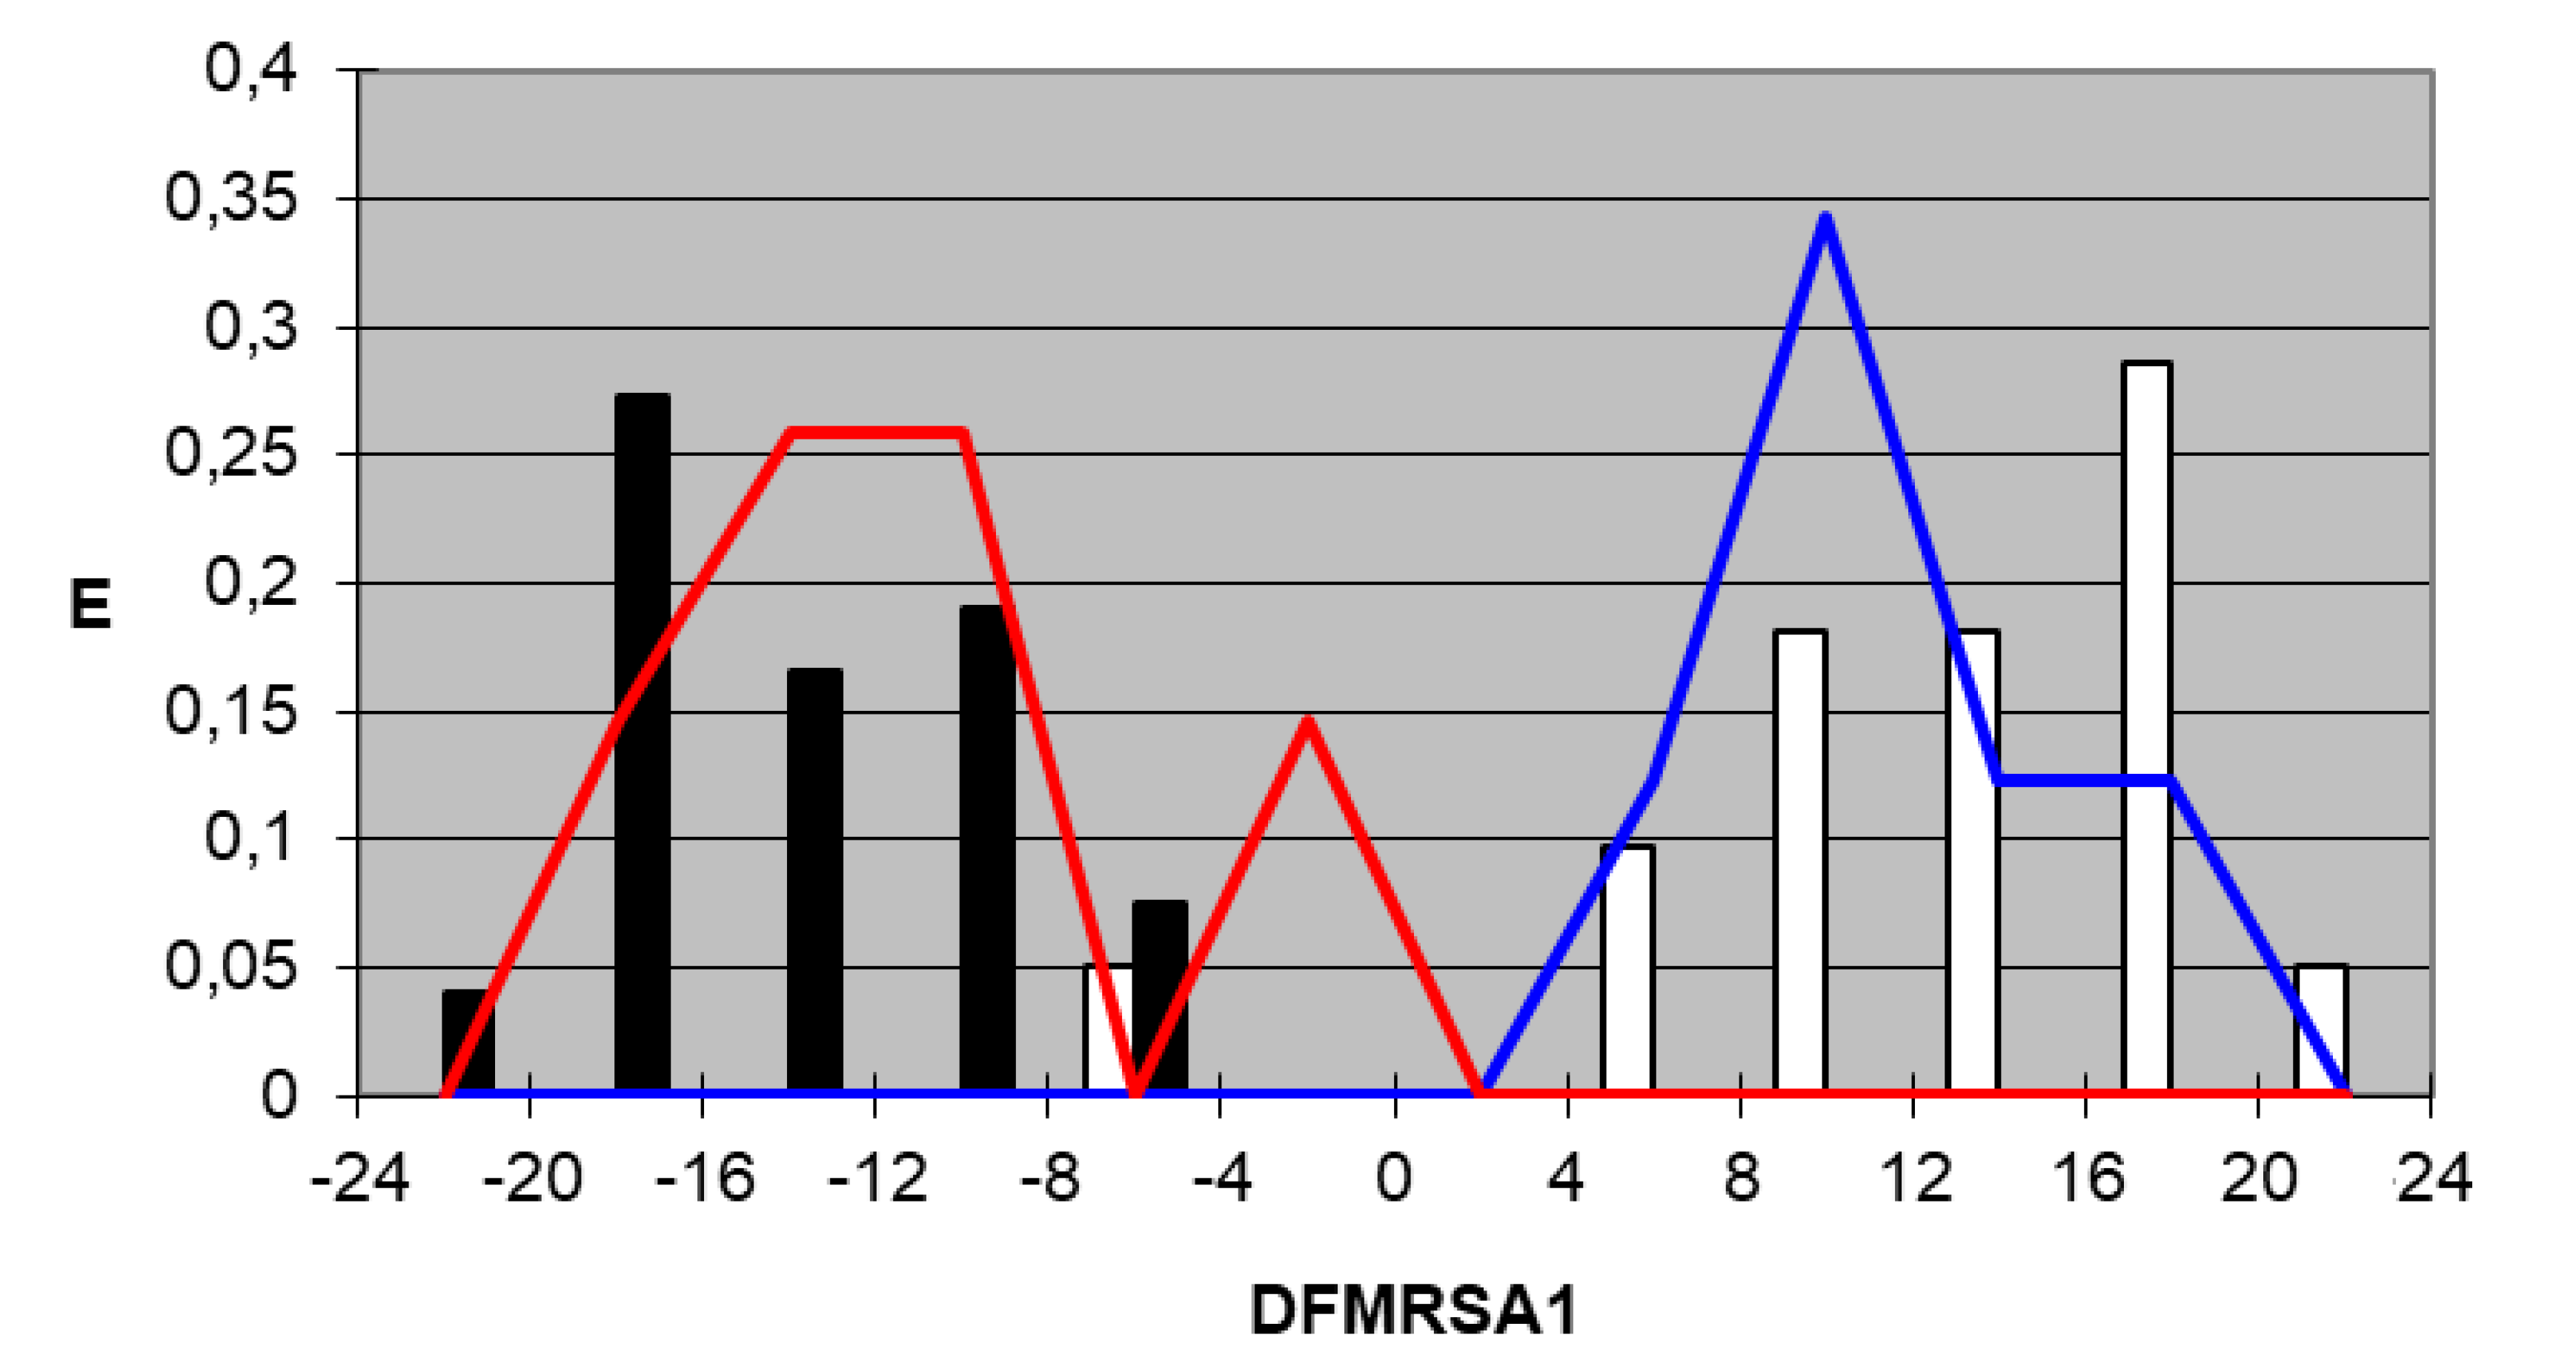
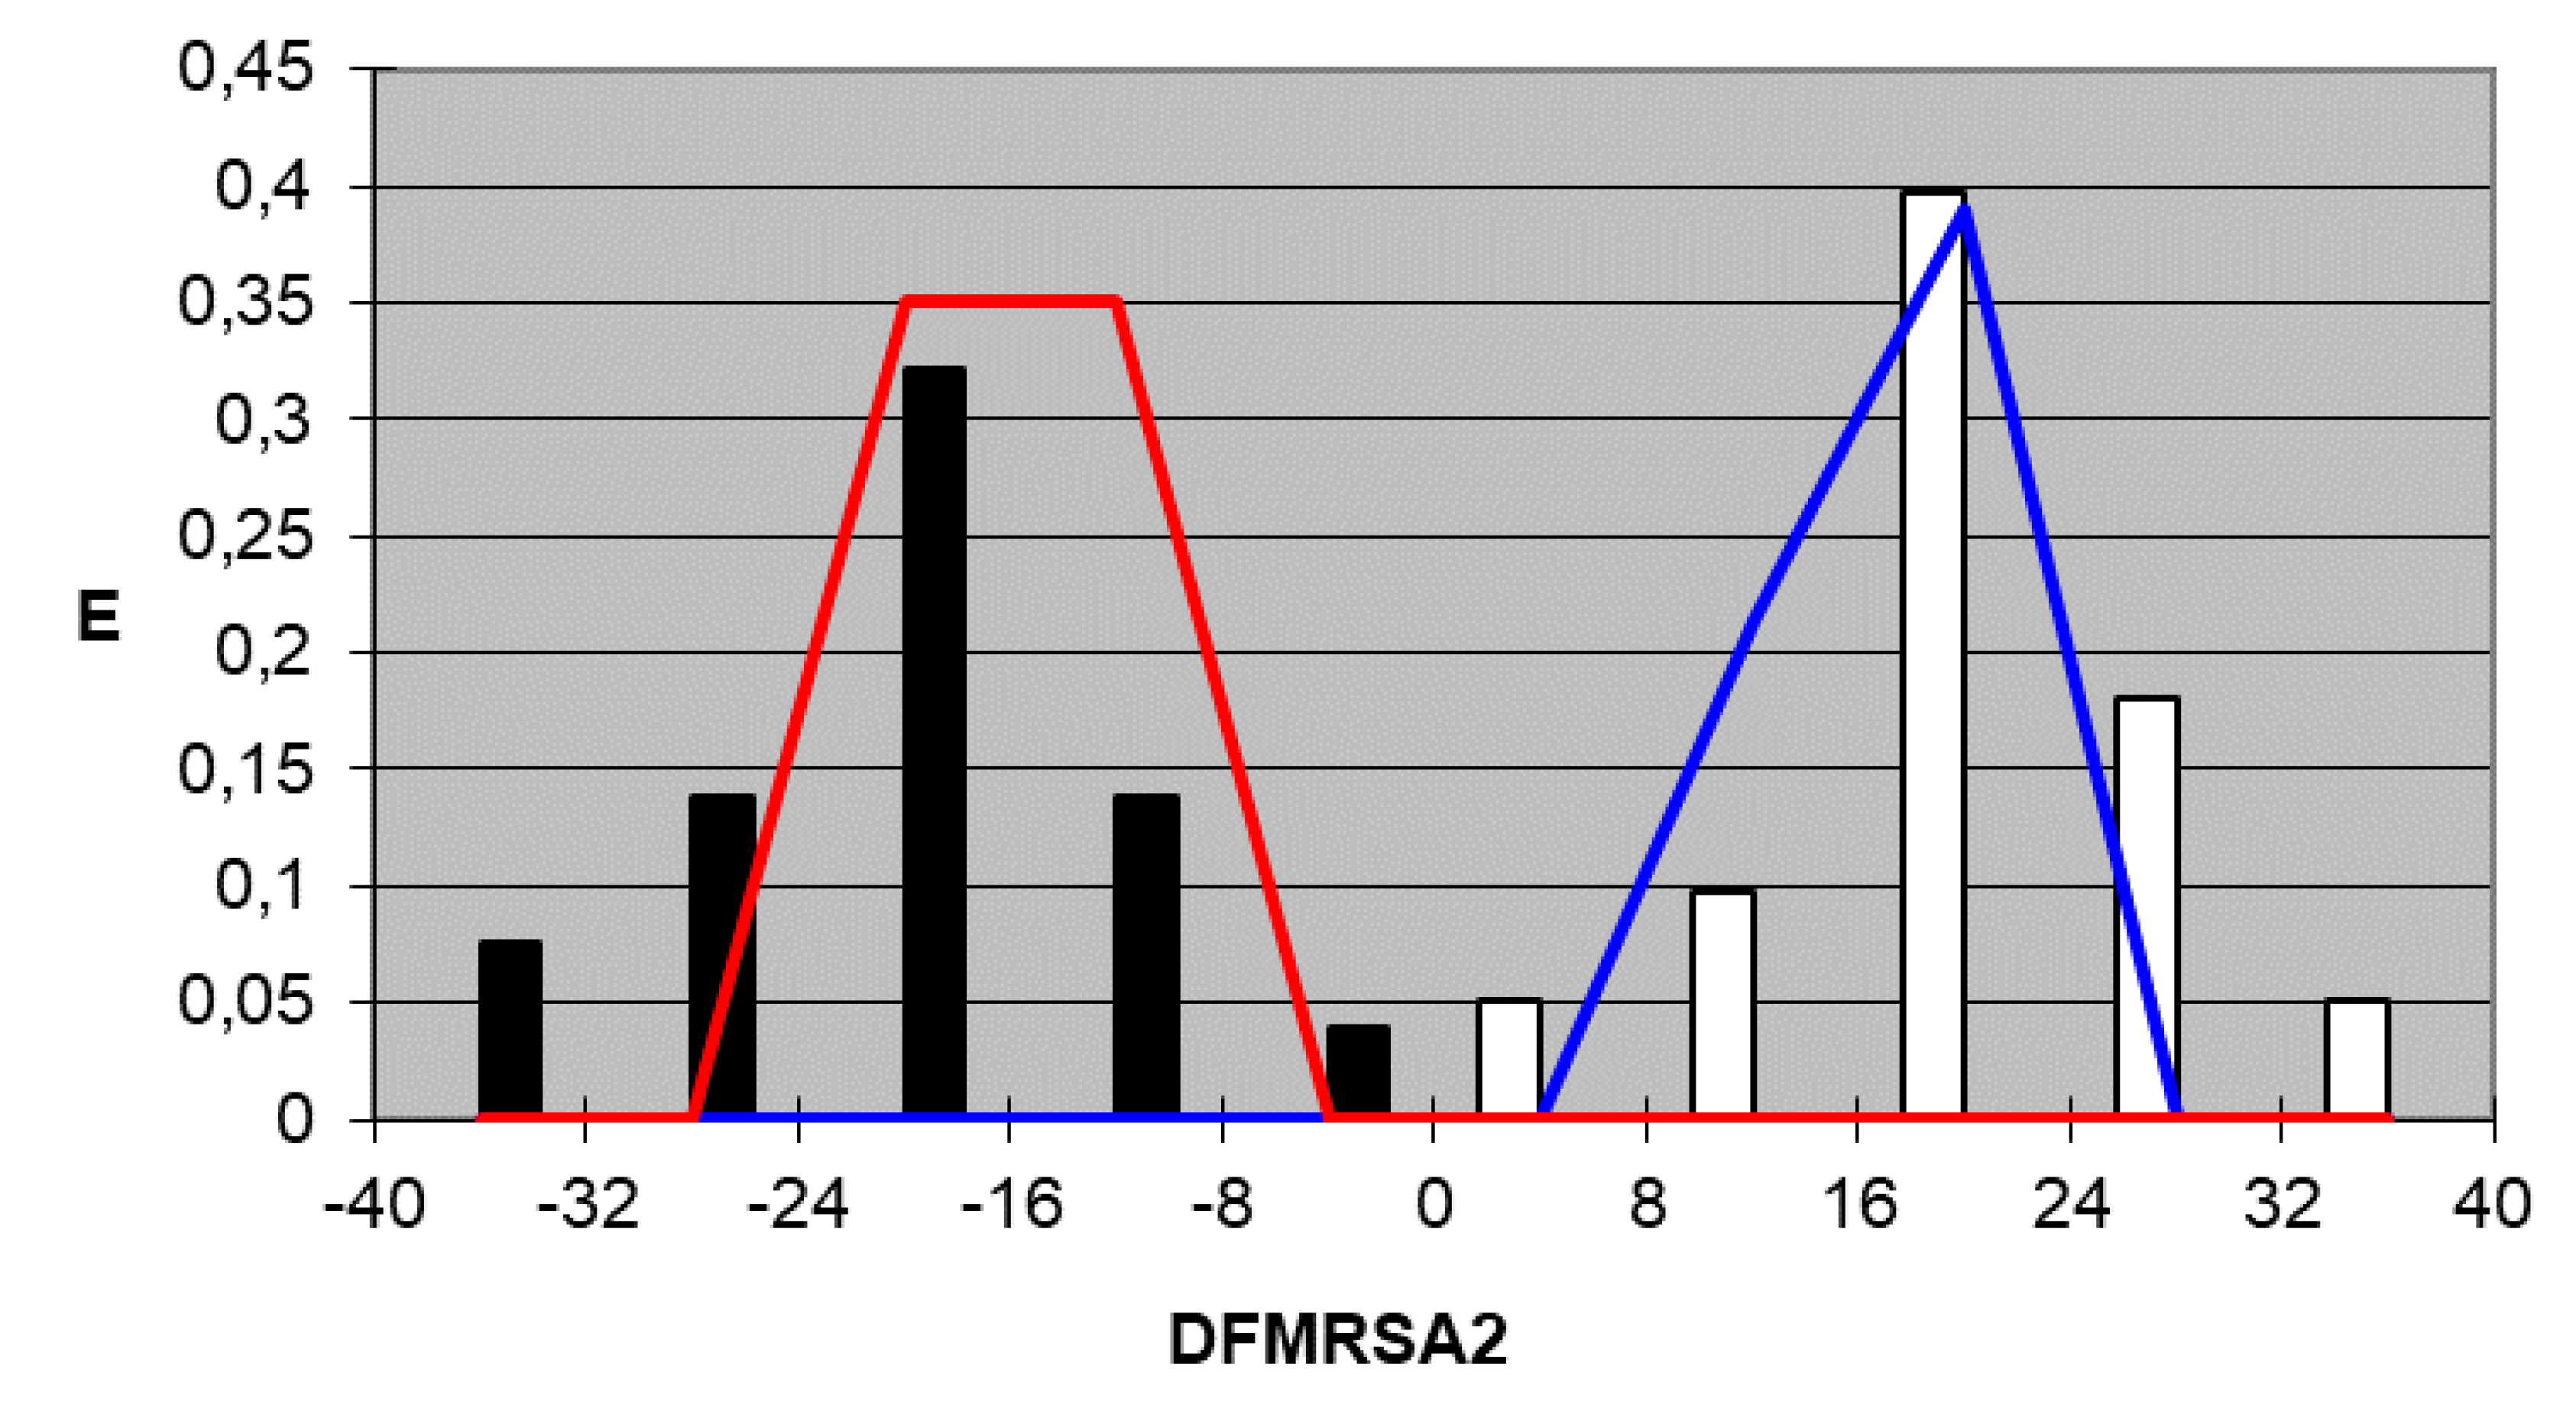
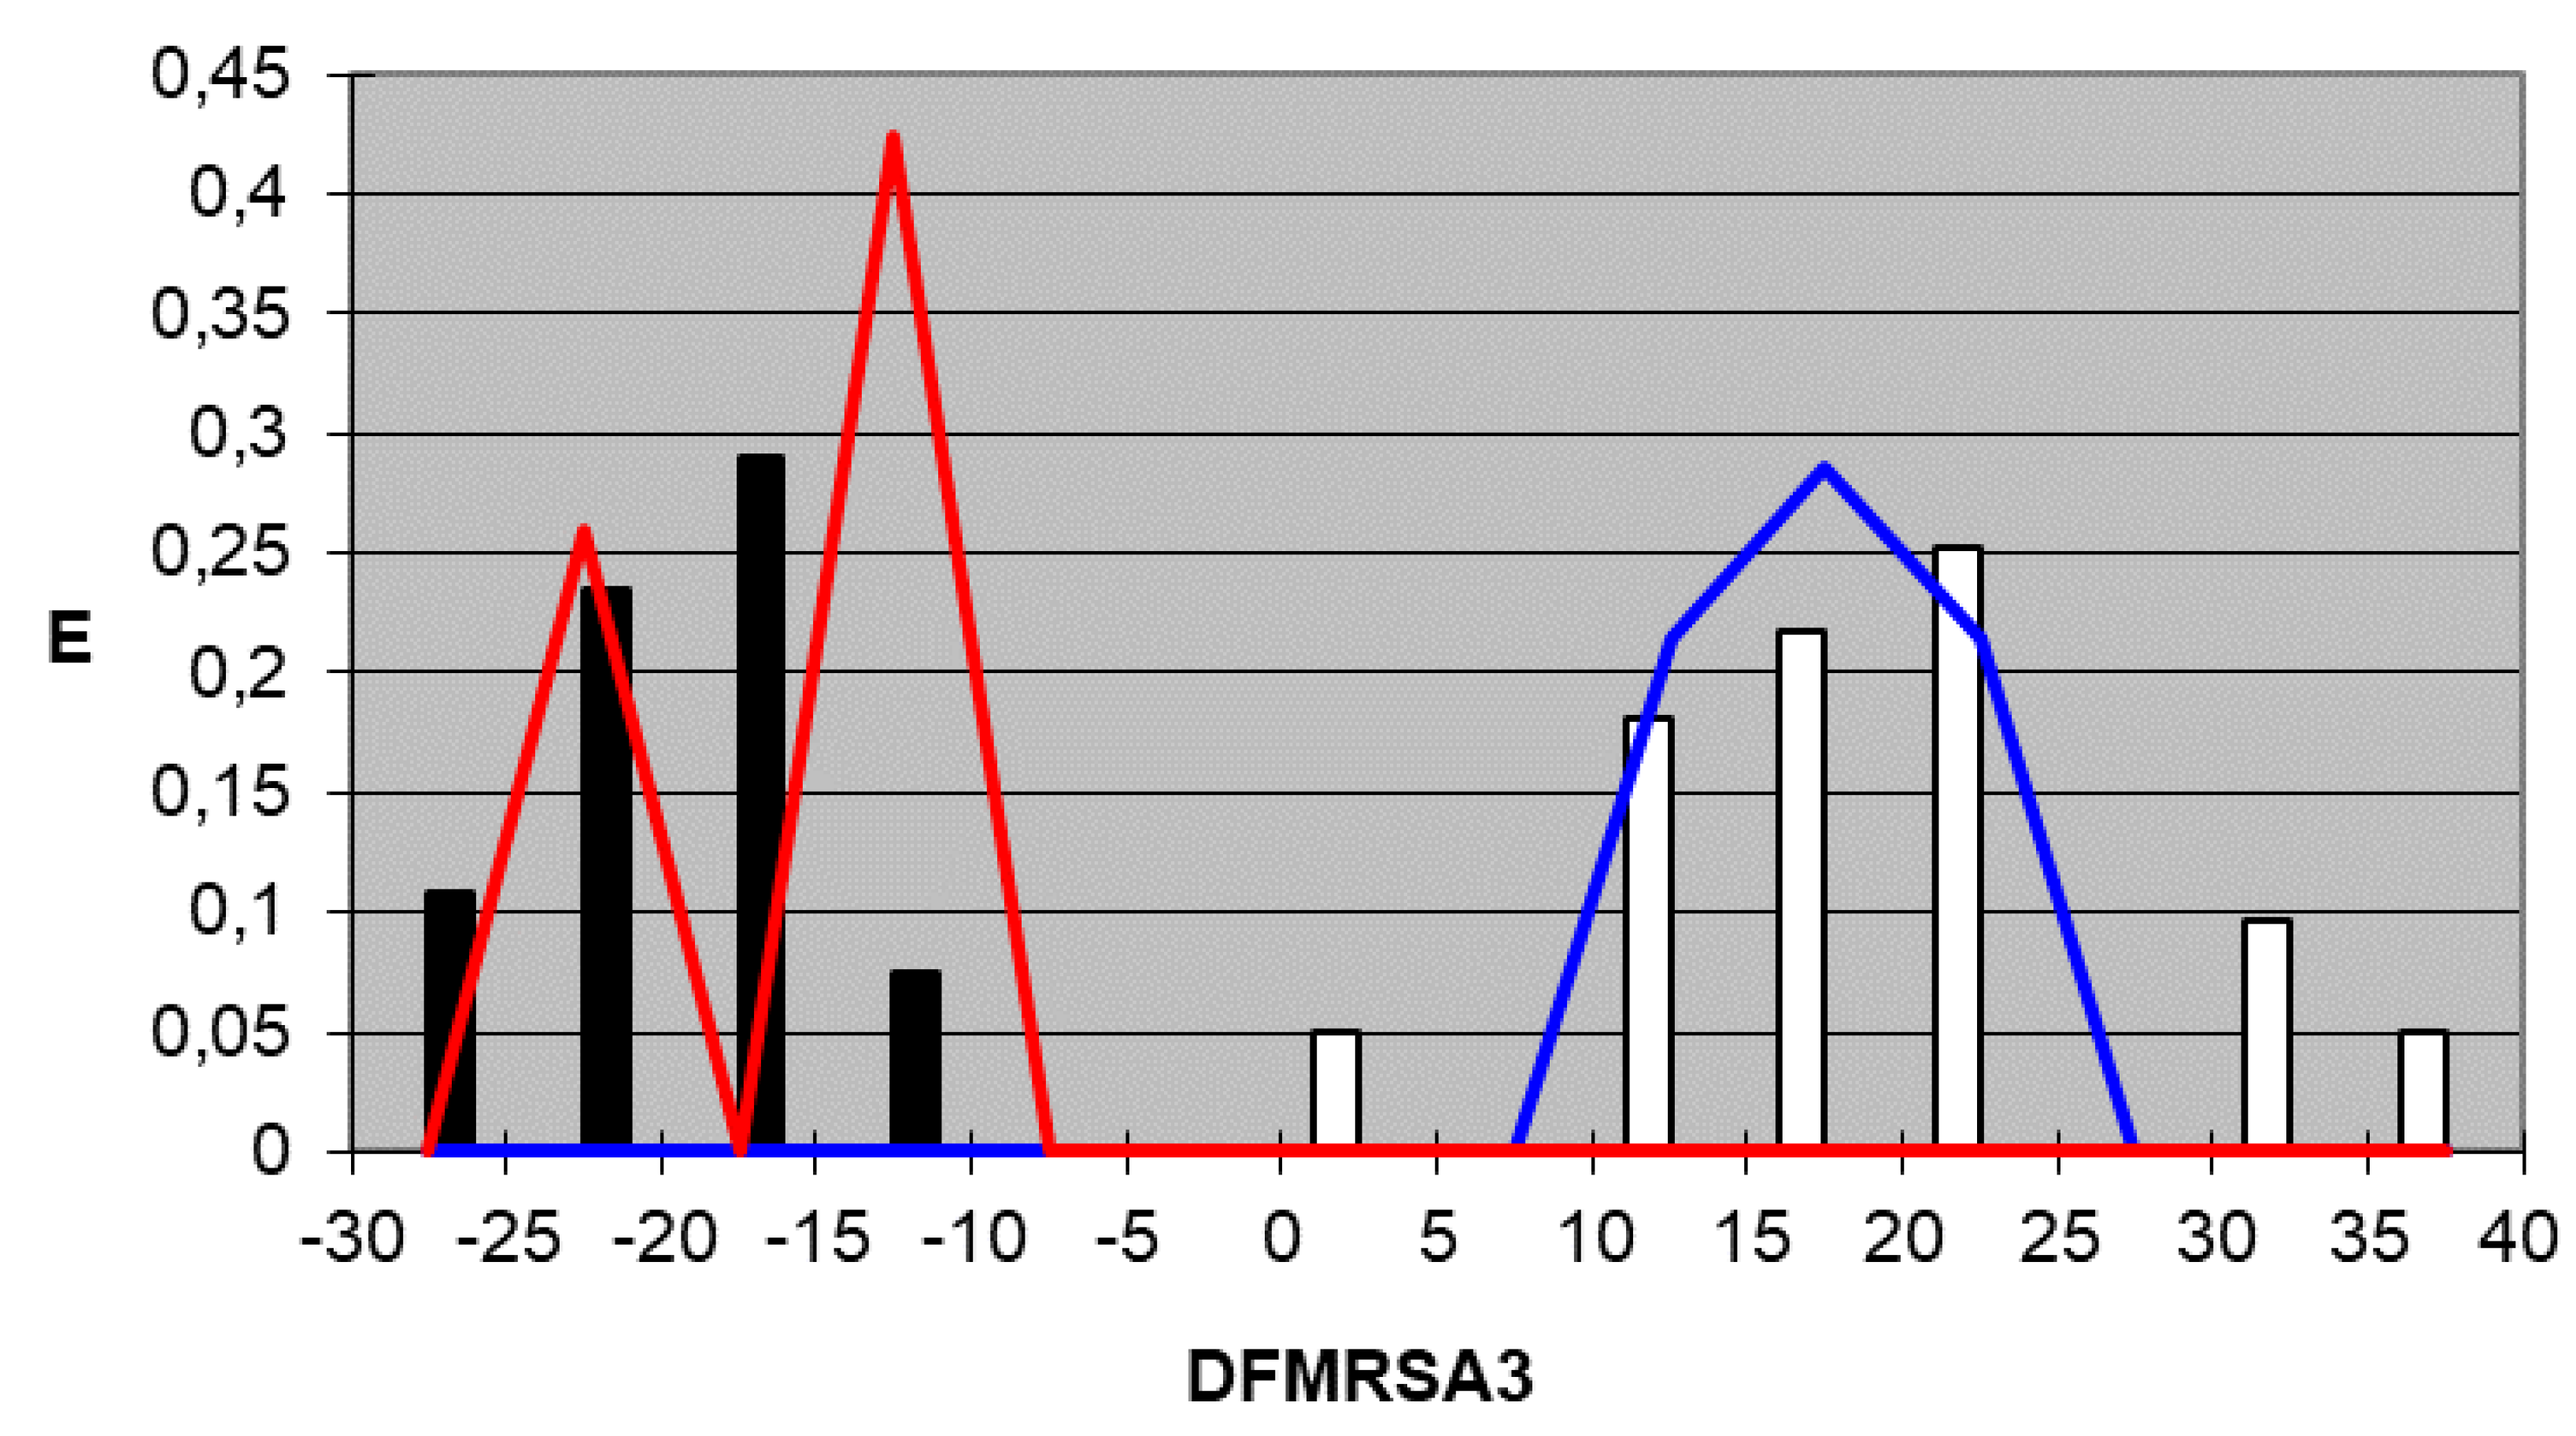
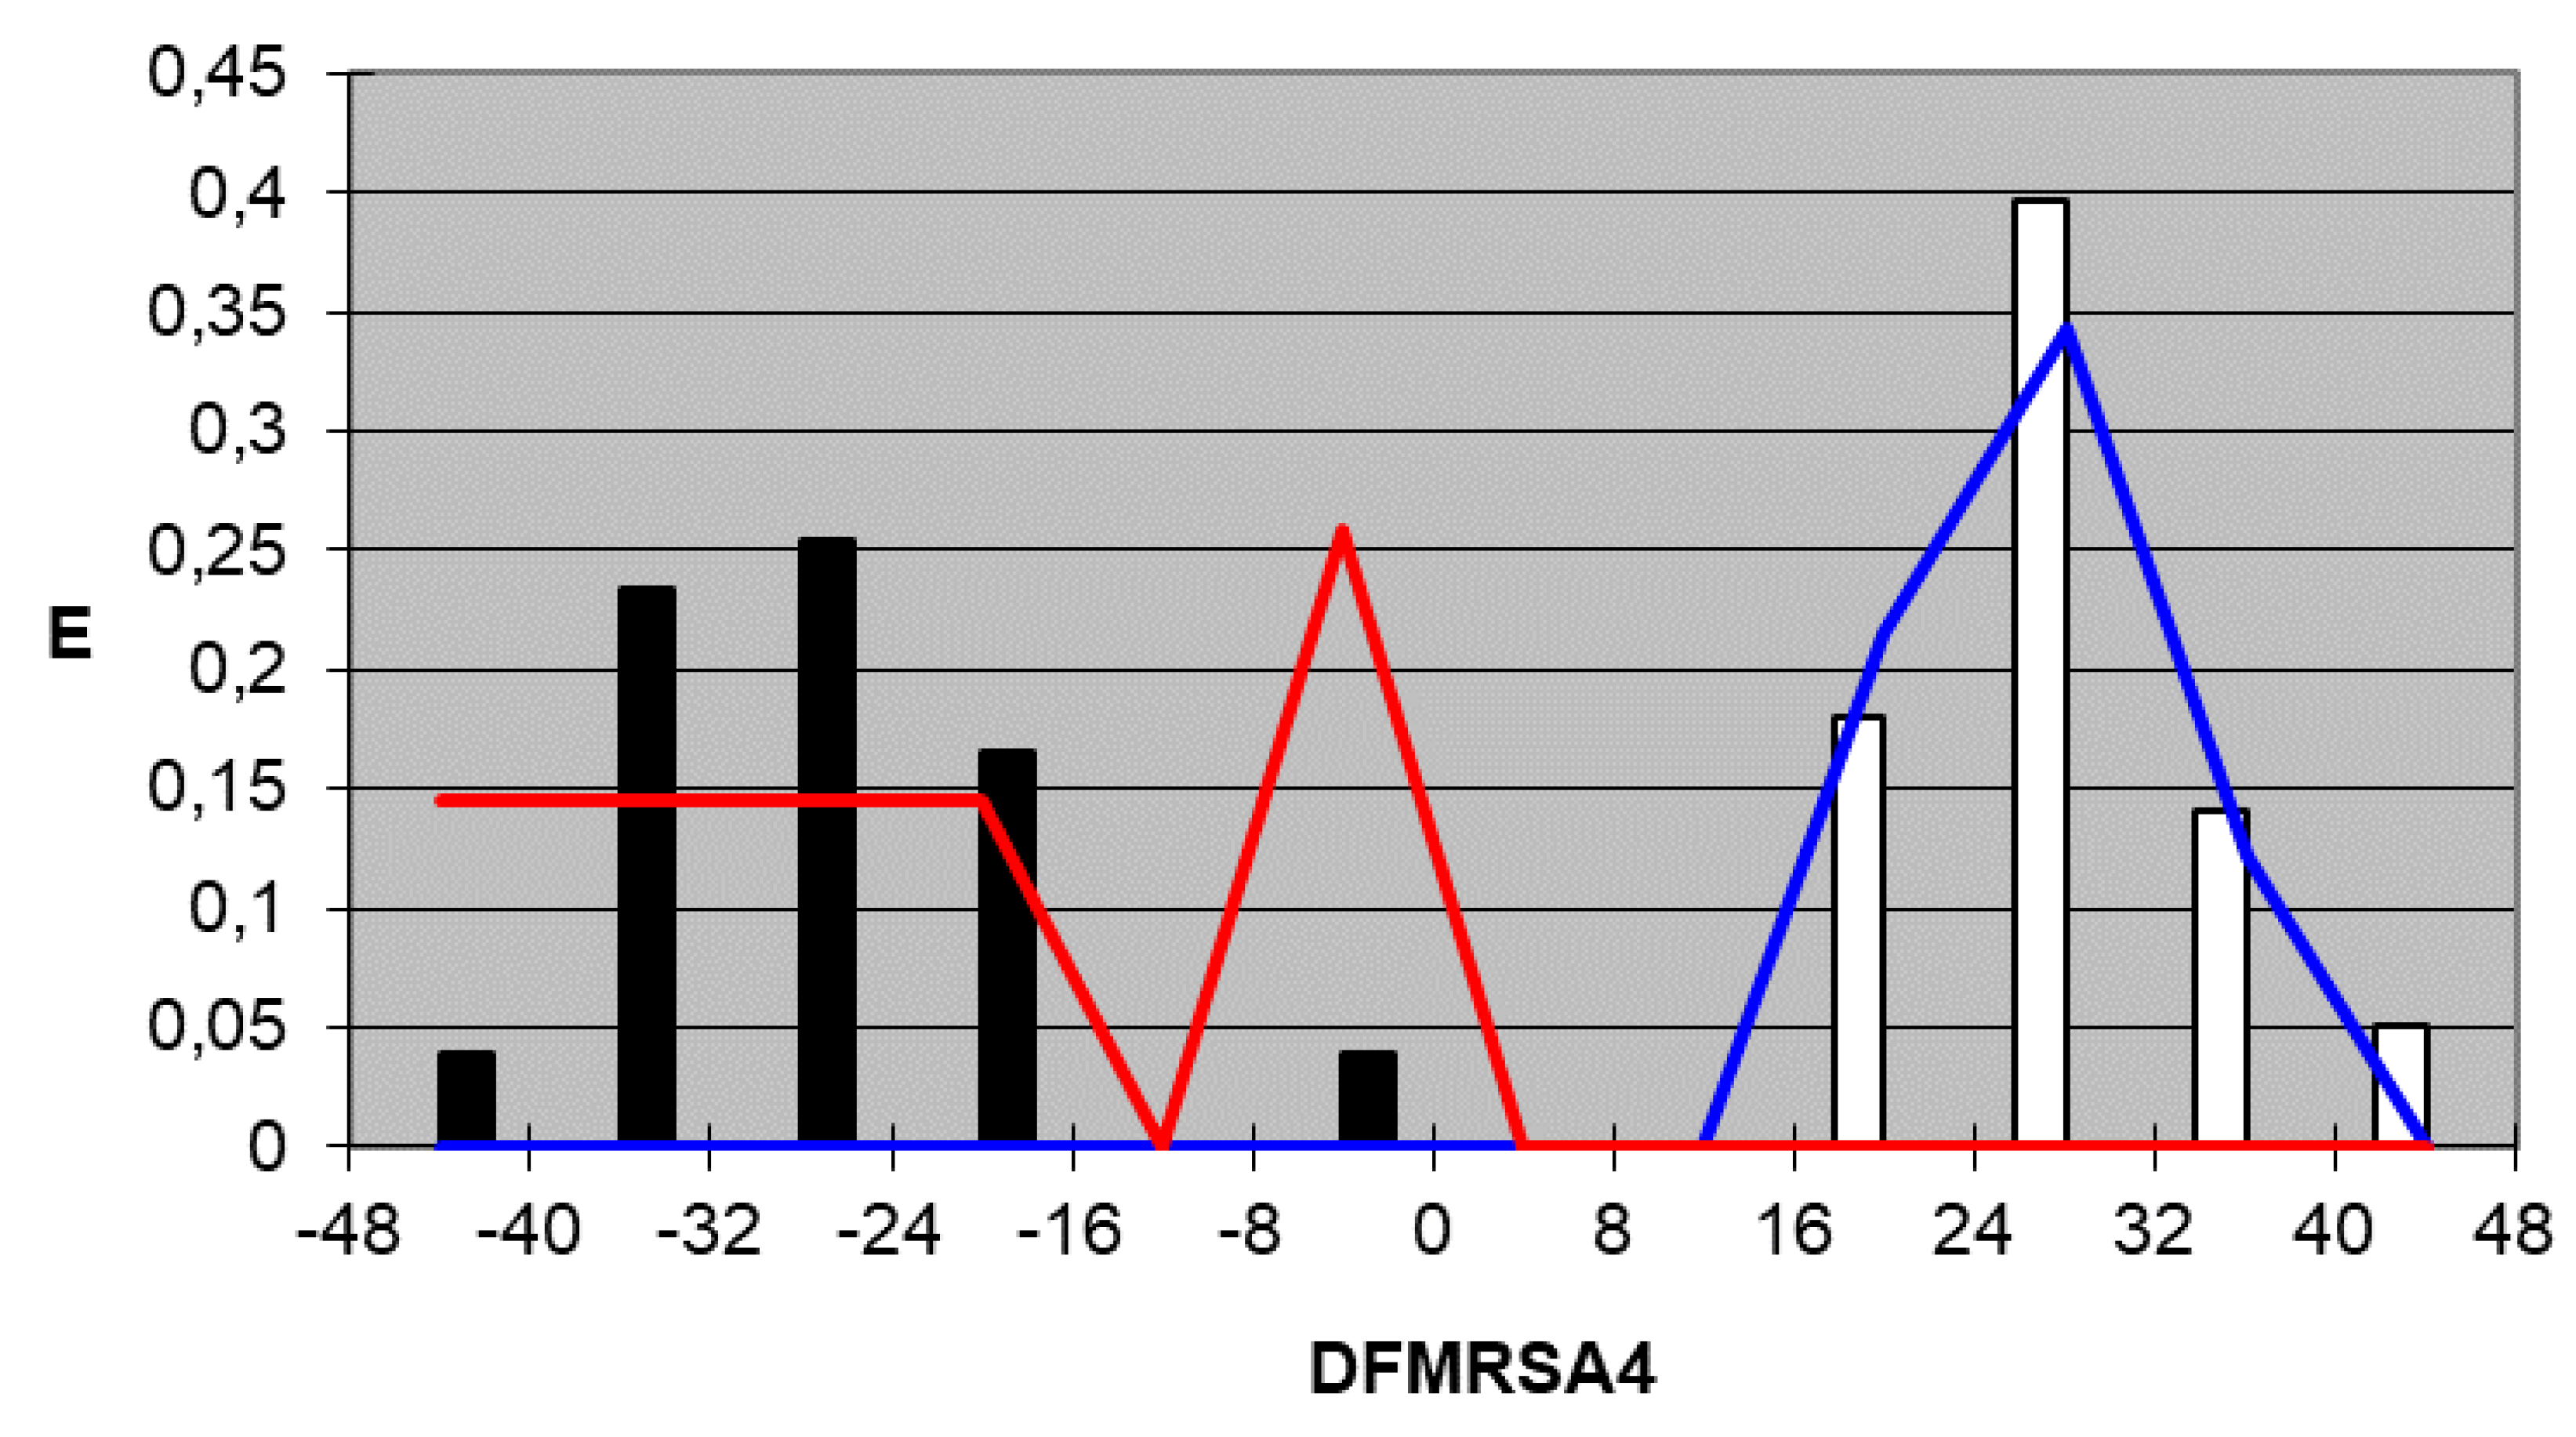
2. Results
N = 43 λ = 0.1223510 F = 68.145
N = 43 λ = 0.0865409 F = 100.275
N = 43 λ = 0.0894309 F = 96.727
N = 43 λ = 0.0628582 F = 141.634
3. Discussion


4. Materials and Methods
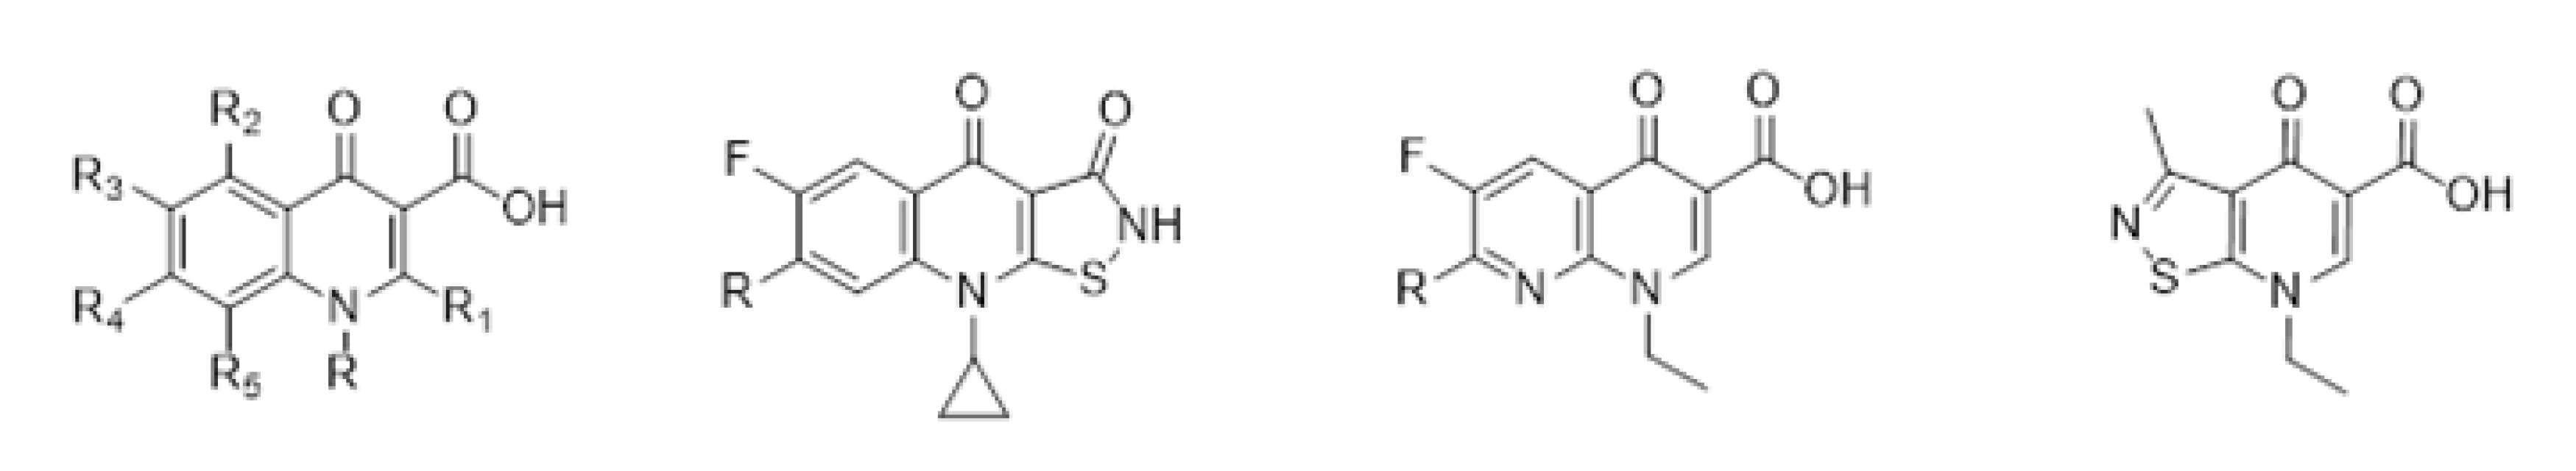
4.1. Compound Selection
4.2. Topological Descriptors
4.3. Linear Discriminant Analysis (LDA)
4.4. Pharmacological Distribution Diagrams (PDD)
5. Conclusions
Supplementary Materials
Author Contributions
Funding
Institutional Review Board Statement
Informed Consent Statement
Data Availability Statement
Acknowledgments
Conflicts of Interest
References
- Uhlemann, A.C.; Otto, M.; Lowy, F.D.; DeLeo, F.R. Evolution of community- and healthcare-associated methicillin-resistant Staphylococcus aureus. Infect. Genet. Evol. 2014, 21, 563–574. [Google Scholar] [CrossRef] [Green Version]
- Jevons, P.M. “Celbenin”-resistant staphylococci. Br. Med. J. 1961, 1, 124–125. [Google Scholar] [CrossRef]
- Alvan, G.; Edlund, C.; Heddini, A. The global need for effective antibiotics-A summary of plenary presentations. Drug Resist. Updates 2011, 14, 70–76. [Google Scholar] [CrossRef] [PubMed]
- Adegoke, A.A.; Faleye, A.C.; Singh, G.; Stenström, T.A. Antibiotic-Resistant Superbugs: Assessment of the Interrelationshio of Occurrence in Clinical Settings and Environmental Niches. Molecules 2016, 22, 29. [Google Scholar] [CrossRef] [PubMed]
- Bruniera, F.R.; Ferreira, F.M.; Saviolli, L.R.M.; Bacci, M.R.; Feder, D.; da Luz Gonçalves Pedreira, M.; Sorgini Peterlini, M.A.; Azzalis, L.A.; Campos Junqueira, V.B.; Fonseca, F.L.A. The use of vancomycin with its therapeutic and adverse effects: A review. Eur. Rev. Med. Pharmacol. Sci. 2015, 19, 694–700. [Google Scholar]
- Boswihi, S.S.; Udo, E.E. Methichillin-resistant Staphylococcus aureus: An update on the epidemiology, treatment options and infection control. Curr. Med. Res. Pract. 2018, 8, 18–24. [Google Scholar] [CrossRef]
- World Health Organization. WHO Priority Pathogens List for R&D of New Antibiotics. Available online: http://www.who.int/medicines/publications/WHO-PPL-Short_Summary_25Feb-ET_NM_WHO.pdf?ua=1 (accessed on 16 March 2021).
- European Center for Disease Prevention and Control. Antimicrobial resistance in the EU/EEA (EARS-Net)—Annual Epidemiological Report for 2019. Available online: https://www.ecdc.europa.eu/sites/default/files/documents/surveillance-antimicrobial-resistance-Europe-2019.pdf (accessed on 16 March 2021).
- Foster, T.J. Immune evasion by staphylococci. Nat. Rev. Microbiol. 2005, 3, 948–958. [Google Scholar] [CrossRef]
- Pujol, M.; Peña, C.; Pallares, R.; Ayats, J.; Ariza, J.; Gudiol, F. Risk factors for nosocomial bacteremia due to methicillin-resistant Staphylococcus aureus. Eur. J. Clin. Microbiol. Infect. Dis. 1994, 13, 96–102. [Google Scholar] [CrossRef] [Green Version]
- DeLeo, F.R.; Otto, M.; Kreiswirth, B.N.; Chambers, H.F. Community-associated methicillin-resistant Staphylococcus aureus. Lancet 2010, 375, 1557–1568. [Google Scholar] [CrossRef] [Green Version]
- Moellering, R.C. MRSA: The first half century. J. Antimicrob. Chemother. 2012, 67, 4–11. [Google Scholar] [CrossRef] [Green Version]
- World Health Organization. 10 Facts on Antimicrobial Resistance. Available online: http://www.who.int/features/factfiles/antimicrobial_resistance/en/ (accessed on 16 March 2021).
- Lipinski, C.A. Lead- and drug-like compounds: The rule-of-five revolution. Drug Discov. Today Technol. 2004, 1, 337–341. [Google Scholar] [CrossRef] [PubMed]
- Khan, A.U. Descriptors and their selection methods in QSAR analysis: Paradigm for drug design. Drug Discov. Today 2016, 21, 1291–1302. [Google Scholar]
- Maldonado, F.H. El análisis multivariante en la investigación con antimicrobianos. Rev. Esp. Quimioterap. 2007, 20, 300–309. [Google Scholar]
- Baskin, I.I.; Palyulin, V.A.; Zefirov, N.S. Neural networks in building QSAR models. Methods Mol. Biol. 2008, 458, 137–158. [Google Scholar] [PubMed]
- Furnival, G.M.; Wilson, R.W. Regressions by leaps and bounds. Technometrics 1974, 16, 499–511. [Google Scholar] [CrossRef]
- Horn, J.L. A rationale and test for the number of factors in factor analysis. Psychometrika 1965, 30, 179–185. [Google Scholar] [CrossRef]
- Meglen, R.R. Examining large databases: A chemometric approach using principal component analysis. J. Chemom. 1991, 5, 163–179. [Google Scholar] [CrossRef]
- Suay-Garcia, B.; Bueso-Bordils, J.I.; Falcó, A.; Pérez-Gracia, M.T.; Antón-Fos, G.; Alemán-López, P. Quantitative structure–activity relationship methods in the discovery and development of antibacterials. WIREs Comput. Mol. Sci. 2020, 10, e1472. [Google Scholar] [CrossRef]
- Wang, T.; Yuan, X.S.; Wu, M.B.; Lin, J.P.; Yang, L.R. The advancement of multidimensional QSAR for novel drug discovery—where are we headed? Expert Opin. Drug Discov. 2017, 12, 769–784. [Google Scholar] [CrossRef] [PubMed]
- Ovidiu, I. Chemical graphs, molecular matrices and topological indices in chemoinformatics and quantitative structure-activity relationships. Curr. Comput. Drug. Des. 2013, 9, 153–163. [Google Scholar]
- Hawkins, D.M. The problem of overfitting. J. Chem. Inf. Comput. Sci. 2004, 44, 1–12. [Google Scholar] [CrossRef]
- Rotschafer, J.C.; Ullman, M.A.; Sullivan, C.J. Optimal use of fluoroquinolones in the intensive care unit setting. Crit. Care Clin. 2011, 27, 95–106. [Google Scholar] [CrossRef] [PubMed]
- Mitscher, L.A. Bacterial topoisomerase inhibitors: Quinolone and pyridine antibacterial agents. Chem. Rev. 2005, 105, 559–592. [Google Scholar] [CrossRef] [PubMed]
- Suay-Garcia, B.; Falcó, A.; Bueso-Bordils, J.I.; Anton-Fos, G.M.; Pérez-Gracia, M.T.; Alemán-López, P.A. Tree-based QSAR model for drug repurposing in the discovery of new antibacterial compounds against Escherichia coli. Pharmaceuticals 2020, 13, 431. [Google Scholar] [CrossRef] [PubMed]
- Rouvray, D.H. Predicting chemistry from topology. Sci. Am. 1986, 255, 40–47. [Google Scholar] [CrossRef]
- Afantitis, A.; Melagraki, G.; Sarimveis, H.; Koutentis, P.A.; Markopoulous, J.; Igglessi-Mrkopoulou, O. A novel simple QSAR model for the prediction of anti-HIV activity using multiple regression analysis. Mol. Divers. 2006, 10, 405–414. [Google Scholar] [CrossRef]
- Duart, M.J.; García-Doménech, R.; Gálvez, J.; Alemán, P.A.; Martín-Algarra, R.V.; Antón-Fos, G.M. Application of a mathematical topological pattern of antihistaminic activity for the selection of new drug candidates and pharmacology assays. J. Med. Chem. 2006, 49, 3667–3673. [Google Scholar] [CrossRef]
- Zanni, R.; Galvez-Llompart, M.; Morell, C.; Rodríguez-Henche, N.; Díaz-Laviada, I.; Recio-Iglesias, M.C.; Garcia-Domenech, R.; Galvez, J. Novel cancer chemotherapy hits by molecular topology: Dual Akt and Beta-catenin inhibitors. PLoS ONE 2015, 10, e0124244. [Google Scholar] [CrossRef]
- Wang, J.; Land, D.; Ono, K.; Galvez, J.; Zhao, W.; Vempati, P.; Steele, J.W.; Cheng, A.; Yamada, M.; Levine, S.; et al. Molecular topology as novel strategy for discovery of drugs with Ab lowering and anti-aggregation dual activities for Alzheimer’s disease. PLoS ONE 2014, 9, e92750. [Google Scholar]
- Bueso-Bordils, J.I.; Alemán-López, P.A.; Suay-García, B.; Martín-Algarra, R.; Duart, M.J.; Falcó, A.; Antón-Fos, G.M. Molecular topology for the discovery of new broad-spectrum antibacterial drugs. Biomolecules 2020, 10, 1343. [Google Scholar] [CrossRef]
- Bueso-Bordils, J.I.; Pérez-Gracia, M.T.; Suay-García, B.; Duart, M.J.; Martín-Algarra, R.V.; Lahuerta-Zamora, L.; Antón-Fos, G.M.; Alemán-López, P.A. Topological pattern for the search of new active drugs against methicillin resistant Staphylococcus aureus. Eur. J. Med. Chem. 2017, 138, 807–815. [Google Scholar] [CrossRef]
- Kier, L.B.; Hall, L.H. The E-state as an extended free valence. J. Chem. Inf. Comput. Sci. 1997, 37, 548–552. [Google Scholar] [CrossRef]
- Gálvez, J.; García-Domenech, R.; de Julián-Ortiz, J.V.; Soler, R. Topological approach to drug design. J. Chem. Inf. Comput. Sci. 1995, 35, 272–284. [Google Scholar] [CrossRef]
- Randic, M. On characterization of molecular branching. J. Am. Chem. Soc. 1975, 97, 6609–6615. [Google Scholar] [CrossRef]
- Jain, D.V.S.; Singh, S.; Gombar, V. Correlations between topological features and physicochemical properties of molecules. Proc. Indian Acad. Sci. 1984, 93, 927–945. [Google Scholar]
- Talele, T.T. The “cyclopropyl fragment” is a versatile player that frequently appears in preclinical/clinical drug molecules. J. Med. Chem. 2016, 59, 8712–8756. [Google Scholar] [CrossRef]
- Foroumadi, A.; Ghodsi, S.; Emami, S.; Najjari, S.; Samadi, N.; Faramarzi, M.A.; Beikmohammadi, L.; Shirazi, F.H.; Shafiee, A. Synthesis and antibacterial activity of new fluoroquinolones containing a substituted N-(phenethyl)piperazine moiety. Bioorg. Med. Chem. Lett. 2006, 16, 3499–3503. [Google Scholar] [CrossRef]
- Gálvez, J.; García-Domenech, R.; de Gregorio Alapont, C.; de Julián-Ortiz, J.V.; Popa, L. Pharmacological distribution diagrams: A tool for de novo drug design. J. Mol. Graph. 1996, 14, 272–276. [Google Scholar] [CrossRef]
- CLSI. Performance Standards for Antimicrobial Susceptibility Testing; Twenty-Second Informational Supplement: CLSI Document M100-S22; Clinical and Laboratory Standards Institute: Wayne, PA, USA, 2012; Volume 32. [Google Scholar]
- DESMOL13 Software; Unidad de Investigación de Diseño de Fármacos y Conectividad Molecular, Facultad de Farmacia, Universitat de València: Valencia, Spain, 2000.
- Hall, L.H. MOLCONN-Z Software; Eastern Nazarene College: Quincy, MA, USA, 1995. [Google Scholar]
- Dixon, W.J. BMDP Statistical Software; University of California: Berkeley, CA, USA, 1990. [Google Scholar]


| Group | Active | Inactive | % Success |
|---|---|---|---|
| Training active | 18 | 1 | 94.7 |
| Training inactive | 0 | 24 | 100 |
| Test active | 7 | 0 | 100 |
| Test inactive | 0 | 6 | 100 |
| JK 1 Training active | 18 | 1 | 94.7 |
| JK 1 Training inactive | 0 | 24 | 100 |
| Group | Active | Inactive | % Success |
|---|---|---|---|
| Training active | 19 | 0 | 100 |
| Training inactive | 0 | 24 | 100 |
| Test active | 7 | 0 | 100 |
| Test inactive | 0 | 6 | 100 |
| JK Training active | 18 | 1 | 94.7 |
| JK Training inactive | 0 | 24 | 100 |
| Group | Active | Inactive | % Success |
|---|---|---|---|
| Training active | 19 | 0 | 100 |
| Training inactive | 0 | 24 | 100 |
| Test active | 7 | 0 | 100 |
| Test inactive | 0 | 6 | 100 |
| JK Training active | 19 | 0 | 100 |
| JK Training inactive | 0 | 24 | 100 |
| Group | Active | Inactive | % Success |
|---|---|---|---|
| Training active | 19 | 0 | 100 |
| Training inactive | 0 | 24 | 100 |
| Test active | 7 | 0 | 100 |
| Test inactive | 0 | 6 | 100 |
| JK Training active | 19 | 0 | 100 |
| JK Training inactive | 0 | 24 | 100 |
| Compound | DFMRSA1 1 | Clas 2 | DFMRSA2 1 | Clas 2 | DFMRSA3 1 | Clas 2 | DFMRSA4 1 | Clas 2 |
|---|---|---|---|---|---|---|---|---|
| 11act4 | 16.626 | + | 16.357 | + | 19.694 | + | 27.203 | + |
| 11act5 | 11.683 | + | 19.403 | + | 20.222 | + | 31.400 | + |
| 14act5 | 15.581 | + | 21.126 | + | 20.144 | + | 27.456 | + |
| 17act4 | 16.644 | + | 23.153 | + | 19.97 | + | 27.456 | + |
| 18act4 | 16.891 | + | 25.075 | + | 20.329 | + | 31.400 | + |
| 21act5 | 5.8776 | + | 16.021 | + | 18.056 | + | 18.668 | + |
| 22act4 | 11.789 | + | 20.928 | + | 13.000 | + | 20.577 | + |
| 28act4 | 17.471 | + | 26.089 | + | 20.238 | + | 31.400 | + |
| 30act4 | 15.632 | + | 22.201 | + | 16.962 | + | 24.358 | + |
| 34act5 | 17.661 | + | 24.684 | + | 32.461 | + | 39.959 | + |
| 35act5 | 17.614 | + | 23.094 | + | 32.469 | + | 39.959 | + |
| 4act5 | 17.676 | + | 23.776 | + | 23.800 | + | 34.920 | + |
| 5j-act1 | 21.524 | + | 36.244 | + | 36.171 | + | 42.102 | + |
| 5n-act1 | 11.424 | + | 18.699 | + | 11.661 | + | 25.305 | + |
| 5o-act1 | 9.171 | + | 8.2196 | + | 16.414 | + | 25.681 | + |
| 5q-act1 | 13.671 | + | 15.283 | + | 14.049 | + | 23.702 | + |
| 5r-act1 | 13.698 | + | 16.238 | + | 12.881 | + | 26.177 | + |
| DX-619 | −5.262 | - | 4.795 | + | 0.783 | - | 18.497 | + |
| Sitafloxacin | 6.404 | + | 26.299 | + | 24.666 | + | 31.369 | + |
| Compound | DFMRSA1 | Clas | DFMRSA2 | Clas | DFMRSA3 | Clas | DFMRSA4 | Clas |
|---|---|---|---|---|---|---|---|---|
| 5i-in1 | −10.922 | - | −21.009 | - | −17.353 | - | −31.118 | - |
| in1-27j | −22.140 | - | −32.034 | - | −19.221 | - | −19.988 | - |
| in10-4Ib | −16.168 | - | −22.602 | - | −15.965 | - | −26.738 | - |
| in2-4b | −14.542 | - | −18.473 | - | −16.944 | - | −23.370 | - |
| in1-21a | −16.970 | - | −14.755 | - | −15.335 | - | −35.360 | - |
| in104IIa | −12.625 | - | −17.332 | - | −20.429 | - | −34.317 | - |
| in104IIb | −19.293 | - | −21.486 | - | −17.198 | - | −34.565 | - |
| in2-4e | −11.261 | - | −19.599 | - | −17.474 | - | −30.255 | - |
| in2-4f | −17.167 | - | −18.987 | - | −23.238 | - | −28.553 | - |
| in4-2a | −10.009 | - | −18.479 | - | −21.815 | - | −18.213 | - |
| in5-5d | −9.646 | - | −15.358 | - | −10.418 | - | −4.134 | - |
| in5-5e | −16.077 | - | −18.117 | - | −19.044 | - | −32.963 | - |
| in5-5f | −16.923 | - | −27.682 | - | −18.119 | - | −31.946 | - |
| in5-5i | −17.294 | - | −26.764 | - | −21.206 | - | −31.331 | - |
| in5-5k | −16.676 | - | −16.353 | - | −23.087 | - | −29.665 | - |
| in5-5l | −17.522 | - | −25.918 | - | −22.162 | - | −28.649 | - |
| in6-11a | −8.490 | - | −13.852 | - | −16.405 | - | −28.032 | - |
| in6-11c | −8.617 | - | −21.238 | - | −22.280 | - | −37.466 | - |
| in6-7c | −15.449 | - | −32.295 | - | −14.505 | - | −19.063 | - |
| in6-7e | −5.119 | - | −6.883 | - | −16.149 | - | −19.063 | - |
| in7pge61 | −4.877 | - | −13.953 | - | −28.176 | - | −34.778 | - |
| in8-4b | −14.251 | - | −20.785 | - | −25.718 | - | −36.492 | - |
| in8-4c | −14.397 | - | −19.425 | - | −24.568 | - | −35.308 | - |
| in9-4 | −16.367 | - | −26.331 | - | −25.571 | - | −40.321 | - |
| Actives | ||||||||
| Compound | DFMRSA1 | Clas | DFMRSA2 | Clas | DFMRSA3 | Clas | DFMRSA4 | Clas |
| 10act5 | 11.841 | + | 16.946 | + | 18.803 | + | 26.469 | + |
| 13act4 | 17.105 | + | 21.453 | + | 21.328 | + | 32.447 | + |
| 15act4 | 15.936 | + | 22.277 | + | 20.086 | + | 27.456 | + |
| 19act5 | 11.843 | + | 20.242 | + | 19.797 | + | 27.456 | + |
| 28act5 | 6.900 | + | 8.470 | + | 13.988 | + | 17.946 | + |
| 5m-act1 | 11.522 | + | 17.914 | + | 13.113 | + | 23.108 | + |
| 5p-act1 | 9.293 | + | 9.373 | + | 16.326 | + | 29.218 | + |
| Inactives | ||||||||
| Compound | DFMRSA1 | Clas | DFMRSA2 | Clas | DFMRSA3 | Clas | DFMRSA4 | Clas |
| 25aArt13 | −13.76 | - | −22.394 | - | −14.901 | - | −47.111 | - |
| in8-4a | −14.613 | - | −19.761 | - | −22.232 | - | −29.320 | - |
| in5-5g | −10.006 | - | −14.539 | - | −13.525 | - | −3.536 | - |
| in5-5h | −16.448 | - | −17.199 | - | −22.131 | - | −32.348 | - |
| in5-5j | −10.225 | - | −13.780 | - | −14.556 | - | −0.929 | - |
| in7pge52 | −2.362 | - | −12.941 | - | −12.566 | - | −20.154 | - |
Publisher’s Note: MDPI stays neutral with regard to jurisdictional claims in published maps and institutional affiliations. |
© 2021 by the authors. Licensee MDPI, Basel, Switzerland. This article is an open access article distributed under the terms and conditions of the Creative Commons Attribution (CC BY) license (https://creativecommons.org/licenses/by/4.0/).
Share and Cite
Bueso-Bordils, J.I.; Alemán-López, P.A.; Martín-Algarra, R.; Duart, M.J.; Falcó, A.; Antón-Fos, G.M. Molecular Topology for the Search of New Anti-MRSA Compounds. Int. J. Mol. Sci. 2021, 22, 5823. https://0-doi-org.brum.beds.ac.uk/10.3390/ijms22115823
Bueso-Bordils JI, Alemán-López PA, Martín-Algarra R, Duart MJ, Falcó A, Antón-Fos GM. Molecular Topology for the Search of New Anti-MRSA Compounds. International Journal of Molecular Sciences. 2021; 22(11):5823. https://0-doi-org.brum.beds.ac.uk/10.3390/ijms22115823
Chicago/Turabian StyleBueso-Bordils, Jose I., Pedro A. Alemán-López, Rafael Martín-Algarra, Maria J. Duart, Antonio Falcó, and Gerardo M. Antón-Fos. 2021. "Molecular Topology for the Search of New Anti-MRSA Compounds" International Journal of Molecular Sciences 22, no. 11: 5823. https://0-doi-org.brum.beds.ac.uk/10.3390/ijms22115823