
Optogenetically Controlled Activity Pattern Determines Survival Rate of Developing Neocortical Neurons

 , and
, and 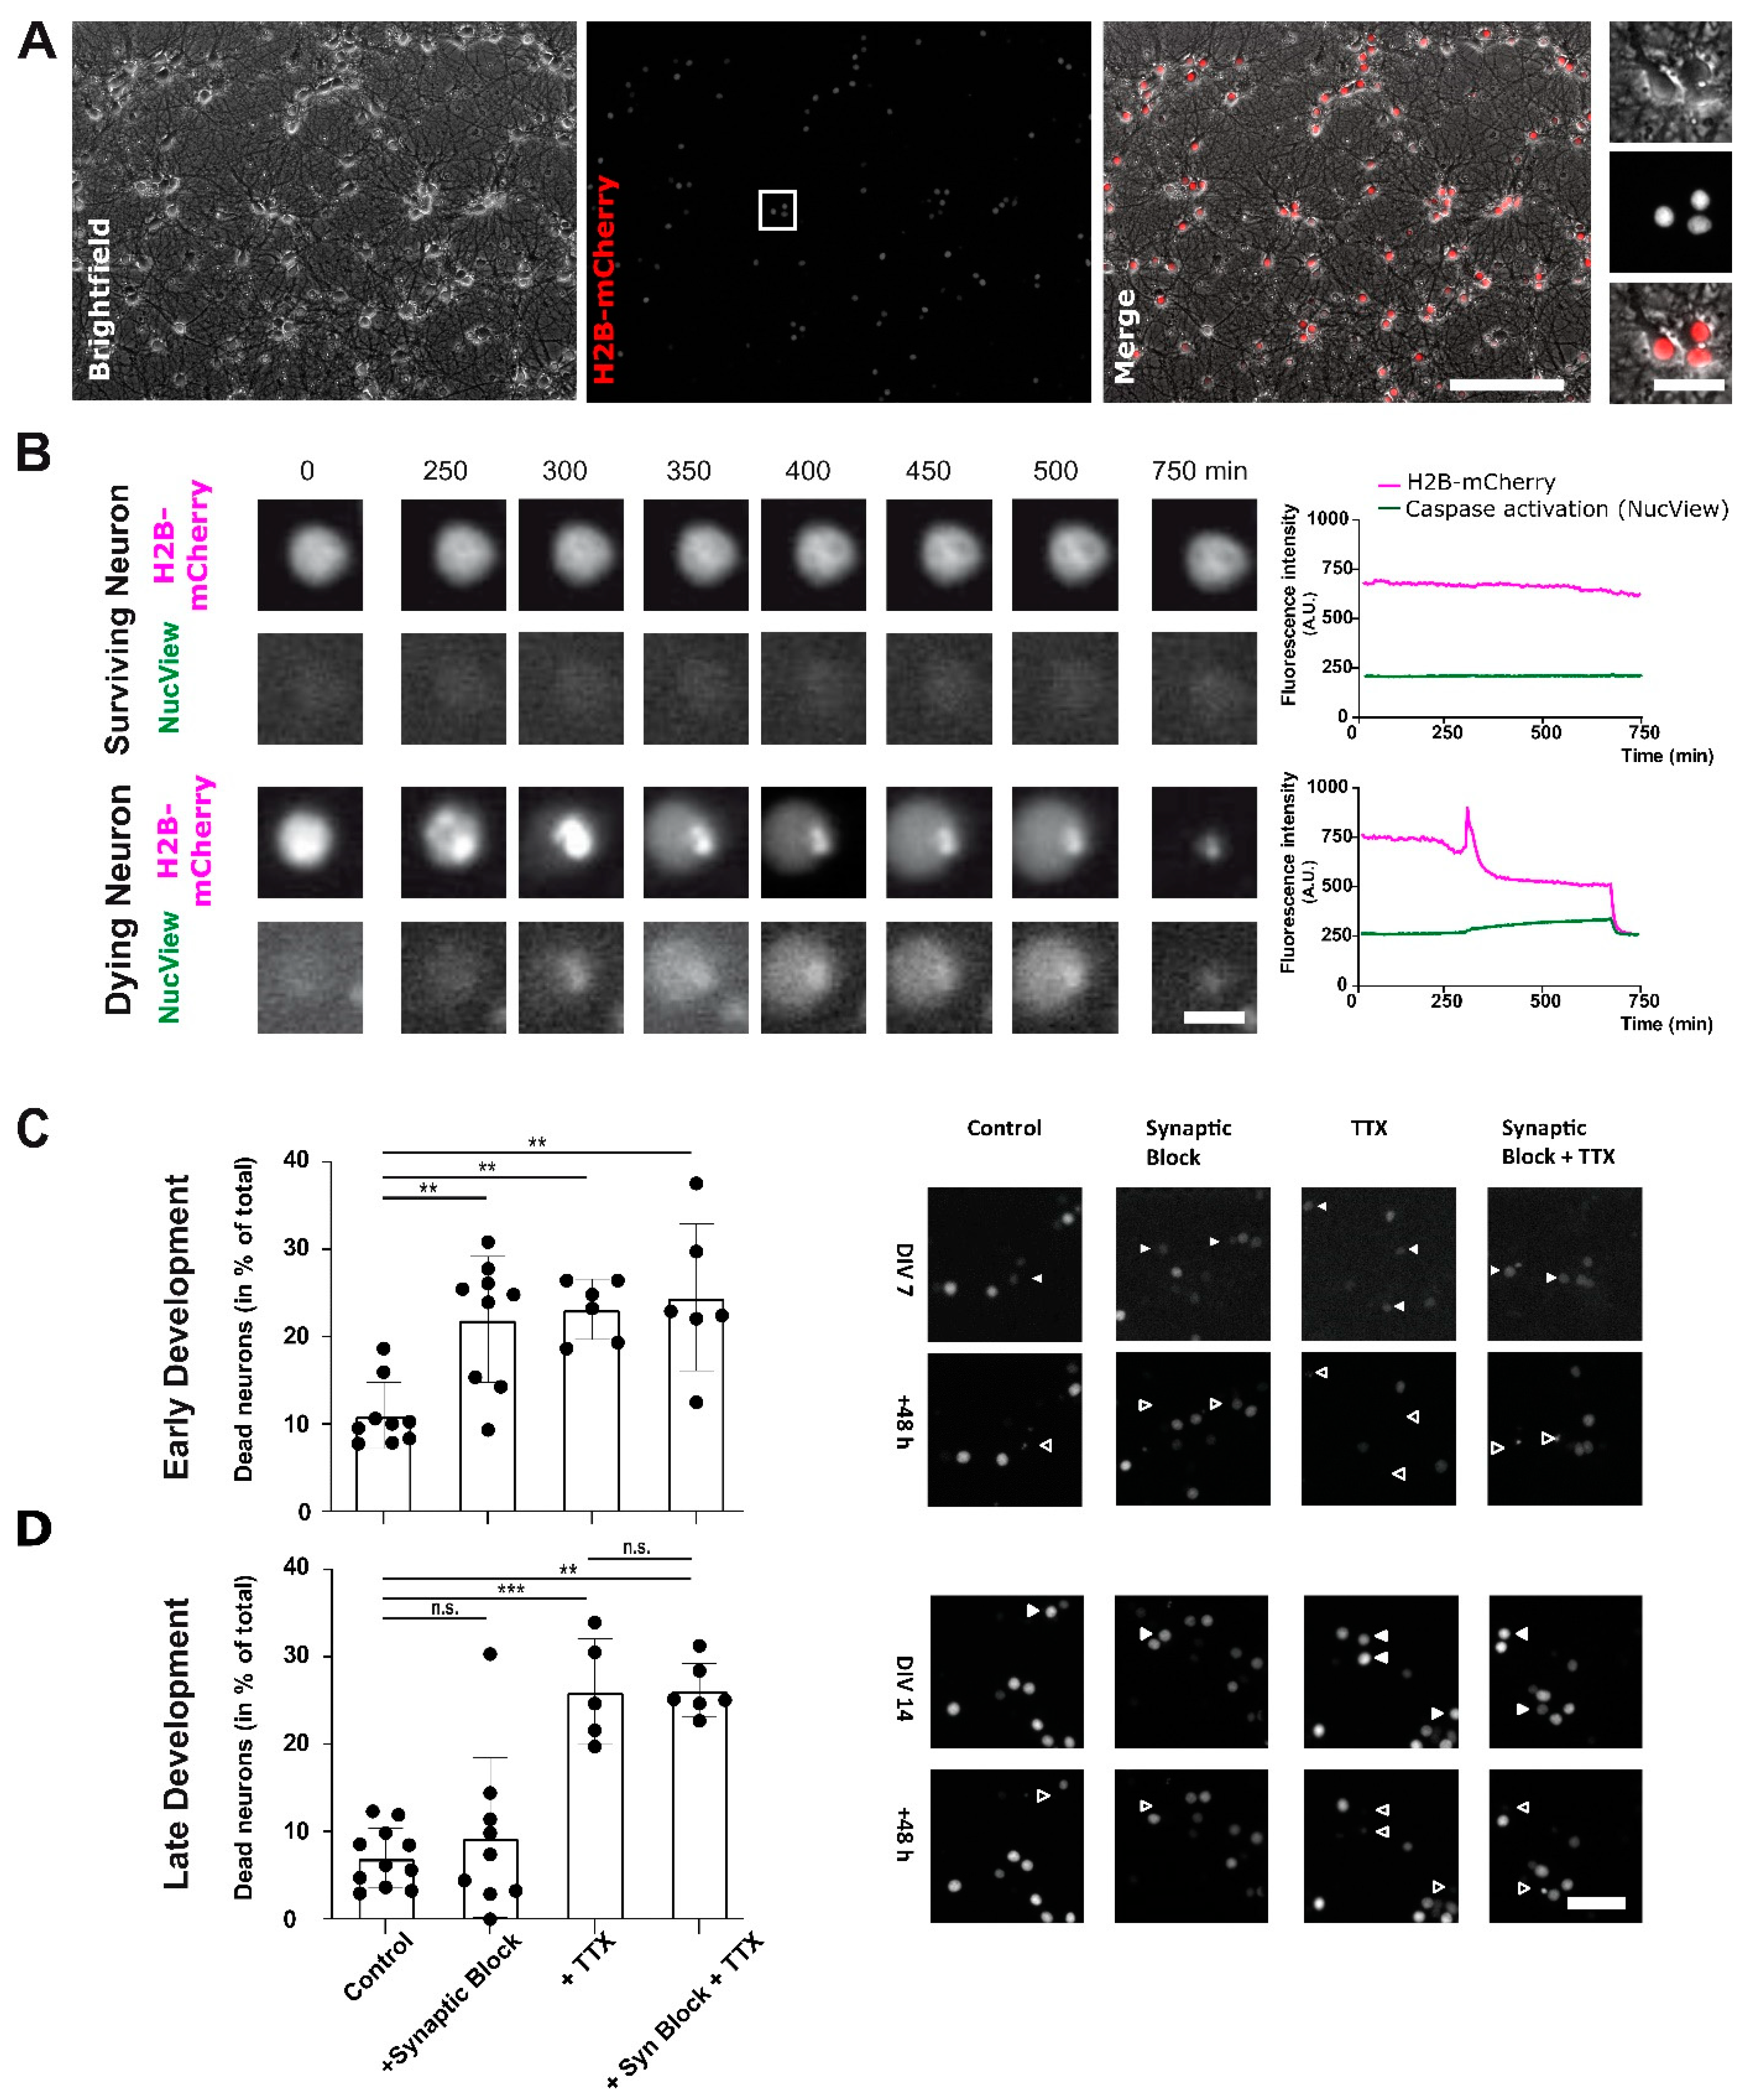
Abstract
:1. Introduction
2. Results
2.1. Action Potential Firing of Cortical Neurons Promotes Neuronal Survival throughout Development
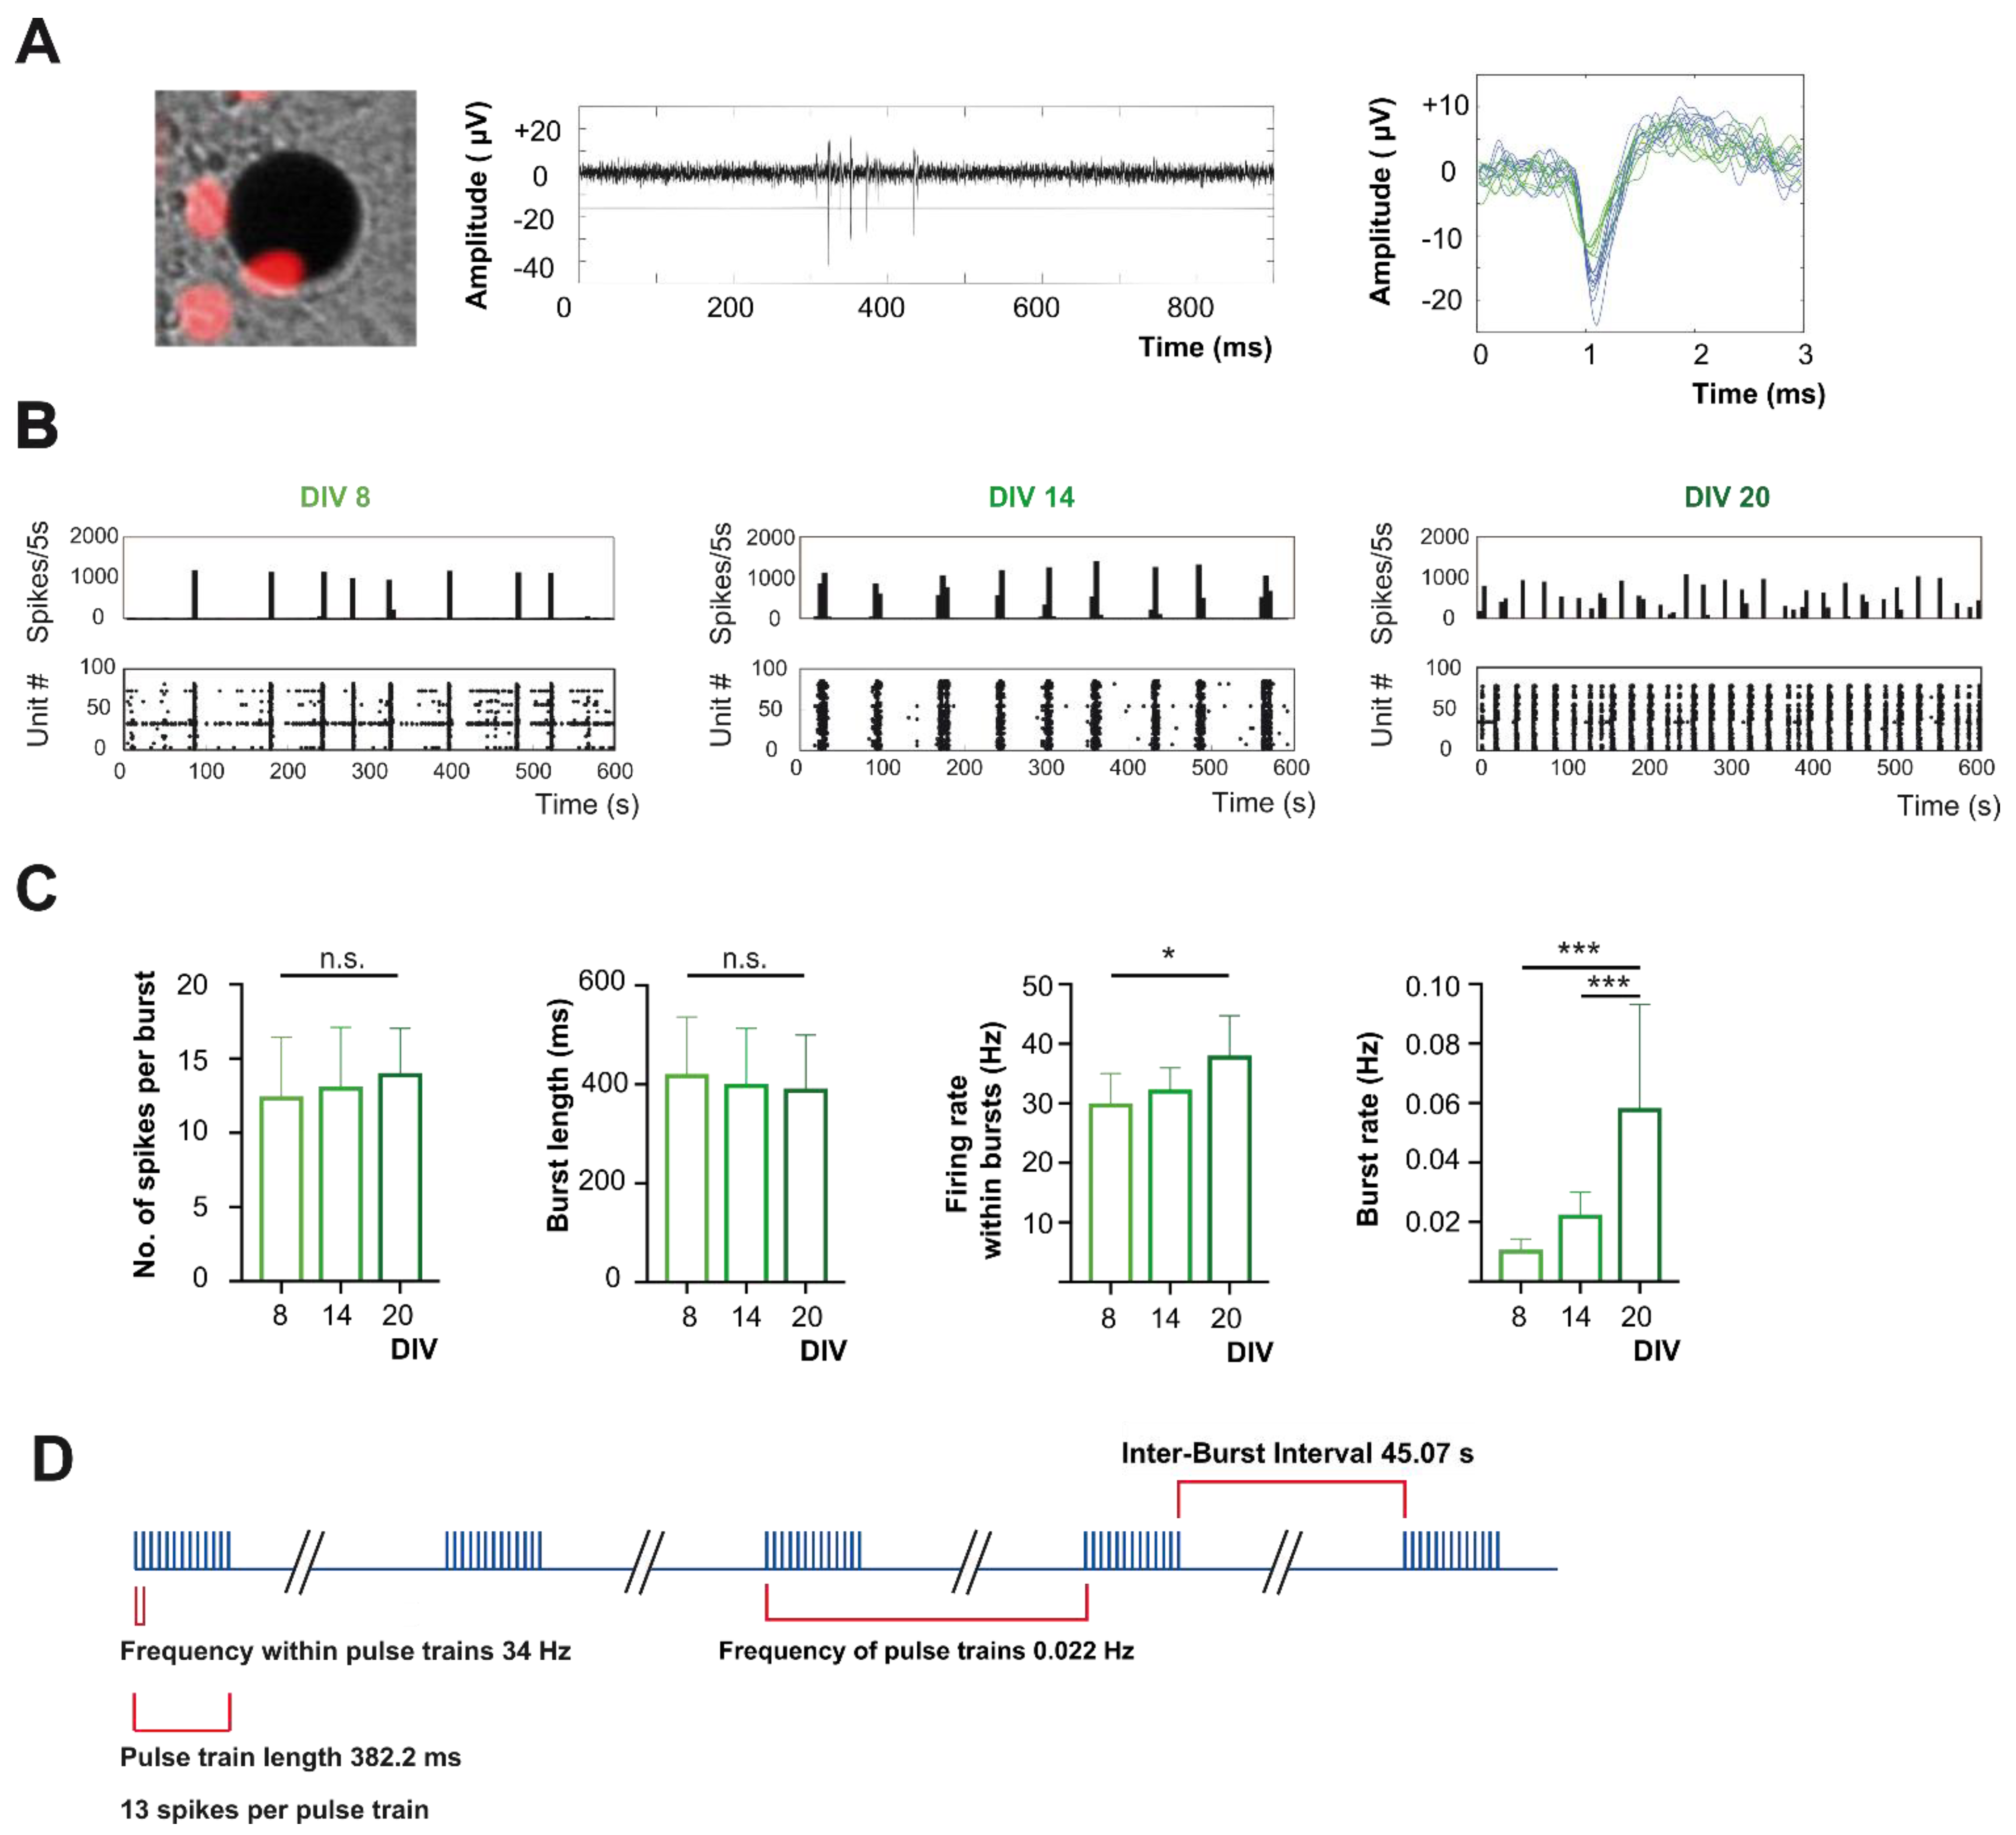
2.2. In Late Development Action Potential Firing of Cortical Neurons Is Dominated by Bursting Pattern
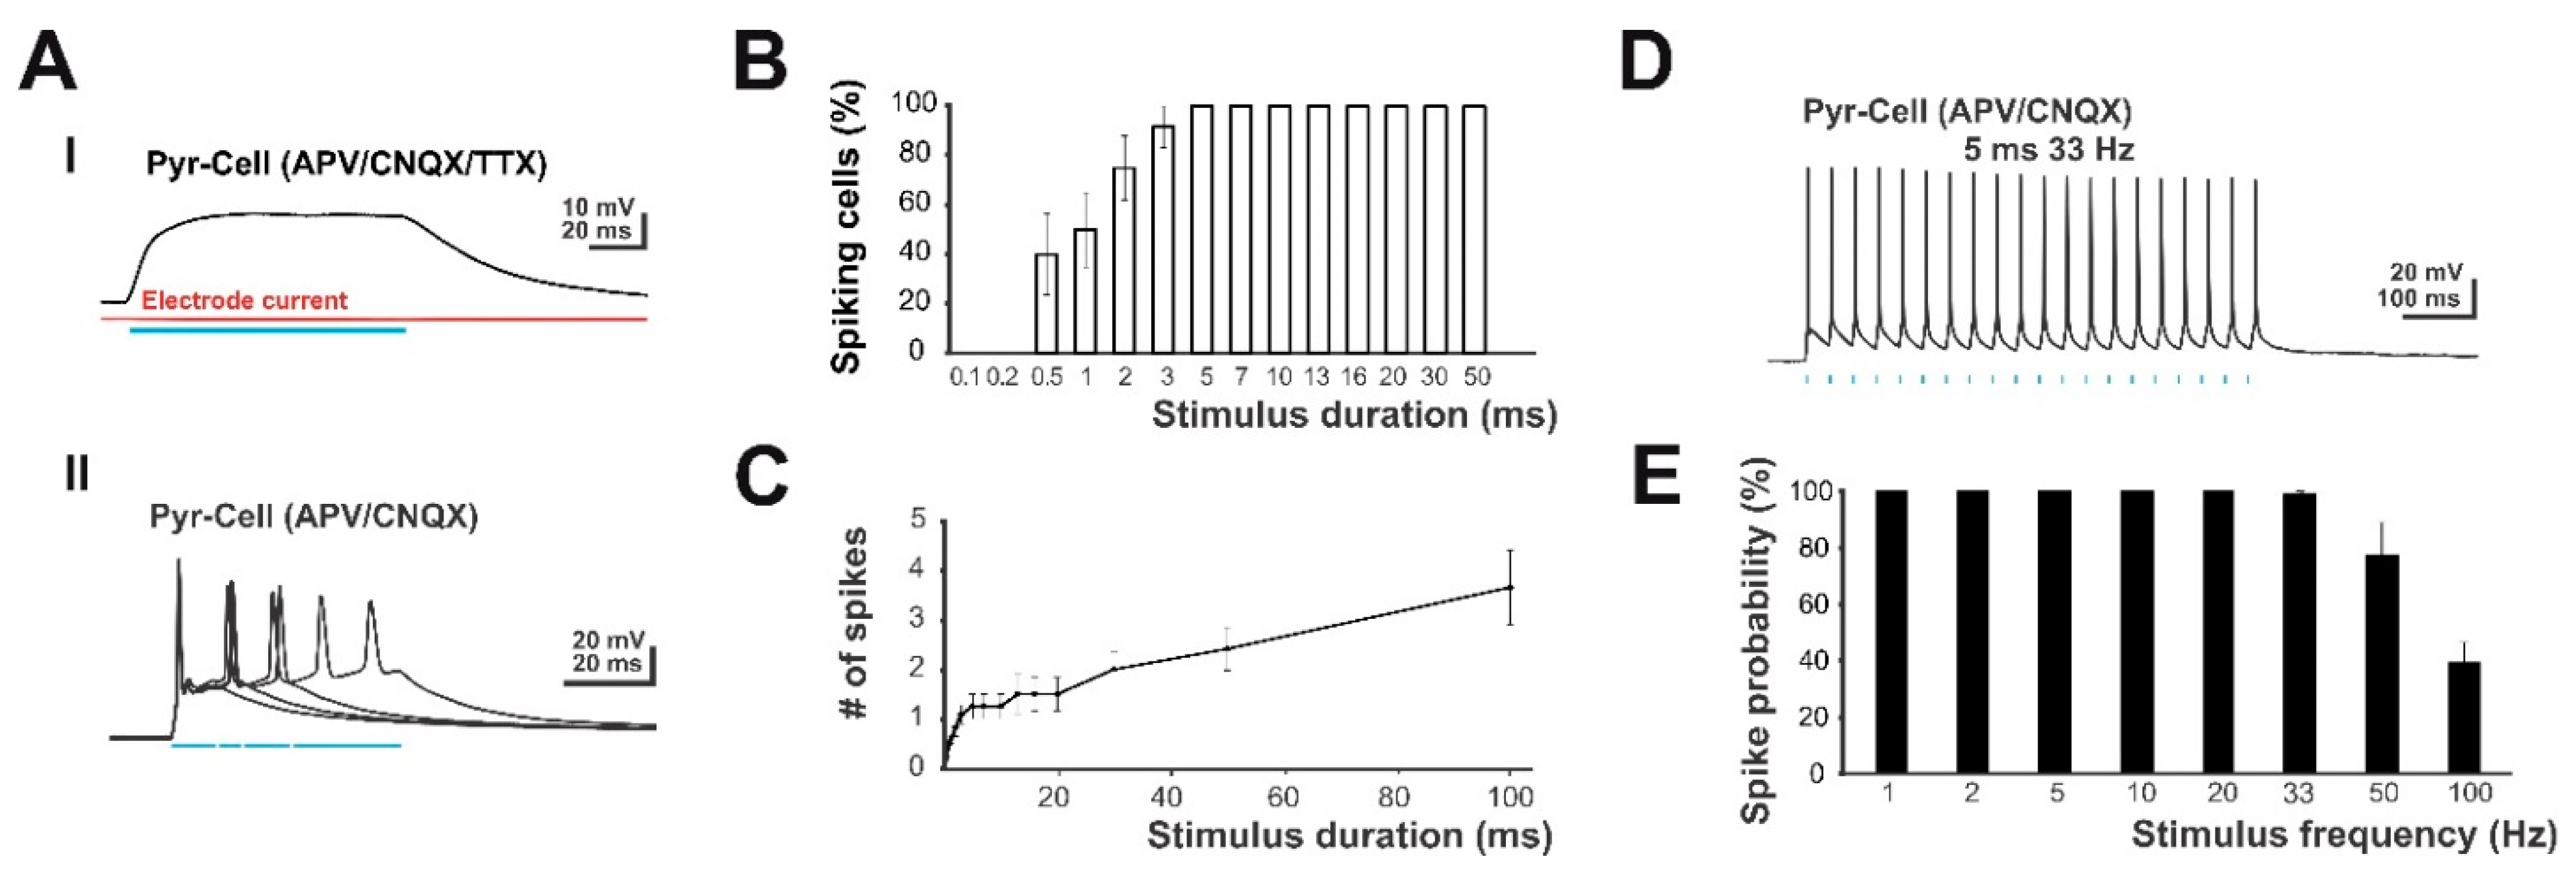
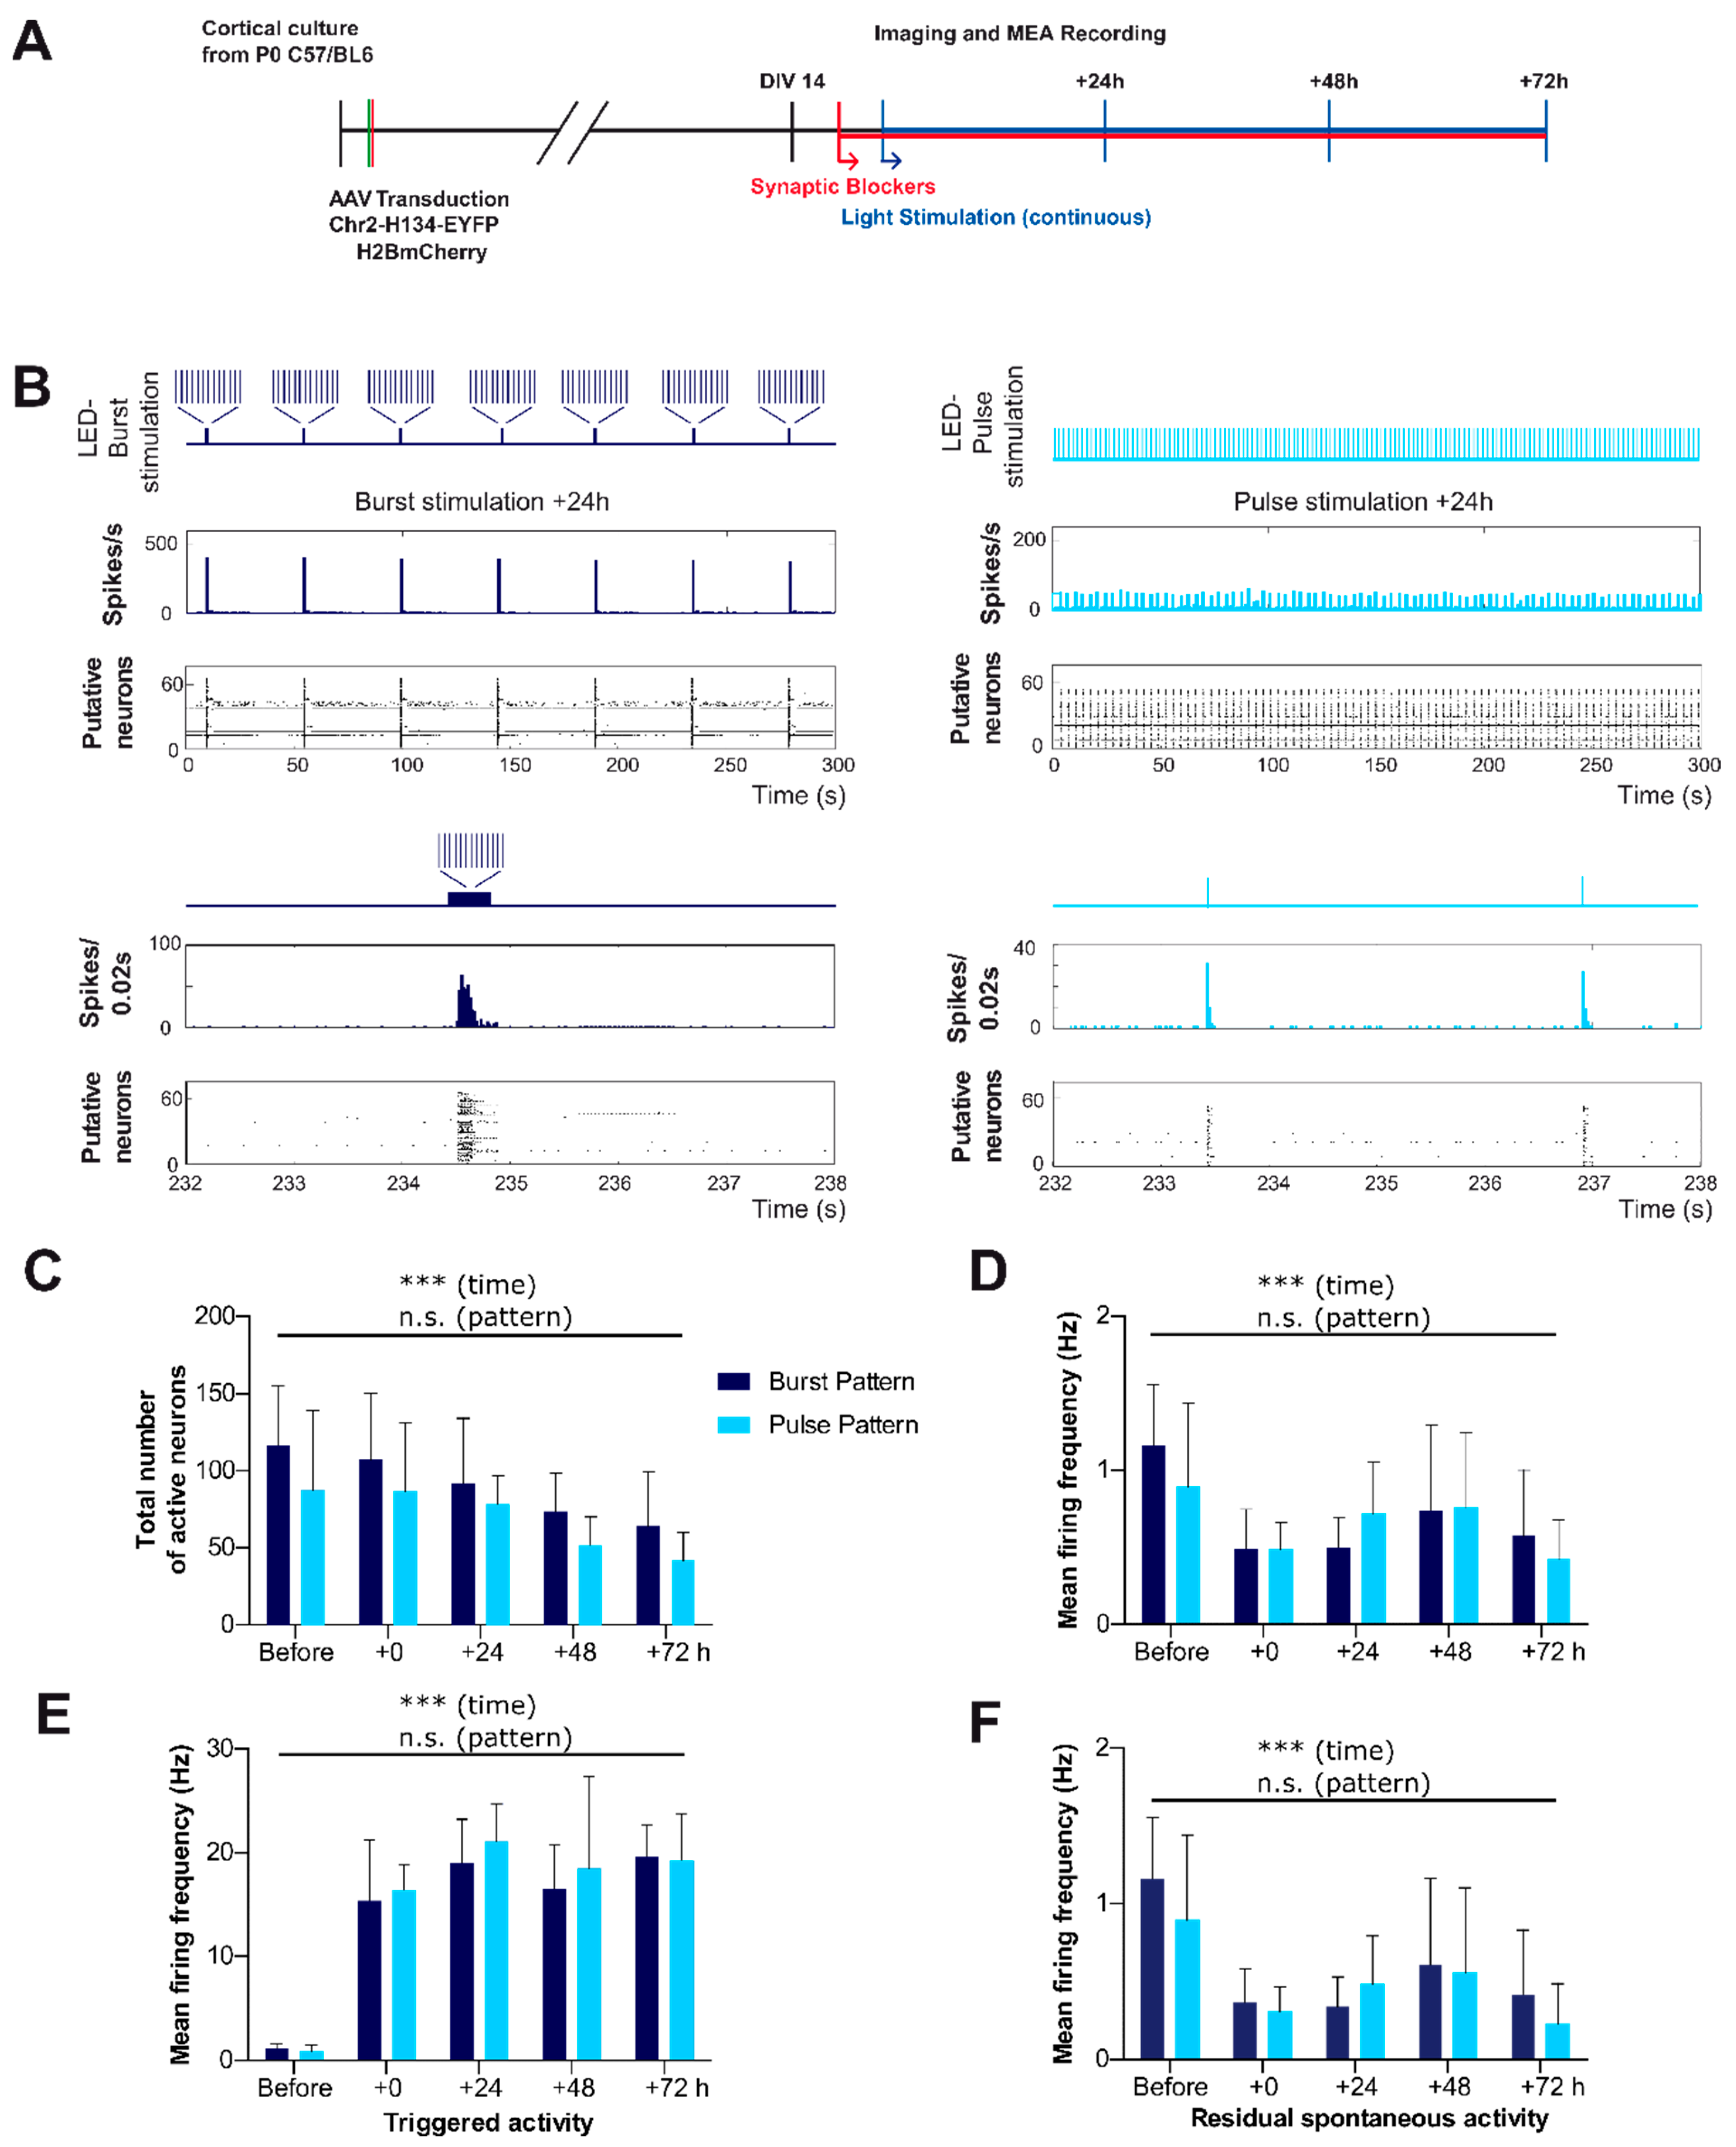
2.3. Optogenetic Light Stimulation Allows Physiological and Non-Physiological Stimulus Paradigms
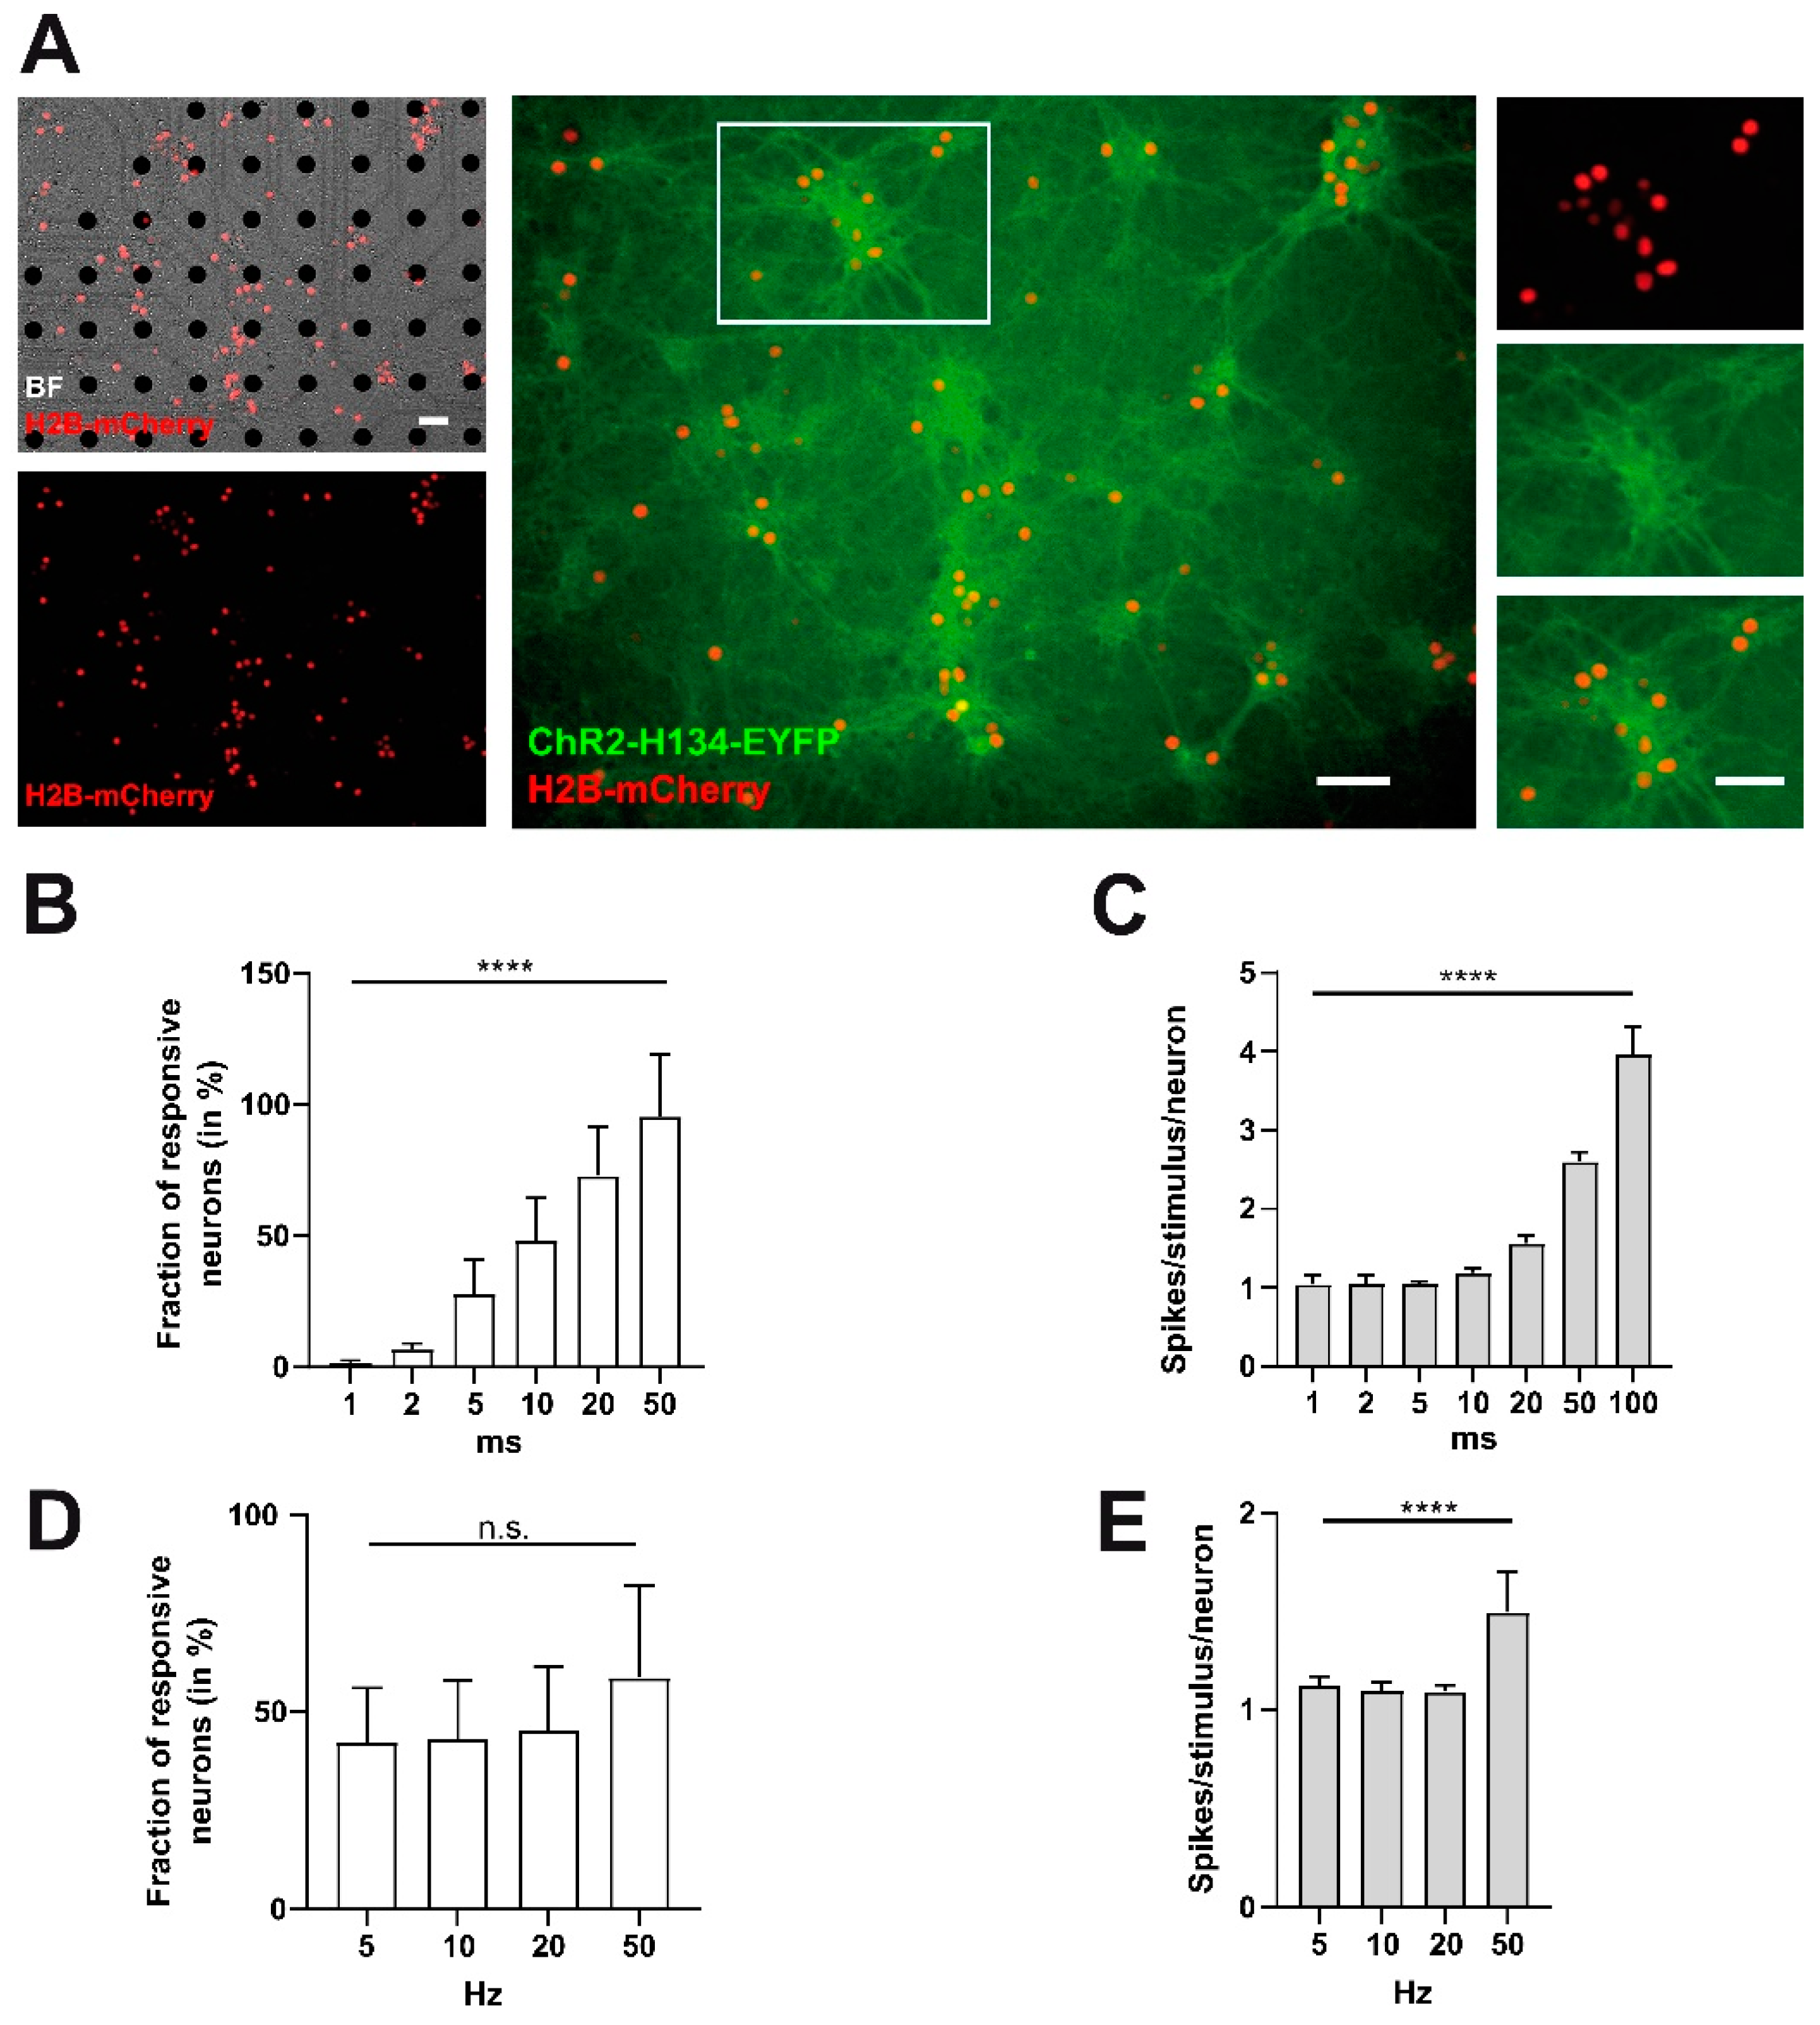
2.4. Spontaneous Activity Pattern Can Efficiently Be Replaced by a Physiological Burst Pattern as Well as a Non-Physiological Pulse Pattern
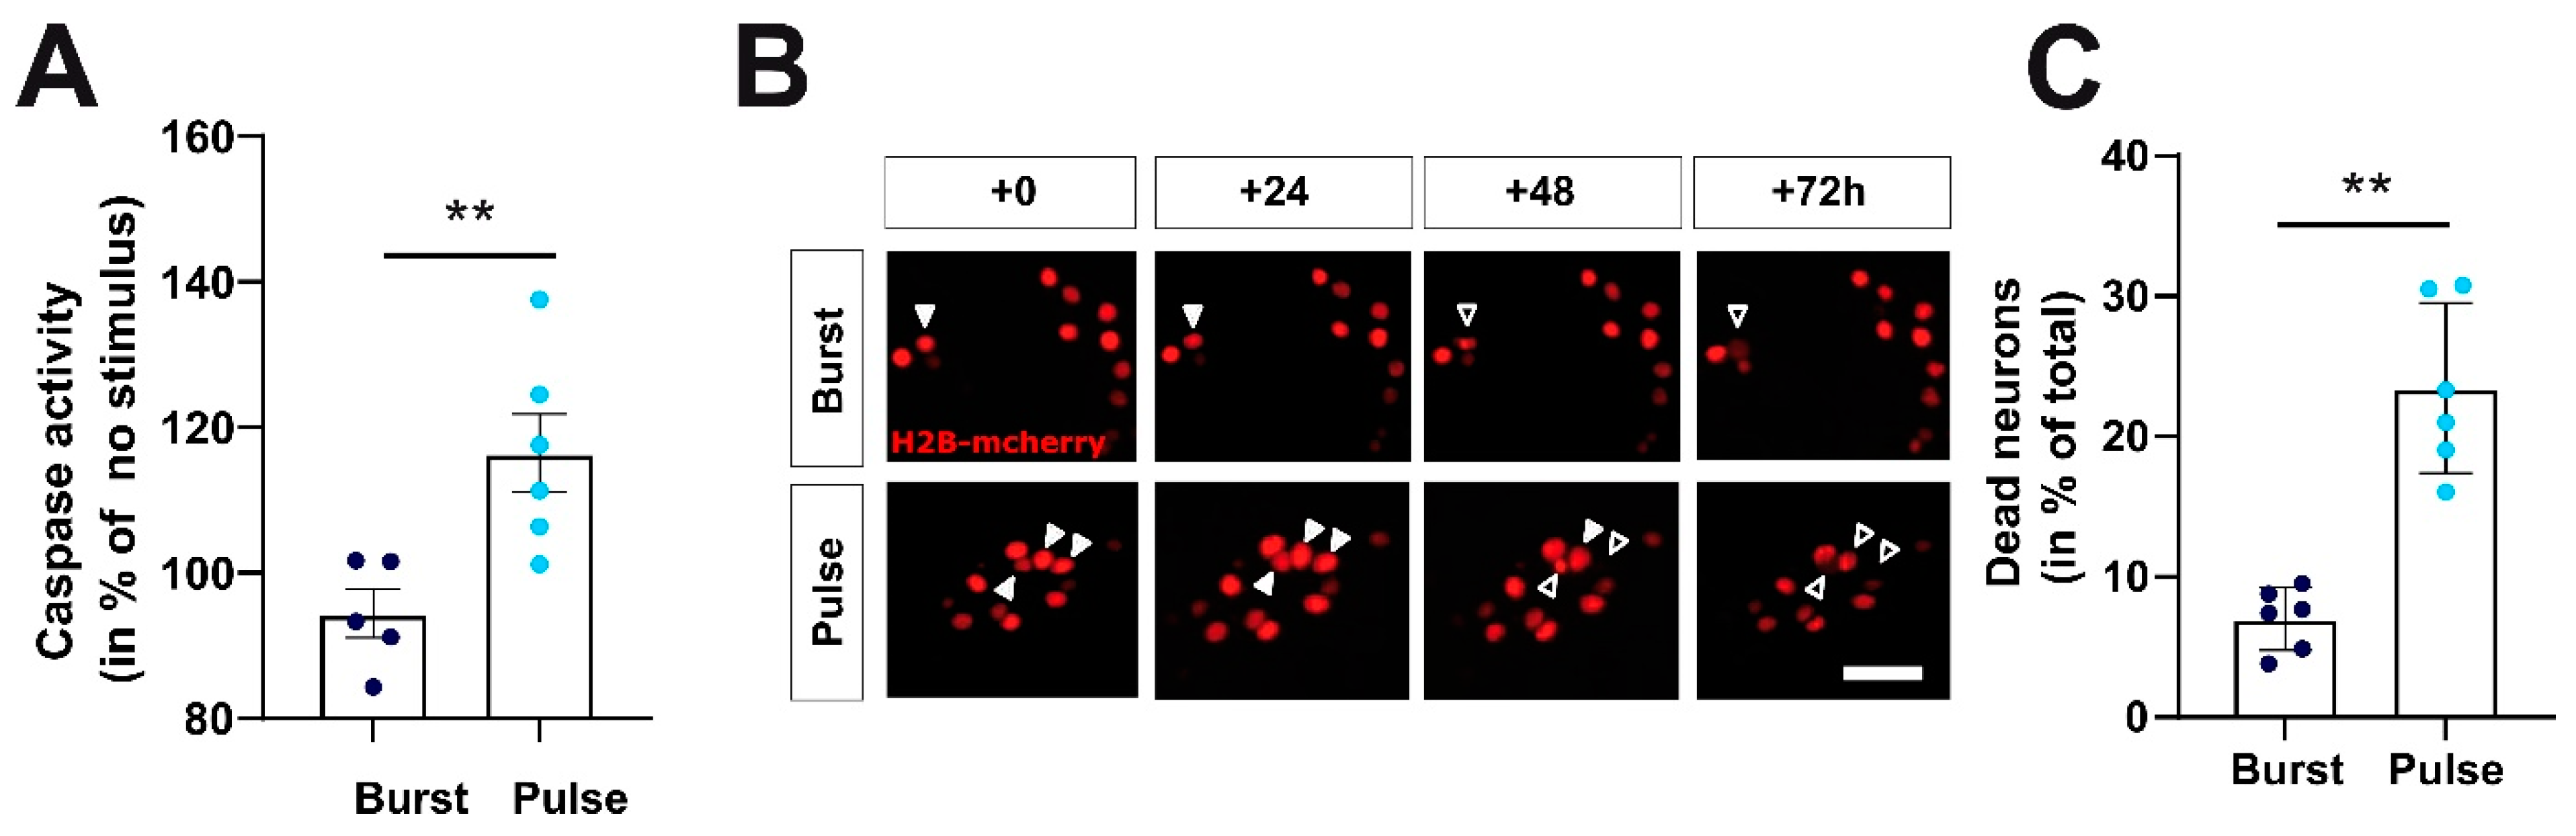
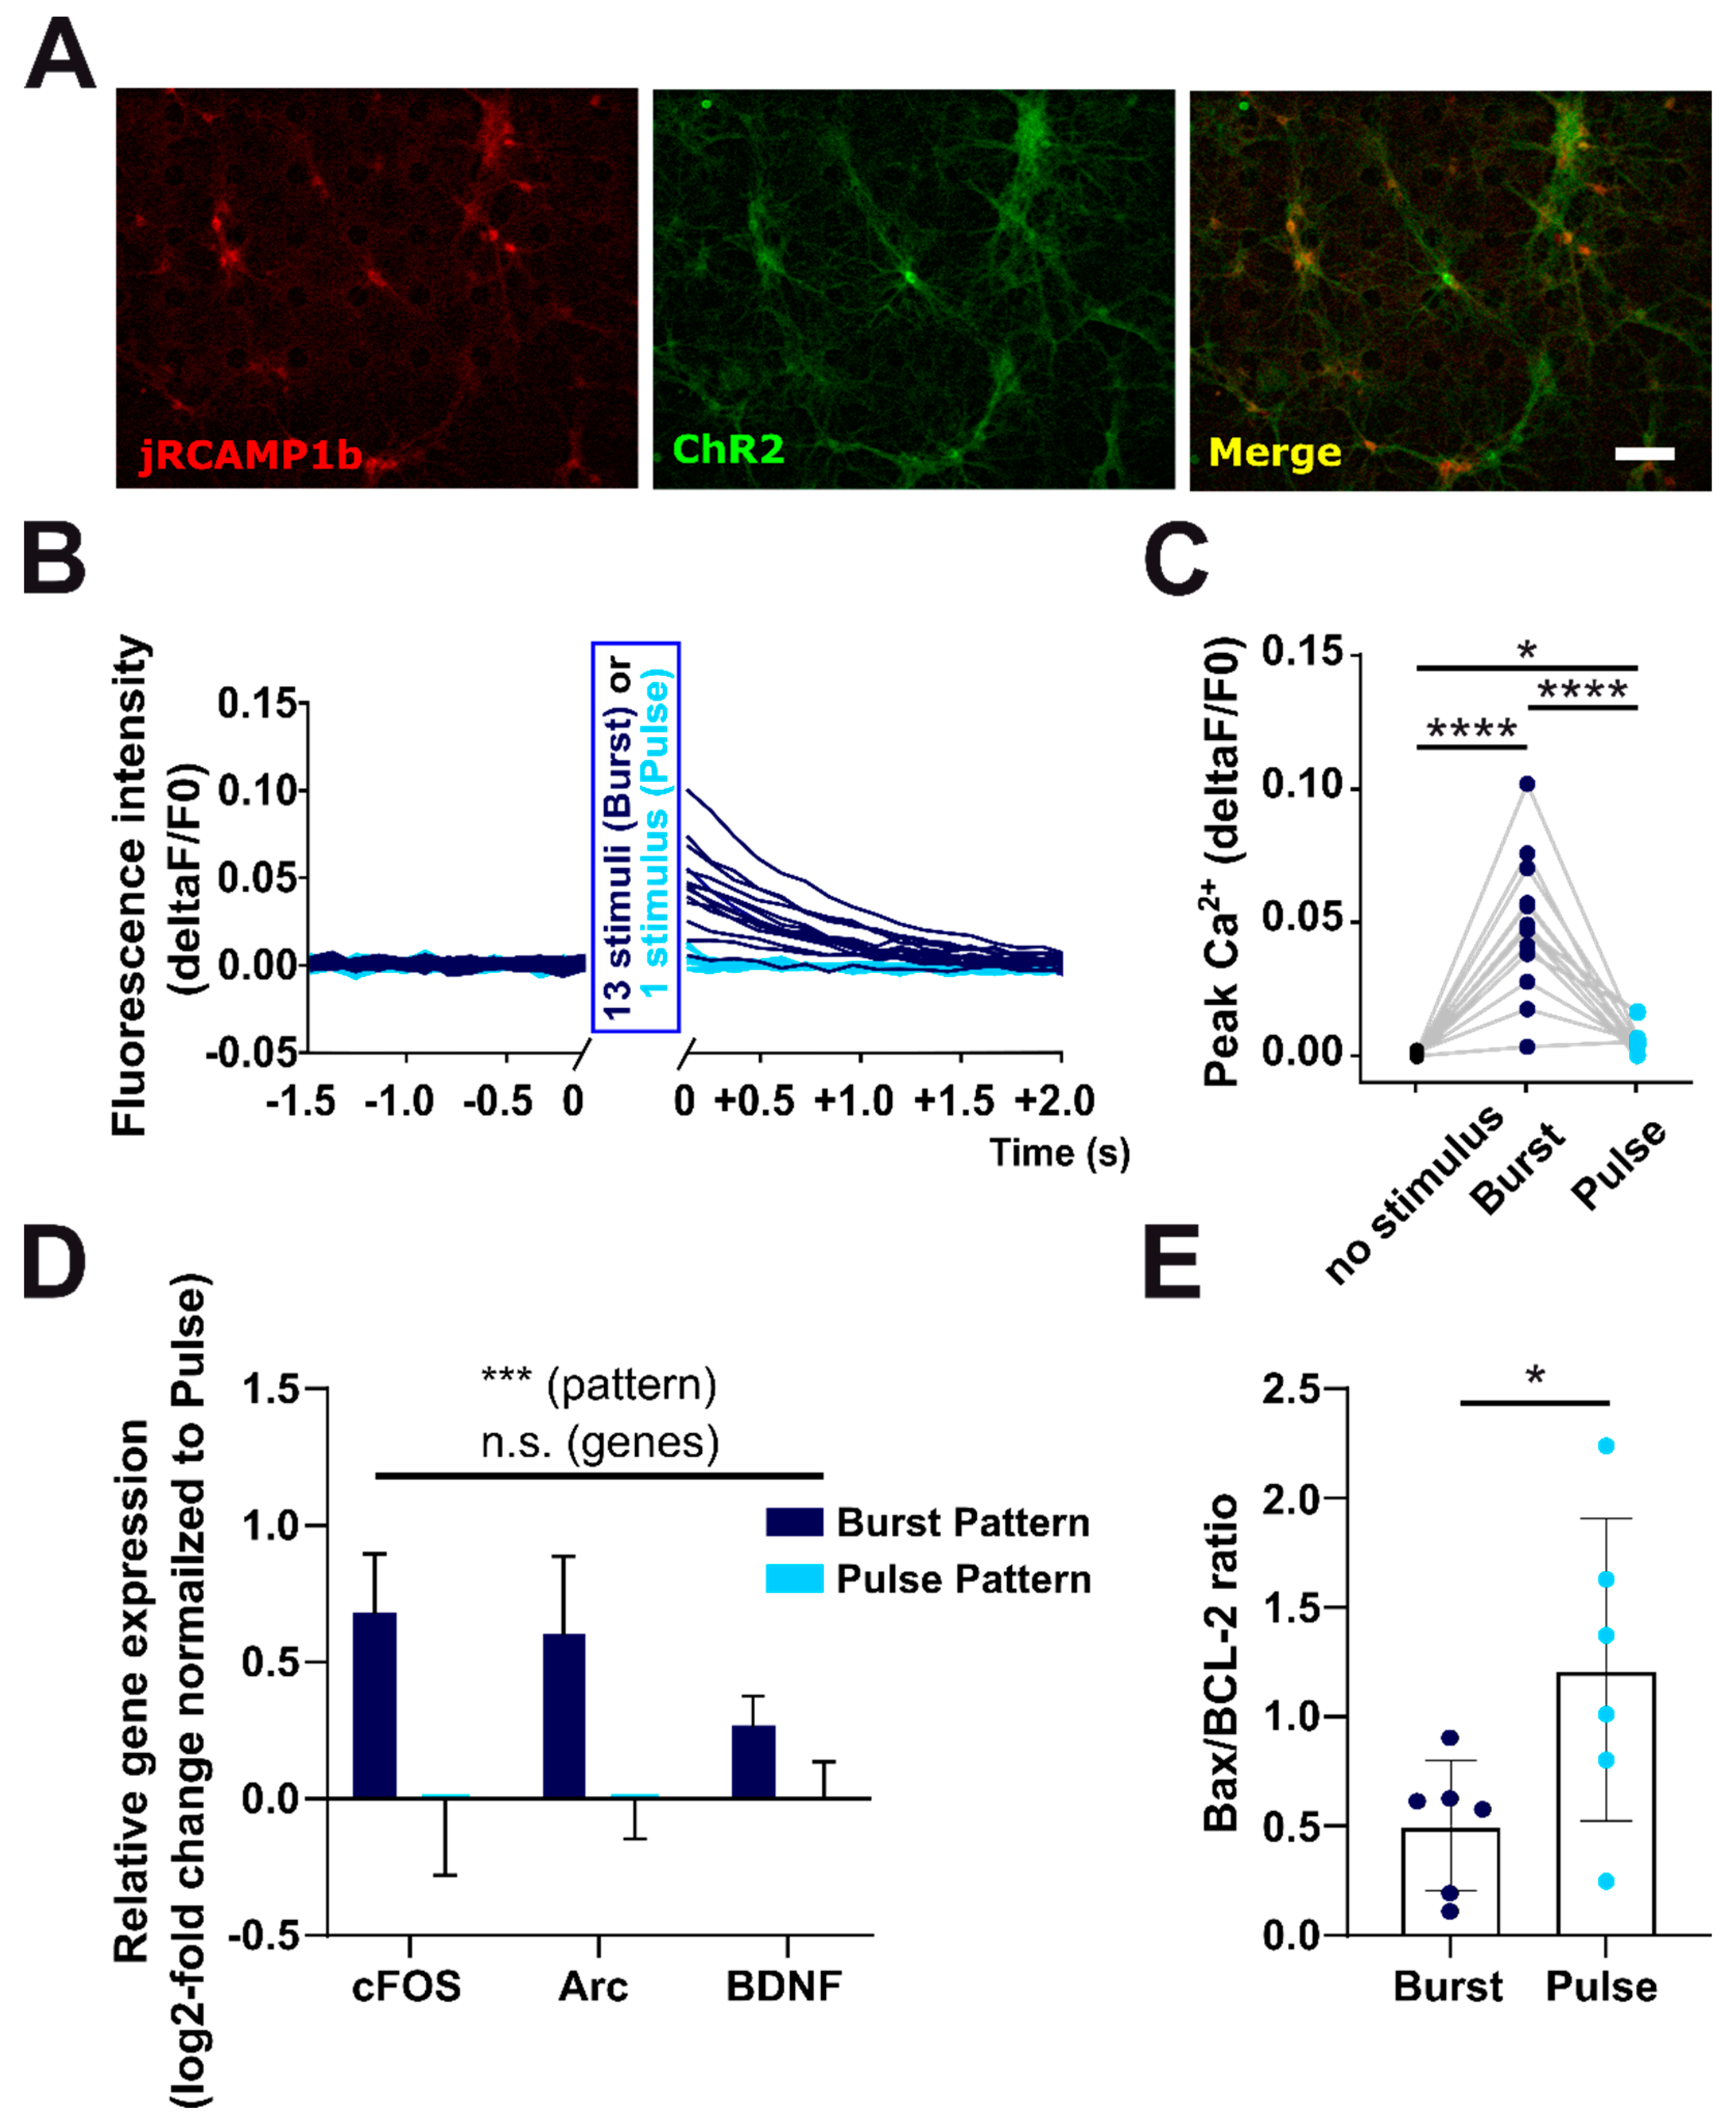
2.5. Manipulation of Firing Pattern Alters Neuronal Gene Expression and Neuronal Survival
3. Discussion
4. Material and Methods
4.1. Primary Neuronal Cultures
4.2. MEA Recordings
4.3. Optogenetic Light Stimulation
4.4. Whole Cell Patch Clamp Experiments
4.5. Optical Imaging
4.6. Combined Calcium Imaging and Optogenetic Stimulation
4.7. Caspase Glow Assay
4.8. Real-Time PCR
4.9. Statistics
Author Contributions
Funding
Institutional Review Board Statement
Informed Consent Statement
Data Availability Statement
Acknowledgments
Conflicts of Interest
References
- Kuan, C.Y.; Roth, K.A.; Flavell, R.A.; Rakic, P. Mechanisms of programmed cell death in the developing brain. Trends Neurosci. 2000, 23, 291–297. [Google Scholar] [CrossRef]
- Dekkers, M.P.; Barde, Y.A. Programmed cell death in neuronal development. Science 2013, 340, 39–41. [Google Scholar] [CrossRef]
- Wong, F.K.; Marín, O. Developmental cell death in the cerebral cortex. Annu. Rev. Cell Dev. Biol. 2019. [Google Scholar] [CrossRef]
- Yamaguchi, Y.; Miura, M. Programmed cell death in neurodevelopment. Dev. Cell 2015, 32, 478–490. [Google Scholar] [CrossRef] [PubMed] [Green Version]
- Pfisterer, U.; Khodosevich, K. Neuronal survival in the brain: Neuron type-specific mechanisms. Cell Death Dis. 2017, 8, e2643. [Google Scholar] [CrossRef] [PubMed]
- Blanquie, O.; Kilb, W.; Sinning, A.; Luhmann, H.J. Homeostatic interplay between electrical activity and neuronal apoptosis in the developing neocortex. Neuroscience 2017, 358, 190–200. [Google Scholar] [CrossRef]
- Kirischuk, S.; Sinning, A.; Blanquie, O.; Yang, J.W.; Luhmann, H.J.; Kilb, W. Modulation of neocortical development by early neuronal activity: Physiology and pathophysiology. Front. Cell. Neurosci. 2017, 11, 379. [Google Scholar] [CrossRef] [Green Version]
- Causeret, F.; Coppola, E.; Pierani, A. Cortical developmental death: Selected to survive or fated to die. Curr. Opin. Neurobiol. 2018, 53, 35–42. [Google Scholar] [CrossRef] [PubMed] [Green Version]
- Ruijter, J.M.; Baker, R.E.; De Jong, B.M.; Romijn, H.J. Chronic blockade of bioelectric activity in neonatal rat cortex grown in vitro: Morphological effects. Int. J. Dev. Neurosci. 1991, 9, 331–338. [Google Scholar] [CrossRef]
- Heck, N.; Golbs, A.; Riedemann, T.; Sun, J.J.; Lessmann, V.; Luhmann, H.J. Activity-dependent regulation of neuronal apoptosis in neonatal mouse cerebral cortex. Cereb. Cortex 2008, 18, 1335–1349. [Google Scholar] [CrossRef] [PubMed] [Green Version]
- Ikonomidou, C.; Bosch, F.; Miksa, M.; Bittigau, P.; Vöckler, J.; Dikranian, K.; Tenkova, T.I.; Stefovska, V.; Turski, L.; Olney, J.W. Blockade of NMDA receptors and apoptotic neurodegeneration in the developing brain. Science 1999, 283, 70–74. [Google Scholar] [CrossRef]
- Fishbein, I.; Segal, M. Miniature synaptic currents become neurotoxic to chronically silenced neurons. Cereb. Cortex 2007, 17, 1292–1306. [Google Scholar] [CrossRef] [PubMed] [Green Version]
- Golbs, A.; Nimmervoll, B.; Sun, J.J.; Sava, I.E.; Luhmann, H.J. Control of programmed cell death by distinct electrical activity patterns. Cereb. Cortex 2011, 21, 1192–1202. [Google Scholar] [CrossRef] [Green Version]
- Ghosh, A.; Carnahan, J.; Greenberg, M.E. Requirement for BDNF in activity-dependent survival of cortical neurons. Science 1994, 263, 1618–1623. [Google Scholar] [CrossRef]
- Allène, C.; Cattani, A.; Ackman, J.B.; Bonifazi, P.; Aniksztejn, L.; Ben-Ari, Y.; Cossart, R. Sequential generation of two distinct synapse-driven network patterns in developing neocortex. J. Neurosci. 2008, 28, 12851–12863. [Google Scholar] [CrossRef] [PubMed] [Green Version]
- Murase, S.; Owens, D.F.; McKay, R.D. In the newborn hippocampus, neurotrophin-dependent survival requires spontaneous activity and integrin signaling. J. Neurosci. 2011, 31, 7791–7800. [Google Scholar] [CrossRef]
- Wong, F.K.; Bercsenyi, K.; Sreenivasan, V.; Portalés, A.; Fernández-Otero, M.; Marín, O. Pyramidal cell regulation of interneuron survival sculpts cortical networks. Nature 2018, 557, 668–673. [Google Scholar] [CrossRef] [PubMed]
- Blanquie, O.; Liebmann, L.; Hübner, C.A.; Luhmann, H.J.; Sinning, A. NKCC1-mediated GABAergic signaling promotes postnatal cell death in neocortical Cajal-Retzius cells. Cereb. Cortex 2016. [Google Scholar] [CrossRef] [Green Version]
- Denaxa, M.; Neves, G.; Rabinowitz, A.; Kemlo, S.; Liodis, P.; Burrone, J.; Pachnis, V. Modulation of apoptosis controls inhibitory interneuron number in the cortex. Cell Rep. 2018, 22, 1710–1721. [Google Scholar] [CrossRef] [PubMed] [Green Version]
- Priya, R.; Paredes, M.F.; Karayannis, T.; Yusuf, N.; Liu, X.; Jaglin, X.; Graef, I.; Alvarez-Buylla, A.; Fishell, G. Activity regulates cell death within cortical interneurons through a calcineurin-dependent mechanism. Cell Rep. 2018, 22, 1695–1709. [Google Scholar] [CrossRef] [Green Version]
- Duan, Z.R.S.; Che, A.; Chu, P.; Modol, L.; Bollmann, Y.; Babij, R.; Fetcho, R.N.; Otsuka, T.; Fuccillo, M.V.; Liston, C.; et al. GABAergic restriction of network dynamics regulates interneuron survival in the developing cortex. Neuron 2020, 105, 75–92.e5. [Google Scholar] [CrossRef]
- Riva, M.; Genescu, I.; Habermacher, C.; Orduz, D.; Ledonne, F.; Rijli, F.M.; Lopez-Bendito, G.; Coppola, E.; Garel, S.; Angulo, M.C.; et al. Activity-dependent death of transient Cajal-Retzius neurons is required for functional cortical wiring. eLife 2019, 8. [Google Scholar] [CrossRef]
- Blanquie, O.; Yang, J.W.; Kilb, W.; Sharopov, S.; Sinning, A.; Luhmann, H.J. Electrical activity controls area-specific expression of neuronal apoptosis in the mouse developing cerebral cortex. eLife 2017, 6. [Google Scholar] [CrossRef]
- Nimmervoll, B.; White, R.; Yang, J.W.; An, S.; Henn, C.; Sun, J.J.; Luhmann, H.J. LPS-induced microglial secretion of TNFα increases activity-dependent neuronal apoptosis in the neonatal cerebral cortex. Cereb. Cortex 2013, 23, 1742–1755. [Google Scholar] [CrossRef]
- Yang, J.W.; Hanganu-Opatz, I.L.; Sun, J.J.; Luhmann, H.J. Three patterns of oscillatory activity differentially synchronize developing neocortical networks in vivo. J. Neurosci. 2009, 29, 9011–9025. [Google Scholar] [CrossRef] [Green Version]
- Minlebaev, M.; Colonnese, M.; Tsintsadze, T.; Sirota, A.; Khazipov, R. Early γ oscillations synchronize developing thalamus and cortex. Science 2011, 334, 226–229. [Google Scholar] [CrossRef] [PubMed]
- Molnár, Z.; Luhmann, H.J.; Kanold, P.O. Transient cortical circuits match spontaneous and sensory-driven activity during development. Science 2020, 370. [Google Scholar] [CrossRef] [PubMed]
- Hanganu, I.L.; Ben-Ari, Y.; Khazipov, R. Retinal waves trigger spindle bursts in the neonatal rat visual cortex. J. Neurosci. 2006, 26, 6728–6736. [Google Scholar] [CrossRef] [PubMed]
- Banfalvi, G. Methods to detect apoptotic cell death. Apoptosis 2017, 22, 306–323. [Google Scholar] [CrossRef] [PubMed]
- Howe, E.S.; Clemente, T.E.; Bass, H.W. Maize histone H2B-mCherry: A new fluorescent chromatin marker for somatic and meiotic chromosome research. DNA Cell Biol. 2012, 31, 925–938. [Google Scholar] [CrossRef] [PubMed] [Green Version]
- Southwell, D.G.; Paredes, M.F.; Galvao, R.P.; Jones, D.L.; Froemke, R.C.; Sebe, J.Y.; Alfaro-Cervello, C.; Tang, Y.; Garcia-Verdugo, J.M.; Rubenstein, J.L.; et al. Intrinsically determined cell death of developing cortical interneurons. Nature 2012, 491, 109–113. [Google Scholar] [CrossRef] [Green Version]
- Newman, J.P.; Fong, M.F.; Millard, D.C.; Whitmire, C.J.; Stanley, G.B.; Potter, S.M. Optogenetic feedback control of neural activity. eLife 2015, 4, e07192. [Google Scholar] [CrossRef] [Green Version]
- Wang, Y.; Song, J.H.; Denisova, J.V.; Park, W.M.; Fontes, J.D.; Belousov, A.B. Neuronal gap junction coupling is regulated by glutamate and plays critical role in cell death during neuronal injury. J. Neurosci. 2012, 32, 713–725. [Google Scholar] [CrossRef] [Green Version]
- Dupont, E.; Hanganu, I.L.; Kilb, W.; Hirsch, S.; Luhmann, H.J. Rapid developmental switch in the mechanisms driving early cortical columnar networks. Nature 2006, 439, 79–83. [Google Scholar] [CrossRef]
- Sun, J.J.; Kilb, W.; Luhmann, H.J. Self-organization of repetitive spike patterns in developing neuronal networks in vitro. Eur. J. Neurosci. 2010, 32, 1289–1299. [Google Scholar] [CrossRef]
- Wagenaar, D.A.; Pine, J.; Potter, S.M. An extremely rich repertoire of bursting patterns during the development of cortical cultures. BMC Neurosci. 2006, 7, 11. [Google Scholar] [CrossRef] [PubMed]
- Weir, K.; Blanquie, O.; Kilb, W.; Luhmann, H.J.; Sinning, A. Comparison of spike parameters from optically identified GABAergic and glutamatergic neurons in sparse cortical cultures. Front. Cell. Neurosci. 2015, 8, 460. [Google Scholar] [CrossRef] [PubMed] [Green Version]
- Sheng, M.; Greenberg, M.E. The regulation and function of c-fos and other immediate early genes in the nervous system. Neuron 1990, 4, 477–485. [Google Scholar] [CrossRef]
- Kowiański, P.; Lietzau, G.; Czuba, E.; Waśkow, M.; Steliga, A.; Moryś, J. BDNF: A key factor with multipotent impact on brain signaling and synaptic plasticity. Cell. Mol. Neurobiol. 2018, 38, 579–593. [Google Scholar] [CrossRef] [PubMed]
- Singh, R.; Letai, A.; Sarosiek, K. Regulation of apoptosis in health and disease: The balancing act of BCL-2 family proteins. Nat. Rev. Mol. Cell Biol. 2019, 20, 175–193. [Google Scholar] [CrossRef]
- Egorov, A.V.; Draguhn, A. Development of coherent neuronal activity patterns in mammalian cortical networks: Common principles and local hetereogeneity. Mech. Dev. 2012. [Google Scholar] [CrossRef]
- Khazipov, R.; Luhmann, H.J. Early patterns of electrical activity in the developing cerebral cortex of humans and rodents. Trends Neurosci. 2006, 29, 414–418. [Google Scholar] [CrossRef]
- Luhmann, H.J.; Sinning, A.; Yang, J.W.; Reyes-Puerta, V.; Stüttgen, M.C.; Kirischuk, S.; Kilb, W. Spontaneous neuronal activity in developing neocortical networks: From single cells to large-scale interactions. Front. Neural Circuits 2016, 10, 40. [Google Scholar] [CrossRef] [Green Version]
- Kilb, W.; Kirischuk, S.; Luhmann, H.J. Role of tonic GABAergic currents during pre- and early postnatal rodent development. Front. Neural Circuits 2013, 7, 139. [Google Scholar] [CrossRef] [PubMed] [Green Version]
- Luhmann, H.J.; Kirischuk, S.; Sinning, A.; Kilb, W. Early GABAergic circuitry in the cerebral cortex. Curr. Opin. Neurobiol. 2014, 26C, 72–78. [Google Scholar] [CrossRef]
- Fong, M.F.; Newman, J.P.; Potter, S.M.; Wenner, P. Upward synaptic scaling is dependent on neurotransmission rather than spiking. Nat. Commun. 2015, 6. [Google Scholar] [CrossRef] [PubMed]
- Turrigiano, G.G.; Leslie, K.R.; Desai, N.S.; Rutherford, L.C.; Nelson, S.B. Activity-dependent scaling of quantal amplitude in neocortical neurons. Nature 1998, 391, 892–896. [Google Scholar] [CrossRef] [PubMed]
- Fenno, L.; Yizhar, O.; Deisseroth, K. The development and application of optogenetics. Annu. Rev. Neurosci. 2011, 34, 389–412. [Google Scholar] [CrossRef]
- Lignani, G.; Ferrea, E.; Difato, F.; Amarù, J.; Ferroni, E.; Lugarà, E.; Espinoza, S.; Gainetdinov, R.R.; Baldelli, P.; Benfenati, F. Long-term optical stimulation of channelrhodopsin-expressing neurons to study network plasticity. Front. Mol. Neurosci. 2013, 6, 22. [Google Scholar] [CrossRef] [Green Version]
- Movsesyan, V.A.; Stoica, B.A.; Faden, A.I. MGLuR5 activation reduces beta-amyloid-induced cell death in primary neuronal cultures and attenuates translocation of cytochrome c and apoptosis-inducing factor. J. Neurochem. 2004, 89, 1528–1536. [Google Scholar] [CrossRef]
- Gu, X.; Spitzer, N.C. Distinct aspects of neuronal differentiation encoded by frequency of spontaneous Ca2+ transients. Nature 1995, 375, 784–787. [Google Scholar] [CrossRef] [PubMed]
- Balkowiec, A.; Katz, D.M. Cellular mechanisms regulating activity-dependent release of native brain-derived neurotrophic factor from hippocampal neurons. J. Neurosci. 2002, 22, 10399–10407. [Google Scholar] [CrossRef] [PubMed] [Green Version]
- Gundlfinger, A.; Breustedt, J.; Sullivan, D.; Schmitz, D. Natural spike trains trigger short- and long-lasting dynamics at hippocampal mossy fiber synapses in rodents. PLoS ONE 2010, 5, e9961. [Google Scholar] [CrossRef] [PubMed]
- Paulsen, O.; Sejnowski, T.J. Natural patterns of activity and long-term synaptic plasticity. Curr. Opin. Neurobiol. 2000, 10, 172–179. [Google Scholar] [CrossRef] [Green Version]
- Friedman, L.K. Calcium: A role for neuroprotection and sustained adaptation. Mol. Interv. 2006, 6, 315–329. [Google Scholar] [CrossRef]
- Flavell, S.W.; Greenberg, M.E. Signaling mechanisms linking neuronal activity to gene expression and plasticity of the nervous system. Annu. Rev. Neurosci. 2008, 31, 563–590. [Google Scholar] [CrossRef] [Green Version]
- Bito, H.; Deisseroth, K.; Tsien, R.W. Ca2+-dependent regulation in neuronal gene expression. Curr. Opin. Neurobiol. 1997, 7, 419–429. [Google Scholar] [CrossRef]
- Garaschuk, O.; Linn, J.; Eilers, J.; Konnerth, A. Large-scale oscillatory calcium waves in the immature cortex. Nat. Neurosci. 2000, 3, 452–459. [Google Scholar] [CrossRef]
- Kirmse, K.; Kummer, M.; Kovalchuk, Y.; Witte, O.W.; Garaschuk, O.; Holthoff, K. GABA depolarizes immature neurons and inhibits network activity in the neonatal neocortex in vivo. Nat. Comm. 2015, 6. [Google Scholar] [CrossRef] [Green Version]
- Okuno, H. Regulation and function of immediate-early genes in the brain: Beyond neuronal activity markers. Neurosci. Res. 2011, 69, 175–186. [Google Scholar] [CrossRef]
- Park, S.; Koppes, R.A.; Froriep, U.P.; Jia, X.; Achyuta, A.K.; McLaughlin, B.L.; Anikeeva, P. Optogenetic control of nerve growth. Sci. Rep. 2015, 5, 9669. [Google Scholar] [CrossRef] [PubMed] [Green Version]
- Tao, X.; West, A.E.; Chen, W.G.; Corfas, G.; Greenberg, M.E. A calcium-responsive transcription factor, CaRF, that regulates neuronal activity-dependent expression of BDNF. Neuron 2002, 33, 383–395. [Google Scholar] [CrossRef] [Green Version]
- Brigadski, T.; Leßmann, V. The physiology of regulated BDNF release. Cell Tissue Res. 2020, 382, 15–45. [Google Scholar] [CrossRef]
- Chen, S.D.; Wu, C.L.; Hwang, W.C.; Yang, D.I. More insight into BDNF against neurodegeneration: Anti-apoptosis, anti-oxidation, and suppression of autophagy. Int. J. Mol. Sci. 2017, 18, 545. [Google Scholar] [CrossRef] [Green Version]
- Antonsson, B.; Conti, F.; Ciavatta, A.; Montessuit, S.; Lewis, S.; Martinou, I.; Bernasconi, L.; Bernard, A.; Mermod, J.J.; Mazzei, G.; et al. Inhibition of bax channel-forming activity by Bcl-2. Science 1997, 277, 370–372. [Google Scholar] [CrossRef]
- Akhtar, R.S.; Ness, J.M.; Roth, K.A. Bcl-2 family regulation of neuronal development and neurodegeneration. Biochim. Biophys. Acta 2004, 1644, 189–203. [Google Scholar] [CrossRef] [PubMed]
- Kole, A.J.; Annis, R.P.; Deshmukh, M. Mature neurons: Equipped for survival. Cell Death Dis. 2013, 4, e689. [Google Scholar] [CrossRef] [PubMed] [Green Version]
- Ter Horst, H.J.; Sommer, C.; Bergman, K.A.; Fock, J.M.; van Weerden, T.W.; Bos, A.F. Prognostic significance of amplitude-integrated EEG during the first 72 hours after birth in severely asphyxiated neonates. Pediatr. Res. 2004, 55, 1026–1033. [Google Scholar] [CrossRef] [PubMed] [Green Version]
- Iyer, K.K.; Roberts, J.A.; Hellström-Westas, L.; Wikström, S.; Hansen Pupp, I.; Ley, D.; Vanhatalo, S.; Breakspear, M. Cortical burst dynamics predict clinical outcome early in extremely preterm infants. Brain 2015, 138, 2206–2218. [Google Scholar] [CrossRef] [Green Version]
- Legéndy, C.R.; Salcman, M. Bursts and recurrences of bursts in the spike trains of spontaneously active striate cortex neurons. J. Neurophysiol. 1985, 53, 926–939. [Google Scholar] [CrossRef]
- Pfaffl, M.W. A new mathematical model for relative quantification in real-time RT-PCR. Nucleic Acids Res. 2001, 29, e45. [Google Scholar] [CrossRef] [PubMed]


Publisher’s Note: MDPI stays neutral with regard to jurisdictional claims in published maps and institutional affiliations. |
© 2021 by the authors. Licensee MDPI, Basel, Switzerland. This article is an open access article distributed under the terms and conditions of the Creative Commons Attribution (CC BY) license (https://creativecommons.org/licenses/by/4.0/).
Share and Cite
Wong Fong Sang, I.E.; Schroer, J.; Halbhuber, L.; Warm, D.; Yang, J.-W.; Luhmann, H.J.; Kilb, W.; Sinning, A. Optogenetically Controlled Activity Pattern Determines Survival Rate of Developing Neocortical Neurons. Int. J. Mol. Sci. 2021, 22, 6575. https://0-doi-org.brum.beds.ac.uk/10.3390/ijms22126575
Wong Fong Sang IE, Schroer J, Halbhuber L, Warm D, Yang J-W, Luhmann HJ, Kilb W, Sinning A. Optogenetically Controlled Activity Pattern Determines Survival Rate of Developing Neocortical Neurons. International Journal of Molecular Sciences. 2021; 22(12):6575. https://0-doi-org.brum.beds.ac.uk/10.3390/ijms22126575
Chicago/Turabian StyleWong Fong Sang, I. Emeline, Jonas Schroer, Lisa Halbhuber, Davide Warm, Jenq-Wei Yang, Heiko J. Luhmann, Werner Kilb, and Anne Sinning. 2021. "Optogenetically Controlled Activity Pattern Determines Survival Rate of Developing Neocortical Neurons" International Journal of Molecular Sciences 22, no. 12: 6575. https://0-doi-org.brum.beds.ac.uk/10.3390/ijms22126575